Download - Organisation
Februari 2012 1
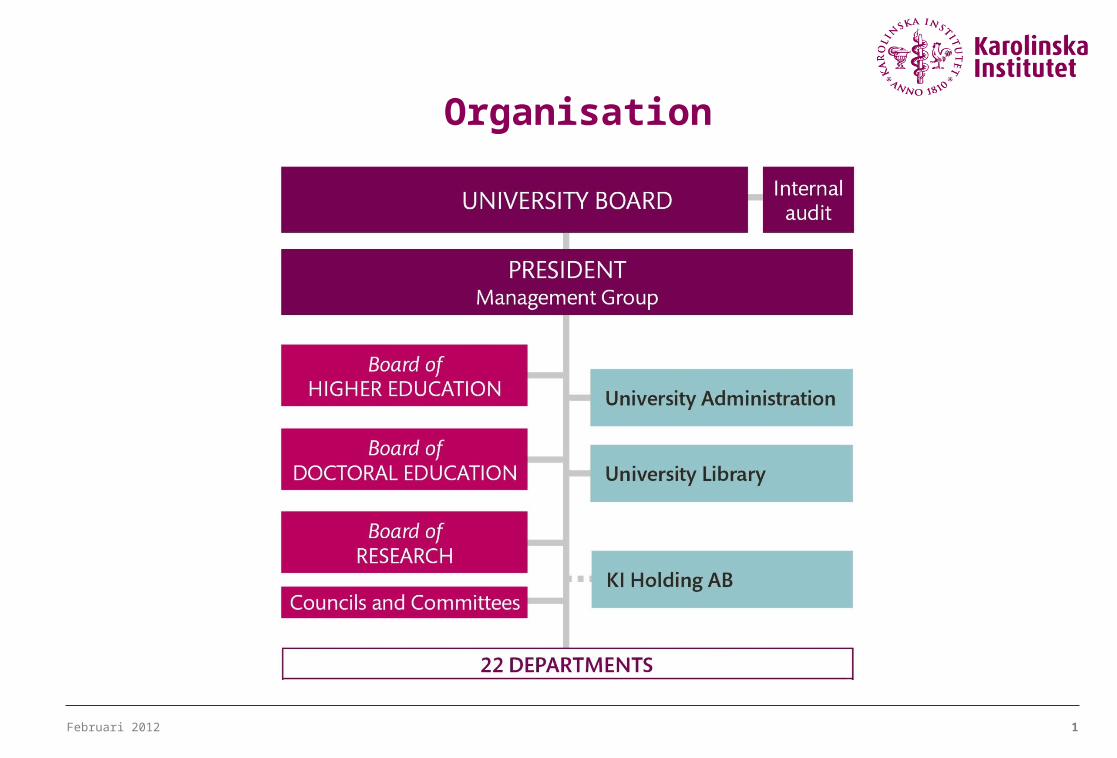
Organisation
22
Februari 2012 2
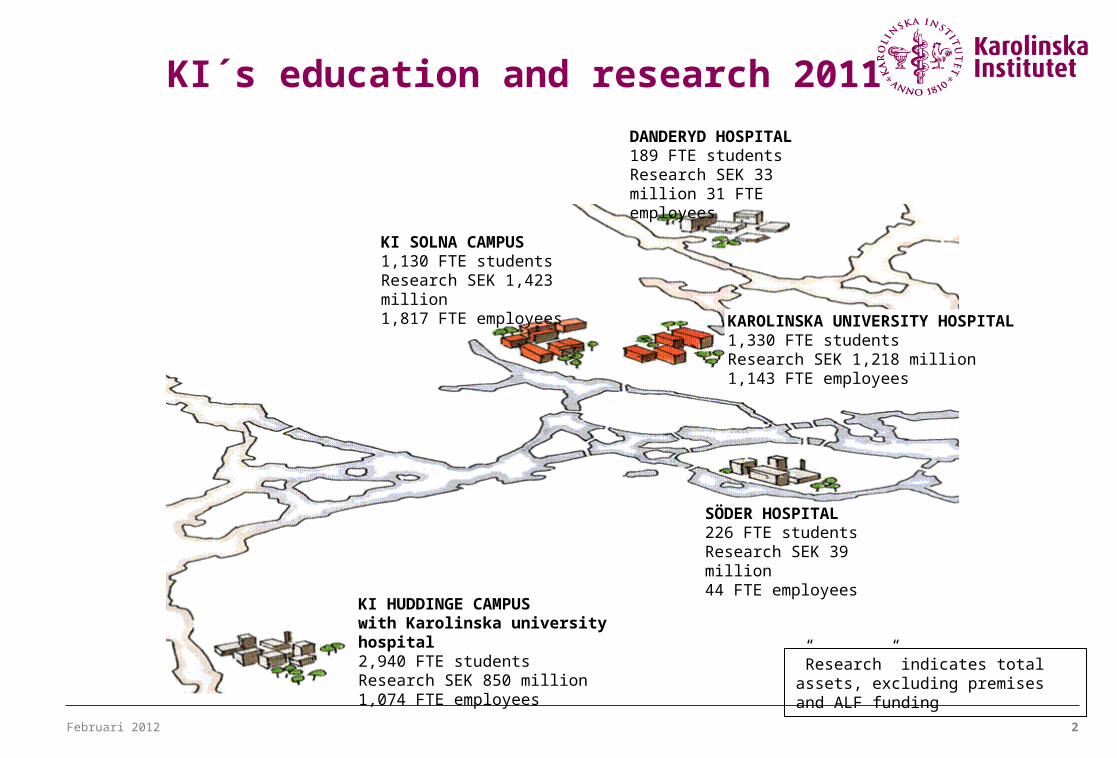
KI´s education and research 2011
22
DANDERYD HOSPITAL189 FTE studentsResearch SEK 33 million 31 FTE employees
KAROLINSKA UNIVERSITY HOSPITAL1,330 FTE studentsResearch SEK 1,218 million 1,143 FTE employees
KI SOLNA CAMPUS 1,130 FTE studentsResearch SEK 1,423 million1,817 FTE employees
SÖDER HOSPITAL226 FTE studentsResearch SEK 39 million 44 FTE employees
KI HUDDINGE CAMPUSwith Karolinska university hospital2,940 FTE studentsResearch SEK 850 million 1,074 FTE employees
”Research” indicates total assets, excluding premises and ALF funding
Februari 2012 3
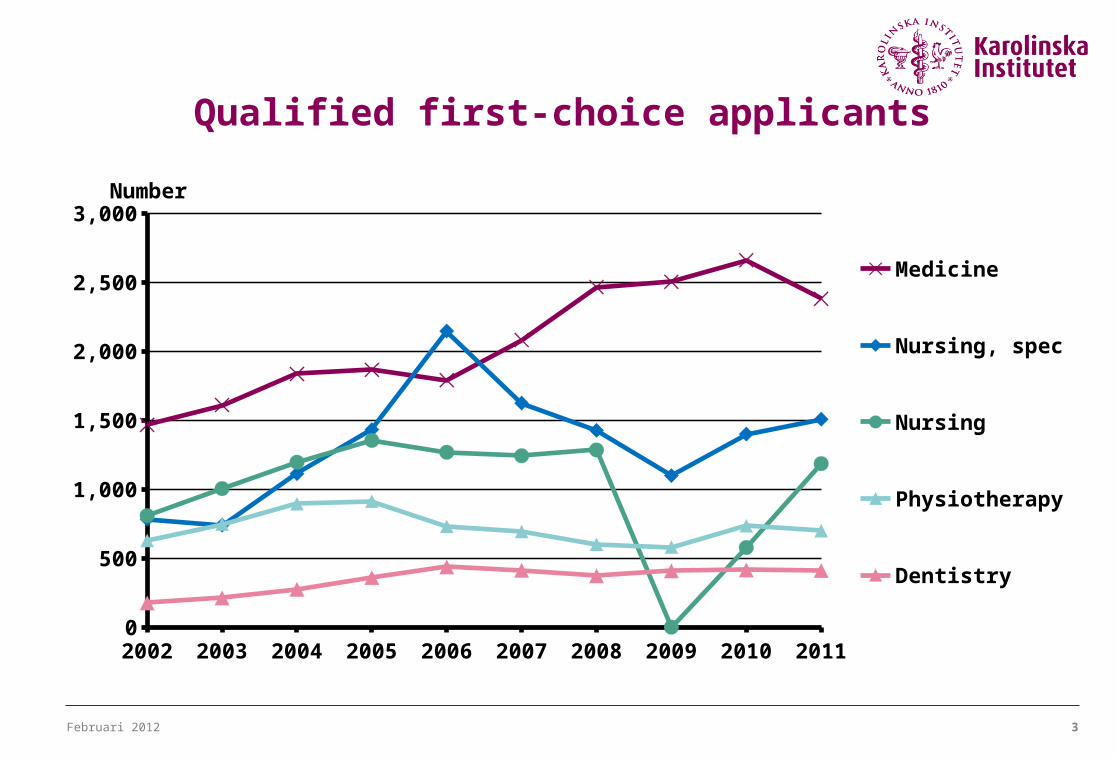
Qualified first-choice applicants
2002 2003 2004 2005 2006 2007 2008 2009 2010 20110
500
1,000
1,500
2,000
2,500
3,000
Medicine
Nursing, spec
Nursing
Physiotherapy
Dentistry
Number
Februari 2012 4
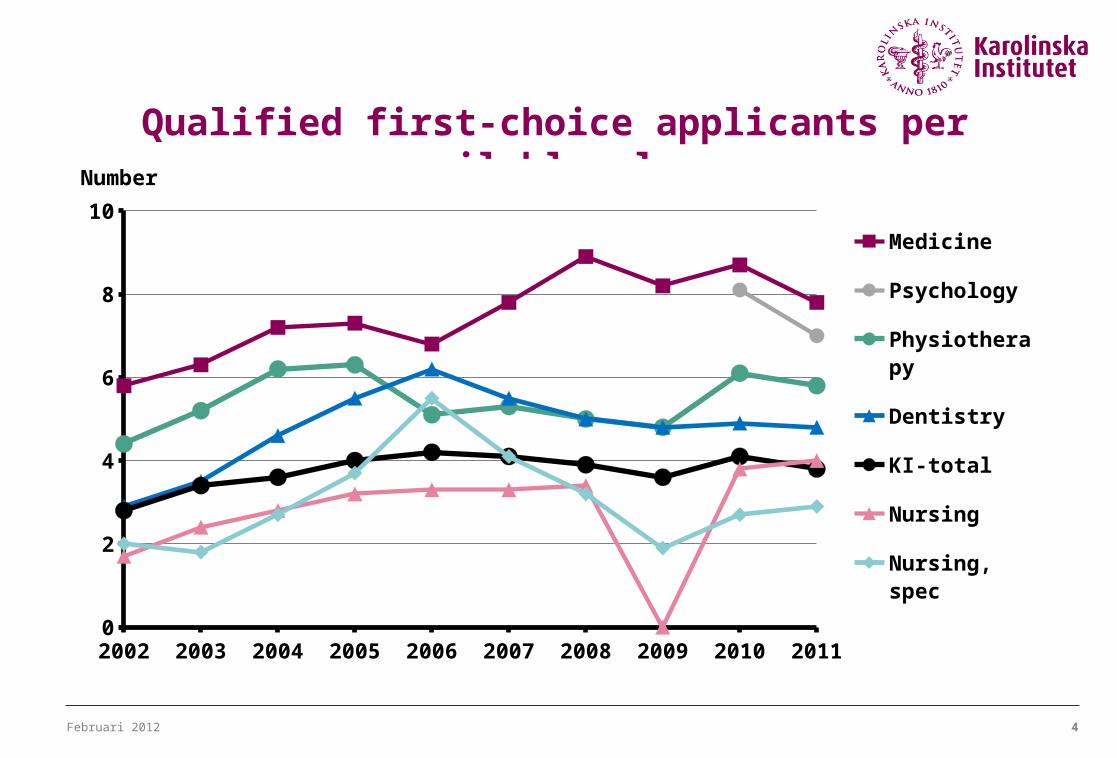
Qualified first-choice applicants per available place
2002 2003 2004 2005 2006 2007 2008 2009 2010 20110
2
4
6
8
10
Medicine
Psychology
Physiotherapy
Dentistry
KI-total
Nursing
Nursing, spec
Number
Februari 2012 5
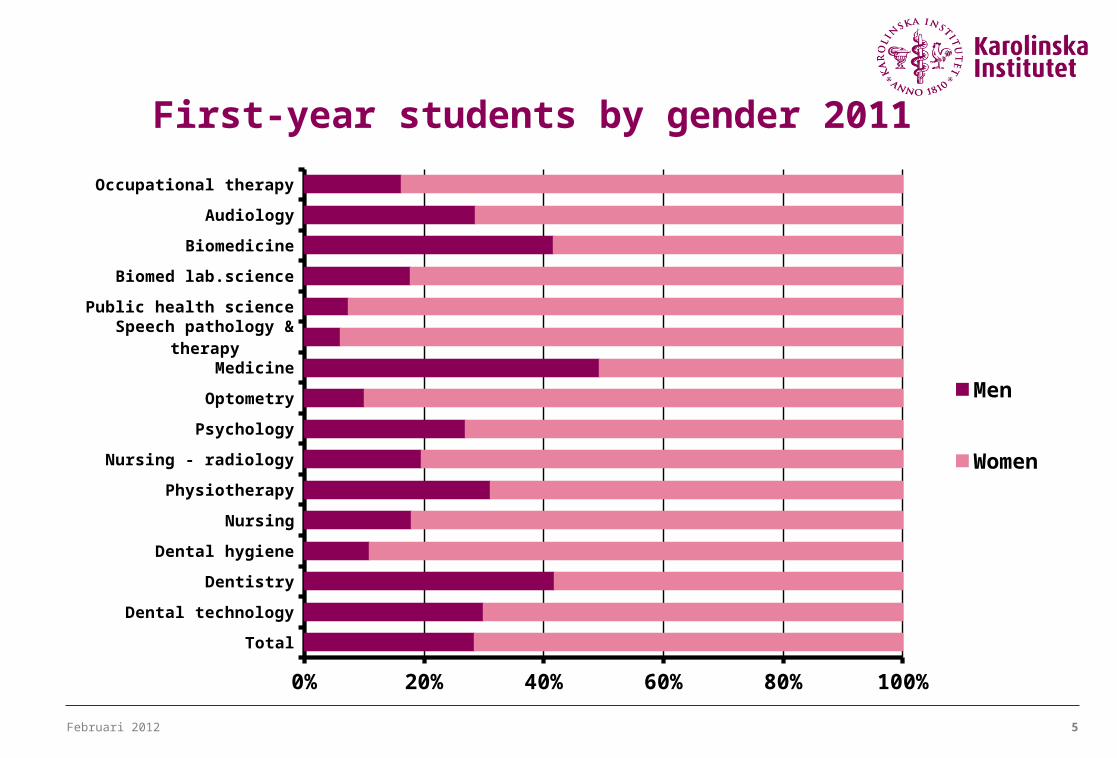
First-year students by gender 2011
Total
Dental technology
Dentistry
Dental hygiene
Nursing
Physiotherapy
Nursing - radiology
Psychology
Optometry
Medicine
Speech pathology & therapy
Public health science
Biomed lab.science
Biomedicine
Audiology
Occupational therapy
0% 20% 40% 60% 80% 100%
Men
Women
Februari 2012 6
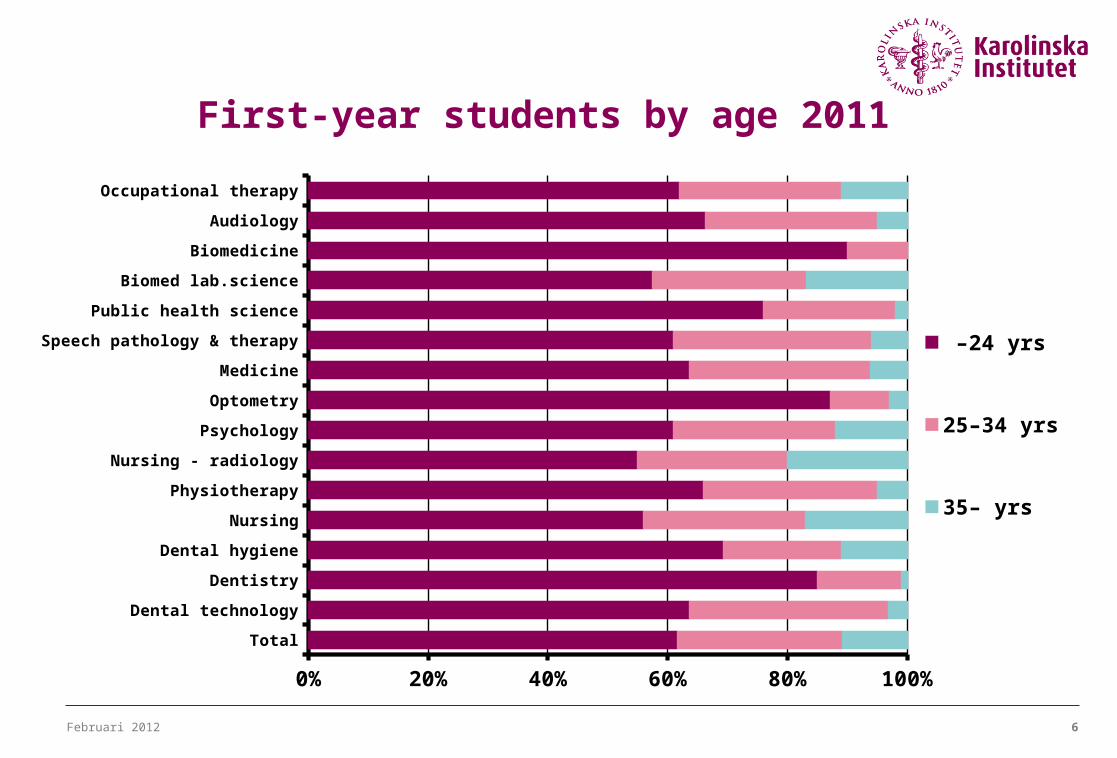
First-year students by age 2011
Total
Dental technology
Dentistry
Dental hygiene
Nursing
Physiotherapy
Nursing - radiology
Psychology
Optometry
Medicine
Speech pathology & therapy
Public health science
Biomed lab.science
Biomedicine
Audiology
Occupational therapy
0% 20% 40% 60% 80% 100%
–24 yrs
25–34 yrs
35– yrs

Februari 2012 7
Full time equivalent students in 2011total: 5,815 (2010: 5,524)
Medicine; 26%
Physiotherapy; 6%
Psychology; 4%
Dentistry; 7%
Occupational therapy; 4%
Biomed lab.science; 3%
Nursing, incl radio; 10%
Other programmes; 11%
Nursing spec; 8%
Other continuation programmes; 2%
Master's (one year & two year); 7%
Single-subject courses; 12%
Februari 2012 8
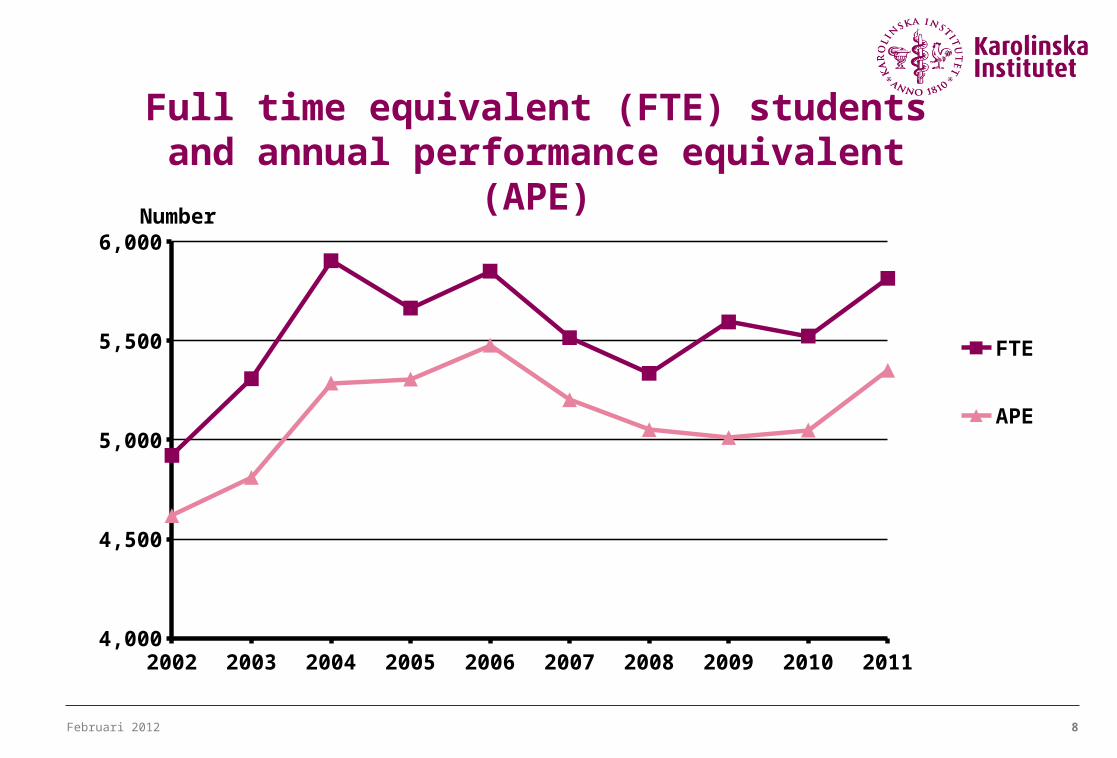
Full time equivalent (FTE) students and annual performance equivalent (APE)
2002 2003 2004 2005 2006 2007 2008 2009 2010 20114,000
4,500
5,000
5,500
6,000
FTE
APE
Number
Februari 2012 9
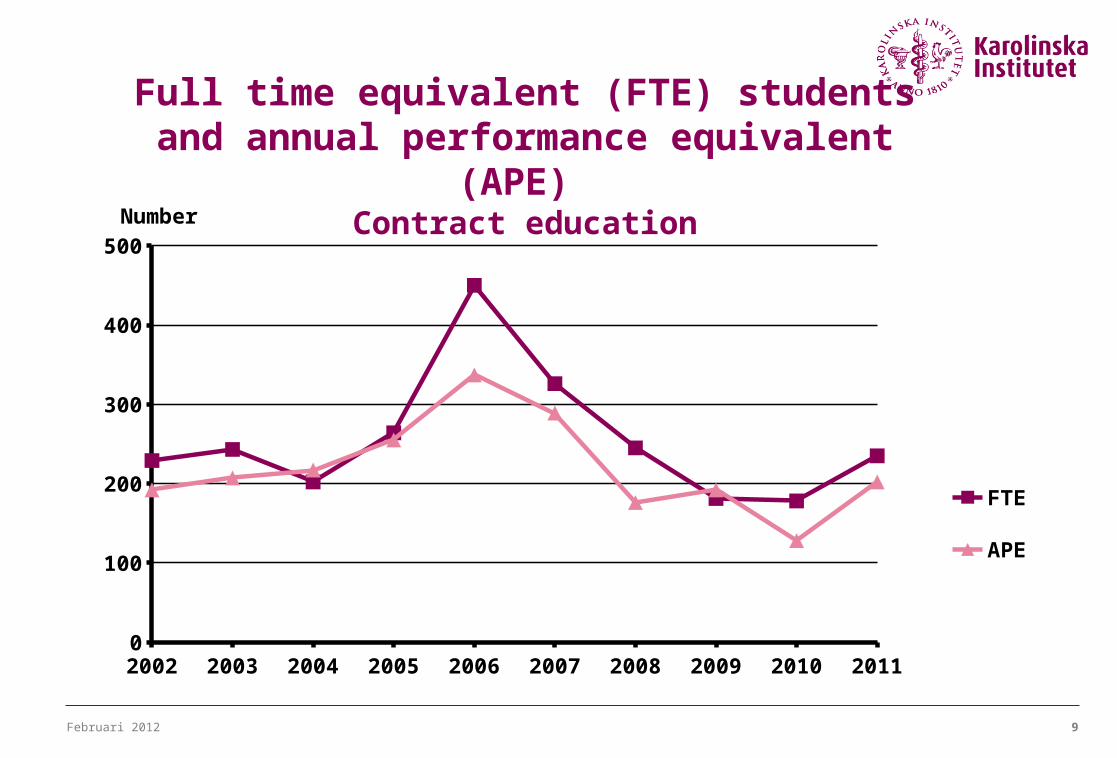
Full time equivalent (FTE) students and annual performance equivalent (APE)
Contract education
2002 2003 2004 2005 2006 2007 2008 2009 2010 20110
100
200
300
400
500
FTE
APE
Number
Februari 2012 10
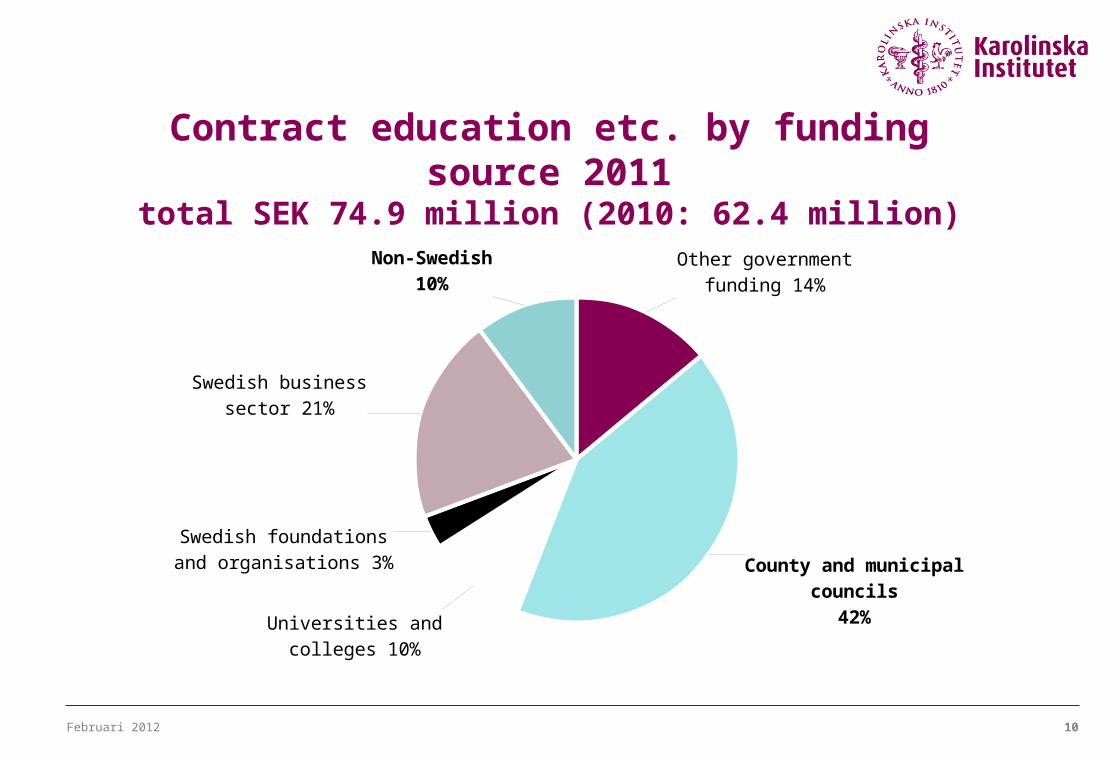
Contract education etc. by funding source 2011total SEK 74.9 million (2010: 62.4 million)
Other government funding 14%
County and municipal councils
42%Universities and colleges
10%
Swedish foundations and organisations 3%
Swedish business sector 21%
Non-Swedish10%
Februari 2012 11
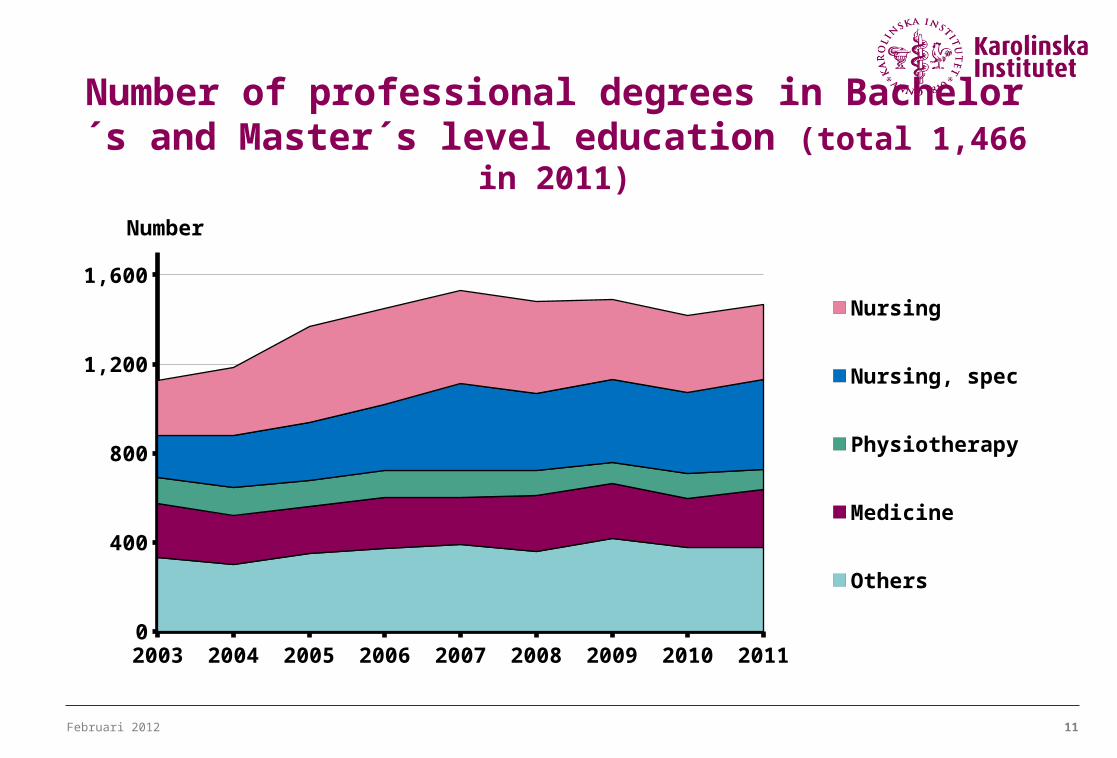
Number of professional degrees in Bachelor´s and Master´s level education (total 1,466 in 2011)
2003 2004 2005 2006 2007 2008 2009 2010 20110
400
800
1,200
1,600
Nursing
Nursing, spec
Physiotherapy
Medicine
Others
Number
Februari 2012 12
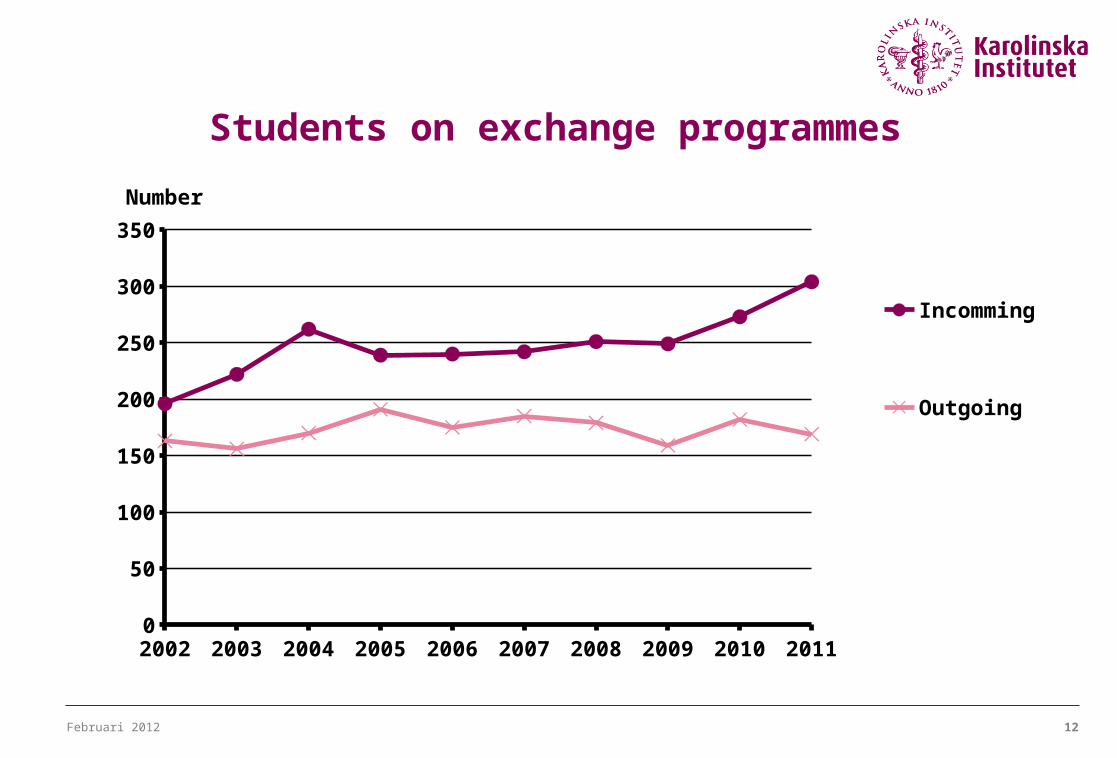
Students on exchange programmes
2002 2003 2004 2005 2006 2007 2008 2009 2010 20110
50
100
150
200
250
300
350
Incomming
Outgoing
Number
Februari 2012 13
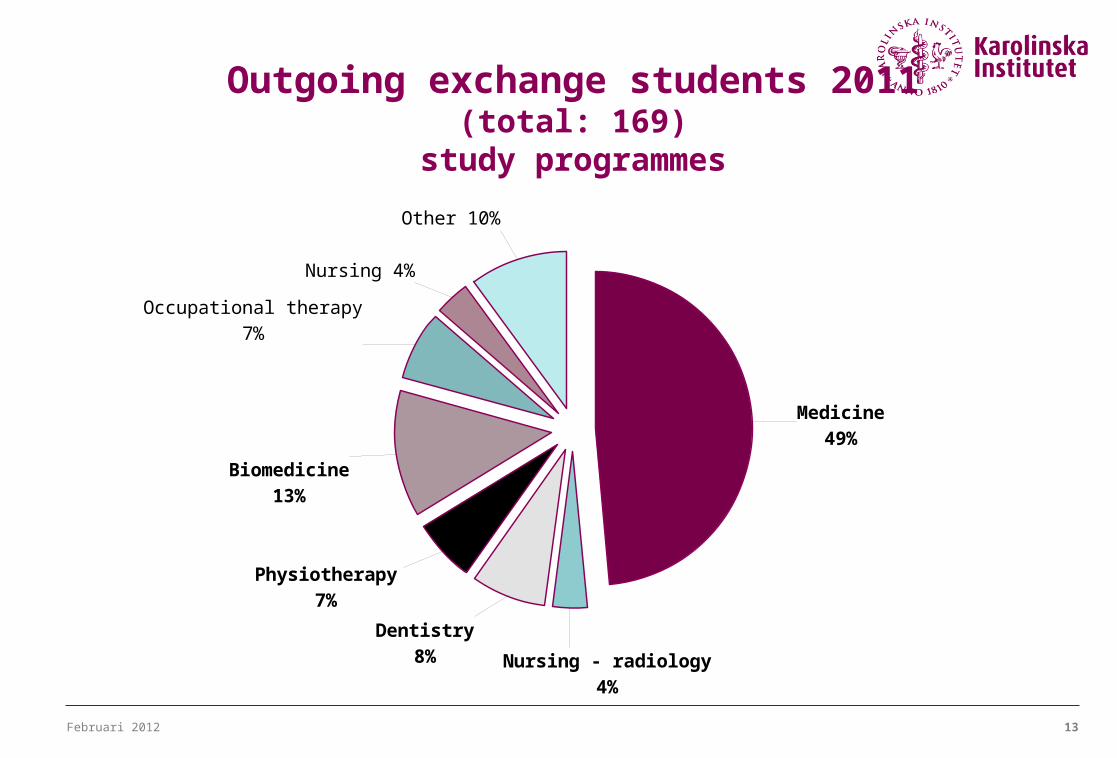
Medicine49%
Nursing - radiology4%
Dentistry8%
Physiotherapy7%
Biomedicine13%
Occupational therapy 7%
Nursing 4%
Other 10%
Outgoing exchange students 2011 (total: 169)study programmes
Februari 2012 14
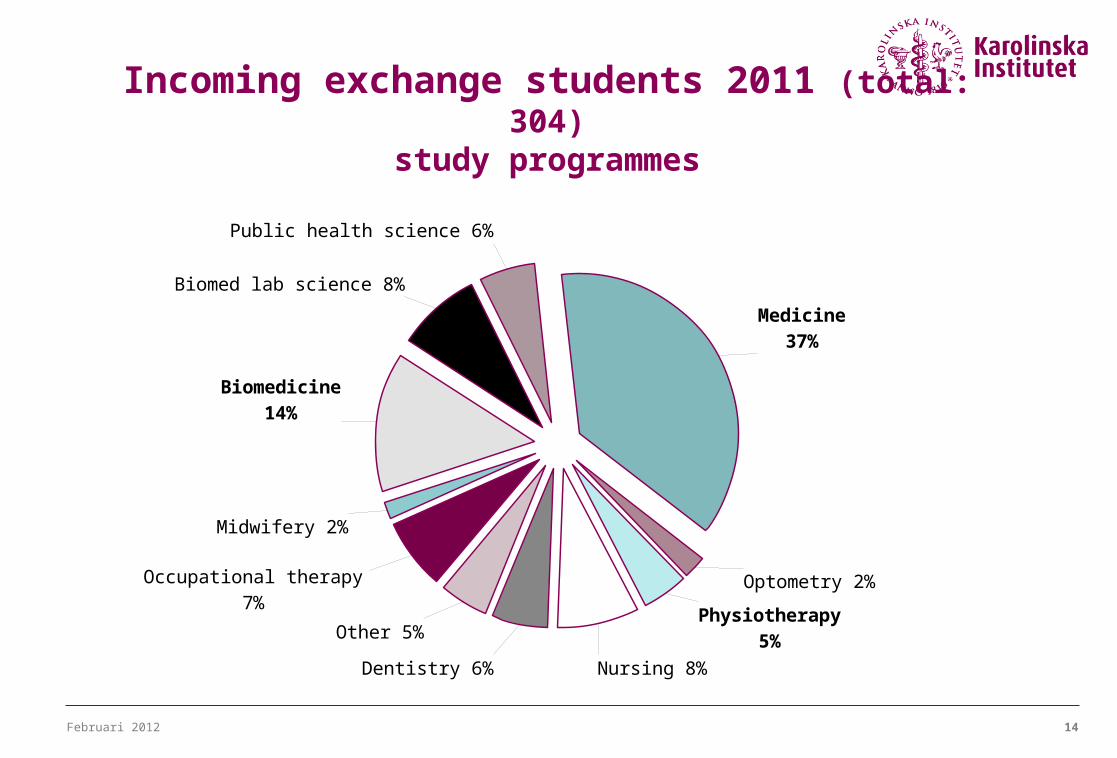
Occupational therapy 7%
Midwifery 2%
Biomedicine14%
Biomed lab science 8%
Public health science 6%
Medicine37%
Optometry 2%
Physiotherapy5%
Nursing 8%Dentistry 6%
Other 5%
Incoming exchange students 2011 (total: 304)study programmes

Februari 2012 15
Outgoing exchange students 2011 (total 169)
1
82
14
46
7
712
Februari 2012 16
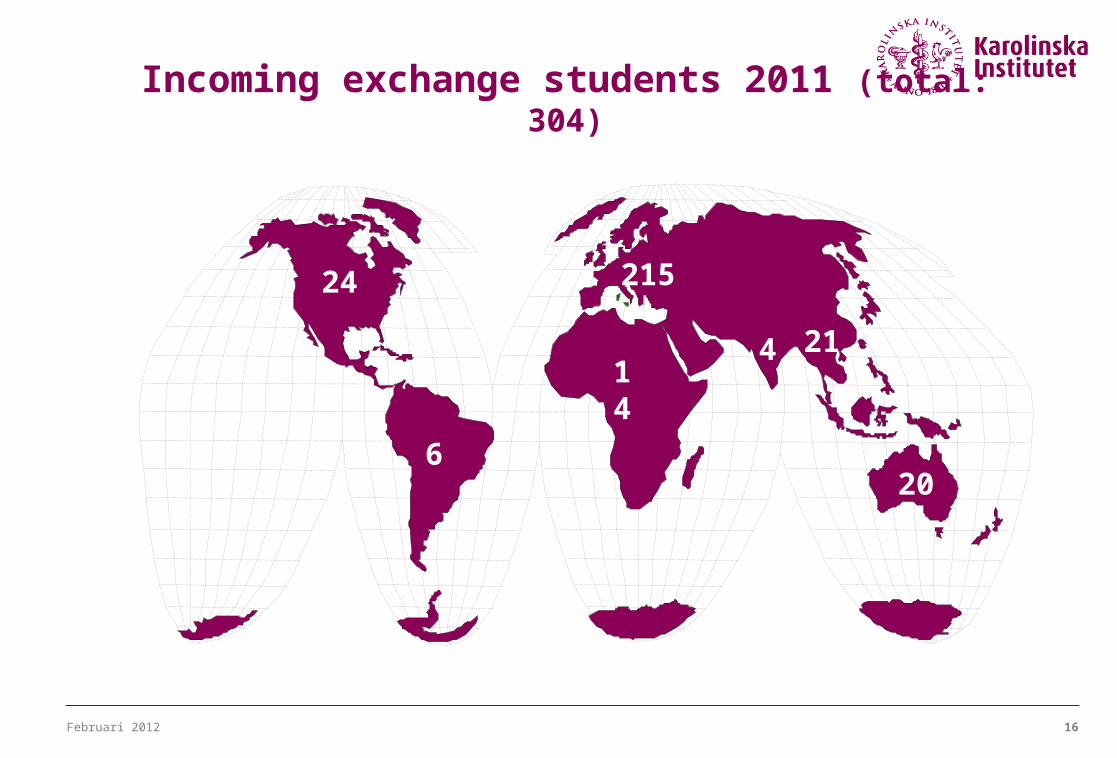
Incoming exchange students 2011 (total: 304)
4
215
20
24
6
1421
Februari 2012 17
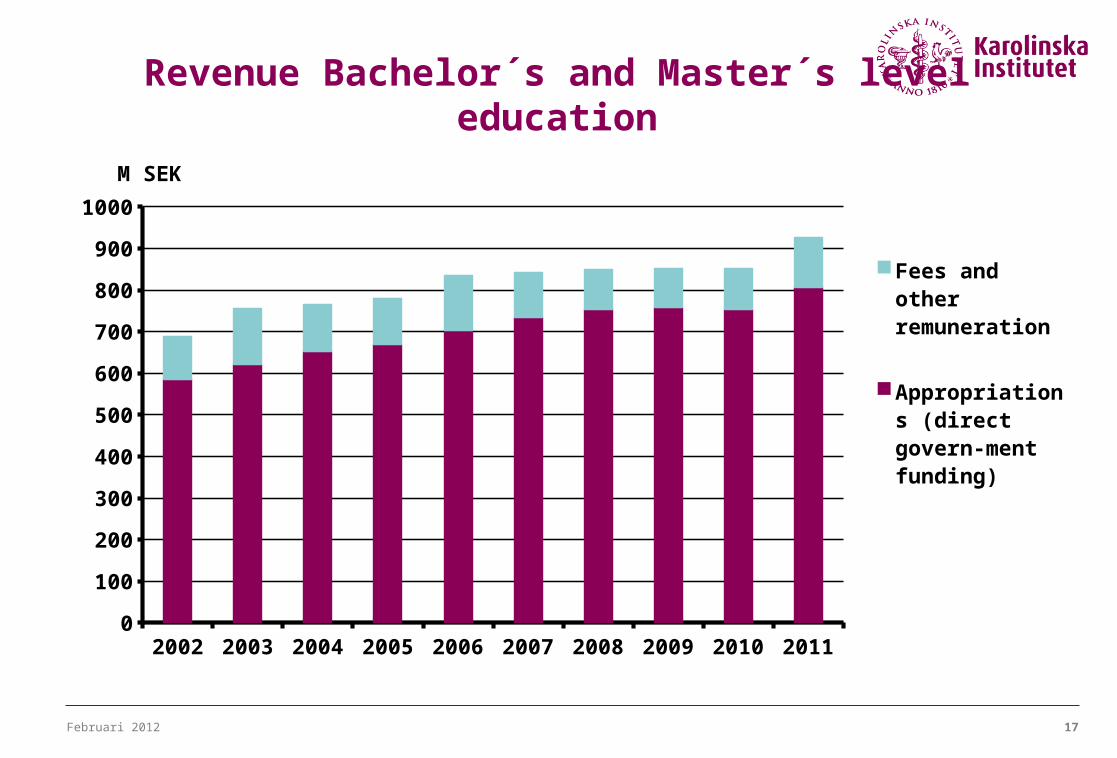
Revenue Bachelor´s and Master´s level education
2002 2003 2004 2005 2006 2007 2008 2009 2010 20110
100
200
300
400
500
600
700
800
900
1000
Fees and other remuneration
Appropriations (direct govern-ment funding)
M SEK
Februari 2012 18
2001 2002 2003 2004 2005 2006 2007 2008 2009 20100
500
1,000
1,500
2,000
2,500
3,000
3,500
4,000
4,500
5,000
5,500
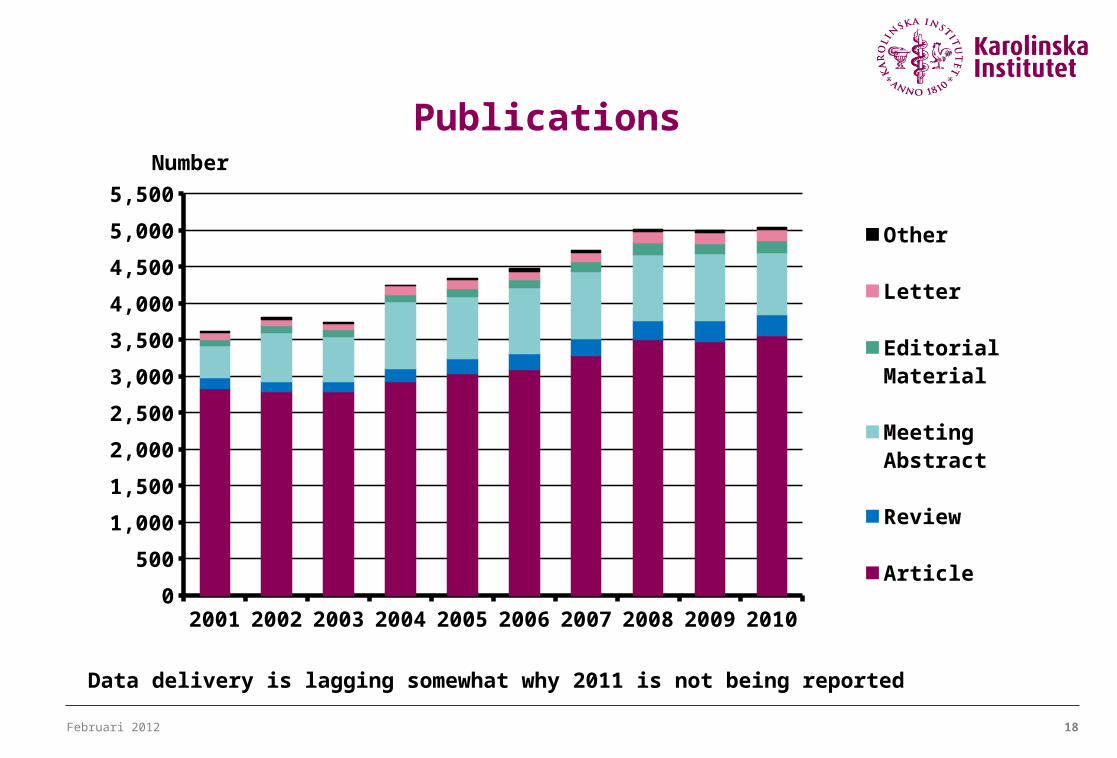
Other
Letter
Editorial Material
Meeting Abstract
Review
Article
Number
Publications
Data delivery is lagging somewhat why 2011 is not being reported
Februari 2012 19
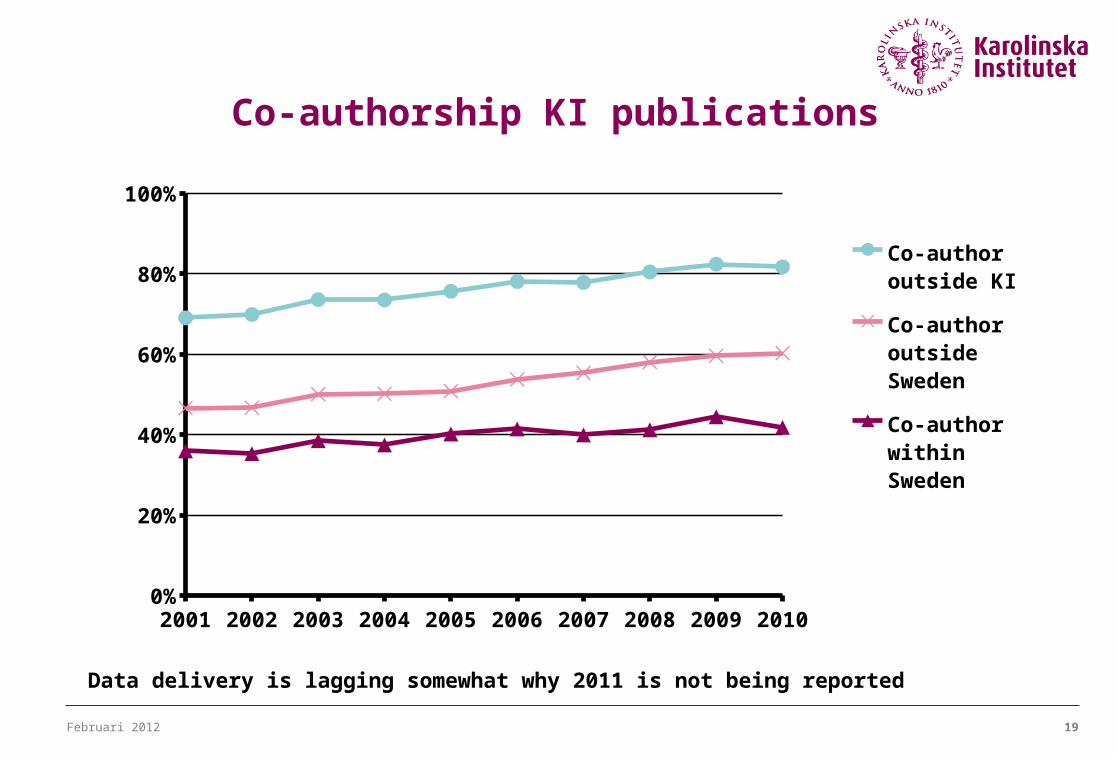
Co-authorship KI publications
2001 2002 2003 2004 2005 2006 2007 2008 2009 20100%
20%
40%
60%
80%
100%
Co-author outside KI
Co-author outside Sweden
Co-author within Sweden
Data delivery is lagging somewhat why 2011 is not being reported
Februari 2012 20
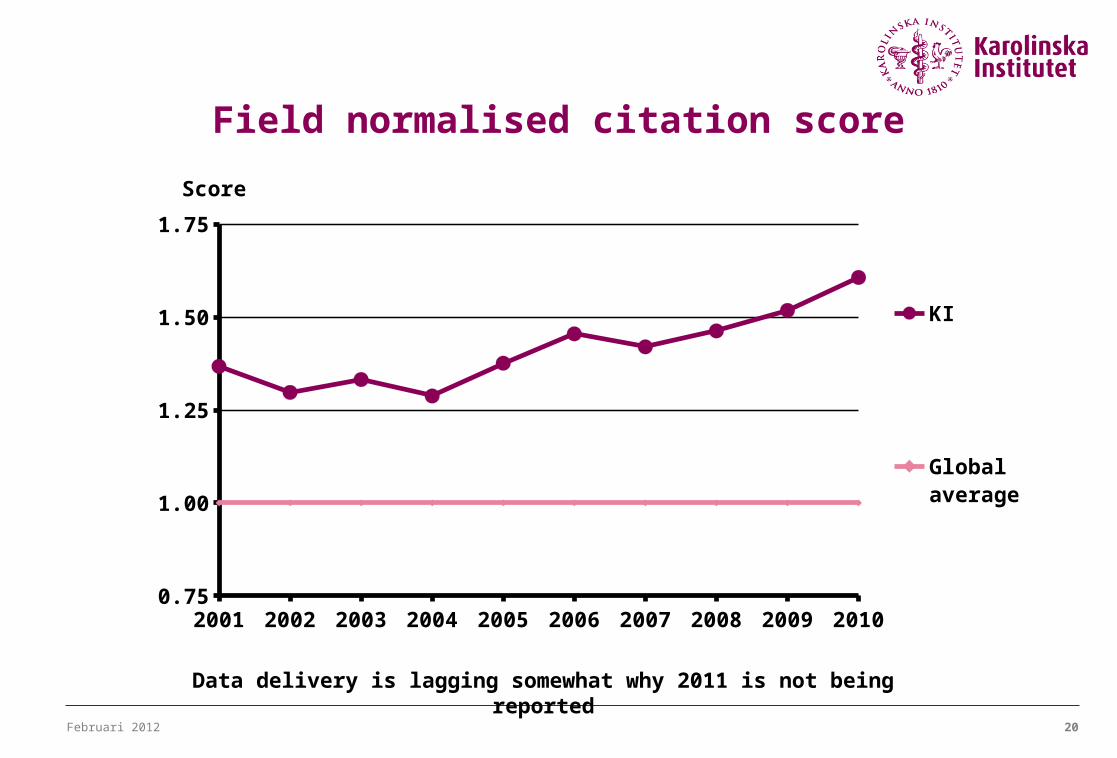
Field normalised citation score
2001 2002 2003 2004 2005 2006 2007 2008 2009 20100.75
1.00
1.25
1.50
1.75
KI
Global average
Score
Data delivery is lagging somewhat why 2011 is not being reported
Februari 2012 21
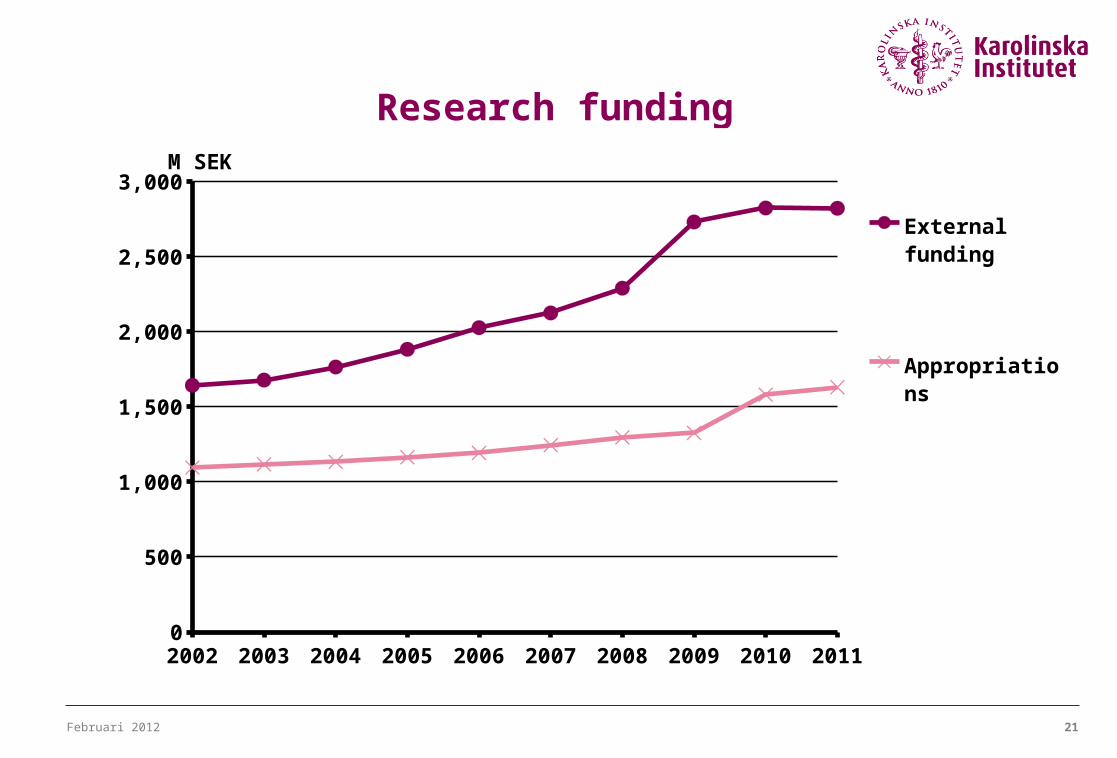
Research funding
2002 2003 2004 2005 2006 2007 2008 2009 2010 20110
500
1,000
1,500
2,000
2,500
3,000
External fund-ing
Appropriations
M SEK
Februari 2012 22
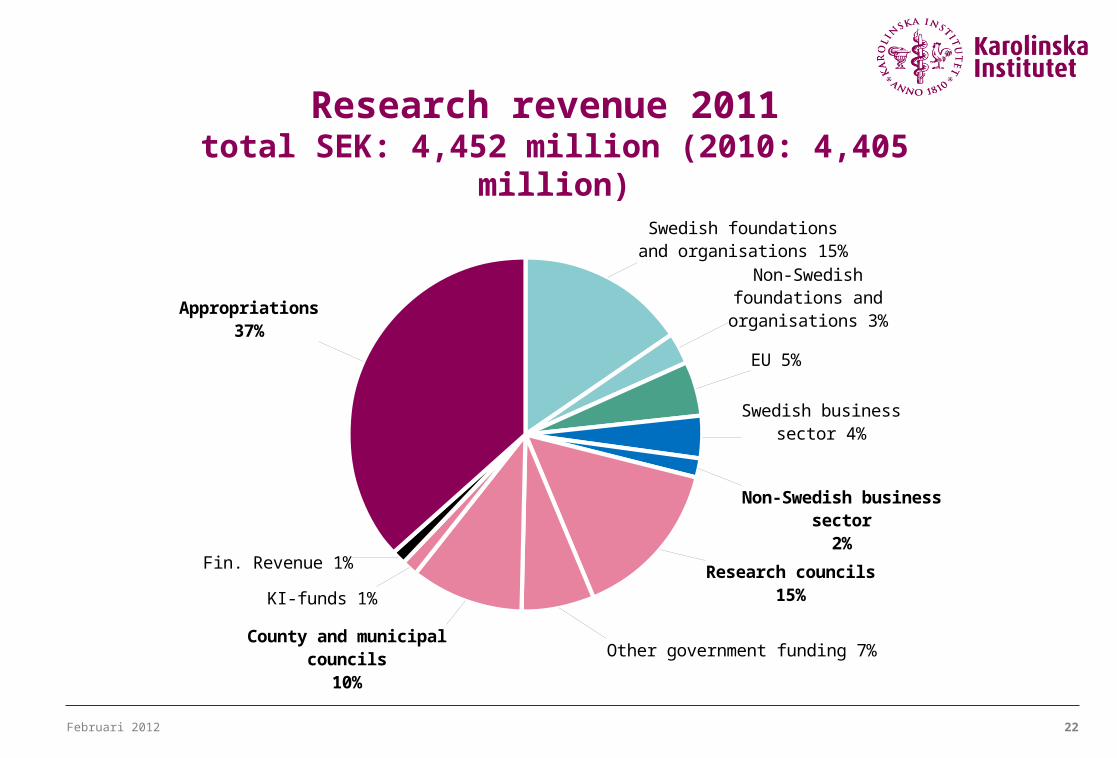
Research revenue 2011 total SEK: 4,452 million (2010: 4,405 million)
Swedish foundations and organisations 15%
Non-Swedish foundations and organisations 3%
EU 5%
Swedish business sector 4%
Non-Swedish business sector
2%
Research councils15%
Other government funding 7%County and municipal councils
10%
KI-funds 1%
Fin. Revenue 1%
Appropriations37%
Februari 2012 23
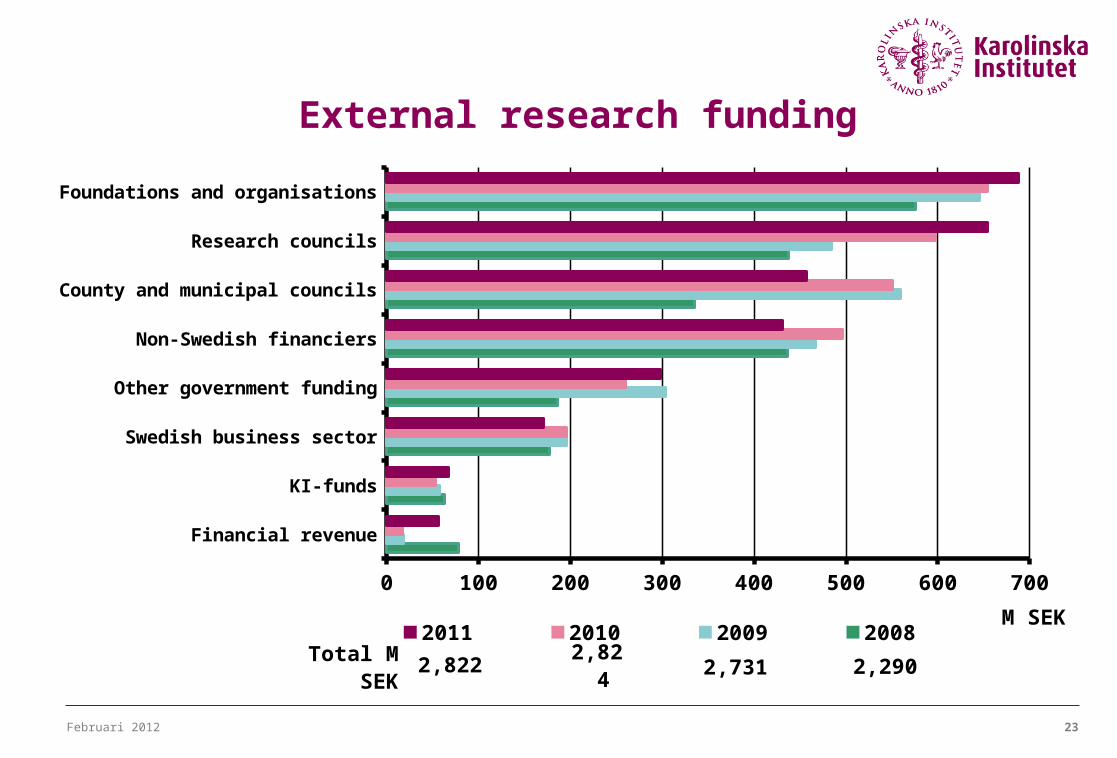
External research funding
Financial revenue
KI-funds
Swedish business sector
Other government funding
Non-Swedish financiers
County and municipal councils
Research councils
Foundations and organisations
0 100 200 300 400 500 600 700
2011 2010 2009 2008M SEK
Total M SEK 2,731 2,824 2,822 2,290
Februari 2012 24
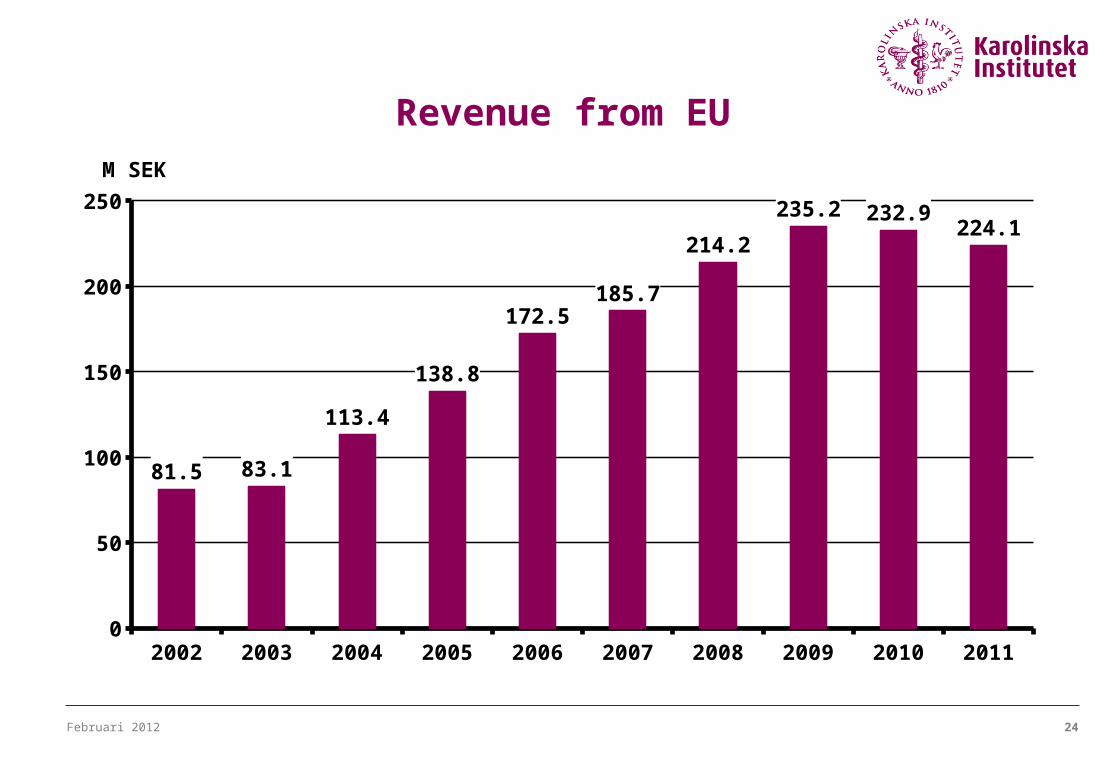
Revenue from EU
2002 2003 2004 2005 2006 2007 2008 2009 2010 20110
50
100
150
200
250
81.5 83.1
113.4
138.8
172.5185.7
214.2
235.2 232.9224.1
M SEK

Februari 2012 25
Revenue from American foundations and organisations
2004 2005 2006 2007 2008 2009 2010 20110
10
20
30
40
50
60
70
80
62.665.6
68.8
59.4 59.9
72.0 70.9
43.9
M SEK
Februari 2012 26
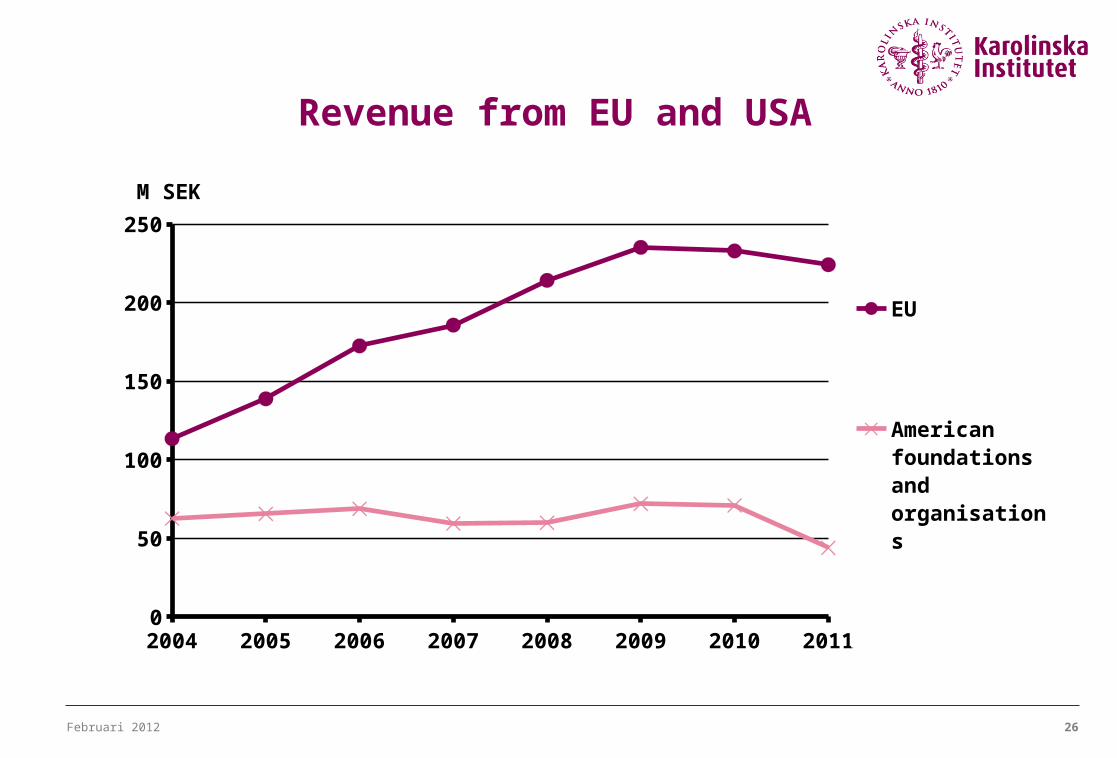
Revenue from EU and USA
2004 2005 2006 2007 2008 2009 2010 20110
50
100
150
200
250
EU
American foundations and organisa-tions
M SEK
Februari 2012 27
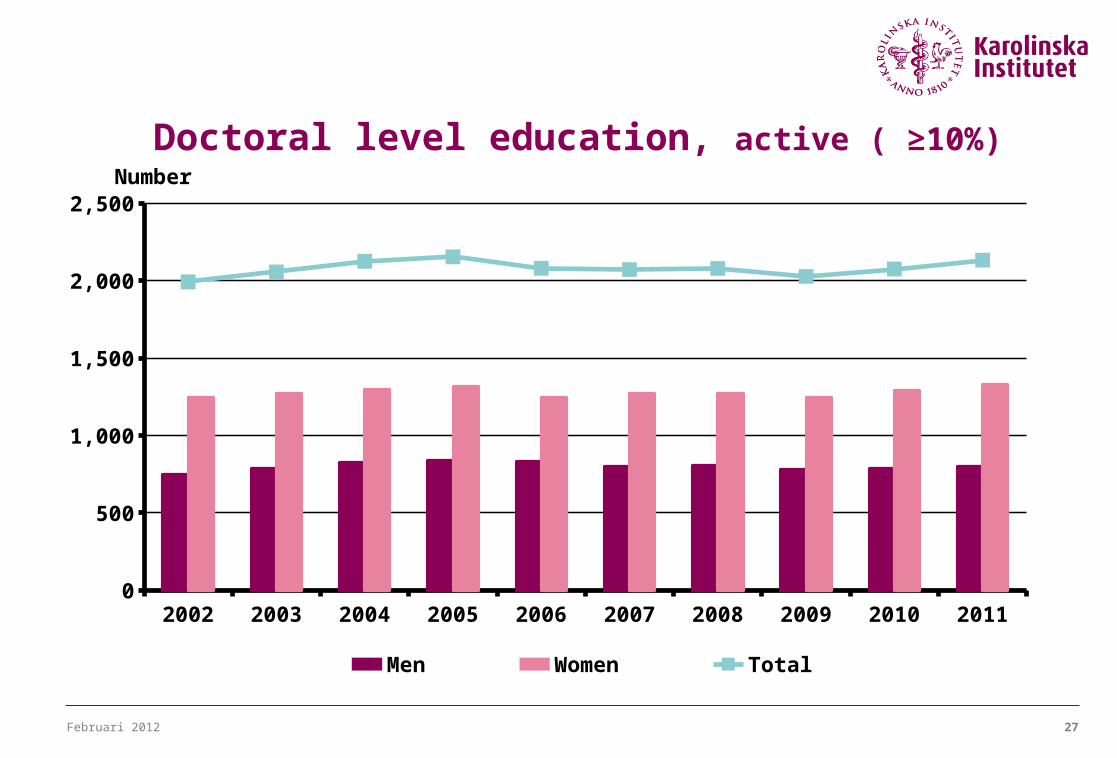
Doctoral level education, active ( ≥10%)
2002 2003 2004 2005 2006 2007 2008 2009 2010 20110
500
1,000
1,500
2,000
2,500
Men Women Total
Number
Februari 2012 28
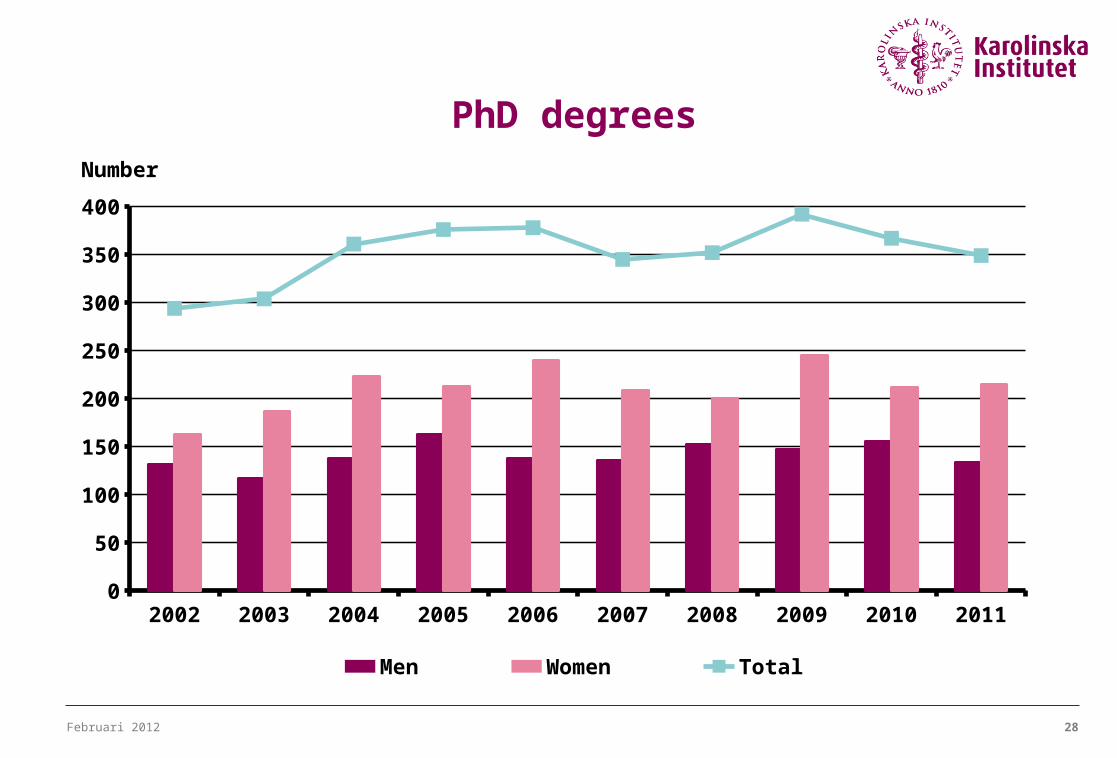
PhD degrees
2002 2003 2004 2005 2006 2007 2008 2009 2010 20110
50
100
150
200
250
300
350
400
Men Women Total
Number
Februari 2012 29
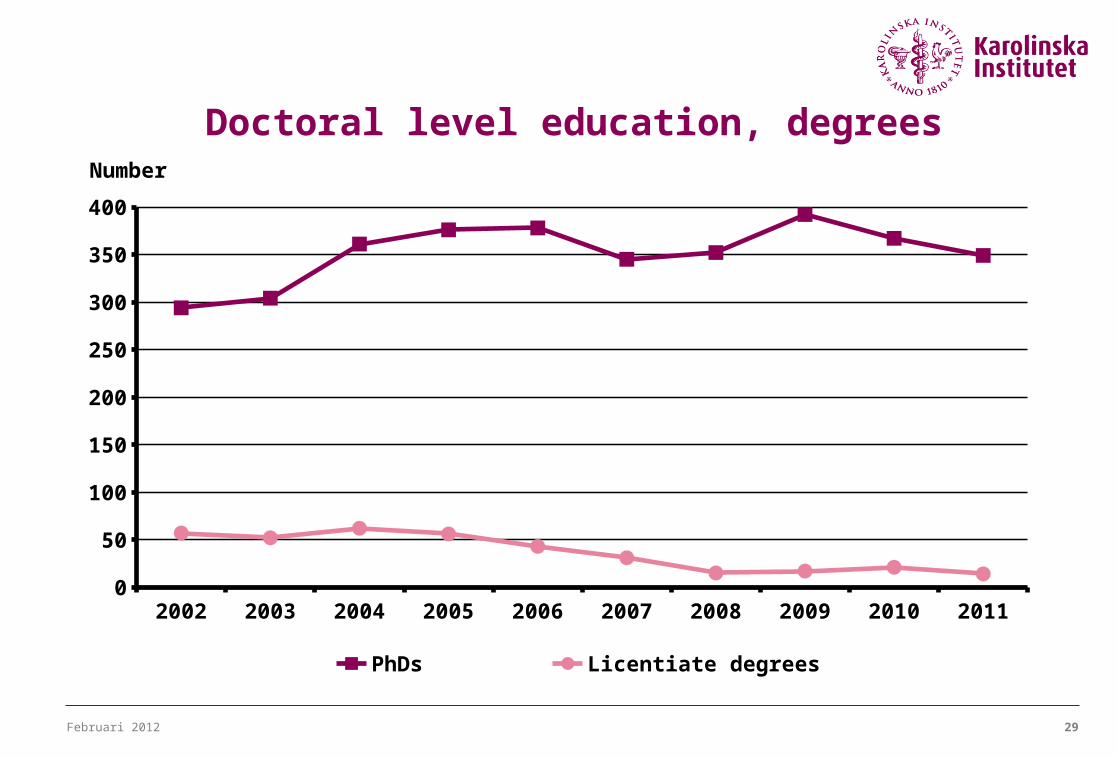
Doctoral level education, degrees
2002 2003 2004 2005 2006 2007 2008 2009 2010 20110
50
100
150
200
250
300
350
400
PhDs Licentiate degrees
Number
Februari 2012 30
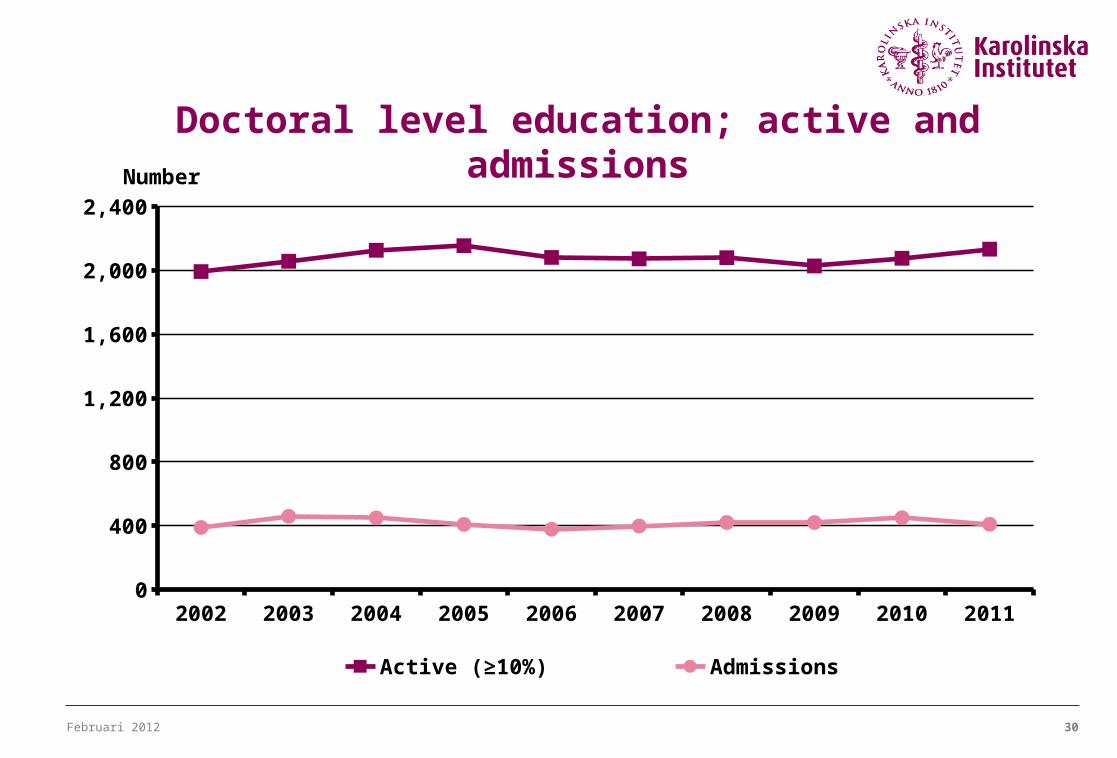
Doctoral level education; active and admissions
2002 2003 2004 2005 2006 2007 2008 2009 2010 20110
400
800
1,200
1,600
2,000
2,400
Active (≥10%) Admissions
Number
Februari 2012 31
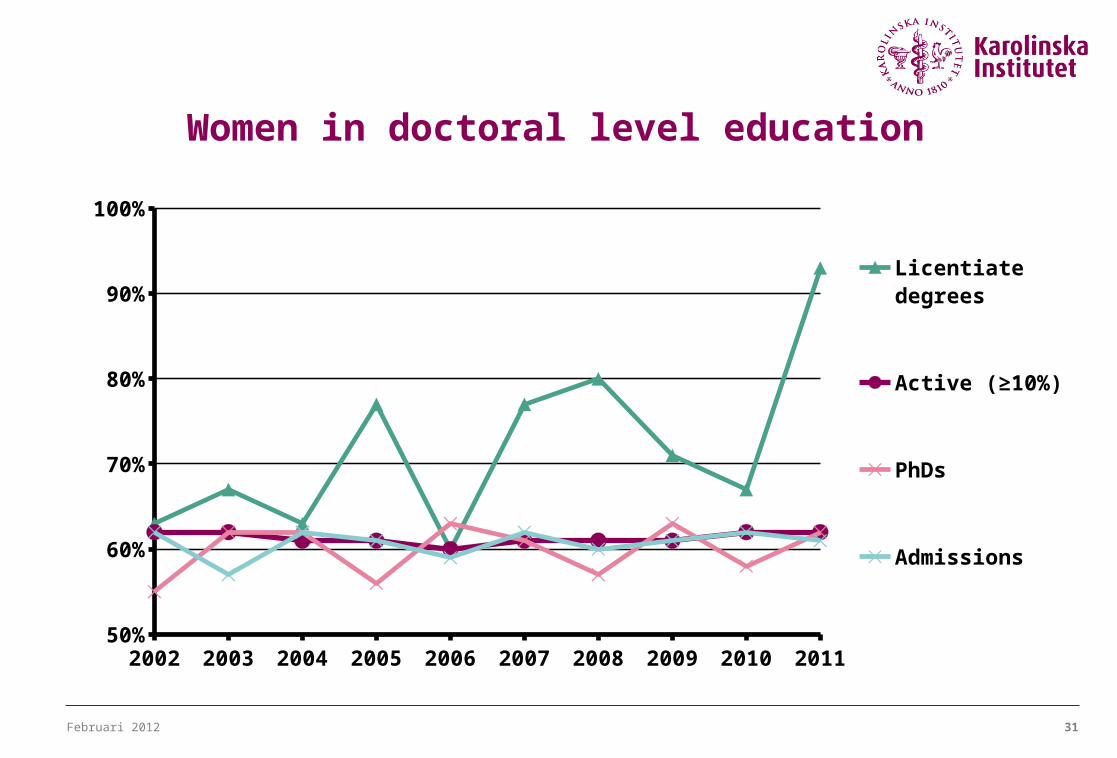
Women in doctoral level education
2002 2003 2004 2005 2006 2007 2008 2009 2010 201150%
60%
70%
80%
90%
100%
Licentiate degrees
Active (≥10%)
PhDs
Admissions
Februari 2012 32
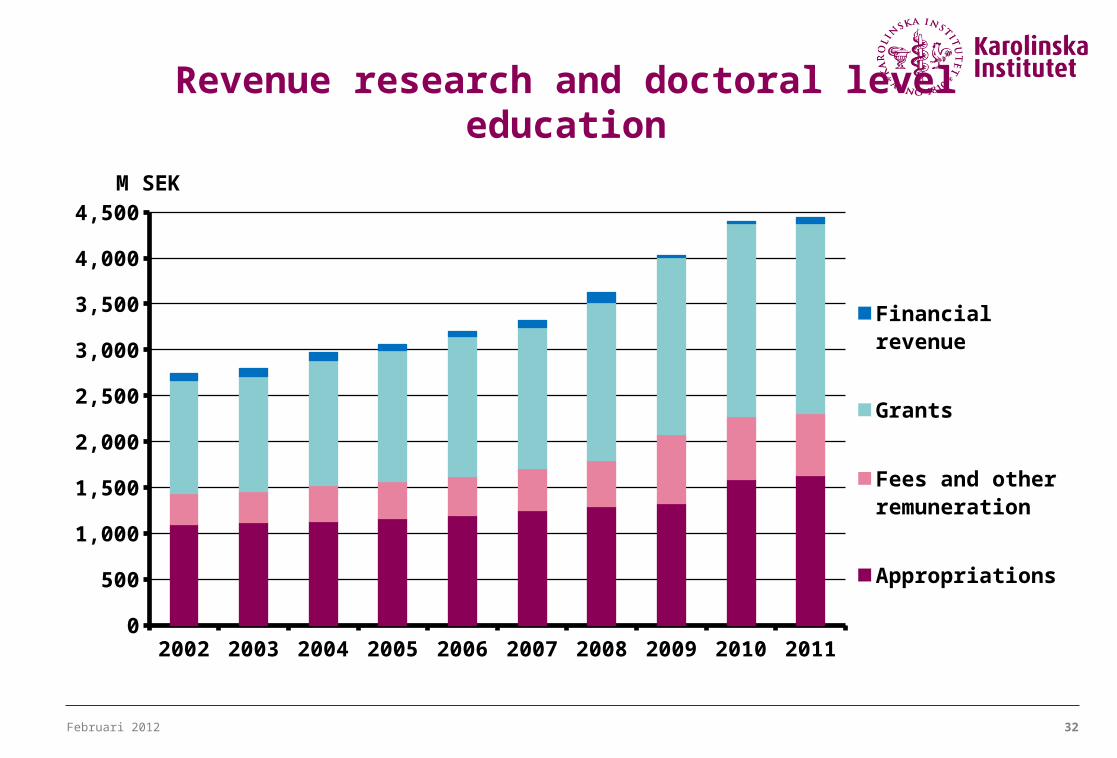
Revenue research and doctoral level education
2002 2003 2004 2005 2006 2007 2008 2009 2010 20110
500
1,000
1,500
2,000
2,500
3,000
3,500
4,000
4,500
Financial revenue
Grants
Fees and other remuneration
Appropriations
M SEK
Februari 2012 33
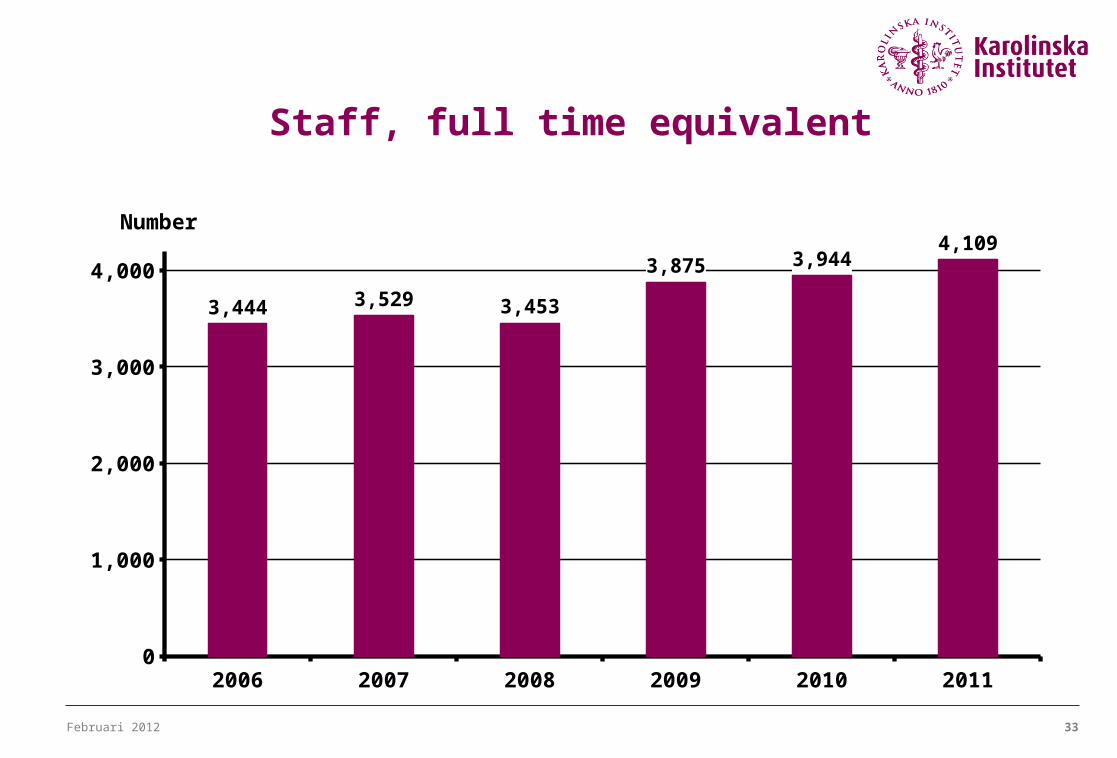
Staff, full time equivalent
2006 2007 2008 2009 2010 20110
1,000
2,000
3,000
4,000
3,444 3,529 3,453
3,875 3,9444,109
Number
Februari 2012 34
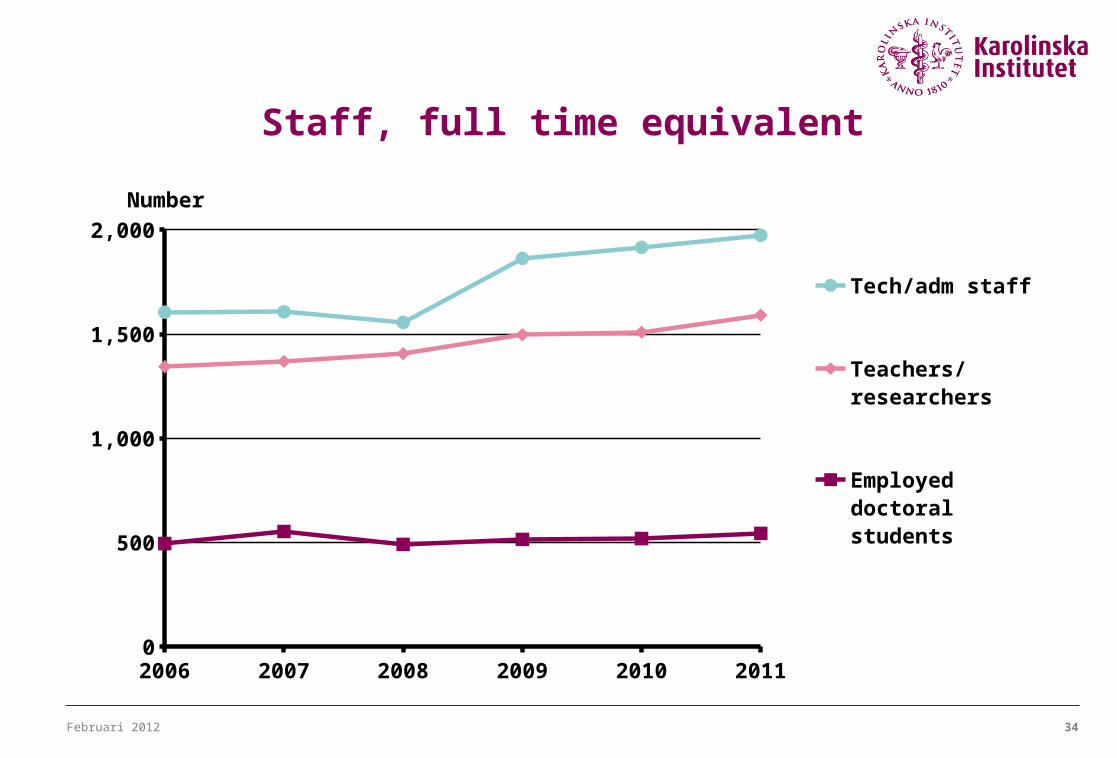
Staff, full time equivalent
2006 2007 2008 2009 2010 20110
500
1,000
1,500
2,000
Tech/adm staff
Teachers/ researchers
Employed doc-toral students
Number
Februari 2012 35
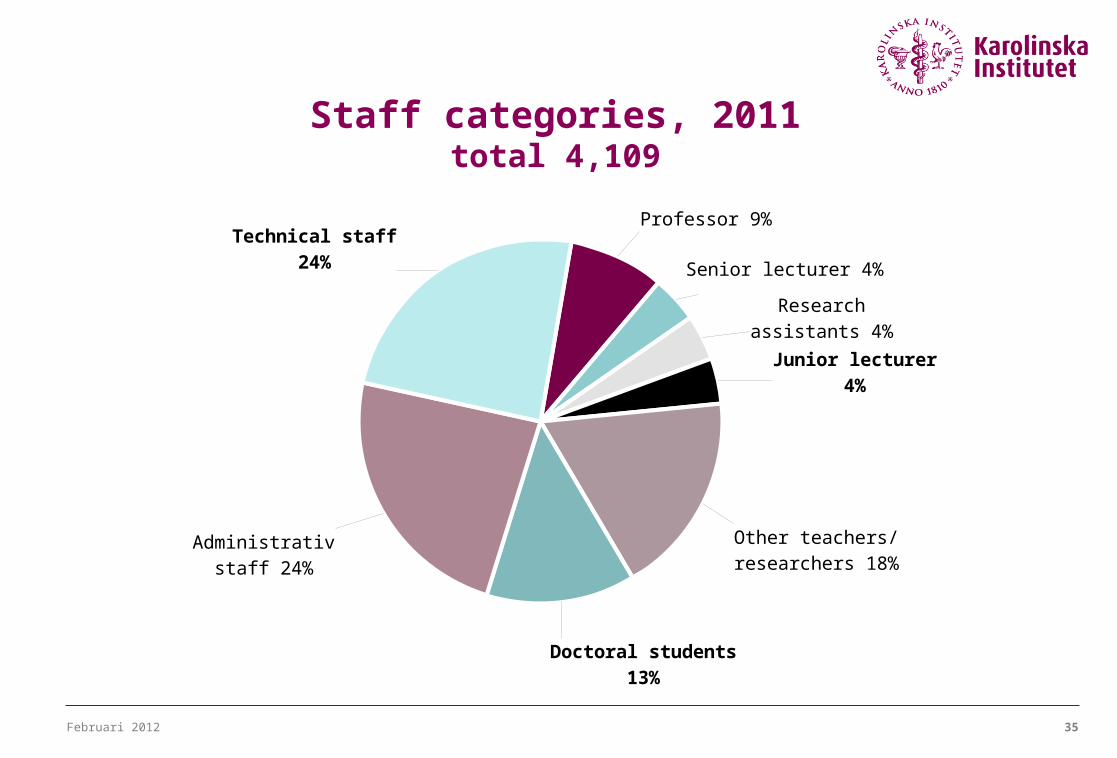
Staff categories, 2011total 4,109
Professor 9%
Senior lecturer 4%Research assistants
4%
Junior lecturer4%
Other teachers/ researchers 18%
Doctoral students13%
Administrativ staff 24%
Technical staff24%

Februari 2012 36
Staff categories: by gender, 2011total 4,109
Admin. staff
Technical staff
Doct. students
Researcher
Junior lecturer
Research assist.
Senior lecturer
Professor
Women (tot 2,662) Men (tot 1,447)
800 200400600 4002000 800600
Februari 2012 37
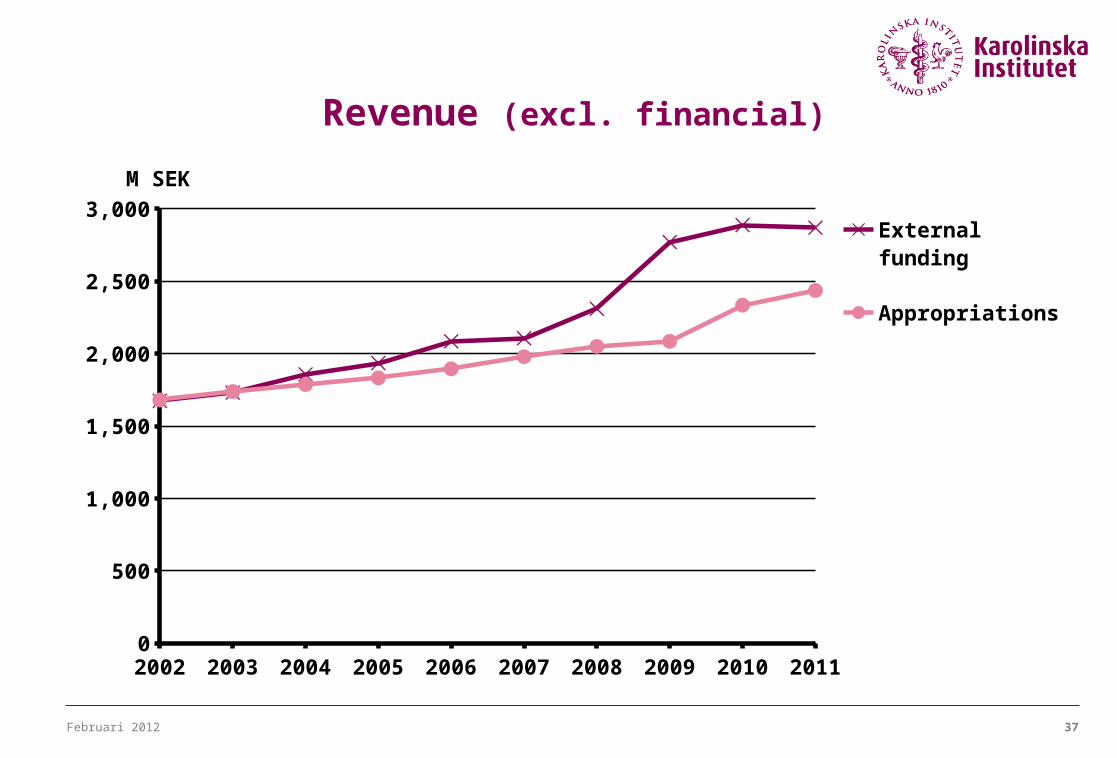
Revenue (excl. financial)
2002 2003 2004 2005 2006 2007 2008 2009 2010 20110
500
1,000
1,500
2,000
2,500
3,000
External funding
Appropriations
M SEK
Februari 2012 38
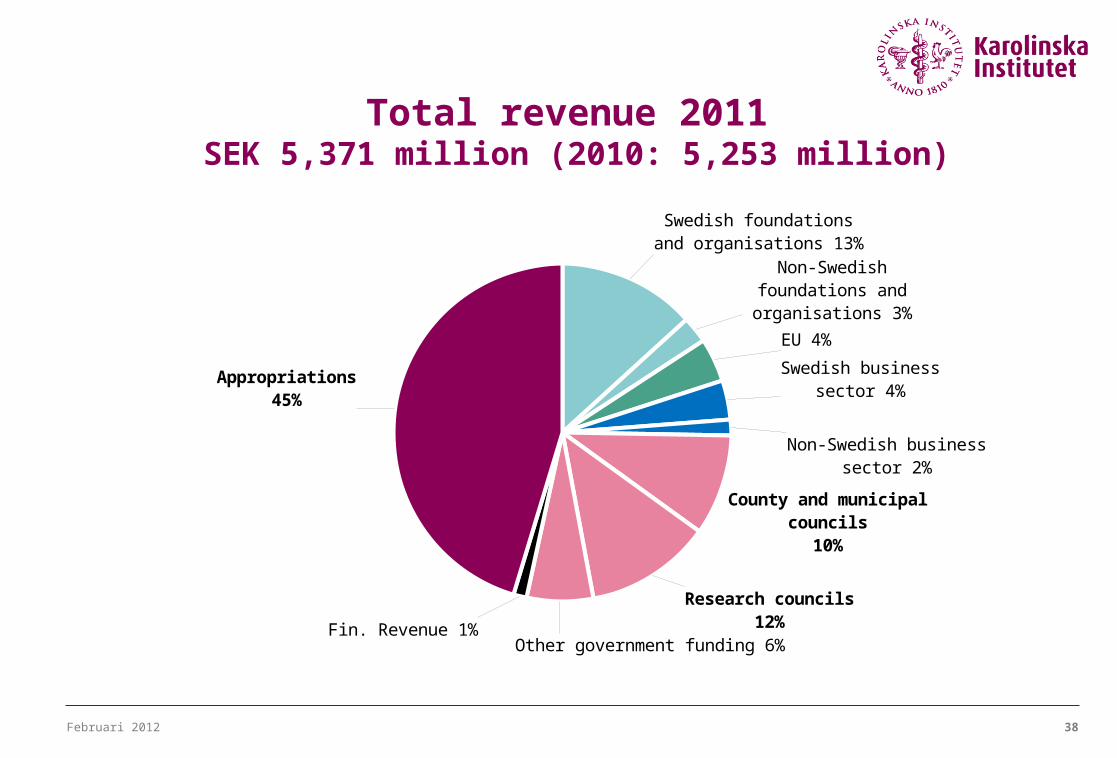
Total revenue 2011 SEK 5,371 million (2010: 5,253 million)
Swedish foundations and organisations 13%
Non-Swedish foundations and organisations 3%
EU 4%
Swedish business sector 4%
Non-Swedish business sec-tor 2%
County and municipal councils
10%
Research councils12%
Other government funding 6%Fin. Revenue 1%
Appropriations45%
Februari 2012 39
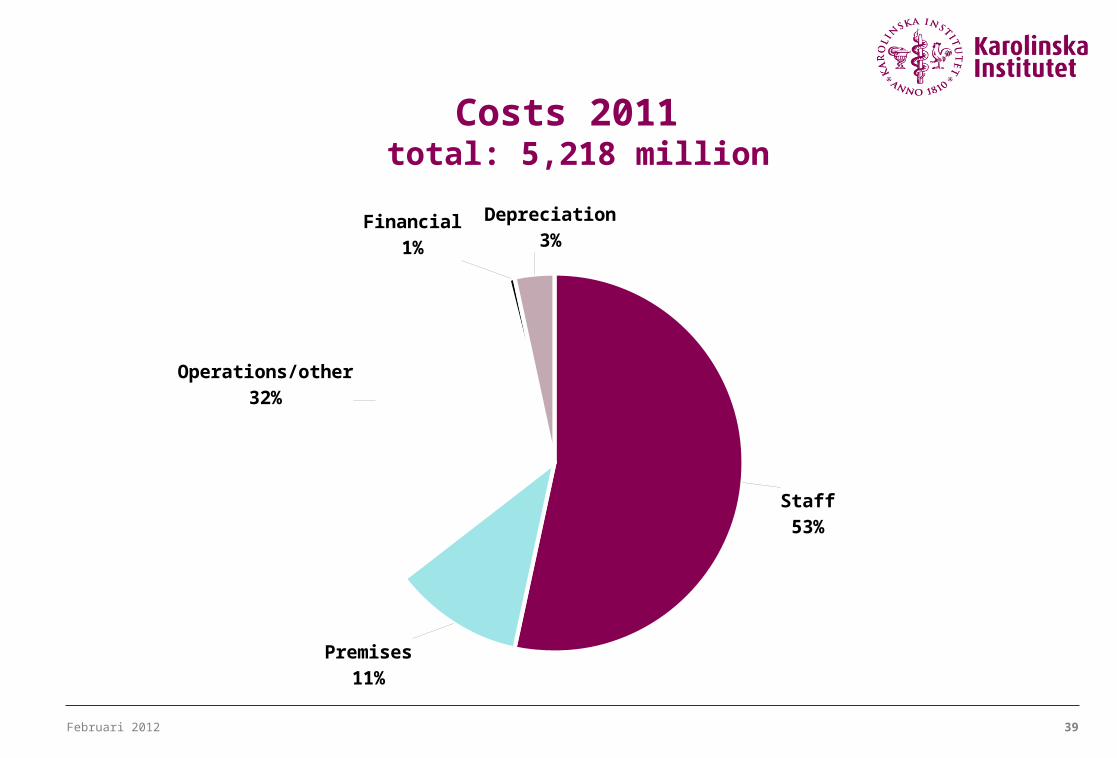
Costs 2011 total: 5,218 million
Staff53%
Premises11%
Operations/other32%
Financial1%
Depreciation3%
Februari 2012 40
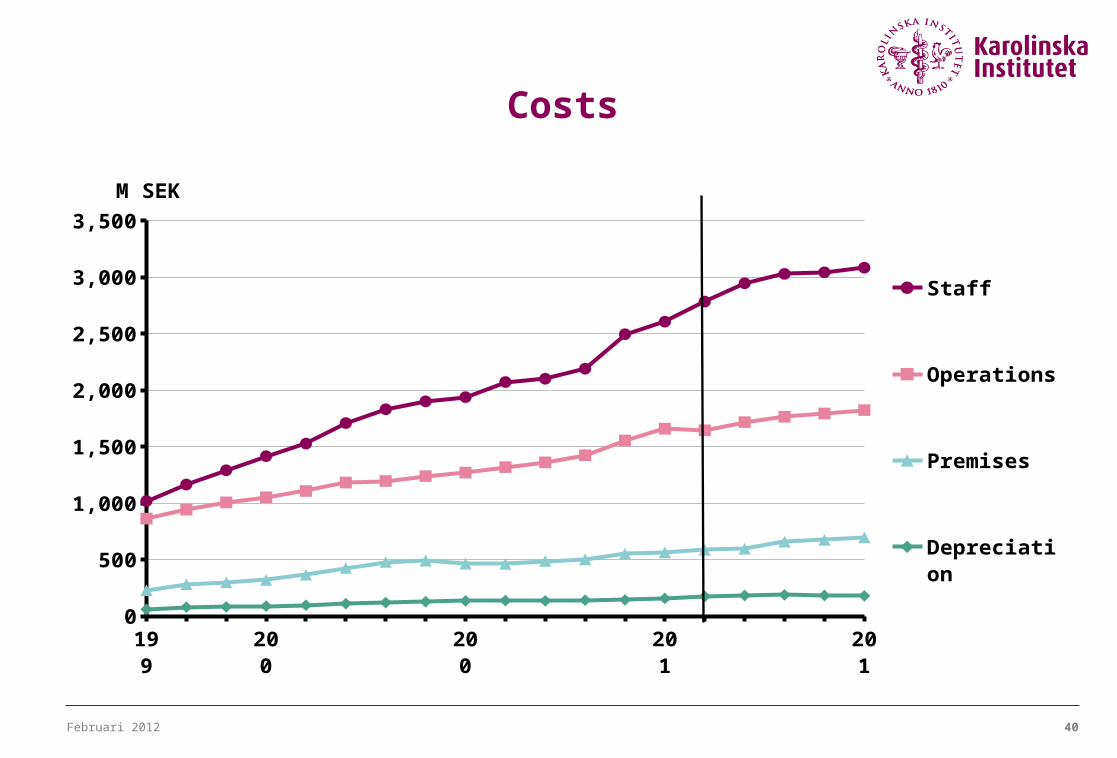
Costs
1997
2000
2005
2010
2015
0
500
1,000
1,500
2,000
2,500
3,000
3,500
Staff
Operations
Premises
Depreciation
M SEK
Februari 2012 41
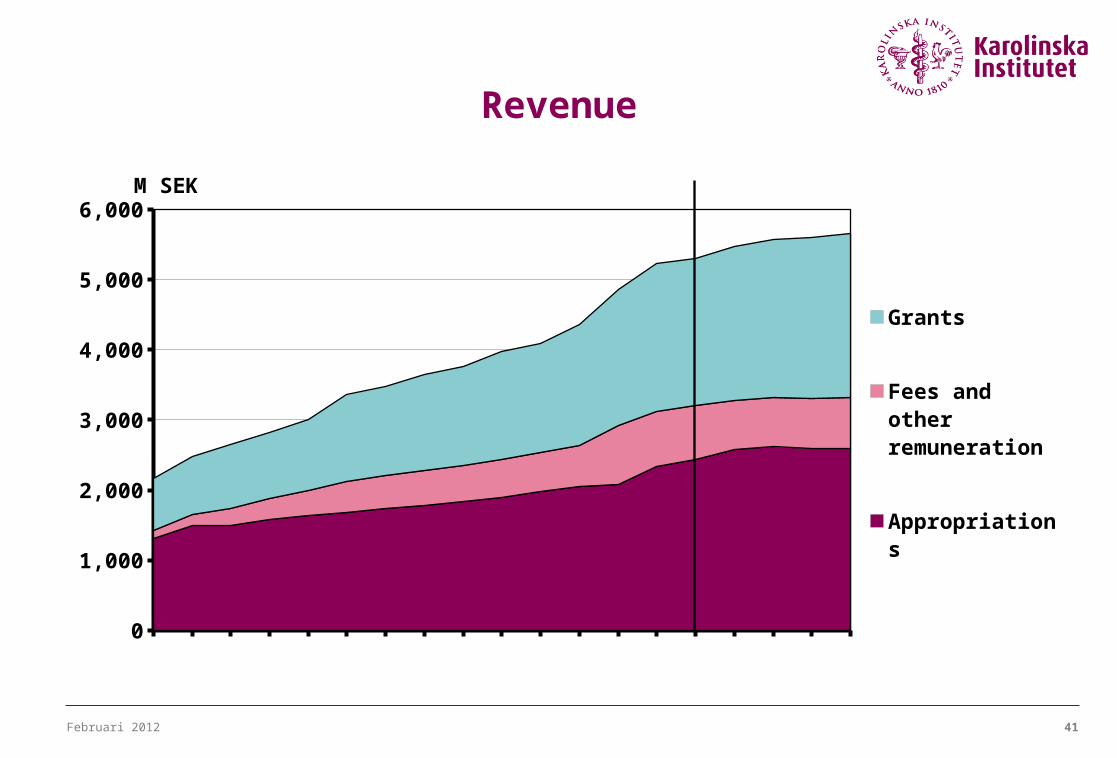
Revenue
1997
2000
2005
2010
2015
0
1,000
2,000
3,000
4,000
5,000
6,000
Grants
Fees and other remuneration
Appropriations
M SEK


![Principles of Party Organisation Comintern 1921ciml.250x.com/archive/...principles...organisation.pdfPrinciples of Party Organisation [Comintern] PRINCIPLES OF PARTY ORGANISATION *](https://cdn.vdocument.in/doc/165x107/5ea55ce501c1c41cf61ce7ef/principles-of-party-organisation-comintern-1921ciml250xcomarchiveprinciples.jpg)
