Organised by Ministry of Road Transport & Highways, Government of India


Content
1
2
3
4
5
6
Public Private Partnerships: Multimodal Logistics Parks ................ 01
Urban Transportation in India ............................................................ 15
Freight Corridors for Economic Development ................................... 25
Supply Chain Transformation: Storage Innovations ....................... 35
Gateways and the Role of Digitization ............................................... 47
Standards and Skills for Logistics ....................................................... 55


Foreword
Logistics in India’s rapidly growing economy is supported by the world’s 2nd largest road network, 4th largest
rail network, 14,500 km of navigable waterways, 200+ maritime ports and 125 airports. However, India ranks
35 in World Bank’s Logistics Performance Index (LPI) due to poor modal share - 60% of India’s domestic freight
moves on roads, despite other modes being 50-60% cheaper and 50-90% less polluting. This unfavorable
modal mix is due to lack of seamless intermodal connectivity in the country. This highlights the need for
development of multimodal infrastructure in the country through close coordination between different
agencies involved in planning and developing transport infrastructure.
In this collection of theme papers, six major topics in the logistics sector have been discussed in detail which
provide a brief background of each topic along with actionable recommendations on each. One of the key
solution themes to improve India’s logistics is the development of multimodal logistics parks (MMLPs) which
will enable a hub and spoke model of freight movement by facilitating freight aggregation-disaggregation
and multimodal freight movement. Ministry of Road Transport and Highways (MoRTH) has identified 35
prioritized locations, which account for 50% of total freight movement, for the development of MMLPs.
Additionally, multiple agencies including Container Corporation of India (CONCOR) and Delhi Mumbai Industrial
Corridor Development Corporation (DMICDC) are also developing logistics parks. It is envisaged that these
government agencies shall come together and coordinate with private parties to make a collaborative effort
to set up MMLPs in India and thereby improve India’s logistics efficiency.
The India Integrated Transport and Logistics Summit – 2017 (IITLS), is one such effort to bring together all the
concerned stakeholders, viz. government agencies, logistics service providers, concessionaires, end-users
and investors on one platform. The Summit will highlight the various new development programs in transport
and logistics sector in India
I invite you to peruse this booklet and share your views in the various sessions of the IITLS. This will enable the
government to formulate a comprehensive policy for development of Multimodal Logistics Parks, keeping in
mind the interests of all the concerned stakeholders.


( )Shri Radhakrishnan
dejk ua- 310] ifjogu Hkou] ubZ fnYyh&110001Room No 310, Transport Bhawan, New Delhi-110001
Tel. : 23715159, 23731522 Fax : 23718568
Foreword
The transport and logistics infrastructure in India must be revamped, with a focus on intermodal connectivity
and a network approach, to help bring down the logistics cost and reduce environmental pollution. India needs
to take lessons from modern infrastructure in leading countries, which is tuned to provide seamless
intermodal connectivity and has ensured a favorable modal-mix with more focus on railways and shipping
instead of roads.
Infrastructure Development is one of the top priorities for the NDA Government under the dynamic leadership
of Hon’ble Prime Minister Shri Narendra Modiji. Multiple steps have already been taken by the Ministry of Road
Transport, Highways and Shipping (MoRTH&S) to improve the state of logistics in India. The Sagarmala
Programme is a key initiative which aims to promote port-led development and provide infrastructure to
transport goods to and from ports quickly, efficiently and cost-effectively. The broad objective is capacity
enhancement and modernization of major and non-major ports, establishment of industries and
manufacturing centers to be served by ports in EXIM and domestic trade, simplification of procedures used at
ports for cargo movement and promotion of electronic channels for information exchange.
Inland Waterways Authority of India (IWAI), under the aegis of MoRTH&S, is undertaking the development of
infrastructure on National Waterways which will enable India to achieve the vision of Hon’ble Minister of Road
Transport, Highways and Shipping of using India’s ample waterways in transporting various goods from
production centers to consumption centers in a safe and efficient manner. Through these measures, it is
hoped that freight is shifted from road to coastal, inland and rail routes, which will result in huge savings for the
end-users and will benefit the whole economy.
The India Integrated Transport & Logistics Summit (IITLS) is being organized with a view to promote
collaboration between stakeholders involved in the transport and logistics sector. It is envisaged that this
collection of theme papers, discussing six key areas in which improvement is needed to improve the state of
logistics in India, will be useful to all stakeholders.

Foreword
Although India is among the world's fastest growing economies, its performance in logistics is far behind
compared to other leading countries. This is due to multiple reasons including an unfavorable modal mix,
inadequate transport and logistics infrastructure, and lack of seamless connectivity between different modes
of transport. To address these challenges, a comprehensive and holistic approach towards improving the
state of infrastructure needs to be adopted.
Ministry of Road Transport and Highways (MoRTH) has kicked-off several initiatives including development
of Multimodal Logistics Parks, infrastructure upgradation of freight corridors and IT-based solutions for
facilitating seamless intermodal movement. These initiatives are aimed at making the movement of cargo
on Indian roads more efficient, while at the same time shifting cargo from road to other cheaper and greener
modes including rail, sea and air. To ensure the success of these initiatives, it is hoped that all the relevant
stakeholders, including private parties from India and abroad will come together and join India's logistics
movement under the umbrella of India Integrated Transport and Logistics Summit, 2017 (llTLS). The Summit
is being organized with a view to generate interest and foster partnerships among both public and private
agencies.
This booklet has been prepared to inform the latest trends and happenings in these sectors. I hope that you
will find this material useful and express your valued thoughts over the same in the llTLS.


(Sanjay Mitra)
Foreword
The logistics and transportation scenario in India is poised for a complete makeover. Several important
initiatives have been planned. The Ministry of Road Transport and Highways (MoRTH) had undertaken a
study, called the Logistics Efficiency Enhancement Programme (LEEP), which has identified four key solution
themes to improve the state of logistics in India. These are, freight corridor upgradation, logistics park
development, seamless interstate movement and electronic toll collection systems. Taken together, these
initiatives are expected to reduce India's logistics costs and bring them closer to the accepted global
benchmarks from the current high levels of 13-14% of GDP.
The Ministry plans to develop 35 Multimodal Logistics Parks (MMLPs) in lndia which will, cater to 50% of the
freight movement, enable -10% reduction in transportation costs and -12% reduction in C02 emissions.
Land parcels have been identified and pre-feasibility studies initiated on six of these locations. The parks
will be developed jointly by the National Highways Authority of India (NHAI), the National Highways
Infrastructure. Development Corporation (NHIDCL), other parastatals and the respective state governments.
The government is also working to formulate a uniform policy for the development of MMLPs, It will be our
endeavor to solicit and incorporate the views of all the stakeholders through the India Integrated Transport
and Logistics Summit-2017 (llTLS),
The IITLS will be an excellent platform for all those with interest in transport and logistics sectors to come
together and initiate collaborative partnerships to realize the various greenfield and brownfield opportunities
in logistic parks, freight corridors and IT solutions.
This collection of theme papers has been prepared with a view to inform the readers about the state of
transport and logistics in India, the global best practices and key recommendations to help these sectors
reach world class levels. I hope that our stakeholders will find this useful.


02
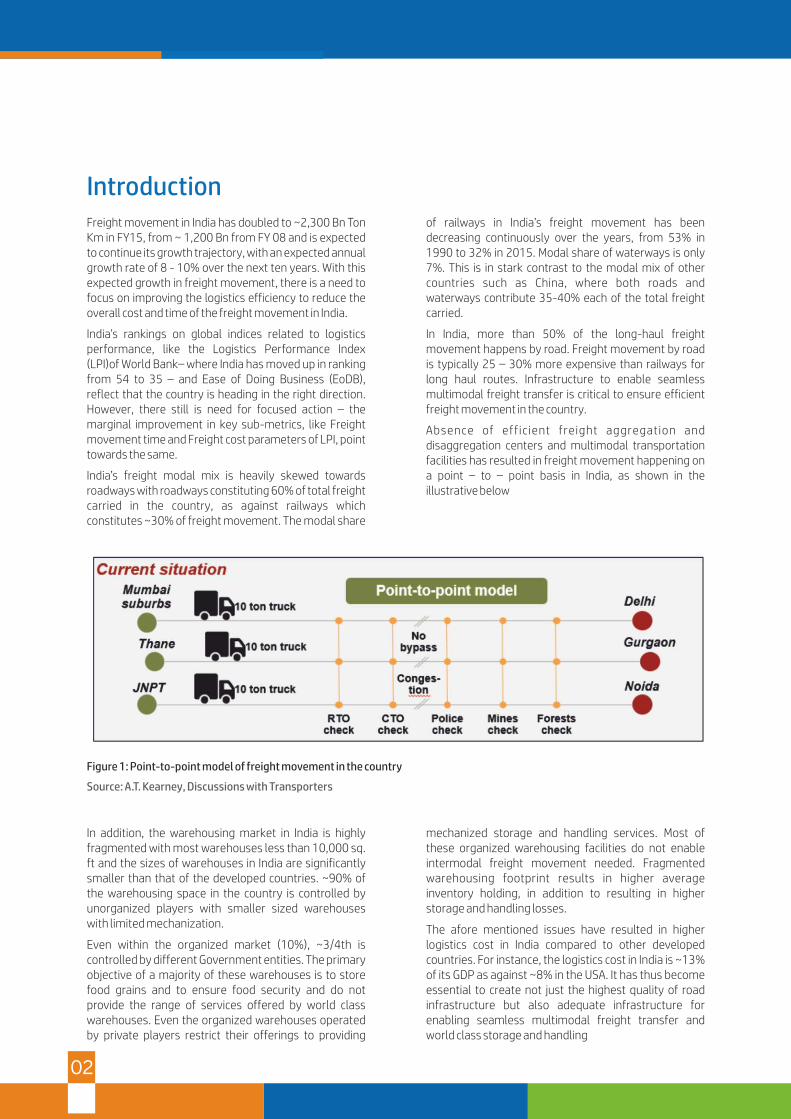
Freight movement in India has doubled to ~2,300 Bn Ton Km in FY15, from ~ 1,200 Bn from FY 08 and is expected to continue its growth trajectory, with an expected annual growth rate of 8 - 10% over the next ten years. With this expected growth in freight movement, there is a need to focus on improving the logistics efficiency to reduce the overall cost and time of the freight movement in India.
India’s rankings on global indices related to logistics performance, like the Logistics Performance Index (LPI)of World Bank– where India has moved up in ranking from 54 to 35 – and Ease of Doing Business (EoDB), reflect that the country is heading in the right direction. However, there still is need for focused action – the marginal improvement in key sub-metrics, like Freight movement time and Freight cost parameters of LPI, point towards the same.
India’s freight modal mix is heavily skewed towards roadways with roadways constituting 60% of total freight carried in the country, as against railways which constitutes ~30% of freight movement. The modal share
of railways in India’s freight movement has been decreasing continuously over the years, from 53% in 1990 to 32% in 2015. Modal share of waterways is only 7%. This is in stark contrast to the modal mix of other countries such as China, where both roads and waterways contribute 35-40% each of the total freight carried.
In India, more than 50% of the long-haul freight movement happens by road. Freight movement by road is typically 25 – 30% more expensive than railways for long haul routes. Infrastructure to enable seamless multimodal freight transfer is critical to ensure efficient freight movement in the country.
Absence of efficient freight aggregation and disaggregation centers and multimodal transportation facilities has resulted in freight movement happening on a point – to – point basis in India, as shown in the illustrative below
Introduction
Figure 1: Point-to-point model of freight movement in the country
Source: A.T. Kearney, Discussions with Transporters
In addition, the warehousing market in India is highly fragmented with most warehouses less than 10,000 sq. ft and the sizes of warehouses in India are significantly smaller than that of the developed countries. ~90% of the warehousing space in the country is controlled by unorganized players with smaller sized warehouses with limited mechanization.
Even within the organized market (10%), ~3/4th is controlled by different Government entities. The primary objective of a majority of these warehouses is to store food grains and to ensure food security and do not provide the range of services offered by world class warehouses. Even the organized warehouses operated by private players restrict their offerings to providing
mechanized storage and handling services. Most of these organized warehousing facilities do not enable intermodal freight movement needed. Fragmented warehousing footprint results in higher average inventory holding, in addition to resulting in higher storage and handling losses.
The afore mentioned issues have resulted in higher logistics cost in India compared to other developed countries. For instance, the logistics cost in India is ~13% of its GDP as against ~8% in the USA. It has thus become essential to create not just the highest quality of road infrastructure but also adequate infrastructure for enabling seamless multimodal freight transfer and world class storage and handling
With the government increasing focus on developing rail
and waterways infrastructure, and the implementation
of GST turning India into a consolidated market,
developing a network of multimodal logistics parks to
act as logistics hubs will address the afore mentioned
issues
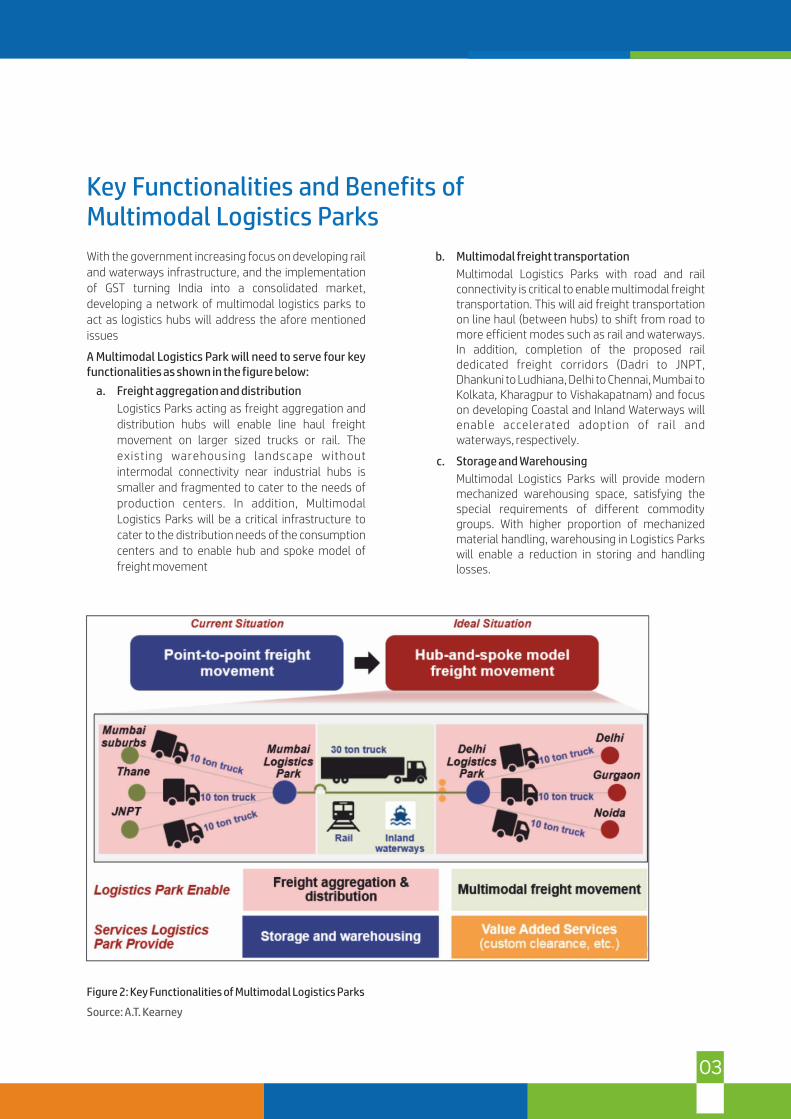
A Multimodal Logistics Park will need to serve four key functionalities as shown in the figure below:
a. Freight aggregation and distribution
Logistics Parks acting as freight aggregation and
distribution hubs will enable line haul freight
movement on larger sized trucks or rail. The
existing warehousing landscape without
intermodal connectivity near industrial hubs is
smaller and fragmented to cater to the needs of
production centers. In addition, Multimodal
Logistics Parks will be a critical infrastructure to
cater to the distribution needs of the consumption
centers and to enable hub and spoke model of
freight movement
b. Multimodal freight transportation
Multimodal Logistics Parks with road and rail connectivity is critical to enable multimodal freight transportation. This will aid freight transportation on line haul (between hubs) to shift from road to more efficient modes such as rail and waterways. In addition, completion of the proposed rail dedicated freight corridors (Dadri to JNPT, Dhankuni to Ludhiana, Delhi to Chennai, Mumbai to Kolkata, Kharagpur to Vishakapatnam) and focus on developing Coastal and Inland Waterways will enable accelerated adoption of rail and waterways, respectively.
c. Storage and Warehousing
Multimodal Logistics Parks will provide modern mechanized warehousing space, satisfying the special requirements of different commodity groups. With higher proportion of mechanized material handling, warehousing in Logistics Parks will enable a reduction in storing and handling losses.
Key Functionalities and Benefits of Multimodal Logistics Parks
Figure 2: Key Functionalities of Multimodal Logistics Parks
Source: A.T. Kearney
03

04
d. Value added services:
Multimodal Logistics Parks are also expected to provide value added services such as customs c learance with bonded storage yards, warehousing management services, etc. Customs clearance at Multimodal Logistics Parks will enable waiting time reduction at the ports and thereby reduce the freight transportation cost and time for cargo. In addition, Multimodal Logistics Parks near the major ports (Chennai, Vishakhapatnam, Mumbai, Kolkata, etc.) will have clearly demarcated Free Trade and Warehousing Zones to enable storage of trans-shipment cargo, without any tax implications.
Multiple benefits exist in developing Multimodal Logistics Parks, over independent warehouses:
a. Seamless inter-modal freight movement
A Multimodal Logistics Park will enable seamless transfer of goods from one mode to another. This
will enable a more efficient hub and spoke model of freight movement.
b. Reduction in inventory holding costs
MultimodalLogistics Parks will provide large modern and mechanized warehousing space. With higher proportion of mechanized material handling, Multimodal Logistics Parks will result in reduction in storage and handling losses. In addit ion, avai labi l i ty of a consol idated warehousing zone will enable reduction in inventory holding costs
c. Reduction in freight transportation lead times
Customs clearance at Multimodal Logistics Parks will enable a reduction in waiting time at the ports. In addition, provisions for packaging/ repacking and return management at the Multimodal Logistics Parks will enable a reduction in overall supply chain lead times.
Lessons from Global Best Practices in Development of Logistics Parks
Case Study 1:Logistics platforms in China
Large scale logistics parks are developed by Government owned entities, either solely or through a Joint venture with private players. Examples of two logistics platforms in China are illustrated below.
GLP Suzhou Park
GLP Suzhou Logistics Park is located within the Suzhou industrial zone, which is the largest free trade zone in the country. Developed in an area of ~ 300 acres, it provides services such as bonded warehousing, customs clearance facilities, facilities for preliminary processing and packaging.
The logistics park is well served by two expressways – Beijing–Shanghai expressway and Nanjing–Shanghai expressway. The logistics park is connected to the Shanghai deep water port (160 km) and Shanghai International Airport (80 km) through these expressways.
GLP Suzhou Park was developed as a 50:50 Joint Venture between Global Logistic Property (GLP), a fund
Multimodal Logistics Parks have been developed in most developed countries and large developing economies to improve the efficiency of freight movement.
A few case studies from global Logistics Parks are highlighted below
manager, developer and operator of logistics parks with a global portfolio of 52 million sq. ft. of warehousing space and SEALL, a government owned entity.
Case Study 2: Logistics platforms in the USA
Large scale integrated logistics parks are typically developed as private limited companies with participation from the Government in the USA. Learning from one such logistics park in Chicago is provided below.
Center Point Integrated Logistics Parks, Chicago
An integrated logistics park was developed by Center Point properties at Joliet, 40 miles southwest of Chicago, covering an area of ~2,200 acres at an investment of USD 1 Billion. The area was formerly a military base which had been c losed, result ing in ~15% unemployment in the area. Department of Defense then released the area for development of Logistics Park, to generate employment and provide an economic boost to the area. Integrated Logistics Park was envisioned to alleviate road congestion within the Chicago metropolitan area and the congestion in Chicago rail

05
interchange. The role of the Government in development of the Logistics Parks is to provide the trunk infrastructure and enabling access to the nearest freeway.
The logistics park location is very well connected by both road and rail. In addition, the Logistics park has advanced infrastructure such as tracks for catering to long double stack trains, GPS enabled cranes, automated cranes. CenterPoint Logistics Park is a huge success driven by excellent rail road connectivity, proximity to a large consumption center and efficient operations. CenterPoint Logistics Park created ~8,000 direct and indirect jobs in the region.
Key lessons from an assessment of Global Logistics Parks are highlighted below
a. Adequate connectivity:
Dedicated trunk infrastructure to connect the Logistics Parks to the arterial network of transportation modes, such as National Highways network, Railways network, port and inland waterway terminals, etc. is essential to ensure efficient freight evacuation from Logistics Parks. Successful logistics parks have railway sidings, dedicated connectivity to the expressway network
There is a need to develop Multimodal Logistics Parks in all the major production and consumption centers in the country. Locations for development of Multimodal Logistics Parks will need to be prioritized based on the amount of freight flow, need for trunk infrastructure connectivity and the extent of competing facilities available.
35 locations which account for ~50% of the road freight movement will be ideal candidates for Investments in Multi modal Logistics Parks in India in the first phase.
The land parcel for development of Multimodal Logistics Parks need to be based on an assessment of freight flows and the connectivity requirement, within each node.
The factors that need to be considered for prioritization of clusters for the development of Multimodal Logistics parks are highlighted below:
a. Freight flow assessment
A detailed assessment of the road and rail freight flow patterns will need to be conducted for each
to improve freight evacuation from the Multimodal Logistics Parks.
b. Multipurpose facilities
M o st s u c c essf u l Lo g i st i c s Pa r ks h a v e multipurpose facilities and are customizable to cater to the needs to different commodities and industries including cold storage, open storage yards, etc. In addition, logistics parks have provisions for late stage manufacturing activities such as kitting and final assembly, grading, sorting, labeling and packaging activities, re-working, return management etc. the customers. The norms for land usage for different activities shall be well defined.
c. Management Model
Logistics parks have been developed by private players as well by the sovereign, through a public private partnership model. The role of the Authority in the PPP model has been restricted to providing the required land and the trunk infrastructure connectivity, while the private concessionaire has been responsible for development and operation of the Logistics Parks.
Location and Design Guidelines for Multimodal Logistics Parks
node to understand the direction of the freight movement. Land parcels along the Highway with maximum freight flows need to be prioritized for development of Multimodal Logistics Parks.
b. Proximity to production and consumption zones
While Multimodal Logistics Parks will ideally need to be located outside the limits of the city to enable congestion reduction in the city, land parcels that are closer to the city limits, preferably along the ring roads/ city bypasses will need to be prioritized. Land parcels near Industrial / Manufacturing parks will need to be prioritized to maximize the network effects of combined logistics and manufacturing activity.
c. Connectivity requirement
Land parcels near National Highways and Railway network with good access to other modes such port and inland waterway terminals will need to be accorded higher priority for development of Multimodal Logistics Parks

06
In addition, the size and facilities needed at each
Logistics Park will depend on the key commodities
produced and consumed by the individual location.
Area required for developing a multimodal logistics park at any location will need to be determined based on the projected commodity wise freight originating and terminating at that node. For instance, a location with higher proportion of perishable agri - commodities will need a higher proportion of warehousing space dedicated to cold storage. Similarly, commodities with higher average inventory holding will need to be allocated higher storage space.
Multimodal Logistics Parks will need to have five broad zones to fulfil the functionalities as highlighted in the previous section viz., Commodity storage zone, Intermodal zone, Value added services zone, Ancillary service zone and Vehicle Parking zone. While majority of the area will need to be dedicated to core logistics activities – Warehousing, Intermodal Areas, Value Added Services and Custom Clearance facilities, provision will need to be made for other ancillary logistics activities such as vehicle sales and service including vehicle service areas, People service areas, office spaces for logistics service providers, transporters etc.
Figure 3: Top 35 clusters identified for development of Multimodal Logistics Park
Source: A.T. Kearney
Private investments in development of Multimodal Logistics Parks have been muted primarily owing to restricted land availability, lack of dedicated trunk infrastructure connectivity to enable efficient freight evacuation. In addition, the potential returns for private players from their investments in development of Multimodal Logistics Parks including land ownership is limited. Also, the availability of long term financing is currently constrained for warehousing sector, as they are treated as a commercial activity, unlike the infrastructure sector, with access to long term project
Management Modelfinancing. Hence, the role of the Government through a Public Private Partnership (PPP) model is essential in enabling private investments in development of Multimodal Logistics Parks. In addition, Government will need to provide infrastructure status for development of Multimodal Logistics Parks to enable easy access to credit and tax benefits for private developers
The large-scale investment requirement for such high-value projects and constrained government resources for physical infrastructure investment highlights the importance of attracting private partnerships in such
Logistics parks will drive a reduction in overall freight cost by enabling freight transportation on higher sized trucks and rail. In addition, multimodal logistics parks will enable reduction in vehicular pollution and congestion in key cities.
Logistics parks are expected to provide four key benefits as summarized below
i. Transportation cost reduction
Logistics parks will drive ~10% reduction in transportation cost for the top 15 nodes by enabling freight movement on higher sized trucks and rail. Larger sized trucks have ~60% lower freight cost on a per ton per km basis compared to lower sized trucks. Further, estimates suggest freight cost by rail is ~45% lower on a per ton per km basis compared to average road freight cost.
ii. Pollution reduction
Increased freight movement on higher sized trucks and rail will enable in ~12% reduction in CO2emissions for the top 15 nodes. Higher sized vehicles, because lower fuel consumption per ton per km, will result in lower CO2 emissions. Further,
Expected Impact of Multimodal Logistics Parks
freight movement by rail has ~ 65% lower CO2 emissions compared to road freight on a per ton per km basis. Similarly, there will be a corresponding reduction in PM, CO and HC+NOx emissions, driven by increased freight movement on higher sized vehicles and rail.
iii. Congestion reduction
Increased freight movement on higher sized trucks and rail will result in ~20% reduction in freight vehicles catering to the demands of the top nodes. In addition, shifting warehouses and wholesale markets, currently being operated inside the city, to logistics parks would free up urban spaces, enabling congestion reduction.
iv. Warehousing cost reduction
Shifting warehouses, currently being operated inside city limits, to logistics parks will enable reduction in warehousing cost, driven by lower rentals in logistics parks situated outside the city limits. In addition, modern and mechanized storage solutions provided by logistics parks will enable reduction in storage and handling losses
projects. Public Private Partnership Models ensure sizeable investments are being made in public infrastructure while ensuring that the global best practices are leveraged through private participation
Since the development and operation of Multimodal Logistics Parks involve multiple Union Government departments handling different modes of travel viz., Roadways, Railways, Inland Waterways, etc., coordinated action between the different departments is critical to ensure efficient planning and development of Logistics Parks. In addition, involvement of the respective state governments is essential to ensure easy land acquisition.
Central Government agencies will need to form a Special Purpose Vehicle (SPV) with the different state
governments, where the state government shall be responsible for land acquisition and the central government agencies shall be responsible for providing road and rail connectivity to the site. The SPV shall then appoint private developers for development and operation of Logistics Parks. In addition, Government need to consider provision of infrastructure status and connectivity to large multimodal Logistics Parks, being developed by private developers.
A draft policy on Multimodal Logistics Parks highlighting the location and design norms, proposed management model, etc. has been drafted by the Ministry of Road Transport and Highways. The draft policy is provided in annexure 1, after this chapter.
07

08
Annexure 1Development of Multimodal Logistics Parks – Draft Policy Document
1.Multimodal Logistics Parks- Location Norms and Design Principles There is a need to develop Multimodal Logistics Parks in all the major production and consumption centres in the country. Locations for development of Logistics Parks shall be prioritized based on the amount of freight flow, need for trunk infrastructure connectivity and the extent of competing facilities available. With a view to the economic viability of the Logistics Parks, Logistics as a sector will be considered for grant of ‘Infrastructure status’. Since customs bonding facil it ies for export/import of cargo, and quarantine facilities for clearance of food items would be mandatory, the requisite provisions will be made by involving the concerned Ministries/ central agencies.
1.1 Norms for Location Identification
35 locations which account for ~50% of the road freight movement have been identified for developing multimodal logistics parks in phase 1. An indicative list of some locations and their economic potential is at Annexure A. The prioritized list of 35 locations is provided in Annexure B.
The land parcel for development of Logistics Parks shall be finalized based on an assessment of freight flows and the connectivity requirement, within each node.
a. Freight flow assessment
A detailed assessment of the freight flow patterns shall be conducted for each node to understand the direction of the freight movement. Land parcels along the Highway with maximum freight flows from and to the node shall be prioritized for development of Logistics Parks. A network of Logistics Parks shall be developed along the Highways carrying large freight flows to cater to the needs of the node.
b. Proximity to production and consumption zones
While Logistics parks shall be developed outside the limits of the city to enable congestion reduction in the city, land parcels that are closer to the periphery of the city, preferably along the ring roads/ city bypasses shall be prioritized.
c. Connectivity requirement
Land parcels near National Highways and Railway network with good access to other modes such
port and inland waterway terminals shall be prioritized for development of Logistics Parks.
1.2 Design Principles
The size and facilities needed at Logistics Parks Facilities needed at each Logistics Park depend on the key commodities produced and consumed by the individual location. In addition, the extent of competing facilities catering to the needs of the city shall be assessed to evaluate the size of the facility needed.
a. Area required for building a logistics park at any particular location will be determined based on the projected commodity wise freight generating and terminating at that node. The following factors would be considered in estimating the area required
i. Type of storage needed by commodity – covered, open or special storage
ii. Attractiveness of value proposition of the logistics park for each commodity group and hence propensity of using the services offered by logistics parks
iii. Average inventory days and seasonality factor of each commodity
iv. Material bulk density and storage norms for each commodity
v. Competing infrastructure catering to the requirements of the city
b. There will be five broad zones
i. Commodity storage zone – dedicated zones for different types of commodity and bonded storage yard along with vehicle loading ramps, cross docking facilities.
ii. Intermodal zone – rail siding area for intermodal freight transfer; terminals for inland waterways, wherever applicable.
iii. Value added services zone- Package, Re-packaging, Processing, Re-processing.
iv. Ancillary services zone – dedicated area for other value added services such as customs clearance, vehicle service area, office spaces, restaurant, Retail & wholesale, Hotels and entertainment etc.
v. Vehicle parking zone – dedicated area for vehicle parking.
09
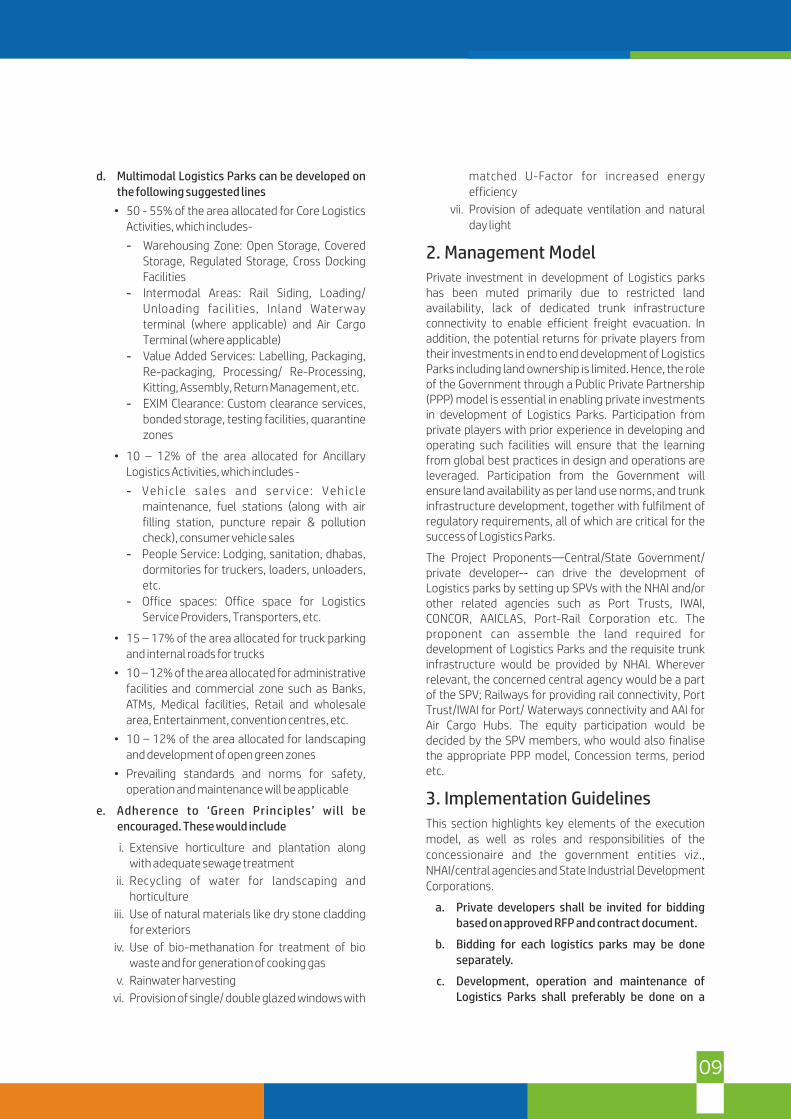
d. Multimodal Logistics Parks can be developed on the following suggested lines
• 50 - 55% of the area allocated for Core Logistics Activities, which includes-
- Warehousing Zone: Open Storage, Covered Storage, Regulated Storage, Cross Docking Facilities
- Intermodal Areas: Rail Siding, Loading/ Unloading facilities, Inland Waterway terminal (where applicable) and Air Cargo Terminal (where applicable)
- Value Added Services: Labelling, Packaging, Re-packaging, Processing/ Re-Processing, Kitting, Assembly, Return Management, etc.
- EXIM Clearance: Custom clearance services, bonded storage, testing facilities, quarantine zones
• 10 – 12% of the area allocated for Ancillary Logistics Activities, which includes -
- Vehic le sales and ser v ice: Vehic le maintenance, fuel stations (along with air filling station, puncture repair & pollution check), consumer vehicle sales
- People Service: Lodging, sanitation, dhabas, dormitories for truckers, loaders, unloaders, etc.
- Office spaces: Office space for Logistics Service Providers, Transporters, etc.
• 15 – 17% of the area allocated for truck parking and internal roads for trucks
• 10 – 12% of the area allocated for administrative facilities and commercial zone such as Banks, ATMs, Medical facilities, Retail and wholesale area, Entertainment, convention centres, etc.
• 10 – 12% of the area allocated for landscaping and development of open green zones
• Prevailing standards and norms for safety, operation and maintenance will be applicable
e. Adherence to ‘Green Principles’ will be encouraged. These would include
i. Extensive horticulture and plantation along with adequate sewage treatment
ii. Recycling of water for landscaping and horticulture
iii. Use of natural materials like dry stone cladding for exteriors
iv. Use of bio-methanation for treatment of bio waste and for generation of cooking gas
v. Rainwater harvesting
vi. Provision of single/ double glazed windows with
matched U-Factor for increased energy efficiency
vii. Provision of adequate ventilation and natural day light
2. Management Model Private investment in development of Logistics parks has been muted primarily due to restricted land availability, lack of dedicated trunk infrastructure connectivity to enable efficient freight evacuation. In addition, the potential returns for private players from their investments in end to end development of Logistics Parks including land ownership is limited. Hence, the role of the Government through a Public Private Partnership (PPP) model is essential in enabling private investments in development of Logistics Parks. Participation from private players with prior experience in developing and operating such facilities will ensure that the learning from global best practices in design and operations are leveraged. Participation from the Government will ensure land availability as per land use norms, and trunk infrastructure development, together with fulfilment of regulatory requirements, all of which are critical for the success of Logistics Parks.
The Project Proponents—Central/State Government/ private developer-- can drive the development of Logistics parks by setting up SPVs with the NHAI and/or other related agencies such as Port Trusts, IWAI, CONCOR, AAICLAS, Port-Rail Corporation etc. The proponent can assemble the land required for development of Logistics Parks and the requisite trunk infrastructure would be provided by NHAI. Wherever relevant, the concerned central agency would be a part of the SPV; Railways for providing rail connectivity, Port Trust/IWAI for Port/ Waterways connectivity and AAI for Air Cargo Hubs. The equity participation would be decided by the SPV members, who would also finalise the appropriate PPP model, Concession terms, period etc.
3. Implementation GuidelinesThis section highlights key elements of the execution model, as well as roles and responsibilities of the concessionaire and the government entities viz., NHAI/central agencies and State Industrial Development Corporations.
a. Private developers shall be invited for bidding based on approved RFP and contract document.
b. Bidding for each logistics parks may be done separately.
c. Development, operation and maintenance of Logistics Parks shall preferably be done on a
10
Build Operate Transfer (BOT) model. The Model concession agreement for development of Logistic Parks may be finalised by the stakeholders/State Government and specify the following:
i. Bidding parameters
ii. Concession fee
iii. Service parameters.
iv. Concession period
v. Specification and standards
vi. Monitoring mechanism
vii. Incentives and penalties
viii. Facilities
ix. Blue print
3.2 State Government as the key stakeholder
35 locations which account for ~50% of the road freight movement have been identified for developing multimodal logistics parks in phase 1. An indicative list of some locations and their economic potential is at Annexure A. The prioritized list of 35 locations is provided in Annexure B.
The land parcel for development of Logistics Parks shall be finalized based on an assessment of freight flows and the connectivity requirement, within each node.
• State Government can provide the land required for the Logistics Park or it can be assembled/ mobilised from private developers, with the said land parcel necessarily conforming to all prevailing state legislations. State Government shall also facilitate all the regulatory approvals needed for land use conversion, before an encumbrance free land parcel is provided to the Concessionaire for development of Logistics Parks.
• State Government Authorities shall facilitate utility connections (Power, Water, Sewerage, etc.) for the Logistics Parks in a time bound manner and also ensure seamless movement of trucks into the Logistics Parks with enabling traffic regulations. In addition, the State Government shall make appropriate arrangement to maintain Law and Order within and around the Logistics Parks.
• State Governments should plan and facilitate development of Industrial and Manufacturing Parks adjacent to Multimodal Logistics Parks through appropriate zoning and master planning norms to ensure that network benefits of co-located Industrial and Logistics Parks are realized.
3.3 Role of ConcessionaireThe role of the concessionaire is to be defined in the MCA. Broadly, it may include the following:
i. Funding for the project
ii. D e t a i l e d d e s i g n a n d e n g i n e e r i n g responsibilities
iii. Operation and Maintenance of the multimodal Logistics Parks in line with the service level agreements mentioned in the concession agreement finalized with the Authority
b) While the overall responsibility of development, operation and maintenance of Logistics Parks shall rest with the concessionaire, the concessionaire shall be permitted to engage with third party contractors to outsource certain elements of the Logistics Parks, as needed. The concessionaire shall be responsible for obtaining all requisite permission(s) from the concerned authorities for design, construction, operation and maintenance of the site.
11
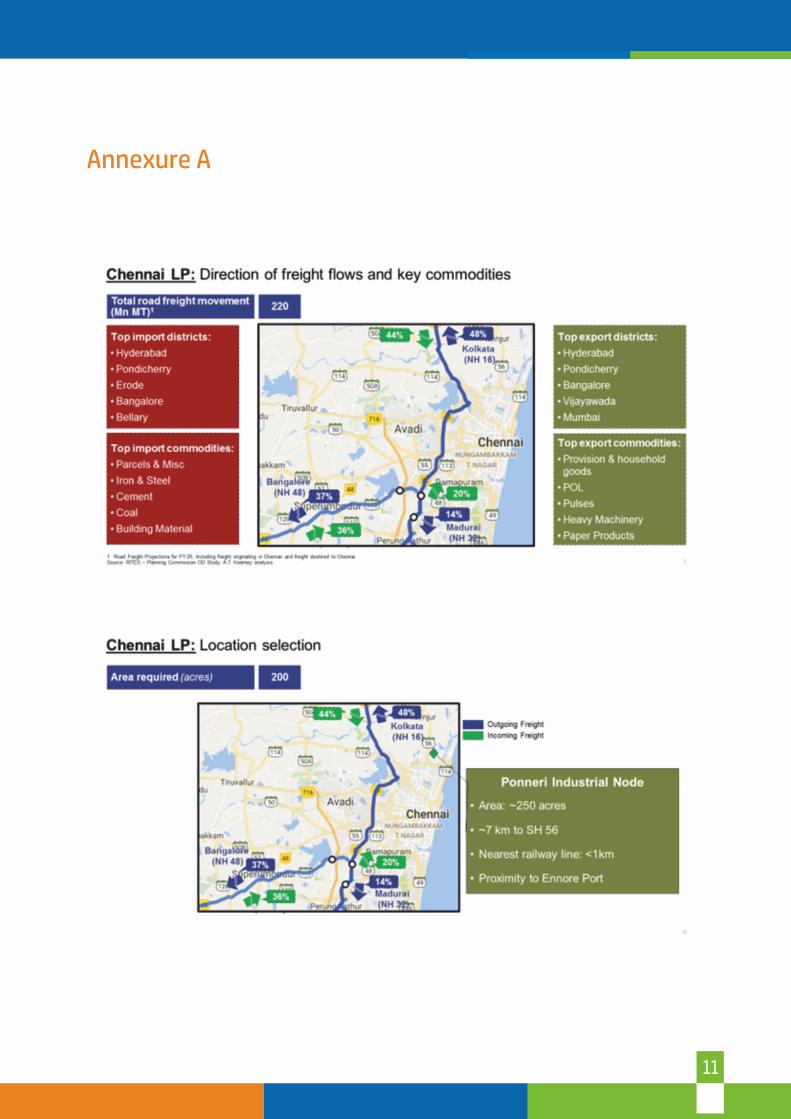
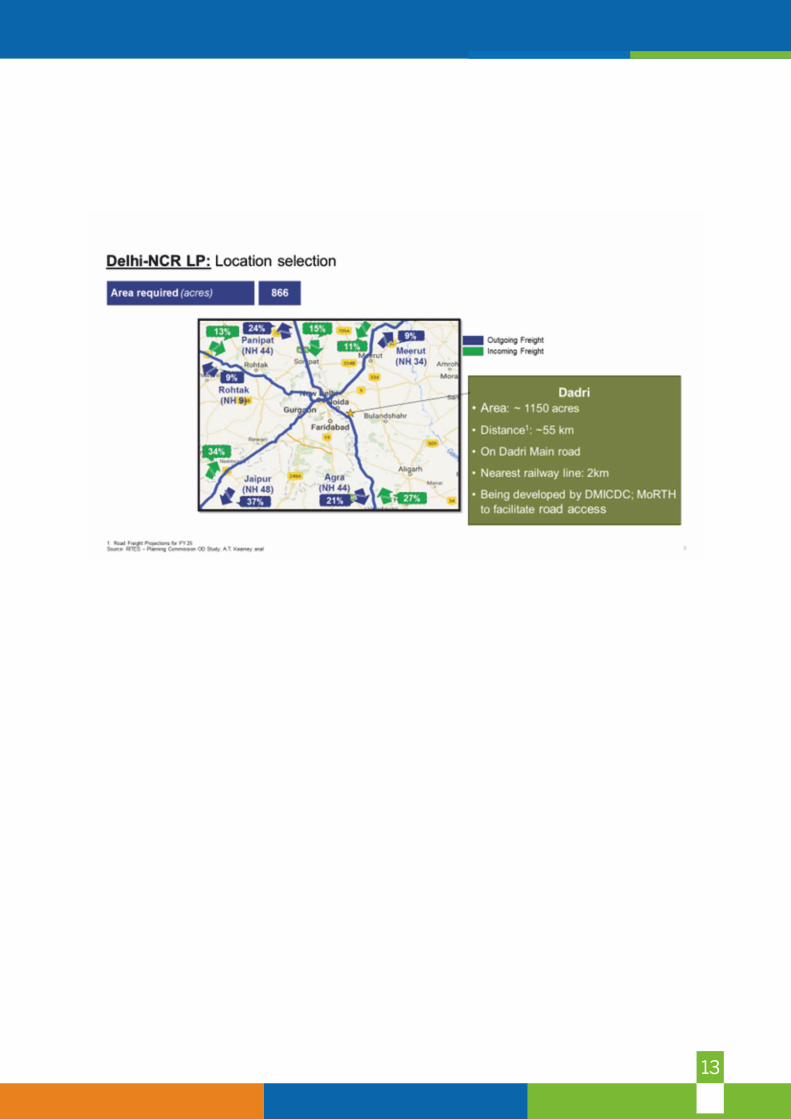
Annexure A

12
13

14
Logistics park location
Delhi – NCR (Delhi, Gurgaon, Ghaziabad, Faridabad, Noida)
Mumbai (Mumbai, Mumbai Suburbs, JNPT, Mumbai Port, Raigad District)
North Gujarat (Ahmedabad and Vadodara)
Hyderabad
South Gujarat (Surat and Bharuch)
South Punjab (Ludhiana, Sangrur, Patiala)
North Punjab (Amritsar, Jalandhar, Gurdaspur)
Jaipur
Kandla
Bangalore
Pune
Vijayawada
Cochin
Chennai
Nagpur
Indore
Patna
Kolkata
Ambala
Valsad
Coimbatore
Jagatsinghpur
Nasik
Guwahati
Kota
Panaji
Hisar
Visakhapatnam
Bhopal
Sundargarh
Bhatinda
Solan
Rajkot
Raipur
S.No.
1
2
3
4
5
6
7
8
9
10
11
12
13
14
15
16
17
18
19
20
21
22
23
24
25
26
27
28
29
30
31
32
33
34
35 Jammu
Locations prioritized for development of Multimodal Logistics Parks in Phase
Annexure B


16
The need to prepare India’s urban mobility for future: Case for passenger mobility
Passenger mobility challenges
Indian cities, especially the populous ones, face
multitude of challenges, many of which are caused by
non-controllable factors like high population density and
historical unplanned construction. Lack of funds with
urban local bodies is another major issue. These
constraints have led to gaps in India’s urban
transportation and mobility which can be classified into 3
areas: Infrastructure, Transport modes and ICT
enablement.
Infrastructure
Infrastructure forms the backbone of transportation.
However, India has visibly poor transportation
infrastructure. Road construction has not matched the
India is going to witness rapid urbanization in coming decades with 50% of India’s population slated to live in urban areas by 2050, up from about 30% today. Urban population during the period 2010-50, is estimated to grow at a CAGR of 2%, while the demand for urban mobility during the same period is estimated to grow at a CAGR of 5%. Growth in urban mobility is outstripping the urban population growth due to: concentration of economic activity in urban areas, increase in affluence level of city dwellers leading to greater use of private vehicles and expansion of cities.
vehicle fleet growth. Vehicle fleet registered an average
decadal growth of 10-12% between 1971 to 2011, but
the corresponding growth of road infrastructure was a
mere 3% during this period.
Transit Modes
Public transport in most Indian cities is inadequate and has not matched the growing mobility needs. This leads to dominance of non-motorized modes among the lower economic strata and an increased propensity towards usage of private vehicles, as the affluence level rises. Delhi has metro penetration which is only about one-fifth of some of the global cities. Suburban rail ridership in Mumbai, though comparable to the global benchmarks, suffers from poor safety standards and is not disabled friendly.
375470 525
815
2010 2020 2025 2050
CAGR 2%
Urban population(2010- 2050, in million)
Urban mobility demand(2010-2050, in BPKM)
2010 2020 2030 2050
800
1,750
3,200
6,000CAGR 5.2%
CAGR 7%
Figure 4: Urban Population and mobility demand (2010-2050)
Source: Transport Scenarios for India: Harmonizing development and Climate benefits, UNEP DTU

17
1Public Bus Fleet(Fleet/ million persons)
Del Mum S’ pore Hong K Tokyo London New York
168 171
765816
163
918
527
13%
60%
40%
61%70%
40%
54%
Del Mum S’ pore Hong K Tokyo London New York
Metro/ suburban rail ridership(avg. daily passengers as % of city population)
Indian cities Global Benchmarks
1. Data for 2016 for mumbai and Delhi and 2012 for other global cities
Figure 5: Comparison of public transport in Delhi and Mumbai with global cities
Source: Review of Urban transport in India by Institute of Urban Transport, Centre for Study of Science technology and Policy (CSTEP), Press sources
ICT Enablement
A robust ICT backbone can have significant impact on
passenger mobility over short term. However, India lags
in digital connectivity for urban transit. Amenities like
multipurpose smart cards, real time passenger
information for city buses, multi modal journey planning
mobile applications etc. are still not available in most
cities.
Consequences of inadequate public transport
Most Indian cities have gaps in passenger mobility
needs. Around 40% of the urban population even in
major Indian cities like Delhi are dependent on non-
motorized modes like walking and cycling. A substantial
proportion of non-motorized commutes could be due to
non-availability of adequate public transit. Experience at
Bogota showed that post BRTS implementation, there
was a drop of almost 6-7% in the non-motorized modes
due to adequate connectivity to public transport.
Inadequate public transport infrastructure and
proliferation of private vehicles leads to: congestion on
city roads, higher greenhouse gas emission.
Economic development of cities and meeting
consumption demand at low prices relies on efficient
urban freight transit. Freight movement, just like
passenger movement, is likely to witness a steeper
increase than urban population growth due to increase in
GDP contribution of cities, expansion of cities and
increase in per capita consumption. Projecting RITES
freight origin destination data for 2008 to 2015 and
2025, shows that both inbound & outbound freight per
capita will increase at a CAGR of 7% during the next
decade, due to increasing consumption and production
in the major Indian cities. Because of higher demand and
production activity, overall demand for freight
movement in India is projected to grow at CAGR of 9%.
The need to prepare India’s urban mobility for future: Case for freight mobility
Freight mobility challengesGaps in urban freight mobility can be classified in a manner like urban passenger mobility i.e. around three factors: Infrastructure, Transit Modes and ICT enablement.
Infrastructure
Most urban cities in India lack an efficient warehousing infrastructure. Warehouse ownership in India is highly fragmented, with 85% of warehouses owned by unorganized players. Warehouses also predominantly exist within the city limits. Fragmented warehouse footprint within city limits precludes freight pooling, leading to higher number of intra-city freight trips while also necessitating entry of HCVs in the city which adds to congestion.

18
Infrastructure for Intermodal connectivity
Integration of city’s transport modes and a seamless
connectivity including last mile passenger connectivity
Global best practices- Passenger mobilityto public transport can facilitate the use of public
transit and development of economic circles, as can be
seen in the case of Miami.
Freight carriage modes
Unlike developed countries, Indian cities still have large number of non-motorized freight carriers like hand carts, pedal carts, bicycles etc. A study by Professor S.L. Dhingra suggests that up to 25% of intra-city freight movement in Indian cities could be through non-motorized modes. In most cities, non-motorized modes routinely use main arterial roads of the cities and congest traffic in case of mixed stream traffic.
ICT enablement
Several solutions around vehicle tracking, fleet
management, packing and route optimization are available. However, these digital solutions have still not picked up in urban freight management. Simple tracking and tracing solutions offer little benefit in the short haul freight carriage. Other technologies like route optimization for tertiary and last mile freight distribution are relatively new and have seen limited adoption due to reasons like: unproven benefits, dominance of point to point movement and unorganized nature of trucking industry.
Case Study 1: Miami Intermodal Center
Situation- Florida Department of Transportation envisaged Miami Intermodal Center to improve
connectivity in Miami Dade County & improve connectivity to International Airport
Solution- Construction of Miami Intermodal Centre brought together the Airport, the central train station
and a major car rental station. Key features of this station are-
• Automated people mover to connect airport, train station and car rental center
• Miami central station and an inter-city bus center
• Metrobus connecting Miami with central station
• Roadway improvement project and a user-friendly car rental center
Impact- Multimodal connectivity reduced congestion on the important corridor connecting airport. Rental
car shuttles were eliminated and replaced with MIA mover, thus reducing unnecessary intra city movement.
It is estimated that 30% traffic was reduced from the roadways.
(Source- MIC, Florida Department of Transport)
While development of Multi modal stations along MRTS
network can shape commuters’ preferences towards
public transit, finding enough land parcels for
development of these stations may prove to be a major
challenge in India. Such challenges call for radical and
innovative solutions. Case study on city of Seoul
describes one such solution.
19
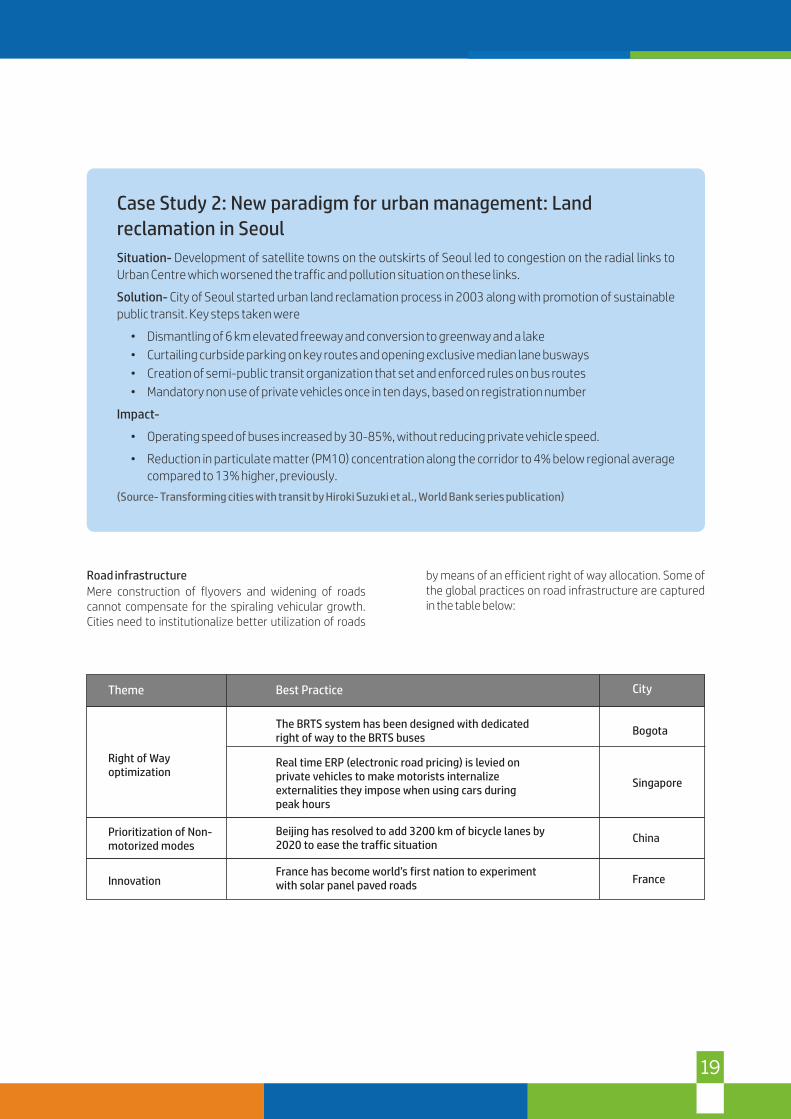
Case Study 2: New paradigm for urban management: Land
reclamation in Seoul
Situation- Development of satellite towns on the outskirts of Seoul led to congestion on the radial links to
Urban Centre which worsened the traffic and pollution situation on these links.
Solution- City of Seoul started urban land reclamation process in 2003 along with promotion of sustainable
public transit. Key steps taken were
• Dismantling of 6 km elevated freeway and conversion to greenway and a lake
• Curtailing curbside parking on key routes and opening exclusive median lane busways
• Creation of semi-public transit organization that set and enforced rules on bus routes
• Mandatory non use of private vehicles once in ten days, based on registration number
Impact-
• Operating speed of buses increased by 30-85%, without reducing private vehicle speed.
• Reduction in particulate matter (PM10) concentration along the corridor to 4% below regional average
compared to 13% higher, previously.
(Source- Transforming cities with transit by Hiroki Suzuki et al., World Bank series publication)
Road infrastructure
Mere construction of flyovers and widening of roads cannot compensate for the spiraling vehicular growth. Cities need to institutionalize better utilization of roads
Theme
Right of Way optimization
Prioritization of Nonmotorized modes
-
Innovation
Best Practice
The BRTS system has been designed with dedicated right of way to the BRTS buses
Real time ERP (electronic road pricing) is levied on private vehicles to make motorists internalize externalities they impose when using cars during peak hours
Beijing has resolved to add 3200 km of bicycle lanes by 2020 to ease the traffic situation
France has become world’s first nation to experiment with solar panel paved roads
City
Bogota
Singapore
China
France
by means of an efficient right of way allocation. Some of the global practices on road infrastructure are captured in the table below:

20
City Bus-stop infrastructure
Global best practices in bus-stop design focus on accessibility and improved passenger amenities. Select
best practices in bus stop design are captured in the graphic below.
Figure 3: Global best practices in bus stop design
Trends in transit modes
With the advent of ride sharing and vehicle sharing platforms, there are early signs of declining propensity of private vehicle use as well as stagnating conventional public transit use in some cities in affluent nations. In US, driving license penetration is declining across age groups. Subway ridership and conventional para transit
ridership is also seeing stagnation or decline in some of the US cities. On the other hand, mobile app based taxi hailing services like Uber have seen huge growth. We expect an increased propensity of users towards personalized service, better connected modes and a shared economy in Indian cities as well:
Figure 4: Trend in urban transit modes for India

21
Trends in transit technologies: New transit technologies are connecting commuters with transit services to provide a seamless mobility experience. Digital solutions
are emerging for each segment of commuter’s journey. Figure 6 below captures some of the ICT solutions.
Figure 6: ICT technologies for passenger transportation
Global best practices in urban freight mobility
Trends in infrastructure
An interface between long haul inter-city and last mile urban freight transport enables freight aggregation. Multi modal logistics hubs at city periphery enable
efficient freight aggregation. Large scale operations of these hubs allow for investments in infrastructure like rail/ road networks and ICT implementation.
Case Study 3: Center Point Intermodal Center- Elwood, Illinois
Situation- Center Point was formerly a military base and it was decided to convert it to a logistics park to provide economic boost to the area.
Solution- Center Point Intermodal Center was set up as a public private investment. Total investment was
around $1 billion. Key features of the intermodal center are
• PPP model with private player managing operations & public authority regulating service
• 2500+ acres integrated logistics center; 1400-acre industrial park
• 100-acre equipment management area
• 12+ million square feet of industrial facilities
• Rail connectivity
Impact- Setting up of logistics park enabled streamlining of long haul as well as short haul freight movement. As per Center Point’s estimate, a 500,000 sq.ft distribution facility in the center could save as much as $500,000 annually in drayage.

22
Recommendations for Passenger mobilityInfrastructure
Improve multimodal connectivity- India has planned to construct a network of multimodal stations, integrating intercity rail and bus as well as the urban transit modes l ike MRTS, paratransit and private vehicles. Development of inter-modal stations was also committed in India’s Union Budget 2017 and the stations
at Nagpur and Varanasi are in DPR stages. Urban transport agencies are also promoting multi modal connectivity. DMRC, for instance, is planning 9 multi modal stations on the under-construction metro lines 7 and 8. In as many as 20-25 cities of India, MRTS networks are under different phases of planning or construction. India should promote multimodality at key stations in
Trends in freight carrying modes
EU nations, with almost 100% motorization of urban transit, are promoting electric and non-motorized freight transit, since these modes produce fewer
emissions, generate less noise and have lower safety risk for pedestrians. The case study below presents the initiatives taken in European Union towards integrating non-motorized modes in urban freight logistics.
Case Study 4: CYCLELogistics in EU
Situation- CYCLELogistics project aims to move 25%-33% urban deliveries through cycles/ non-motorized
modes to cut GHG emissions by integrating the bicycles for last mile delivery.
Solution- EU is actively promotingnon-motorized logistics and has taken following initiatives-
• Cyclelogistics Federation delivered training for cargo bikes usage & setting up IT solutions
• Participating municipalities to set up consolidation-centers, implement low-emission zones
• End users to be made aware of their market shaping powers
Impact-
• These measures have led to setting up and expansion in operations of about 110 specialized cycling
couriers services.
• Multiple EU nations have come up with funding schemes for cargo bikes
(Source- https://ec.europa.eu/energy/intelligent/projects/en/projects/cyclelogistics, ECF website)
Trends in technology
• Fleet management
Fleet management solutions are moving beyond simple tracking and remote diagnostic technologies to advanced solutions like route optimization, truck size selection, improving packing efficiency. These features focus on better monitoring as well as enhanced asset utilization. Apart from the OEMs, startups have devised numerous solutions for fleet management. Some of the prominent global startups in this space are: Zonar systems which provides solutions in pre-post trip inspection and Peloton which provides solutions for improving fuel efficiency and collision avoidance.
• Demand management
Advancements like online freight exchanges, on-demand truck placement etc. have emerged in the market. Some companies like Convoy are already gaining traction in US in this space and disrupting the short-haul, less than truckload ecosystem by providing on-demand, guaranteed trucks as well as shipment management through real-time tracking and billing/ payment through app. Indian trucking eco-system which comprises on manual demand matching through brokers and large number of small trucking firms can gain from these advances. Newer technologies like UAVs/ drones are also emerging.
23
these new MRTS systems. Government should draw a policy framework that ties in relevant government entities and private operators. Framework should specify clear roles and responsibilities along with sources of investment. A coordinating agency (like UTTIPEC- Unif ied Traffic and Transportation Infrastructure Planning & Engineering Centre of Delhi-NCR) should work in close coordination with MRTS corporations, road transport authorities, urban local bodies of the city to develop a blue print of the multi modal stations.
Transit Modes
• Regulatory framework for new transit modes
A decisive policy framework should be adopted that can enable integration of new modes into city transit network. For example, India’s Motor Vehicle (amendment) act, 2016 aims to bridge the existing policy gap for taxi aggregators, by laying out clear guidelines for taxi aggregators as well as the state governments to promulgate laws to regulate the services. A clear regulatory framework should be created to integrate these modes seamlessly with city transport, which can enable collaboration with public transit for efficient last mile connectivity.
• Uptake of innovations in transit modes
Proposed Motor Vehicle (amendment) Act, 2016, could allow for testing of driverless cars in India. India is also exploring option for introduction of innovative modes like electric vehicles. There is also a proposal to set up Private Rapid Transit System in NCR. Timely offtake of these new technologies can be ensured by accelerating regulatory clearances as well as co-development of specifications by Government agencies like NHAI and the OEMs.
ICT Implementation: Multi Modal Mobile application for virtual integration of transit modes
Indian Railways has decided to develop an integrated mobile application which would integrate rail tickets with taxi booking. Ministry of Road Transport and Highways is also in the process of building a multimodal mobile application. India should aim for a systematized approach for full scale virtual integration spanning multimodal scheduling, passenger information and e-reservations. Policy and guidelines are also required to ensure access of private players to travel and real-time information for different government run public transit modes.
Recommendations for freight mobilityInfrastructure: Efficient hub and spoke model
Government has planned to set up 35 large scale Multi
Modal logistics park in India with an investment of INR
50,000 crores, through PPP mode. As next steps, the
Government should incentivize investments by 3PL
operators, road and highway companies, railway freight
operators and end user industries in warehousing sector.
Freight carriage modes
• Integrating non-motorized modes with urban
logistics
Non-motorized modes should be integrated with
the city logistics chain for the last mile delivery.
Some of the interventions that should be
considered are: restricting usage of non-
motorized modes on main arterial roads,
designated lanes for bicycles and cargo cycles,
novel initiatives like freight information portal to
also list available non-motorized modes,
incentivize last mile parcel delivery through non-
motorized modes by means of tax credits etc.
• Promotion of alternate technologies
Promotion of alternate technologies like electric and hybrid vehicles can help India reduce GHG emissions. India should aim to adopt a legislation to facilitate development and use of alternate technologies like electric/ hybrid trucks by means of tax breaks and subsidies.
ICT enablement
Large number of discrete solutions for have come up with the features like fleet tracking, route optimization, loading optimization, RFID tracking, packing efficiency enhancement etc. Creation of strategic plans for these technologies along with joint programs and supporting framework for information sharing can enable accelerated dissemination of these technologies. It is also important to build conducive regulatory environment for new technologies like drones. Indian regulators should designate test sites for drone testing and allow experimental licenses to drone developers. Designated test sites would not only enable regulators to maintain a check but also provide favorable environment for R&D spend.

24


India has a robust transport infrastructure comprising of 5.25 Million km of road network, 1,20,000 km of railway network, 7,500 km coastline with 13 Major Ports and 205 Minor Ports and 125 airports. Additionally, India has a network of 14,500 km of navigable inland waterways. However, Logistics Performance Index (LPI) – a ranking
published by World Bank to measure logistics performance of countries – ranks India at 35, primarily due to suboptimal modal mix and inefficient logistics operations. India not only lags the developed countries on the LPI ranking, but ranks low compared to other Asian countries as indicated below:
Introduction
Germany UK USA japan India
4.23 4.07 3.99 3.973.42
Figure 7: LPI score comparison between India and leading developed countries
Source: LPI Reports
Germany UK USA japan India
4.23 4.07 3.99 3.973.42
Figure 7: LPI score comparison between India and leading developed countries
Source: LPI Reports
26

27
India’s logistics cost as a % of its GDP stands at 13-14%, and the same has doubled over last 15 years. This is very high compared to the other developed countries,
pointing to the inherent inefficiencies in the freight movement in the country:
1. Capital costs include EMI and Depreciation costs
2. Fixed costs include Types and Vehicle Maintenance costs, Driver salaries, annual vehicle & third- party insurance, national permit, road tax and fitness certification fee
3. Operating costs Include fuel, toll and loading and unloading
4. Purchasing Power Party (PPP) 1 USD = INR 17
5. Other Include loading and unloading cost
Freight Cost Benchmarking
Freight cost(as a % of GDP)
13 - 14%
8 - 10% 9 - 10%
India US Other development
countriesFreight cost trend - India(as a % GDP)
Freight Cost Breakup
Freight cost comparison4
(INR/t-km, 20 MT Payload, PPP Basis
Variable3costs
Fixed operating
2costs
1Capital costs
India USA
Fuel Cost
Overheads
Capital costs7-8% 8-9%
10-11%13-14%
2000 2005 2010 2014
5Other
Toll tax
Fuel
Insurance permit, Tax
Maintenance
Salaries
7%
11%
34%
3%12%
15%
17%
28%
50%
22%
1.9
0.9
Figure 3: Freight cost benchmarking
Source: Secondary Research, ISID, TCIL – IIMC Study, Should-Cost model developed for Mumbai – Delhi route for a Full Truck Load
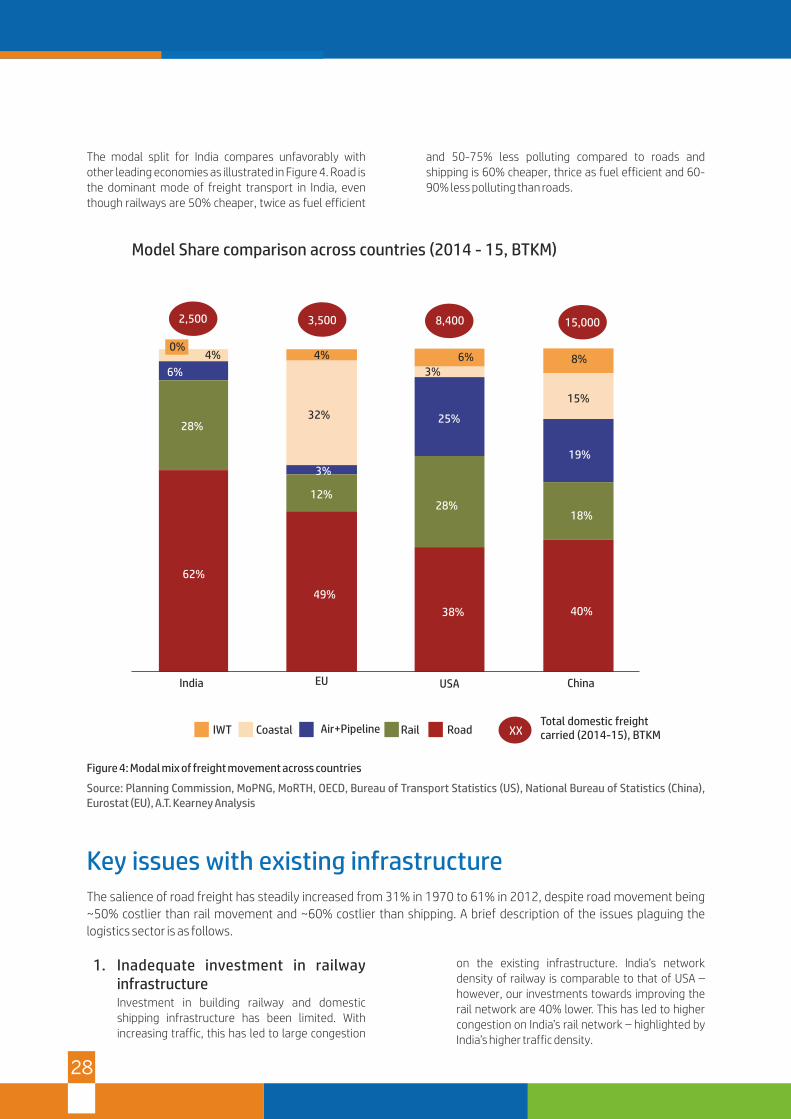
The modal split for India compares unfavorably with other leading economies as illustrated in Figure 4. Road is the dominant mode of freight transport in India, even though railways are 50% cheaper, twice as fuel efficient
and 50-75% less polluting compared to roads and shipping is 60% cheaper, thrice as fuel efficient and 60-90% less polluting than roads.
4%
6%
28%
62%
4%
32%
3%
12%
49%
6%3%
25%
28%
38%
8%
15%
19%
18%
40%
2,500 3,500 8,400 15,000
India EU USA China
XXTotal domestic freightcarried (2014-15), BTKMIWT Coastal Air+Pipeline RoadRail
0%
Model Share comparison across countries (2014 - 15, BTKM)
Figure 4: Modal mix of freight movement across countries
Source: Planning Commission, MoPNG, MoRTH, OECD, Bureau of Transport Statistics (US), National Bureau of Statistics (China), Eurostat (EU), A.T. Kearney Analysis
Key issues with existing infrastructureThe salience of road freight has steadily increased from 31% in 1970 to 61% in 2012, despite road movement being
~50% costlier than rail movement and ~60% costlier than shipping. A brief description of the issues plaguing the
logistics sector is as follows.
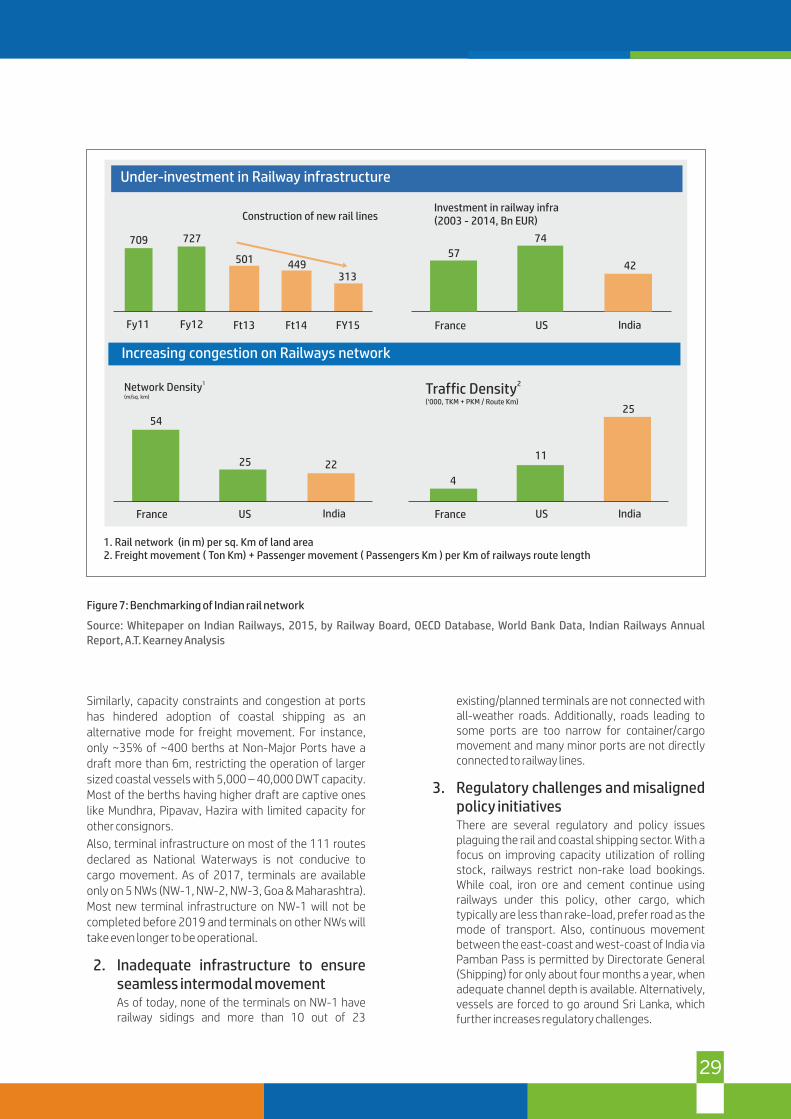
1. Inadequate investment in railway infrastructureInvestment in building railway and domestic shipping infrastructure has been limited. With increasing traffic, this has led to large congestion
on the existing infrastructure. India’s network density of railway is comparable to that of USA – however, our investments towards improving the rail network are 40% lower. This has led to higher congestion on India’s rail network – highlighted by India’s higher traffic density.
28
29
1. Rail network (in m) per sq. Km of land area2. Freight movement ( Ton Km) + Passenger movement ( Passengers Km ) per Km of railways route length
Construction of new rail lines
709 727
501 449313
Fy11 Fy12 Ft13 Ft14 FY15
France US India
54
25 22
2Traffic Density(‘000, TKM + PKM / Route Km)
4
11
25
57
74
42
1Network Density(m/sq. km)
France US India
France US India
Investment in railway infra(2003 - 2014, Bn EUR)
Under-investment in Railway infrastructure
Increasing congestion on Railways network
Similarly, capacity constraints and congestion at ports has hindered adoption of coastal shipping as an alternative mode for freight movement. For instance, only ~35% of ~400 berths at Non-Major Ports have a draft more than 6m, restricting the operation of larger sized coastal vessels with 5,000 – 40,000 DWT capacity. Most of the berths having higher draft are captive ones like Mundhra, Pipavav, Hazira with limited capacity for other consignors.
Also, terminal infrastructure on most of the 111 routes declared as National Waterways is not conducive to cargo movement. As of 2017, terminals are available only on 5 NWs (NW-1, NW-2, NW-3, Goa & Maharashtra). Most new terminal infrastructure on NW-1 will not be completed before 2019 and terminals on other NWs will take even longer to be operational.
2. Inadequate infrastructure to ensure seamless intermodal movementAs of today, none of the terminals on NW-1 have railway sidings and more than 10 out of 23
Figure 7: Benchmarking of Indian rail network
Source: Whitepaper on Indian Railways, 2015, by Railway Board, OECD Database, World Bank Data, Indian Railways Annual Report, A.T. Kearney Analysis
existing/planned terminals are not connected with all-weather roads. Additionally, roads leading to some ports are too narrow for container/cargo movement and many minor ports are not directly connected to railway lines.
3. Regulatory challenges and misaligned policy initiatives There are several regulatory and policy issues plaguing the rail and coastal shipping sector. With a focus on improving capacity utilization of rolling stock, railways restrict non-rake load bookings. While coal, iron ore and cement continue using railways under this policy, other cargo, which typically are less than rake-load, prefer road as the mode of transport. Also, continuous movement between the east-coast and west-coast of India via Pamban Pass is permitted by Directorate General (Shipping) for only about four months a year, when adequate channel depth is available. Alternatively, vessels are forced to go around Sri Lanka, which further increases regulatory challenges.
30
4. Lack of integrated planningWhile the pace of highway construction in the country has gone up in the past few years, the planning for highway upgradation in the country has been ad-hoc and driven primarily by local considerations, with limited focus on large-scale network planning. Corridor approach to road development is in nascent stage in India, with most of the development happening on individual stretches, with limited emphasis on maintaining uniform infrastructure between the origin and the destination of the corridor.
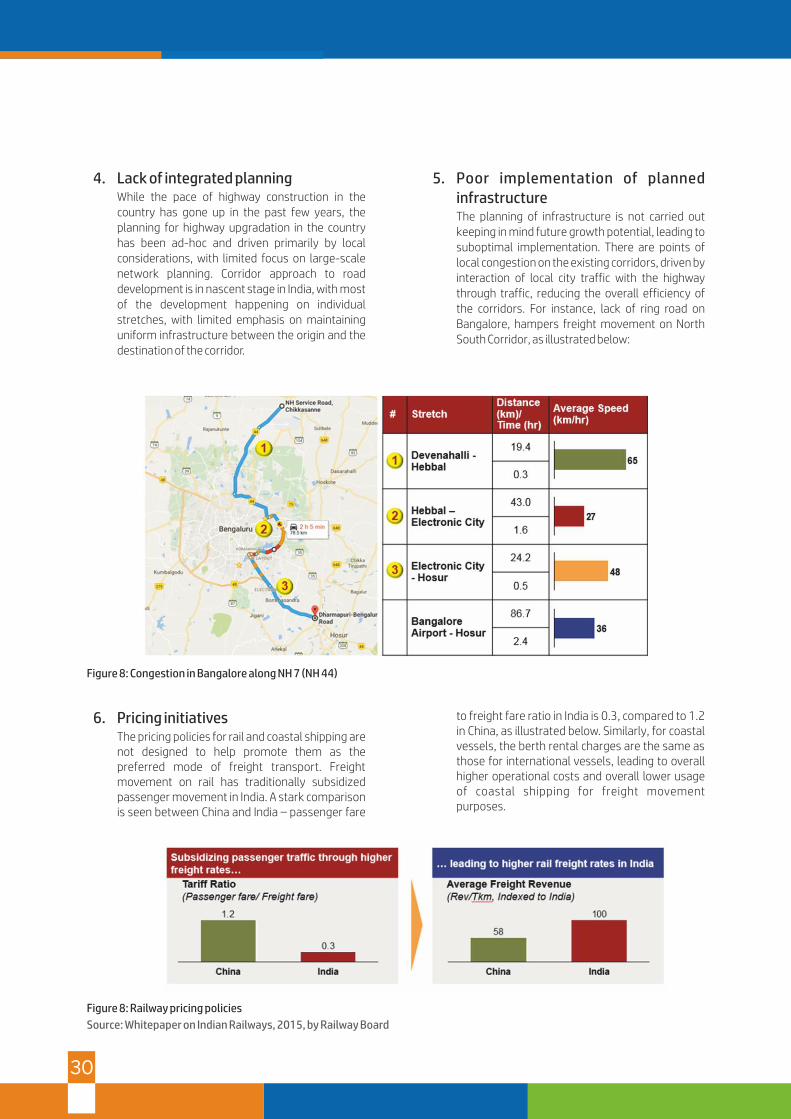
5. Poor implementation of planned infrastructureThe planning of infrastructure is not carried out keeping in mind future growth potential, leading to suboptimal implementation. There are points of local congestion on the existing corridors, driven by interaction of local city traffic with the highway through traffic, reducing the overall efficiency of the corridors. For instance, lack of ring road on Bangalore, hampers freight movement on North South Corridor, as illustrated below:
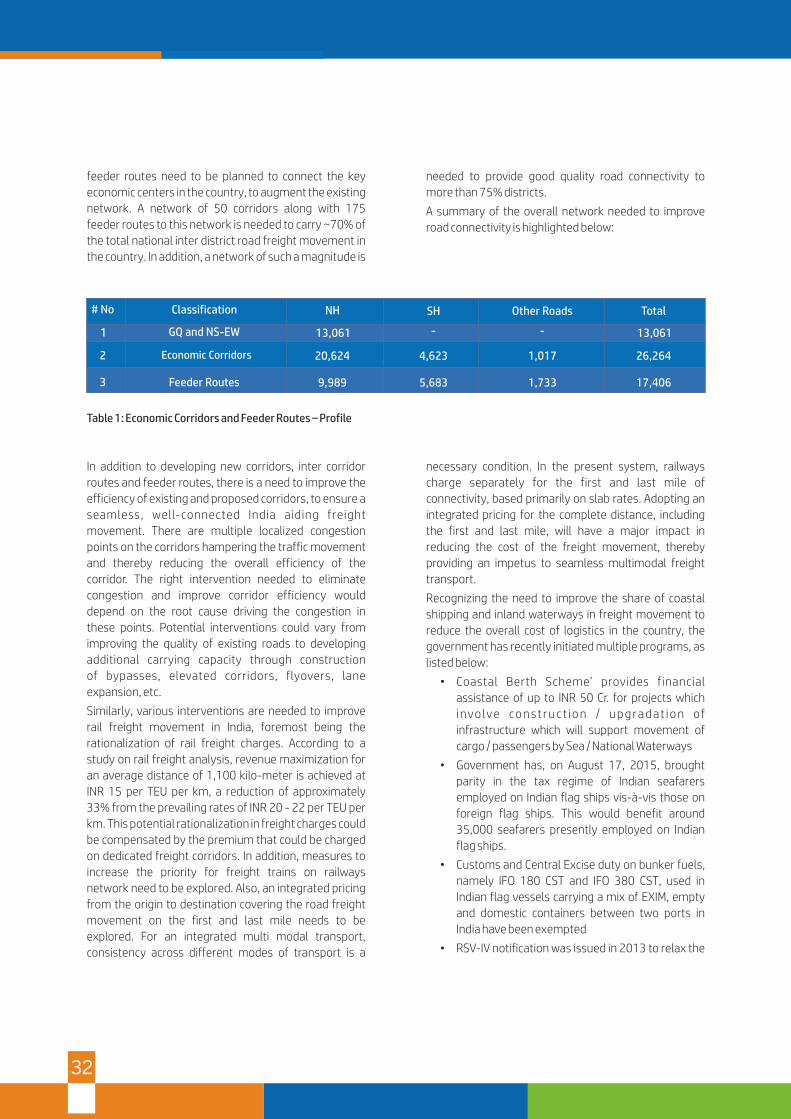
6. Pricing initiativesThe pricing policies for rail and coastal shipping are not designed to help promote them as the preferred mode of freight transport. Freight movement on rail has traditionally subsidized passenger movement in India. A stark comparison is seen between China and India – passenger fare
Figure 8: Congestion in Bangalore along NH 7 (NH 44)
to freight fare ratio in India is 0.3, compared to 1.2 in China, as illustrated below. Similarly, for coastal vessels, the berth rental charges are the same as those for international vessels, leading to overall higher operational costs and overall lower usage of coastal shipping for freight movement purposes.
Figure 8: Railway pricing policies
Source: Whitepaper on Indian Railways, 2015, by Railway Board

31
There are multiple global examples of successful
implementation of development of road and rail
corridors. Developed economies have also focused on
developing infrastructure to enable shifting of freight
from congested roads onto rail, coastal shipping and
inland waterways. A successful example is the core
network of corridors aimed at providing multi modal
connectivity throughout EU. The following are some of
the network corridors identified:
1. The Rhine-Alpine Corridor is one of the busiest
freight routes in Europe. The corridor connects the
North Sea ports at Rotterdam and Antwerp to the
Mediterranean basin.
2. The Atlantic Corridor links the Western region of
the Iberian Peninsula to Paris and further to
Mannheim with rail lines (conventional and high
speed). This corridor also includes the Seine as an
inland waterway.
3. The Mediterranean Corridor links the Iberian
Peninsula with the Hungary-Ukraine border
region. The 3,000 kilometer corridor provides
multimodal connectivity to the ports of western
Mediterranean region with the Centre of the
European Union.
4. The North Sea-Baltic Corridor – connects the ports
of eastern end of Baltic Sea with the Northern Sea
ports. The corridor provides road and rail transport
links between the Baltic states and Poland,
Germany, Netherlands, Belgium. This corridor also
includes inland waterways. The most important
Global examples of multi-modal corridor developmentproject in this corridor is “Rail Baltic”, which
provides rail connectivity between regions of
Tallinn, Riga, Kaunas and Poland.
5. The North Sea-Mediterranean Corridor stretches
from Ireland to the Mediterranean Sea in southern
France. The multimodal corridor includes inland
waterways in Benelux and France, providing
multimodal connectivity from North Sea ports to
Maas, Rhine, Seine etc.
Countries in Eastern Africa have majorly invested in
development of transportation corridors to facilitate
economic liberalization and trade. The Northern Corridor
is a transport corridor linking the capital cities of Burundi,
Rwanda, Uganda and Kenya with the port of Mombasa in
Kenya. The corridor is a multi-modal corridor integrating
road, rail, inland waterways and pipeline transport.
Following key best practices and lessons emerge from
the assessment of global examples
• Ensure simultaneous development of consistent
infrastructure along the corridor
• Different modes of freight movement should
complement each other instead of competing for
cargo - Allied infrastructure and intermodal
connectivity is essential to improve the overall
efficiency of the corridor
• Most optimum mode of project execution needs to
be finalized based on the economic attractiveness
of different stretches of corridors and market
constraints.
A scientific approach with focus on connecting centers of
economic importance in the most efficient way is needed
to identify and prioritize the next wave of development in
the country. This will enable improvement in the logistics
efficiency of the country through a reduction. In addition,
an integrated multimodal development approach is
essential to ensure a consistent congestion free
carriageway infrastructure along key corridors. Specific
measures need to be taken for each mode to ensure
best-in-class practices are adhered to. However, at the
same time, it is important to ensure there is alignment
on the development plan among different public and
private agencies, to ensure seamless multimodal
connectivity. For this, a central authority for managing
Connectivity Enhancement – Need for Holistic Network Development
the overall infrastructure and facilities is ideal. The
central authority must ensure coordinated planning
across different modes and presence of intermodal
connectivity for seamless movement of freight
throughout the country.
Apart from the measures for ensuring coordination and
complementarity between different modes, including
the development of multimodal logistics parks in key
locations and intermodal connectivity, specific measures
are being taken to improve the state of individual modes
as discussed below.
To improve the road network in the country, a
comprehensive network of corridors and associated
32
feeder routes need to be planned to connect the key
economic centers in the country, to augment the existing
network. A network of 50 corridors along with 175
feeder routes to this network is needed to carry ~70% of
the total national inter district road freight movement in
the country. In addition, a network of such a magnitude is
needed to provide good quality road connectivity to
more than 75% districts.
A summary of the overall network needed to improve
road connectivity is highlighted below:
Table 1: Economic Corridors and Feeder Routes – Profile
In addition to developing new corridors, inter corridor
routes and feeder routes, there is a need to improve the
efficiency of existing and proposed corridors, to ensure a
seamless, well-connected India aiding freight
movement. There are multiple localized congestion
points on the corridors hampering the traffic movement
and thereby reducing the overall efficiency of the
corridor. The right intervention needed to eliminate
congestion and improve corridor efficiency would
depend on the root cause driving the congestion in
these points. Potential interventions could vary from
improving the quality of existing roads to developing
additional carrying capacity through construction
of bypasses, elevated corridors, flyovers, lane
expansion, etc.
Similarly, various interventions are needed to improve
rail freight movement in India, foremost being the
rationalization of rail freight charges. According to a
study on rail freight analysis, revenue maximization for
an average distance of 1,100 kilo-meter is achieved at
INR 15 per TEU per km, a reduction of approximately
33% from the prevailing rates of INR 20 - 22 per TEU per
km. This potential rationalization in freight charges could
be compensated by the premium that could be charged
on dedicated freight corridors. In addition, measures to
increase the priority for freight trains on railways
network need to be explored. Also, an integrated pricing
from the origin to destination covering the road freight
movement on the first and last mile needs to be
explored. For an integrated multi modal transport,
consistency across different modes of transport is a
necessary condition. In the present system, railways
charge separately for the first and last mile of
connectivity, based primarily on slab rates. Adopting an
integrated pricing for the complete distance, including
the first and last mile, will have a major impact in
reducing the cost of the freight movement, thereby
providing an impetus to seamless multimodal freight
transport.
Recognizing the need to improve the share of coastal
shipping and inland waterways in freight movement to
reduce the overall cost of logistics in the country, the
government has recently initiated multiple programs, as
listed below:
• Coastal Berth Scheme’ provides financial
assistance of up to INR 50 Cr. for projects which
involve construct ion / upgradat ion of
infrastructure which will support movement of
cargo / passengers by Sea / National Waterways
• Government has, on August 17, 2015, brought
parity in the tax regime of Indian seafarers
employed on Indian flag ships vis-à-vis those on
foreign flag ships. This would benefit around
35,000 seafarers presently employed on Indian
flag ships.
• Customs and Central Excise duty on bunker fuels,
namely IFO 180 CST and IFO 380 CST, used in
Indian flag vessels carrying a mix of EXIM, empty
and domestic containers between two ports in
India have been exempted
• RSV-IV notification was issued in 2013 to relax the
Economic Corridors
Classification NH SH Other Roads Total
GQ and NS-EW 13,061 - - 13,061
20,624 4,623 1,017 26,264
# No
1
2
3 Feeder Routes 9,989 5,683 1,733 17,406
3332
Details of the potential benefits of adopting a corridor
approach to development of transportat ion
infrastructure are highlighted below:
• Average Speed Improvement: Average speed of
freight vehicles plying on the road corridors is
expected to increase by 10-25% once the choke
points on the corridors are removed and adequate
lane infrastructure is provided on these corridors.
Additionally, the Dedicated Rail Freight Corridors
are expected to double the average speed of
freight trains.
• Fuel ef f i c ienc y improvement : Wi th an
improvement in average speed of vehicles by 15-
20%, the fuel efficiency of freight vehicles is
Corridor development – Expected Impactexpected to increase by 2–3%. Also, favorable
shift of freight from road to rail and water will
result in reduction in CO2 emissions by 50-90%
• Tu r n a rou n d t i m e r e d u c t i o n : S ea m l e ss
intermodally and robust last-mile infrastructure
will help reduce turnaround time for cargo in India,
leading to considerable savings for end-users
In summary, the interventions planned will enable a
reduction of 5 – 6% in the overall logistics costs in the
economy. It is hoped that all the involved stakeholders
will recognize the need for a collaborative effort to
improve the state of logistics in India and help make the
logistics in India cheaper, greener and more efficient.
specifications for construction and manning of
river-sea vessels – this has reduced the operating
cost by ~20% and construction cost by ~10%
• Service Tax on coastal shipping has been abated to
be bring it at par with road and rail
• Coastal vessels have been exempted from filling a
bill of coastal goods at load ports and bill of entry
at the discharge ports
However, to fully realize the potential of coastal shipping
and inland waterways, there is a need for both policy
interventions and infrastructural investments, as listed
below
• A comprehensive policy needs to be developed,
with inputs from shipping companies, shipyards,
ports, end-users and other stakeholders to
support coastal & inland shipping.
• Infrastructure development (terminals, berths,
cargo handling equipment, storage facilities,
navigational aids, dredging etc.) on NWs and Non-
Major Ports, along with creation of last-mile
connectivity (road/rail), will need to be fast-
tracked
• Dedicated berths should be provided at Ports for
coastal vessels which will bypass customs
procedures and ensure that turnaround time is
reduced
• Skills and capabilities should be improved by
introducing tailored training programs for design,
operations and maintenance of inland and coastal
vessels.

34

36
The new GST paradigm in taxation increases importance of logistics in order to derive supply chain efficiencies and improve business competitiveness. In this perspective, the immediate focus of organisations must be on development of storage innovations, transportation, standards and skilled resources.
Logistics comprises of storage and transport sectors. The storage segment can be broadly categorized as general purpose ambient temperature and post-harvest ambient and temperature controlled storages.
The present policy post-harvest ambient and temperature controlled warehouses are considered as infrastructure with evolving rules and regulations based on estimated demand. However, such infrastructure status for general purpose ambient temperature would encourage development of logistics sector and improve non-agri supply chain efficiencies in the country.
Introduction
• Multi modal transport is witnessed in post-harvest supply chains across state owned Food
Corporation of India and other storage facilities.
• The Negotiable Warehouse Receipt provides scope for improved financing through
commodities exchanges and collateral management services.
• Development of 42 Mega Food Parks and 234 Cold Chain Projects is aimed at reducing the
annual post-harvest losses that are currently estimated at Rs. 92,000 crores.
i. Moving away from tax driven supply chains: GST enables organizations to move away from the practice of tax driven
supply chains and become truly efficient and effective supply chains.
ii. Towards supply chain transformation: Goods and Services Tax (GST) with four tier rate structure triggered supply chain
transformation initiatives across sectors.
a. This fundamental change in tax structure is driving revision of sourcing, transportation, information systems and
marketing organizations across the sectors.
iii. Leading to economic development: The net impact of GST implementation is expected to be on improved demand and
net profit margins.
a. Transforms India into a single market and pave the way for Indian companies to gain competitive advantage in Indian
and overseas markets.
b. In long run GST implementation is expected to result in economic development and positive investor outlook.
Benefits of GST • Simplified indirect tax system (subsumes ranges of central and state taxes)
• Improves transparency and base of tax collections through GSTN online
• Aims at providing level playing field for Indian goods and services companies
• Clarifies definitions related to new channels and business models such as e-commerce and e-commerce operators
• Removes ambiguity in tax planning as harmonized system of nomenclature is adapted for classification of goods and
services (CGST, SGST/ UTGST, IGST)
• Provides impetus to demand by encouraging companies to pass on reduction of tax incidence to end customers
• Increases scope for operational efficiency based supply chains planning
• Increases demand for inland container depots, large scale warehousing, automated material handling and higher
capacity trucks
• Provides service tax credit to manufacturers using inbound logistics services from logistics service providers
• Input tax credit reconciliation process through GST Network may lead to vendor consolidation and reduce tax leakage

37
GST compliance costs As per the GST bill, every supplier shall be liable to be registered under this Act in the State or Union territory, other than special
category States, from where he makes a taxable supply of goods or services or both. For example, if a company registered in
Tamil Nadu is doing business in three other states namely Karnataka, Andhra Pradesh and Telangana, must be registered
separately in each state.
A dual levy where the Central Government will levy and collect tax in the form of central goods and
services tax and the State Government will levy and collect tax in the form of state goods and
services tax on intra-State supply of goods or services or both”
-The Central Goods and Services Tax Bill, 2017
A Tamil Nadu based integrated logistics service provider having clientele in three states need to
manage compliance requirements with separate registrations. With the dual levy GST system,
logistics service providers compliance costs are likely to increase because of input tax credits.
However, from the user company perspective, decisions such as consolidation of warehouse
facilities may result in reduction in overall inventory levels and improved transport utilization.
The total logistics cost is expected to reduce with optimal logistics planning.
Emerging changes in supply chains
Post GST two main characteristics of emerging supply chain models may be noticed sourcing and procurement and
profitability (costing, pricing and margins) management areas.
Revisiting sourcing & procurement
The supplier performance is not only going to be measured with metrics such as on-time and in-full deliveries, but also on
compliance with GST for possible input tax credits. However, guidelines related to reverse charge continue for non-resident
suppliers and small transport service providers.
“Reverse charge” means the liability to pay tax by the recipient of supply of goods or services or
both instead of the supplier of such goods or services or both under sub-section (3) or sub-
section (4) of section 9, or under sub-section (3) or subsection (4) of section 5 of the Integrated
Goods and Services Tax Act”.
- The Central Goods and Services Tax Bill, 2017
• No Counter Veiling Duty (CVD) exemption creating a level playing field for domestic players
• Possibility of less waiting time at interstate border check posts
• Valuation rules guided by transaction value based taxation principle would make Indian players competitive inside the
country and internationally

38
The Union Cabinet chaired by the Prime Minister Shri Narendra Modi has given its approval for
India's accession to the Customs Convention on International Transport of Goods under cover of
TIR Carnets (TIR Convention) and for completion of necessary procedures for ratification, for its
entry into force.
The Convention will help Indian traders to have access to fast, easy, reliable and hassle free
international system for movement of goods by road or multi- modal means across the territories
of other contracting parties.
Movement under the TIR can be allowed by checking only the seals and the external conditions of
the load compartment or the container thereby reducing border delays, transport and
transaction costs thereby leading to increased competitiveness and growth for the trade and
transport sectors.
i. Because of the possible changes in pricing of input materials, sourcing bases may be reviewed with proximity criteria for
savings in logistics cost. Some companies may revisit make or buy, local procurement or import decisions in such
context.
ii. The business models that were designed based on incentives offered in states like Uttarakhand, Jammu & Kashmir,
Himachal Pradesh, Andhra Pradesh and North-East states may have to check viability in case of withdrawal of such
incentives.
Revision of pricing, costing and margins
Introduction of GST triggers potential market changes with companies redefining supply chains factoring tax implications. Competition and “anti-profiteering clause” may drive companies to pass on gains of tax incidence to end customers in the form of price changes. As a result, companies have to re-plan considering “buy”, “make” and “sell” locations for better market share. Areas such as channel incentives, margins and final consumer pricing may be revised in the competitive environment.
Companies engaged in operations outsourcing and subcontracting may have to analyse the impact of GST on such contracts. This may lead to revision of outsourcing / subcontracting agreements with pricing revisions and negotiations.
i. Consolidation benefits
As companies may sell directly to the channel partners in any state, the decisions related to location and size of
warehouses (region / zone) become important. In such a scenario, inbound logistics costs may not change much, but
outbound logistics costs may vary because of inventory consolidation in warehouse leading to increased truck loads.
Also, the cost of enabling warehouses with information systems, additional resources would reduce.
ii. Input tax credits utilization
The monthly payment of GST may impact working capital requirement. Additional cash outflows are expected
neutralising the tax gains with inventory carrying cost and delay in tax credit claim due to dependency on inventory
turnover. It may be noted that “supplies without consideration and the concept of distinct persons” implies that stock
transfer under GST is taxable. Utilization of input credits is certainly an important factor.
“At a broader level, when compared to services companies, manufacturing companies seem to be
immediate beneficiaries as they have many inputs tax credits (including tax credits on services) to
reduce tax burden. However, productivity and market share become more important in future.”
39
“Logistics service providers with large warehouse foot print, organized transport network and
extendable information systems gain more prominence in the market.”
GST readiness: Five points to focus
Overall, the expected improved trade across states in India may encourage companies to focus on areas such as
• Fortifying demand locations aimed at improved market share, profitability and product availability
• Reengineering logistics network and estimate potential cost-service trade offs
• Revision of supplier performance measurement criteria and supplier contracts in case of outsourcing or subcontracting
• Revisiting make or buy or subcontract, indigenous purchase or import of input materials, tax or duty arbitrate gains,
services outsourcing contracts
• Dynamic adjustments to product pricing and margins for dealers to maintain competitive position in distribution
intensive sectors
The upcoming changes in the market indicate the opportunity for consolidation in logistics services and increased scope for organised players. Tax compliance costs may slightly increase, but the benefits outweigh such incremental costs with ease of doing business and improved operational efficiencies across the supply chains.
Exploring post-harvest supply chains
A total population of 1.21 billion, annually growing at
1.2% gives challenges to capture potential demographic
dividend. Infrastructure, employment and food security
areas warrant special attention. In this context, the focus
on food processing industry has become more
important and so the post-harvest supply chains.
The importance of post-harvest supply chains is
reflected in the GST policy with a consideration for
agriculture based products. While taxation is one
dimension, there are other dimensions such as storage,
transport, packing and energy that can enable
efficiencies in the post-harvest supply chains.
i. Food processing industry, is largest industry
sector in the country with an estimated worth of
USD 121 billion and is ranked 5th in terms of
production, consumption and exports.
ii. The Organized segment (25%), small scale
segment (33%) and unorganized segment (42%)
and contributes to 32% of the country’s total food
processing market.
iii. The growing corporate retail trends in India
suggest need for improving supply chain including
cold chain for food and beverages distribution.
Agriculture production outlook
A World Bank study estimated that post-harvest losses
of food grains in India are 7-10% of the total production
from farm to market level and 4-5% at market and
distribution levels. According to Ministry of Food and Civil
Supplies, Government of India, the total preventable
losses are estimated at 10% of the total production.
i. Production
a. India is the world’s second largest producer of
fruits (75.27 million tonnes) and vegetables
(150.56 million tonnes) each contributing
12.49% and 14.47% respectively to the total
world production.
b. India has highest livestock population with
50% of world’s buffalo population and 20% of
cattle population.
c. Organized dairy is 13% in India and the
remaining produce is either consumed at farm
level, or sold as fresh, non-pasteurised milk
through unorganized channels.
ii. Post-harvest losses
a. Post-harvest losses in horticulture crops are
estimated at 6-18%. Ministry of Food
Processing Industries estimates that
especially, processing of fruits and vegetables
at 2.2% of the total production in the country.
b. Post-harvest losses in poultry, meat, inland
fisheries and marine fisheries were observed
to be 3.7%, 6.9% and 2.9% respectively.

40
There is tremendous opportunity for reducing the post-harvest losses and processing the market
surplus into value added products in the country.
Food grains storage
Traditional & small scale storage
Traditionally, Indian farmers preferred farm level
indigenous storage structures that require continuous
maintenance and are not suitable for long period storage
requirements. The modern structures for small scale
storage include PAU bin (made of galvanised metal iron),
Pusa bin (made of mud, brick and polythene film) and
Hapur tekka (made of rubberised cloth and bamboo).
i. Modern large scale storage
The large scale storage is done in CAP (Cover and
Plinth) and silos.
a. The CAP structure is very economical and has a
plinth made of cement and concrete to store
bags and cover.
b. Silos are new generation grain storage
structures with 25000 tonnes capacity. They
are made of metal or concrete with conveyors
belts and mechanical operations.
ii. Users
Mainly traders, big farmers, cooperatives and
government agencies use warehouses. The
modern storage facilities are equipped with units
like cleaning and drying equipment.
iii. Silo systems
They cost 50% more than warehouses but pay
back in 2-3 years and offer greater advantage over
warehouse system by reducing the losses due to
moisture, rodents, insects, fungi and handling.
Storage capacity of with such systems is desired
for large scale storage requirements.
iv. Existing storage capacity
The storage capacity in India is spread across
central, state, cooperatives and private sector.
Food Corporation of India has its own network and
is augmented with central & state warehousing
corporation networks as well as private
warehouses. As on June 2016, the storage
capacity is about 811.94 lakh tonnes.
It is estimated that each grain bag unit is handled six times before processing leading to wastage and additional cost of handling.
v. Additional storage capacity
To meet the future demand with increasing
production and procurement of food grains,
Government of India implemented the Private
Entrepreneurs Guarantee (PEG) scheme to
augment with additional storage capacity of
150.80 lakh tonnes. As on May 2016, capacities of
134.45 lakhs tonnes have been added.
Negotiable Warehouse Receipts One of the notable steps towards development in the agri supply chains is the introduction of Negotiable Warehouse Receipts (NWR) in 2010 through Warehouse Regulatory Development Authority (WDRA) / Act. Under this act, Negotiable Warehouse Receipts can be issued by registered and accredited warehouses. About 123 agricultural commodities including cereals, pulses, oilseeds, vegetable oils, spices, edible nuts and 26 horticultural items such as potato, dehydrated onion, garlic, ginger, turmeric, apple, resins etc. were notified for issuing NWRs. Under WDRA, 1242 warehouses of CWC, SWCs, private sector, cold storages and primary agricultural cooperative societies with a storage capacity of 54.73 lakhs tonnes were registered as on June 2016.

41
Horticulture storage
The cross seasonal carry through of produce focused
cold chain development resulted in single bulk
commodity cold chain development at production end
for specific crops such as potato and dried chillies. The
residual crops constitute larger basket of items in
horticulture that require other infrastructure
components. The cold chain is now considered as an
important logistics element that connects supply and
demand locations. The required infrastructure is of three
types
a. Hard infrastructure involves storage at farm gate
such as modern pack houses with pre-coolers and
value adding units, term based storage such as
bulk cold storages and cold distribution hubs
connecting last miles such as retail stores. It also
includes temperature controlled transport units.
b. Soft infrastructure involves standards to define a
common glossary and procedures for handling the
produce and finished agri products. It also includes
skilled human resources for managing the supply
chain functions.
c. Digital infrastructure involves information
systems and intelligent devices such as data
loggers and location detectors that can provide
required information for various stakeholders in
the agri supply chain.
i. Segments
Cold chains are segmented based on storage
temperatures.
a. Products such as fresh & dry fruits, vegetables,
milk, eggs and pharma products are stored at
chilled temperature (0°C to 10°C).
b. The subtropical fruits like mangoes, banana,
papaya, dairy products like milk powder,
Cold chain infrastructure
chocolate and seeds require mild chilled
temperature (10°C to 20°C).
c. Items like frozen vegetables, fruit pulp, ice
cream, butter, fish and meat products require
frozen temperature (below – 18°C).
d. Many items like whole onion, dehydrated foods, roasted foods, sun-dried products, pickles, jams, jellies, ready to eat foods, oils and extracts require normal temperature (>20°C).
Based on the business model and location the chilled and mild chilled cold storages are categorised as cold room (staging), cold storage (bulk) and cold storage (hub). For specific produce such as apples, kiwi and pears globally Controlled Atmosphere (CA) technology enabled cold storages are used.
Segment-wise Segregation of Cold Storages
Source: India 2017, Reference manual, Publications Division Ministry of Information & Broadcasting

42
ii. Modern packing houses
To reduce post-harvest losses, a study conducted
by NABARD survey estimated that by 2020 India
requires 70,080 modern packing houses. These
packing houses located close to the farms or on
large farms would be primary sourcing points in
post-harvest supply chains. Such packing houses
are less than1% of required capacity in India
indicating a greater scope for development in this
space.
iii. Cold storages
Bulk Cold Storages with longer holding cycles
ranging from 8 to 10 months are generally located
close to harvest locations and are predominantly
store single commodities such as potatoes and
chillies. Whereas, Cold Storage Hubs with shorter
holding cycles ranging from 7 to 15 days are
relatively smaller facilities that are located near to
demand locations and serve as distribution
centres for fruits, vegetables, dairy and meat
products. The estimated requirement for cold
storages (bulk and hubs) is 3.2 million MT.
iv. Ripening chambers
Located close to the demand locations and
ripening chambers are important in future cold
chains. Only 11 % of required capacity is existing
indicating a greater scope for such facilities.
v. Reefer transportation
Long haul reefer transportation (6 Tons to 15 Tons
capacity) and last mile reefer transportation (<4
Tons capacity) are vital to maintain integrity in cold
chain. Only about 14% of the total estimated
requirement is available. There is a greater need to
strengthen this weakest link in cold chain.
Existing cold chain capacity and requirement in India 2014 – 2020
Source: All India Cold-chain Infrastructure Capacity Assessment of Status & Gap, 2015, NCCD
Single and multi-commodity cold storages
Consider cold chains of apples, mangoes and meat
products. All the three types of cold chains have different
sequence and requirement of cold chain facilities. This
typical characteristic of products influenced single
commodity cold storages. However, multi commodity
cold chains offer greater efficiencies. Given the holding
cycles, the future capacity building may consider designs
and technologies that can cater to multiple commodities
storage needs.

43
Storages for marine products
Marine products such as fish, shrimps require storage
facilities along the long Indian coast line. There are 479
cold storages, 29 chilled storages, 57 dry fish storages
and 32 other storage facilities totalling to 597 facilities
spread across in 13 locations along the coast line. These
facilities form an integral part of fish processing. While
Odissa has suitable conditions for fishing and offers
potential for marine products trade growth, Kerala,
Gujarat and Andhra Pradesh have highest cold storage
capacities for marine products in India.
Cold storages can extend the shelf life of fish that can
help in serving domestic market. The storage
temperature controls may vary from -10° C to -29°C to
maintain freshness from 3 weeks to 6 months for a
variety of marine products.
Centrally sponsored scheme for Cold-chain projects
The Government of India supports the development of
cold-chain through the Mission on Integrated
Development of Horticulture (MIDH) of the Ministry of
Agriculture and Farmers Welfare. MIDH provides several
incentives to interested stakeholders and promoters.
Financial assistance of 35% to 50% of admissible cost of
projects is granted. Benefits include
• L o w i n t e r e s t lo a n f ro m w a r e h o u s i n g
infrastructure fund (NABARD)
• 100% FDI through the automatic approval route,
and ECB route open
• Credit linked Subsidy to projects @ 35% to 50% of
admissible costs (MIDH)
• ST exemption on ‘erection, commissioning,
installation’ of Cold storage & transport
• Service Tax exemption for preconditioning,
storing, transporting agricultural produce
• Rewards of endless Demand, Smart-Bridge
between rural & urban, reduce Food loss
• Growing market for Fresh Fruits and Vegetables,
domestic and international
• Option to avail of Negotiable Warehousing
Receipts as per WDRA norms
• Investment Linked 150% Tax Deduction (Section
35-AD of IT Act)
Illustrative cold chain flows (apple, mango and meat products)

44
Select innovative solutions
Three constraints for the growth of cold chains in India
may be observed as below.
1. Energy makes upto 30% of the total expenses in a
cold storage. Technology should improve in order
to reduce entry barriers such as energy and
operating costs.
2. The uneven distribution of cold storages is
because of skewed investments in states like Uttar
Pradesh, Maharastra, Gujarat, Punjab and West
Bengal. Many of the warehouses cater to single
commodities.
3. Reefer vehicles play an important role in cold chain
function. They face supply constraint as only few
OEMs supply prebuilt reefer vehicles. Moreover,
the financing of reefer has comprises two interest
rates, one for chasis and the other for body and
refrigeration unit making overall financing cost
higher when compared to ordinary commercial
vehicles. Also the restrictions apply after 8th year
of operation of reefer vehicles that increases cost
of utility.
Select storage innovations in the areas of energy,
racking & material handling, storage structures, packing,
transport and information may provide solutions to
overcome the barriers for growth. Few such innovations
are listed below.
1. Hermetic storage
Airtight Cocoon is a system of hermetic storage
that protects dried commodities in humid and hot
climatic conditions. This storage system is an
alternative for fumigation or chemicals and can be
applied for indoor and outdoor storage
requirements. It is a cost effective solution
developed by US-Israel Science and Technology
Foundation and is adopted in Africa and far eastern
countries. The capacity of the system ranges from
5 MT to 900 MT.
2. Renewable energy
Water – energy – food nexus is an area that
requires special attention, particularly from cold
chains development perspective in India. Use of
renewable energies such as solar, wind and bio
mass energy to run dry /cold storages and pack
units would enable the reliable storage facilities
close to farm gates. Such reliable and affordable
power supply would provide impetus for multi
commodity cold chains in India.
3. Thermal storage solutions
While generation and supply of renewable energy
for solution tend to reduce energy costs of
storage, the Green House Gas emissions are
another important concern from climate change
perspective. Innovations in capturing the heat
from industrial processes through thermal
storage systems would enable integration of
electricity and heating solutions to be completely
based on renewable energy systems. For
example, the thermal storage solutions captured
in dairy processing and storage unit may be used
as a heating solution for the input stage of dairy
processing.
4. Pallet racks
Mobile compact pallet racks can provide more
storage space when compared to static racking
and in addition has potential to save energy costs
by reducing air escape. They can with stand
temperatures less than minus 4°C and can create
more space for activities such as kitting, repacking,
labelling and fulfilment services.
5. Pallet runners
Pallet flow racking systems in cold stores enable
First in First out (FIFO) operations. When
complemented with “Z” shaped push back and
pallet runner module the comprehensive pallet
racking system would provide greater operational
efficiencies in high throughput cold storages.
6. Packaging
Packing of frozen food is fast becoming important
with increasing customer expectations. The
packing must protect the food, present packed
content, maintain freshness and should not add
up the growing concern on packing waste.
Modified atmosphere packing methods such as
wax coating, permeable plastic or flushing with
gas such CO2 can extend the shelf life. Such
services could be offered through packing houses
in the start of cold chain.
7. Thermal covers
The use of thermal covers would not only maintain
the integrity of cold chain but also attempts to
reduce the wastage as it can be reusable.
However, the precondition for such packing is
standard pallet sizes and proper precooling.
8. Digitalisation
Increasing digitalisation trend offers numerous
opportunities by integrating network of farmers,
logistic companies, mandis and storage units.
Applications of new technologies such as cloud
computing, data analytics, smart sensors may
improve information chain and evolve new
business models such as market places and
aggregators.
45
Agri supply chains in India are evolving with process innovations. Innovations such as farming as a
service, data analytics for farm productivity, online aggregators and packing, storage and
temperature controlled transportation are indicating agri supply chain developments. EM3 agri
services, CropIn, AgRisk, Sabziwala, merakisan, farmery are few example companies.
i. Attract investments to develop technologies for
post-harvest handling, packaging, transport and
storage operations. Given the fragmented farming
structures in India, economically viable
technologies such as on farm drying, pre cooling
and storage would be valuable.
ii. Increase level of investments in research and
development of intelligent and low cost bulk agri
storage structures including controlled
atmosphere, modified atmosphere and hermetic
storages.
iii. Invite investments in modern storage facilities
such as silos with drying and cleaning facilities to
augment existing grains storage capacity in the
country.
iv. Since 2011-12 cold chain has been given
infrastructure status and viability gap funding was
Actionable agenda for stakeholders
provided. There must be fresh impetus for
investments in integrated cold chains and food
parks development including pre-coolers, reefer
vans and cold storages with proportionate storage
distribution across the country.
v. Provide incentives for using renewable energy
usage in modern storage facilities. Green building
and transport standards and certifications must
be encouraged with appropriate incentives at all
stages in post-harvest supply chains.
vi. Average capacity of cold storages in India is around
5000 MT which is relatively small when compared
with international averages. Standards shall be
developed reflecting the limitations of such cold
storage viability.

46


48
India has been ranked 143 out of 190 economies for Trading Across Borders in the 2017 version of Doing Business report, and the rank has fallen 17 places over last 2 years. China and USA, two economies with similar geographic size & six times the trade compared to India, are ranked at 96 and 35 respectively.
A comparison of the documentary and border compliance times shows that the combined compliance times in India are 40 times higher than in USA, and 2-3 times higher than in China. Specifically, in case of China, while the documentary compliance time is comparable with India, the border compliance time, for both imports and exports, is very low.
In addition to international borders, freight movement in India is hindered at inland gateways as well. There are
several interstate borders spread across road network of India, with check posts setup by various State departments to verify details related to the vehicle, driver and goods. The procedures involved in interstate movement of goods further leads to delays in the logistics chain – translating to 15-20% of total transit time being spent at interstate border check posts. Therefore, it is critical to improve these processes as well.
In this paper, the reasons for delays at the critical gateways of India have been highlighted and key bottlenecks choking the logistics chain have been identified. Further, a way forward for India’s gateways has been proposed by taking cues from best practices, and the current ongoing efforts aimed at reducing delays.
Introduction
Export Time ( hours) Documentary Compliance
Border Compliance
Rank
India China Singapore USA Netherlands
145
47
143 1
Import Time ( hours)345
158
389 1
143 96 41 35 1
India China Singapore USA Netherlands
38
10621
26 12 22 2 0 1
61
283 66
922 8 0 1
Figure 9: Time to export & import (in hours, select economies)
Source: Doing Business 2017, World Bank Group
335

49
India traded 1,052million metric tons of cargo through sea ports in FY15. The total sea port traffic translates to 90% of the total cargo traded by volume in India – making sea ports the key gateways in to and out of India.
The time release study (TRS) published for the period of January to June 2016 by the Customs department at India’s largest container port, Jawaharlal Nehru Port, shows that the time taken for green-channeled import cargo (without physical check) is 4.5 days and for manually checked cargo is 5.5 days. Such large clearance times have negative impact on the logistics cost
Process & key bottlenecks
From a regulatory perspective, the customs department under the Central Board of Excise and Customs (CBEC) is the primary authority responsible for granting clearances for imports and exports. Along with customs,
International bordersthe excise and service tax departments under CBEC also support the scrutiny of goods – primarily in exports.
a. Import processes & delays
For imports, the cargo goes through four steps – (1) berthing of vessel, (2) unloading of cargo from vessel, (3) clearance of cargo in port, and (4) evacuation of the cargo from the port. The delays involved in pre-berthing and dwell time of vessel are primarily driven by port operations and the infrastructure available at the port. The delays in clearance, which involves compliance checks by customs authorities, are directly due to the regulatory processes.
The customs process in India involves a mix of paper
and electronic declaration and verification. The
current clearance process for imports involves four
steps broadly as shown in the figure below:
Figure 10: Import process at Indian ports
Import process at ports
Berthing Unloading Clearance Evacuation
Online declaration
RMS evaluation
• Can be completed before cargo reaches port, has been mandated at some ports such as JNPT
• Evaluates risk level of cargo and importer
• Classifies low-risk cargo under ‘RMS-facilitated cargo4
-Roughly 50-55% cargo classified under this category
-Eligible for direct port delivery and does not require manual check
• Involves offline verification of all clearances by & final approval from Customs officials
• Importer or CHA is required to produce a printer copy of bank payment challan ( receipt) and final form
• Single-window process • Required for cargo that is classified as
high- risk by the RMS
• In most, if not all cases, it involves physical scrutiny of cargo, by a Customs Officer
• Specific type of cargo commodities such as scrap metal, second- hand goods, and chemicals always require physical verification
Delay causing step (for all imports)
Delay causing step (only for non-facilitated imports)
Manual check Out of charge

50
Based on the above process, three key bottlenecks emerge –
1. Low share of RMS-facilitated cargo
India has a low share of green-channeled (RMS-
facilitated) cargo at 50-55%. In comparison,
developed economies have much higher share on
non-impeded cargo – e.g. 86% of the cargo
entering Australia is approved via green channel.
2. High turnaround time (TAT) due to low tech-
support in manual checks
As per the latest TRS published by JNPT, the
average clearance time for non-RMS-facilitated is
10.5 days for first-check cargo (detailed scrutiny).
Majority of the delay is attributed to the
insufficient capacity or inefficient operation of
scanning infrastructure & testing facilities.
In the above process, three key issues arise –
1. Dependency on officials for stuffing cargo:
In case an exporter is not rated as Star Export House, it is required to stuff cargo in the presence of a Central Excise or Customs officer. The dependency on the officer’s presence leads to delays.
2. Delay in port clearance:
Due to use of less than 100% foolproof seals, factory-stuffed cargo is susceptible to being
3. Requirement of offline verification
The final verification of duty payment and clearance of cargo is done by the Customs Officers on a printed copy of the form – hence, requiring the importer/ CHA to physically submit the final documents. This prohibits clearance of RMS-facilitated cargo in parallel while it is entering the port.
b. Export processes & delays
For exports, the cargo has the option of being either factory-stuffed or dock-stuffed. Factory-stuffed cargo involves stuffing of cargo into the container at the factory or Special Economic Zone (SEZ) or any other similar point of origin and not at the port. On the other hand, dock-stuffed cargo involves stuffing of cargo at the port. Export cargo goes through the process shown below:
tampered with in transit to port. To cross-verify the cargo, it is scanned at the port. However, due to limited capacity or inefficient operation of scanning infrastructure, cargo clearance is delayed.
3. Delay in manual checks at port:
In case the self-conducted test reports by exporters/ CHAs are not accepted by the Customs Officer, manual check is required. At ports having insufficient testing facilities and/or personnel, the manual check leads to further delays.
Figure 11: Export process at Indian ports
Export process at ports Delay causing step (for all exports)Delay causing step (for exporters not Star Export House status)
Factory-stuffed
Dock-stuffed
Online declaration
Manual check at factory
Factory stuffing Post clearance
Manual check at port Dock stuffing Loading
• Single- window declaration process
• Necessary tests conducted at factory/ SEZ/ etc. by exporter it self
• Container stuffed & sealed at factory either under supervision of central Excise Officer or by Star Export House
• Clearance provided on self- declaration basis for sealed containers
• Fraction of containers scanned
• Loading of container post all clearance on to vessel
• Container stuffed & sealed at port under supervision of Customs Officers
• Loading of container post all clearance on to vessel
Loading
Online declaration
• Single- window declaration process
• Existing test report scrutinized by Customs Officer at port
• Any additional test required are conducted at port testing facility

51
Global best practices
Global best practices for decongesting sea ports, from
customs and clearance standpoint, can be grouped
across four themes. Each theme demonstrates the role
of digitization and technology in enabling faster
clearances while maintaining the required level of
security.
1. Complete process digitization
End-to-end digitization of processes involves on
boarding all stakeholders of the clearance process
on to a single platform, including Customs officials,
Importers, Exporters, CHAs, payment gateway
providers, transporters. World Bank Group shows
that countries adopting completely electronic
processes have the shortest clearance times.
2. Robust risk management
Robust risk management systems incorporating big
data and advanced analytical capabilities to better
identify low-risk cargo reduce the need for scrutiny
and the infrastructure required for it.
3. Secure cargo tracking
The need for multiple checks at different points can
be removed by enabling a more secure transfer of
cargo. Although simple container seals are used to
ensure cargo is sealed while in transit, there have
been reports of seal tampering. Seals incorporating
improved technology, such as RFID-enabled
e-seals, are used globally to improve security
4. Tech-supported scrutiny
Finally, if the cargo needs to be physically checked, technology-enabled scrutiny systems enable lead time reduction. Non-invasive cargo scanners using x-ray or gamma-ray technology help identify and isolate the part of the cargo that should be focused on even before the container is opened.
Current Indian scenario & way forward
Recently, CBEC has drawn out a clear roadmap in its five-year Foreign Trade Policy 2015-20 to facilitate more efficient clearance of goods for trade across borders.
Current initiatives
Over the last year, various interventions, in line with the FTP 2015-20, have been taken both at a central level by CBEC and by individual ports. Broadly, the initiatives undertaken till date are –
1. Complete process digitization:
Single-window clearance for all imports combined with enablement of paperless, electronic clearance
2. Improved risk management:
Restructuring of multiple privilege programs to a single three-tier Authorized Economic Operator (AEO) program with improved benefits
3. Port-level tracking of cargo:
RFID enablement of all major ports to track movement of personnel, cargo and vehicles within
the ports The time line above exhibits a summary of a few interventions undertaken in
Figure 12: Recent steps undertaken in India to reduce clearance time at ports (select examples)
Source: Circulars & public notices (CBEC, JNPT)
Apr’ 16 Jul’16 Oct’16 Jan’ 17
1 Apr 16: SWIFT for import
Launch of single window clearanceto enable declaration of imports to7 agencies simultaneously
22 Jul 16: Streamlining ofprivilege programsMerger of two facilitation schemes(ACP & AEO) to a revised three-tierAEO program
1 Dec 16 : E-clearance
Elimination of production of payment challans for electronicpayment (95% of total)
Extension of direct-port-delivery to 214 importers for RMS-facilitated cargo
19 Dec 16: Direct portdevlivery (JNPT)
3 Jun 16: Reduction oftesting for textile imports
Addition of countries toexempted category for testing ofazo dyes in textile imports
28 Nov 16: Automatic extension ofprivileges for exporters (JNPT)Automatic extension of seif-sealing & seif-certification permission for Exporters up till31 Dec 2020 - bypassing the need forreapplication for already certified exporters
31 Dec 16: RFID-basedgate automation (JNPT)
Implementation of RFID - basedsystems across port touch pointsto track movement of cargo
22 Feb 17: Optimizingtest requirement (JNPT)
Removal of need of tests incases where self- declared rateof duty is maximum possible
Process digitization Risk Management Cargo tracking Scrutiny Operation optimization

52
FY16-17 by CBEC centrally and by Ministry of Shipping (MoS) at a single port, JNPT. Similar initiatives have been undertaken across ports through central directives and individual initiatives. Incorporation of technology across customs and port operations, enables optimization of port operations, thus enabling the full benefits of the initiatives.
Key interventions required
While the recent steps have been in the right direction, to achieve the best practice clearance times, the initiatives need be taken to completion –
1. Complete process digitization:
Steps have been taken to enable single-window declaration and e-clearance, however, complete digitization needs to be the goal. This includes provisions to inform officials in advance, and tracking of high-risk cargo throughout the port till clearance.
2. Incorporate advanced intelligence-based risk
management:
Interstate borders are the other set of key gateways for freight movement in India. An estimated 1,900million metric tons of freight moved across interstate borders in 2015, twice as large in comparison to EXIM cargo. The delay at interstate borders translates to a loss of 15-20% of additional trip time, and hence contributes to lower logistics performance of the country.
country.
Process & key bottlenecks
For freight moving across interstate borders, two key steps are involved – (1) documentation and (2) verification. Multiple departments under each State Government including department of commercial tax (CTO), road transport (RTO), forestry, mining, and animal husbandry monitor the movement of goods into and out of the states. For that purpose, each department has a list of documents that need to be carried by the transporter while carrying cargo. The documents are verified by the respective authorities at either fixed interstate border check posts or by flying squads.
While the processes involved for verification of RTO documents at inter-state border check posts are
In the times of big data and availability of advanced automated analytical capabilities, it is essential to move away from entity- or country-based green-channeling. Systems should be developed to incorporate risk-management based on dynamic criteria incorporating feedback processes.
3. Promote secure cargo tracking
Secure cargo tracking helps all stakeholders including exporters and importers to confirm the integrity of cargo. It not only reduces the risk of cargo switching, but also reduces the burden on scanning infrastructure. Therefore, policies should be put in place to promote secure tracking measures such as RFID e-seals.
4. Improve scrutiny infrastructure:
The current scanning capacity installed across ports is insufficient & existing infrastructure is utilized sub-optimally. Hence, there is a need to increase the capacity of cargo scanning at ports using improved technologies to enable greater throughput.
straight-forward and do not restrict the flow of traffic, on average, CTO verification takes 5-6 minutes for each commercial vehicle at each border, leading to congestion of up to 12 hours. Both steps contribute to time delay in inter-state freight movement at interstate border check-posts.
1. Documentation
Due to the complex requirements and inadequate CT infrastructure, document preparation takes time. Specifically, for State VAT documents under CTO department, the document preparation procedures are complex and time-consuming due to three factors –
a. Variation in form filling portals, form detail requirements and validity of transit passes across states
b. Large time requirement to file individual forms for each consignment in the vehicle, making it time-consuming for multiple less-than-truckload (LTL) consignments
c. High downtime of State Commercial Tax websites
Interstate borders
53
2. Verification procedures at inter-state border check-posts:
There are three reasons for high verification time:
d. Inadequate design of check posts:
At many check-posts, drive-through booths are not present and booths are located 100-200 meters off the highway
e. Inefficient verification operations:
At check-posts having drive-through infrastructural design, booths are only partially operational due to manpower constraints leading to inefficiency in operations
f. Technology constraints:
Further, there are inefficiencies in terms of system outages and hardware complexities leading to higher verification time at check-posts
Best practices
States across India have actively tried to ease document preparation and reduce time for document verification. Select practices from five states have been highlighted below.
• Meta-form for quicker verification of multiple LTL consignments: Gujarat has incorporated a meta-form – a form that integrates multiple State VAT forms – to enable faster access and quicker verification of vehicles carrying multiple LTL consignments.
• Single-window, barcode-enabled verification: Andhra Pradesh has integrated all check posts (CTO, mining, forestry) except RTO, with barcode-enabled form verification, at its key borders, enabling a ‘single-window’ verification. In addition, Andhra Pradesh has adopted a single form – Form 600 – is required for inbound, outbound and transit through the state.
• Complete removal of additional VAT forms: Maharashtra has completely done away with the requirement of VAT form. Any vehicle carrying goods through Maharashtra is required to only carry an additional copy of the invoice which should mention the TIN number of the consigner.
• Complete shift to flying squads: Rajasthan and Haryana are two states that have removed interstate border check posts and enforced proper documentation through a manage-by-exception mechanism enforced through surprise checks.
Current Indian scenario & way forward
Recently, two key reforms have been undertaken in India – (1) revamp of indirect taxation structure and (2) accession to the Customs Convention on International Transport of Goods under TIR.
With the passage of the goods and services tax (GST) Bills in Lok Sabha on 29th March 2017, India has undertaken a major reform in its indirect taxation structure. Due to the same, changes are imminent in the individual State Commercial Tax documentation and verification procedures. Currently, GST Network has been allotted the task of developing the revamped documentation portal. In addition, a task force has been constituted with representation from various stakeholders to advise states on verification procedures. However, the verification and inspection mechanism is a state subject and individual states have complete jurisdiction to decide the processes they adopt.
Further, the Cabinet in early March 2017 approved India's accession to the Customs Convention on International Transport of Goods under cover of TIR Carnets (TIR Convention). This enables a seamless freight movement across state borders, for transporters signed on to TIR. TIR in conjunction with the GST regime shall help Indian traders to have access to fast, easy, reliable and hassle free international system for movement of goods by road or multi- modal means across the territories of other contracting parties.
Based on the above, two changes have been proposed to enable seamless interstate freight movement – (1) shift to exception-based inspection and (2) enhanced use of ICT to simplify documentation & improve verification effectiveness.
a. Shift to exception-based inspection
With the implementation of GST in India, tax rate variation between states will cease to exist and a single tax rate will be applicable for a commodity across the country. Thus, it is believed that the compliance of declaration of goods moving across interstate borders will be high and interstate border checks can shift to an exception-based inspection mechanism.
In an exception-based inspection mechanism, the border check post booths are removed since they restrict traffic flow. Specific vehicles, identified based on certain criteria, may be stopped by officials operating mobile flying squads and be asked to produce pre-specified documents as proof

54
of declaration. Further, the officials may choose to physically verify the cargo inside the vehicle. Alignment with all stakeholders in the state government and associated infrastructure is critical to enable exception based inspection.
b. Enhanced use of ICT to simplify documentation & improve verification effectiveness
The revised ICT system proposed under the GST regime is aimed to simplify documentation and improve verification effectiveness.
Currently, the GST Network has enabled a single portal for all indirect tax related matters, which simplifies documentation for one of seven state departments i.e. CTO. However, there is a need for a central system to incorporate three key benefits across state departments –
1. Capture of all information on an integrated platform:
The system needs be designed to capture all road freight related documentation, including static information related to vehicles (linkage to VAHAN
database, providing relevant vehicle details such as fitness certificate, status of national permit, etc.), as well as dynamic information related to consignments (VAT/GST forms, commodity specific documents of forests department, etc.) and trips (driver information for RTO, with linkage to SARATHI database).
2. Ensure data integrity & reduce declaration time:
The system need to be linked with existing databases such as VAHAN, SARATHI to enable auto-filling of information using unique identifiers, thereby ensuring data integrity and reducing the time required for online declaration.
3. Enable information sharing across stakeholders:
Once the complete details for the trip have been populated, the system need to provide the relevant authorities in different departments with access to information regarding the vehicle, driver and consignment on a single platform.
Further, to improve verification effectiveness, existing RFID technology and system infrastructure can be leveraged to enable quicker identification and automate verification for flying squads.
Conclusion & potential benefits
Implementation of the above solutions will enable benefits of reduced time and cost across the logistics chain in India and thus propel its trading across borders rank in the subsequent Doing Business reports.
Benefits to EXIM cargo movement
A combination of improved green-channeling classification, enablement of e-clearance across ports and improved scanning infrastructure support will lead to direct benefits of reduction in clearance times by at least 1 day – translating to ~30% reduction in clearance times. Further, synergies such as complete process digitization would enable reduced time spent at Customs warehouses, reduced inventory and improved visibility for logistics planning thus translating into added cost and time benefits.
Benefits to interstate cargo movement
Based on the above recommendations, it is estimated that there will be a significant reduction in delays at interstate borders translating to cost and time benefits for freight transporters.
Simpler documentation requirement along with faster
verification procedures will reduce ~10-15% of transit
time for all interstate movement across India. Reduction
in transit time will result in a direct reduction of
congestion at interstate borders.
Increased speed will reduce cost of transportation by
enabling two levers – increased turnaround time and
reduced cost per trip through reduced fuel consumption.
Increased TAT will increase freight movement capacity
by ~5% for the same fleet, thus distributing capital costs.
Further, reduced congestion will increase fuel efficiency
by an estimated ~2%. The combined effect will reduce
the total cost of road transportation in India by 2-3% on a
per-ton-per-km basis across truck sizes.
In addition to reduction of cost and time, the proposed interventions will benefit various stakeholders in different ways – it will enable better tracking of freight, and improve documentation and verif ication convenience.

56
Transport and Logistics activities involve warehouses,
material handling equipment, storage containers,
pallets and carriers. Such activities demand greater
involvement of people at various levels. With many
stakeholders contributing to the Transport and
Logistics, there is a growing need for dependable
standards definition and adaption.
Operational standards with reference to material
handling equipment, carrier sizes, pallets, packing and
training that facilitate faster operational turnaround and
increase productivity are relatively slow in evolution
when compared with commercial and information
technology standards.
Racking – Handling – Trucking – Palletising Standards
Racking - Handling - Trucking - Palletization (RHTP) standards can improve operational efficiencies with an estimated annual cost savings upto Rs.6000 Crores in the country.
Global racking standards
Storage racking systems are integral part of modern
warehouses that enable optimum utilization of space
and improve productivity. It may be noted that
warehouse operators work each day under Tons of
goods stored above their heads in racking & shelving
systems. Hence, it is at most important to recognize that
the storage system is a “Load bearing structure” and it
shall be designed/ manufactured/installed with great
care.
To ensure that Storage systems are “fit for purpose” and
are “ready for use”, attempts are being made globally to
bring out commonality in Design-Manufacturing-
Installation of these systems. Much of the evolutions in
development of these standards happened
independently in three geographies Viz.
a. In the USA, led by the Rack Manufacturers Institute
(RMI) under the umbrella of Material Handling
Industries Association (MHIA)
b. In the UK, led by Storage Equipment Manufacturers
Association (SEMA)
c. A coordinated effort by EU countries, in from of an
industry association, FEM (The Fédération
Européenne de la Manutention). FEM codes are now
slowly being adopted as EN (European) codes
released by CEN (European Committee for
Standardization).
While independent work has progressed in all these
bodies over past decades, RMI, SEMA and FEM have
started collaborating with each other especially on
specific subjects like Racks for Seismic prone areas, etc.
Standards for Pallet Racking & Shelving continue to exist
independently from these organizations and are being
used by rack manufacturers worldwide, based on
geographies of warehouses.
Even today, Racking structures are being designed predominantly as general steel structures using general purpose steel codes like IS:800 & IS:801. BIS or an industry body in India shall develop such codes for racking systems.
A technical committee may be constituted to adapt appropriate standards such as RMI, SEMA, FEM for Indian business requirements.
While the titles of codes gives a reference for suitably using the code, the specific guidelines given in later part of section are
from SEMA code, given the fact that this is a code which helps manufacturers of all levels to design safe racking systems.
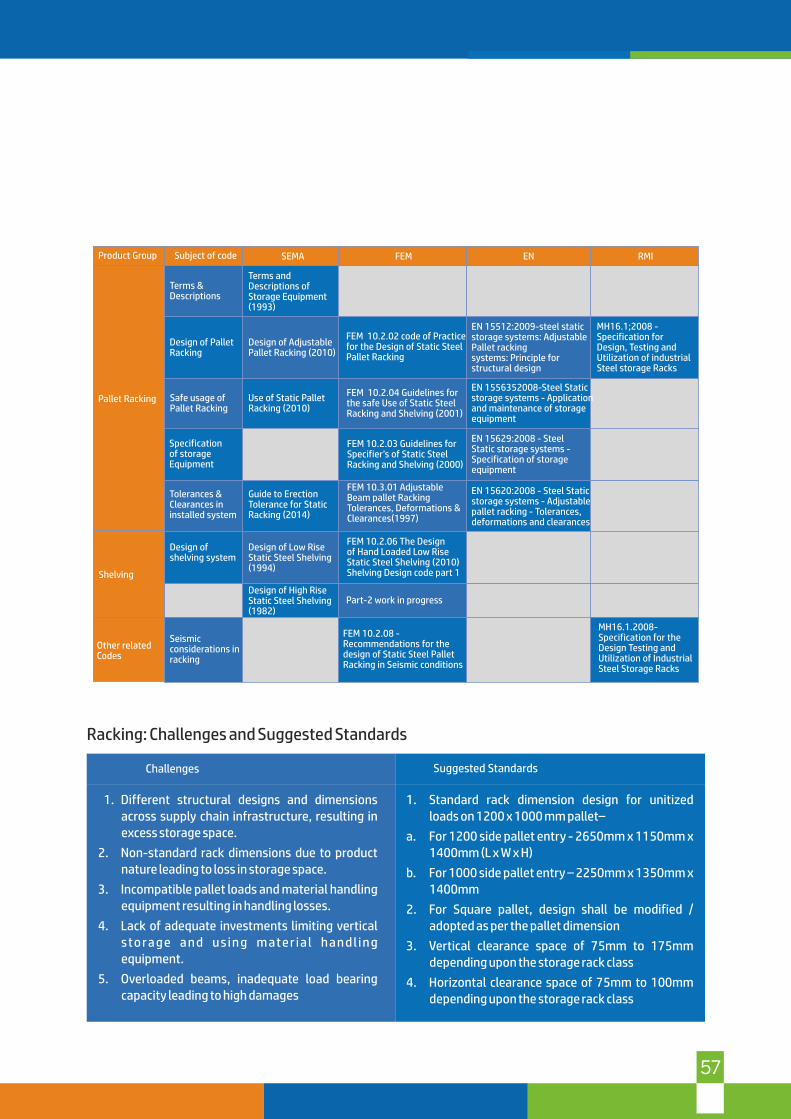
57
Terms andDescriptions ofStorage Equipment(1993)
Design of AdjustablePallet Racking (2010)
Use of Static PalletRacking (2010)
Guide to ErectionTolerance for StaticRacking (2014)
Design of Low RiseStatic Steel Shelving(1994)
Design of High RiseStatic Steel Shelving(1982)
Seismicconsiderations in racking
Design of shelving system
Tolerances &Clearances in installed system
Specificationof storageEquipment
Safe usage of Pallet Racking
Design of PalletRacking
Terms &Descriptions
FEM 10.2.02 code of Practicefor the Design of Static SteelPallet Racking
FEM 10.2.04 Guidelines forthe safe Use of Static SteelRacking and Shelving (2001)
FEM 10.2.03 Guidelines forSpecifier’s of Static SteelRacking and Shelving (2000)
FEM 10.3.01 AdjustableBeam pallet RackingTolerances, Deformations &Clearances(1997)
FEM 10.2.06 The Designof Hand Loaded Low RiseStatic Steel Shelving (2010)Shelving Design code part 1
Part-2 work in progress
FEM 10.2.08 -Recommendations for thedesign of Static Steel PalletRacking in Seismic conditions
EN 15512:2009-steel staticstorage systems: AdjustablePallet rackingsystems: Principle forstructural design
EN 1556352008-Steel Staticstorage systems - Applicationand maintenance of storageequipment
EN 15629:2008 - SteelStatic storage systems -Specification of storageequipment
EN 15620:2008 - Steel Static storage systems - Adjustablepallet racking - Tolerances,deformations and clearances
MH16.1;2008 -Specification forDesign, Testing and Utilization of industrialSteel storage Racks
Other relatedCodes
Shelving
Pallet Racking
Product Group Subject of code SEMA FEM EN RMI
MH16.1.2008-Specification for theDesign Testing and Utilization of Industrial Steel Storage Racks
Racking: Challenges and Suggested Standards
Challenges Suggested Standards
1. Different structural designs and dimensions across supply chain infrastructure, resulting in excess storage space.
2. Non-standard rack dimensions due to product nature leading to loss in storage space.
3. Incompatible pallet loads and material handling equipment resulting in handling losses.
4. Lack of adequate investments limiting vertical storage and using mater ial handl ing equipment.
5. Overloaded beams, inadequate load bearing capacity leading to high damages
1. Standard rack dimension design for unitized loads on 1200 x 1000 mm pallet–
a. For 1200 side pallet entry - 2650mm x 1150mm x 1400mm (L x W x H)
b. For 1000 side pallet entry – 2250mm x 1350mm x 1400mm
2. For Square pallet, design shall be modified / adopted as per the pallet dimension
3. Vertical clearance space of 75mm to 175mm depending upon the storage rack class
4. Horizontal clearance space of 75mm to 100mm depending upon the storage rack class

58
Material handling equipment standards
Material handling equipment is generally separated into four main categories - storage and handling equipment, engineered systems, industrial trucks, and bulk material handling. While due consideration shall be given to the return on investment for these equipment’s, it is equally important to check the compatibility of such equipment with the logistics eco-system.
i. Storage and handling equipment is usually non-automated storage equipment. Products such as pallet racking, shelving, casters and carts, among others, belong to storage and handling.
a. Universal manufacturing standards and safety regulations for material handling equipment are generally based on factors such as: strength of steel, evenly distributed loads, pin point stress loads and other engineered criteria to determine physical forces in static and vibratory load conditions.
ii. Engineered systems are typically custom engineered material-handling systems. Conveyors, Handling Robots, AS/RS, AGV, automated palletizers and most other automated material-handling systems fall into this category.
a. Engineered systems are often a combination of products integrated to one system. Selecting the right pallet is very important for engineered systems.
b. Full perimeter pallet with consistent quality, stringent dimensional tolerance (<= 1% by length and width) and more than 1 tonnage capacity are suited for these applications.
iii. Industrial trucks usually refer to operator driven motorized warehouse vehicles, powered manually, by gasoline, propane or electrically. They assist the material-handling system with versatility and can go where engineered systems cannot. Forklift trucks are the most common example of industrial trucks.
a. They are broadly classified as Internal Combustion (IC) engine trucks and Electric trucks. Mostly, IC engine Forklift trucks are used for out-door application, whereas Electric
trucks are used for indoor/in-warehouse applications.
b. Electric Forklifts, Stackers, Reach Trucks, Powered pallet trucks, tow truck, Narrow aisle order pickers and Turret trucks fall under the category of Electric trucks.
Europe, America and Asia have different regulatory requirements for Industrial trucks. To ensure that industrial trucks are designed considering all possible safety aspects, attempts are being made globally to bring out commonality in Design & Installation of such trucks.
i. Technical Committee ‘TC-110’ of International Organization for Standardization (ISO) has been working for several years to establish standards which can be accepted globally or can be accepted with minor changes.
ii. In India, Industrial trucks specifically forklift trucks come under the purview of Construction Equipment Vehicle (CEV). Hence, The Motor Vehicle Act 1988 and The Central Motor Vehicle Rules 1989 are applicable to them.
iii. As per the guidelines of Bharat Stage Emission Standards, all Industrial Trucks fitted with IC engines shall comply with requirements of emissions meeting BSIII standards for CEV engines.
iv. The engines on forklift trucks have to be certified by agencies such as The Automotive Research Association of India (ARAI) or any other equivalent agency.
v. The complete forklift truck should also be certified by agencies (such as ARAI) to meet requirements of CMVR pertaining to CEV. Electric
vi. Trucks are also expected to fulfil all requirements of CMVR except emission norms. Bureau of Indian Standards (BIS) committee TED22 also suggests t h a t i n d u st r i a l T r u c ks s h a l l a d h e r e to ‘IS10517:1983 – Acceptance Criteria for Forklift Trucks’.
vii. A code of practice for Industrial Trucks in India shall be developed together by appropriate Government agency / department and industry.

59
Handling: Challenges and Suggested Standards
Challenges Suggested Standards
1. Limited usage of material handling equipment results in high labour cost and less productivity
2. Different packaging standards among the supply chain partners leads to inefficiency in using handling equipment
3. Non-availability of proper equipment unloading results in handling losses
4. Range of handling equipment requires multiple types of training for the operators
Compatibility with full perimeter pallet
1. Hand Operated Pallet Truck (HOPT) maximum lift height shall be 200 mm
2. Stacker, inside straddle dimension shall be more than 1200 mm to meet standardized pallet sizes
3. For Stacker, fork over design shall be used only for specialized application viz to handle wire baskets and products on skids but not full perimeter pallet.
Trucking standards
The Central Motor Vehicles Rules 1989 in section 93,
prescribes the overall dimensions of vehicles permitted
in India. The overall width of a motor vehicle, measured
at right angles to the axis of the motor vehicle between
perpendicular planes enclosing the extreme points, shall
not exceed 2.6 metres, for maximization of the product
volume minimum width needs to be 2450 mm.
Explanation—for purposes of this rule, a rear-view
mirror, or guard rail or a direction indicator 136 rub-rail
(rubber beading) having maximum thickness of 20 mm
on each side of the body shall not be taken into
consideration in measuring the overall width of a Motor
vehicle.
The overall length of a motor vehicle other than a trailer
shall not exceed—
a. In the case of motor vehicle other than transport
vehicle having not more than two axles, 6.5 metres;
b. In the case of transport vehicle with rigid frame having two or more axles, 12 metres;
c. In the case of articulated vehicles having more than two axles, 16 metres;
d. In the case of truck-trailer or tractor-trailer combination, 18 metres;
The overall height of a motor vehicle measured from the surface on which the vehicle rests,
i. In the case of a vehicle other than a double-decked transport vehicle, shall not exceed 3.8 metres;
ii. In the case of a double decked transport vehicle, shall not exceed 4.75 metres;
iii. In the case of tractor-trailer goods vehicle, shall not exceed 4.20 metres;
iv. In the case of a laden trailer carrying ISO series 1 Freight Container, shall not exceed 4.2 metres:
v. For palletized movement minimum height of 2500 mm

60
Challenges Suggested Standards
1. Long idle time for trucks in transport operations i.e. during loading and unloading operations.
2. Multiple truck types for carrying cargo ranging from 1 ton to 32 tons.
3. Customized truck body dimensions built by unorganized body builders for maximum load utilization.
1. The overall width of a motor vehicle, measured at right angles to the axis of the motor vehicle between perpendicular planes enclosing the extreme points, shall not exceed 2.6 meters, for maximization of the product volume minimum width should be 2450 mm.
2. The overall height of a motor vehicle measured from the surface on which the vehicle rests,
• In the case of a vehicle other than a double-decked transport vehicle, shall not exceed 3.8 meters;
• In the case of a double decked transport vehicle, shall not exceed 4.75 meters;
• In the case of tractor-trailer goods vehicle, shall not exceed 4.20 meters;
• In the case of a laden trailer carrying ISO series 1 Freight Container, shall not exceed 4.2 meters:
3. For palletized movement, minimum height of 2500 mm is required for motor vehicle.
4. The overall length of a motor vehicle other than a trailer shall not exceed—
• In the case of motor vehicle other than transport vehicle having not more than two axles, 6.5 meters;
• In the case of transport vehicle with rigid frame having two or more axles, 12 meters;
• In the case of articulated vehicles having more than two axles, 16 meters;
• In the case of truck-trailer or tractor-trailer combination, 18 meters
5. Flatbed vehicle shall be without any deformation or design. No protrusion/hinges / angles that restrict loading of palletized loads.
Trucking: Challenges and Suggested Standards

61
Palletisation standards
At international standardization level, ISO TC 51 of International Organization for Standardization is actively engaged in the work of standardization of pallets in general use in the form of platforms or trays on which goods may be packed to form unit loads for handling by mechanical devices. This Technical Committee works in co n j u n c t i o n w i t h o t h e r T e c h n i c a l
Committees focused on transportation infrastructure to develop interrelated standards.
Transport Engineering Department of Bureau of Indian Standards, the national standards body of India is also actively involved in formulation of Indian Standards on Pallets. Standards for pallets have been formulated by Freight Containers and Pallets Sectional Committee, TED 12 of BIS.
Palletisation: Challenges and Suggested Standards
Challenges Suggested Standards
1. Different designs and dimensions of pallets across supply chain, resulting in excess inventory of pallets, frequent changeover of product load (stacking and de stacking).
2. Pallet sizes incompatibility with the racking and the material handling equipment leading to adjustments in racking and limiting choice of material handling equipment.
3. Pallets not suitable for all applications viz storage in warehouse and movement in trucks.
4. Inadequate load carrying capacity and high damages.
5. Heavy pallets leading to labour fatigue / risk of injury and tonnage loss in trucks and racks.
6. Inconsistent quality with no certifications as per requirement of Indian food and safety act quality audits.
7. Inconsistent dimensional tolerance resulting in losses due to downtime of automatic machines, ASRS (Automatic Stock Retrieval System) and Pallet Conveyor Lines.
1. Standard Pallet design for unitized loads – 1200mm x 1000mm (Length and Width).
2. Square pallets for specific usage (eg. carriage of drums) eg. 1200mm x 1200mm.
3. Full perimeter- block pallet with 4-way entry for structural stability and ease of handling.
4. Pallets made of certified and/or legally compliant timber source (eg. Indian Forestry Act, 1927 for local lumber, ISPM 15 compliant for imported lumber).
5. Dimensional tolerance (<=1% by length and width) to ensure compatibility with Automation, ASRS (Automatic Stock Retrieval System) and Pallet Conveyor Lines.
6. Pallets / Timber should not be treated with toxic chemicals especially for Food and Beverage sector, as per Indian Food and Safety Act 2008.
7. Minimum load capacity of 1 Ton for dynamic goods movement and 4 Ton for static storage.

62
Voluntary adoption of standards
i. Logistics sector is transforming into an organised sector and there is greater n e e d t o c a t a l y s e g ro w t h . T h e development and adaption of logistics operational standards in a fragmented market is cumbersome and at times viewed as a barrier for growth.
ii. Considering the global operational benchmarks in logistics sector such as LPI, aiming for better organization of logistics processes and procedures w i l l e n a b l e I n d i a n c o m p a n i e s ’ competitiveness.
iii. There is a need for creating an Industry driven voluntary standards organisation to develop and disseminate benefits related to the voluntary adaption of standards in Logistics.
iv. Such industry init iat ive towards standards may result in operational cost savings and benefits such as
a. Better utilization of transport cubes
b. Reduced Truck turn Around Time
c. Reduced product damage with Improved product accessibility
d. Productivity increase in Warehouse storage and handling
Mission for Integrated Development of Transport and Logistics
i. A mission for Integrated Development of Transport and Logistics may be considered to evolve RHTP guidelines and minimum standards in consultation with industry and other stakeholders.
ii. Government may consider option to provide incentives to accelerate usage of standardised equipment such as pallets and handling equipment. A detailed business case may be developed to estimate impact of such incentive on overall logistics costs.
iii. The mission can extend focus beyond RHTP to other components related to general purpose ambient warehouse development such as layouts and units, packaging, generators, docks, staking system, unitized transportation and alternate energy options.
iv. Voluntary adaption of such guidelines and standards would drive the safety and productivity in Transport and Logistics.

63
Minimum standards for voluntary adaption
Source: RHTP Study Report, CII Institute of Logistics, 2015
64
Logistics skill development initiatives
The changing market structure, increasing capacities and voluntary adaption of standards in logistics operations need appropriately skilled human resources. With an agenda to support the growth of logistics sector in Inida, CII along with National Skill Development Corporation has set up a Logistics Skills council (LSC) to address these i ss u es t h rou g h a st r u c t u r e d s k i l l development program.
i. Estimated skill gap
It is estimated that demand for skilled logistics workforces is going to increase from 19 million to 32.5 million by 2022 indicating a 13.5 million skill gap.
ii. Job roles & subsectors
A s p a r t of t h i s lo g i st i c s s k i l l s development initiative, more than 80 job
roles related to 8 areas in logistics sector are identified. Logistics sub sectors include Material Handling Equipment, Warehouse Operations, Cranes/ Heavy equipment, Maritime Logistics, Port Operations /CFS, Packaging, Trucking Operations, Express delivery services (Couriers).
iii. QP / NOS
Logistics skills development at various levels requires development of Qualification Packs (QP) and National Occupational Standards (NOS) for various job roles across logistics sub sectors such as freight forwarding, express and ecommerce logistics, maritime logistics and logistics service providers (including cold chains).
Highlights
• For the first time in India, LSC introduced well-structure logistics training courses encompassing various sub sectors to develop leading edge operator level skills.
• Integration of skills and education has begun with courses like B.Voc which is introduced by few Universities and Colleges.
• The National Apprenticeship Training Scheme aims at providing training for qualified youth for a year with stipend. This offers great potential for supply chain and logistics functional roles and attempts to fill the gap in skilled manpower.
• Post GST logistics environment is expected to increase activities in large warehouses and transport categories. Particularly, the e-commerce sector is expected to respond with increase in skill development training programs.
iv. Skill development partners:
At present with its training partners LSC organizes activities related to 56 approved job roles in warehousing, transportation, express courier and freight forwarding sub sectors. These skill development courses range from level 2 to level 5. In addition states such as Kerala, Haryana, Punjab, Andhra Pradesh, Telangana, Maharastra, Uttar Pradesh, Rajasthan sponsor skill development activities.
v. Government support:
Pradhan Mantri Kaushal Vikas Yojana (PMKVY) (provides three ways – short term courses, Recognition of Prior Learning (RPL) and special projects) and Deen Dayal Upadhyay Grameen Kaushalya Yojana (DDUGKY) and other schemes are available for specific trade training and generic training on soft skills provide structured channels for supporting large scale skill development initiatives through Logistics Sector Skills Council.

65
Industry and Government along with key stakeholder agencies are working together to create “Skill Centers” in select locations. These centres are envisaged to have state of the art training facilities that would provide focused sub sector training programs in near future. They also are envisaged to implement “Train the Trainer” programs.
a. Central Government Ministries such as Ministry of Road Transport and Highways (MoRTH), Ministry of Shipping and Ministry of Railways have taken lead in promoting skill development activities. For example, MoRTH has encouraged driver training centres in various states. However, with acute shortage of heavy vehicle drivers, there is an immediate need to push focus on this immediate need.
b. The growth in containerized cargo and development of logistics parks indicate paradigm shift in Indian Transportation &
Logistics. Institutes such as CIRT, Pune and IAHE, Noida can work with Logistics Skill Council and its partners to impart training with focus on improving container cargo handling and safety.
vi. Need for State Governments participation
It is time that State Governments through respective Skill Development Corporations become more active in pursuing this initiative. Awareness campaigns and focused training missions by individual State Governments would provide better impetus to fill skill gap in logistics.
LSC has trained and placed 50,000 trainees in 2016 and is aiming to train and place about 100,000 trained candidates in 2017.