2017 Q2 Results
AUGUST 4, 2017
Certain statements contained in this presentation may be deemed "forward-looking statements". All statements in this release, other than statements of historical fact, that address future events, developments or performancethat Osisko (the “Corporation”) expect to occur, including managements’ expectations regarding the Corporation’s growth, results of operations, estimated future revenues, statements or estimates of mineral resources and reserves,requirements for additional capital, future demand for and prices of commodities, business prospects and opportunities are forward looking statements. Forward looking statements are statements that are not historical facts and aregenerally, but not always, identified by the words "expects", "plans", "anticipates", "believes", "intends", "estimates", "projects", "potential", "scheduled" and similar expressions or variations (including negative variations), or that events orconditions "will", "would", "may", "could" or "should" occur including, without limitation, that all conditions precedent a transaction will be met and the realization of the anticipated benefits deriving therefrom for shareholders of theCorporation, the view on the quality and the potential of the Corporation’s assets, production forecasts for properties in which the Corporation holds a royalty or other interest. Although the Corporation believes the expectations expressed insuch forward-looking statements are based on reasonable assumptions, such statements involve known and unknown risks, uncertainties and other factors and are not guarantees of future performance and actual results may accordinglydiffer materially from those in forward looking statements. Factors that could cause the actual results to differ materially from those in forward-looking statements include, without limitation: fluctuations in the prices of the commodities thatdrive royalties held by the Corporation; fluctuations in the value of the Canadian dollar relative to the U.S. dollar; risks related to the operators of the properties in which the Corporation holds a royalty or other interest; the unfavorableoutcome of litigation relating to any of the properties in which Osisko holds a royalty or other interest; development, permitting, infrastructure, operating or technical difficulties on any of the properties in which the Corporation hold a royaltyor other interest; rate and timing of production differences from mineral resource estimates or production forecasts by operators of properties in which the Corporation hold a royalty or other interest; risks and hazards associated with thebusiness of exploring, development and mining on any of the properties in which the Corporation hold a royalty or other interest, including, but not limited to unusual or unexpected geological and metallurgical conditions, slope failures orcave-ins, flooding and other natural disasters or civil unrest; regulatory changes by national and local government, including corporate law, permitting and licensing regimes and taxation policies; regulations and political or economicdevelopments in any of the countries where properties in which the Corporation hold a royalty or other interest are located or through which they are held); continued availability of capital and financing and general economic, market orbusiness conditions; business opportunities that become available to, or are pursued by the Corporation; the impossibility to acquire royalties and to fund precious metal streams; other uninsured risks. The forward looking statementscontained in this presentation are based upon assumptions management believes to be reasonable, including, without limitation: the ongoing operation of the properties in which the Corporation holds a royalty or other interest by theowners or operators of such properties in a manner consistent with past practice; the accuracy of public statements and disclosures made by the owners or operators of such underlying properties; no material adverse change in the marketprice of the commodities that underlie the asset portfolio; no adverse development in respect of any significant property in which the Corporation holds a royalty, stream or other interest; the accuracy of publicly disclosed expectations forthe development of underlying properties that are not yet in production; and the absence of any other factors that could cause actions, events or results to differ from those anticipated, estimated or intended. For additional information onrisks, uncertainties and assumptions, please refer to the Corporation’s most recent Annual Information Form filed on SEDAR at www.sedar.com. The Corporation cautions that the foregoing list of risk and uncertainties is not exhaustive.Investors and others who base themselves on the forward looking statements contained herein should carefully consider the above factors as well as the uncertainties they represent and the risk they entail. The Corporation believes that theexpectations reflected in those forward-looking statements are reasonable, but no assurance can be given that these expectations will prove to be correct and such forward-looking statements included in this presentation should not beunduly relied upon. These statements speak only as of the date of this presentation. The Corporation undertakes no obligation to publicly update or revise any forward-looking statements, whether as a result of new information, futureevents or otherwise, other than as required by applicable law.
Safe Harbour Statement
This PowerPoint presentation has been prepared for informational purposes only in order to assist prospective investors in evaluating an investment in Osisko Gold Royalties Ltd.Inquiries regarding this confidential PowerPoint presentation can be made to the senior management of the Corporation.
Cautionary Note to U.S. Investors Regarding Mineral Reserve and Mineral Resource Estimates
Osisko is subject to the reporting requirements of the applicable Canadian securities laws, and as a result, reports its mineral resources and reserves according to Canadian standards. Canadian reporting requirements for disclosure of mineralproperties are governed by National Instrument 43-101 (“NI 43-101”). The definitions of NI 43-101 are adopted from those given by the Canadian Institute of Mining, Metallurgy and Petroleum (“CIM”). U.S. reporting requirements aregoverned by the Industry Guide 7 (“Guide 7”) of the Security and Exchange Commission ("SEC"). This presentation includes estimates of mineral reserves and mineral resources reported in accordance with NI 43-101. These reportingstandards have similar goals in terms of conveying an appropriate level of confidence in the disclosures being reported, but embody different approaches and definitions. For example, under Guide 7, mineralization may not be classified as a“reserve” unless the determination has been made that the mineralization could be economically and legally produced or extracted at the time the reserve determination is made. Consequently, the definitions of “Proven Mineral Reserves”and “Probable Mineral Reserves” under CIM standards differ in certain respects from the standards of the SEC. Osisko also reports estimates of “mineral resources” in accordance with NI 43-101. While the terms “Mineral Resource,”“Measured Mineral Resource,” “Indicated Mineral Resource” and “Inferred Mineral Resource” are recognized by NI 43-101, they are not defined terms under standards of the SEC and, generally, U.S. companies are not permitted to reportestimates of mineral resources of any category in documents filed with the SEC. As such, certain information contained in this presentation concerning descriptions of mineralization and estimates of mineral reserves and mineral resourcesunder Canadian standards is not comparable to similar information made public by United States companies subject to the reporting and disclosure requirements of the SEC. Readers are cautioned not to assume that all or any part ofMeasured Mineral Resources or Indicated Mineral Resource exists, or is economically or legally mineable. Further, an “Inferred Mineral Resource” has a great amount of uncertainty as to its existence and as to its economic and legalfeasibility, and a reader cannot assume that all or any part of an Inferred Mineral Resource will ever be upgraded to a higher category. Under Canadian rules, estimates of Inferred Mineral Resources may not form the basis of feasibility orother economic studies.
Forward Looking Statements
2
Highlights
Q2 2017
Subsequent to June 30, 2017
On June 5, 2017, announced the acquisition of a precious metals portfolio of assets from Orion consisting of 74 royalties, streams and precious metal offtakes;
Record quarterly gold equivalent ounces (“GEO”) earned of 10,86312% increase compared to Q2 2016;
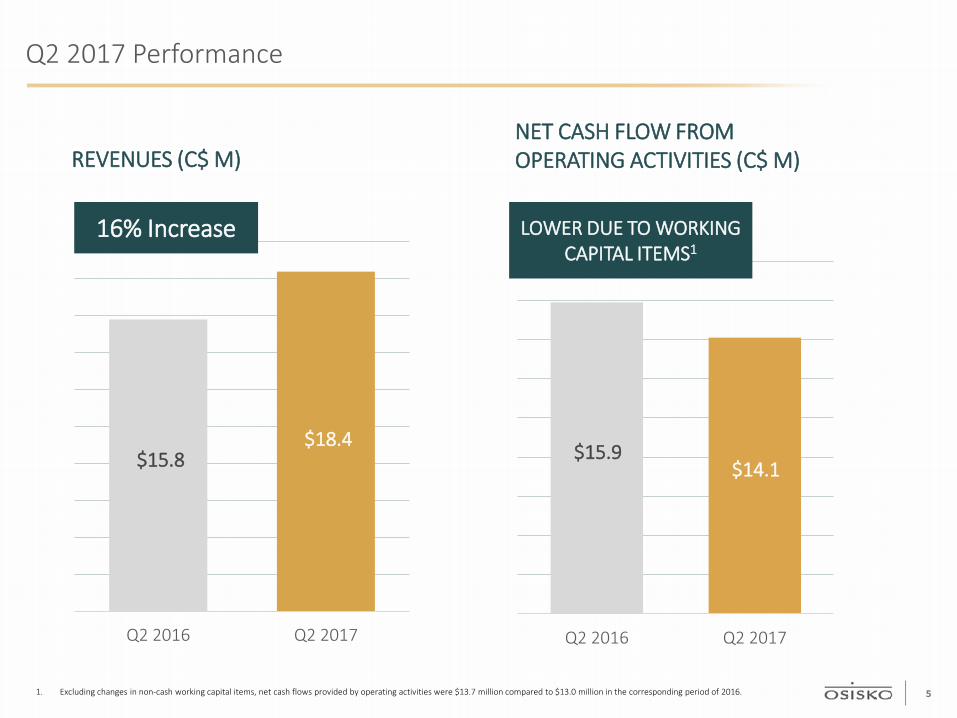
Record quarterly revenues of C$18.4 million16% increase compared to Q2 2016;
Net cash flows provided by operating activities of C$14.1 millioncompared to C$15.9 million in Q2 2016;
Adjusted earnings of C$7.1 million, $0.07 per basic share1 (compared to C$6.6 million, C$0.06 per basic share in Q2 2016);
Acquisition of additional common shares of Barkerville for C$38.9 million which increased Osisko’s holding to 33.4%;
1. “Adjusted earnings” and “Adjusted earnings per share” are non-IFRS financial performance measures which have no standard definition under IFRS. Refer to the non-IFRS measures provided under the Non-IFRS Financial Performance Measures section of this Management’s Discussion and Analysis.
Acquisition of an additional 0.75% NSR royalty on the Cariboo gold project from Barkerville for cash consideration of C$12.5 million, which increased the NSR royalty held by Osisko on the Cariboo gold project to a total of 2.25% NSR; and
Declared an eleventh quarterly dividend of C$0.04 per common share.
On August 3, 2017, declaration of a twelfth quarterly dividend and increased to C$0.05 per common share, representing a 25% increase over the last quarter.
On July 31, 2017, Osisko closed the acquisition of the precious metals portfolio of assets from Orion.
3
Q2 2016 Q2 2017
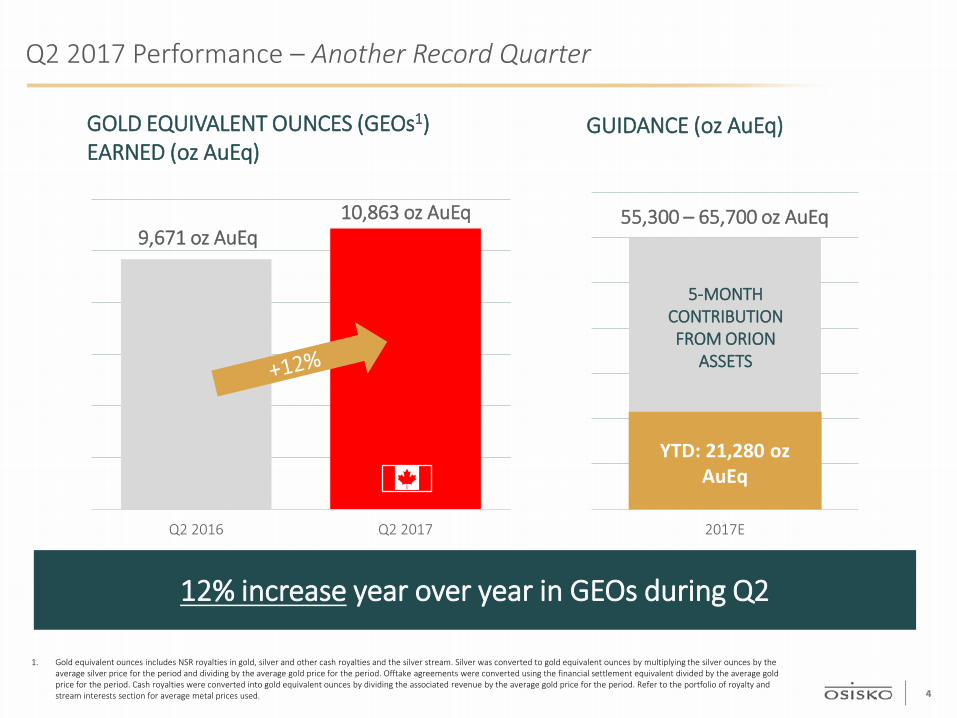
Q2 2017 Performance – Another Record Quarter
GOLD EQUIVALENT OUNCES (GEOs1)EARNED (oz AuEq)
12% increase year over year in GEOs during Q2
1. Gold equivalent ounces includes NSR royalties in gold, silver and other cash royalties and the silver stream. Silver was converted to gold equivalent ounces by multiplying the silver ounces by the average silver price for the period and dividing by the average gold price for the period. Offtake agreements were converted using the financial settlement equivalent divided by the average gold price for the period. Cash royalties were converted into gold equivalent ounces by dividing the associated revenue by the average gold price for the period. Refer to the portfolio of royalty and stream interests section for average metal prices used.
9,671 oz AuEq10,863 oz AuEq
GUIDANCE (oz AuEq)
55,300 – 65,700 oz AuEq
2017E
YTD: 21,280 oz AuEq
5-MONTH CONTRIBUTION FROM ORION
ASSETS
4
$15.8 $18.4
Q2 2016 Q2 2017
$15.9 $14.1
Q2 2016 Q2 2017
Q2 2017 Performance
NET CASH FLOW FROM OPERATING ACTIVITIES (C$ M)REVENUES (C$ M)
16% Increase LOWER DUE TO WORKING CAPITAL ITEMS1
1. Excluding changes in non-cash working capital items, net cash flows provided by operating activities were $13.7 million compared to $13.0 million in the corresponding period of 2016. 5
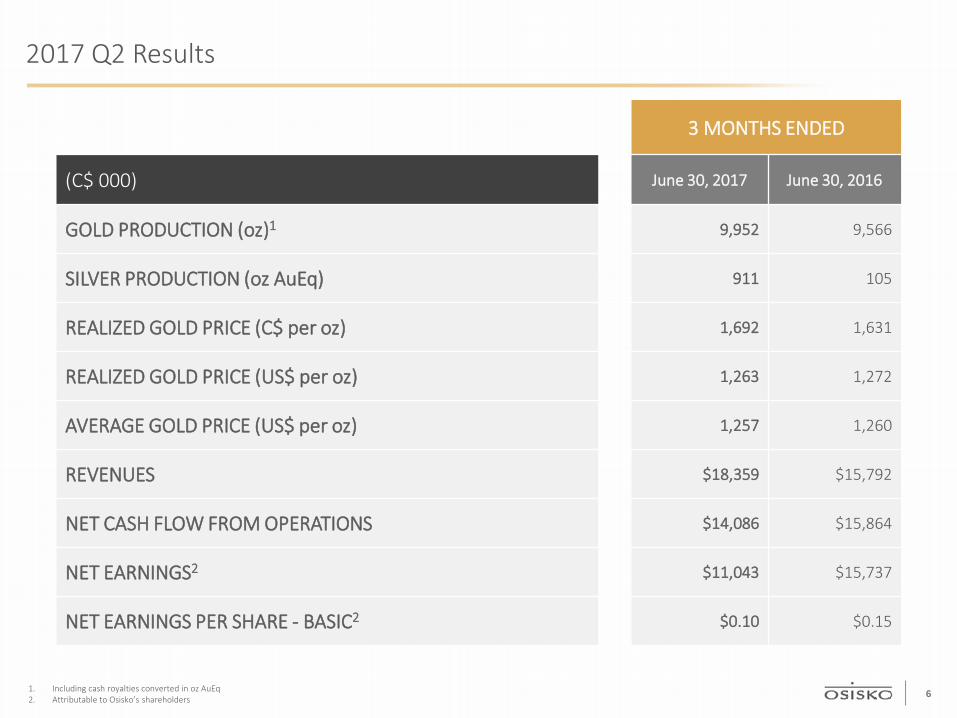
2017 Q2 Results
3 MONTHS ENDED
(C$ 000) June 30, 2017 June 30, 2016
GOLD PRODUCTION (oz)1 9,952 9,566
SILVER PRODUCTION (oz AuEq) 911 105
REALIZED GOLD PRICE (C$ per oz) 1,692 1,631
REALIZED GOLD PRICE (US$ per oz) 1,263 1,272
AVERAGE GOLD PRICE (US$ per oz) 1,257 1,260
REVENUES $18,359 $15,792
NET CASH FLOW FROM OPERATIONS $14,086 $15,864
NET EARNINGS2 $11,043 $15,737
NET EARNINGS PER SHARE - BASIC2 $0.10 $0.15
1. Including cash royalties converted in oz AuEq2. Attributable to Osisko’s shareholders 6

0.05 $
$0.00
$0.01
$0.02
$0.03
$0.04
$0.05
Q3 2014 Q4 2014 Q1 2015 Q2 2015 Q3 2015 Q4 2015 Q1 2016 Q2 2016 Q3 2016 Q4 2016 Q1 2017 Q2 2017 Q3 2017
Dividend
TWELFTH QUARTERLY DIVIDEND DECLARED
STABLE DIVIDENDAND GROWING
7

Pro Forma Balance Sheet
Balance Sheet Item Pro Forma1
Cash (C$ M) ~$100
Debt (C$ M) ~$195
Investments (C$ M) ~$450
Basic Shares Outstanding (M) 156.8
Quarterly Dividend (C$/Share) $0.05
1. July 31, 2017 after closing of the Orion portfolio acquisition 8

Building a World Class Growth Royalty Company
Significant portfolio of high quality royalties and streams on new Canadian mines
Robust cash flow Highly attractive portfolio of world
class development and exploration royalties
Canada focused Gold focused
High quality, diversified portfolio of streams, royalties and offtakes
Significant cash flow with a strong growth profile
North America focused Precious metals focused
A world class precious metals royalty and streaming company Forecasted production of over 100k GEOs in 2018 growing to
over 140k GEOs by 2023 Industry-leading cash flow growth Precious metals & North American focus
9
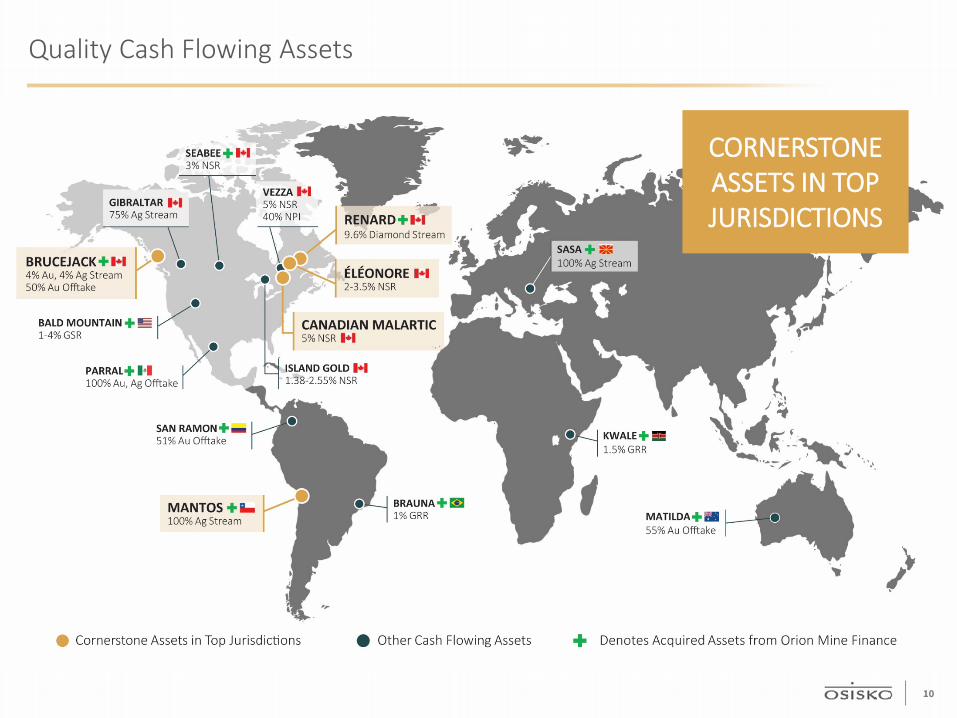
Quality Cash Flowing Assets
CORNERSTONE ASSETS IN TOP JURISDICTIONS
10
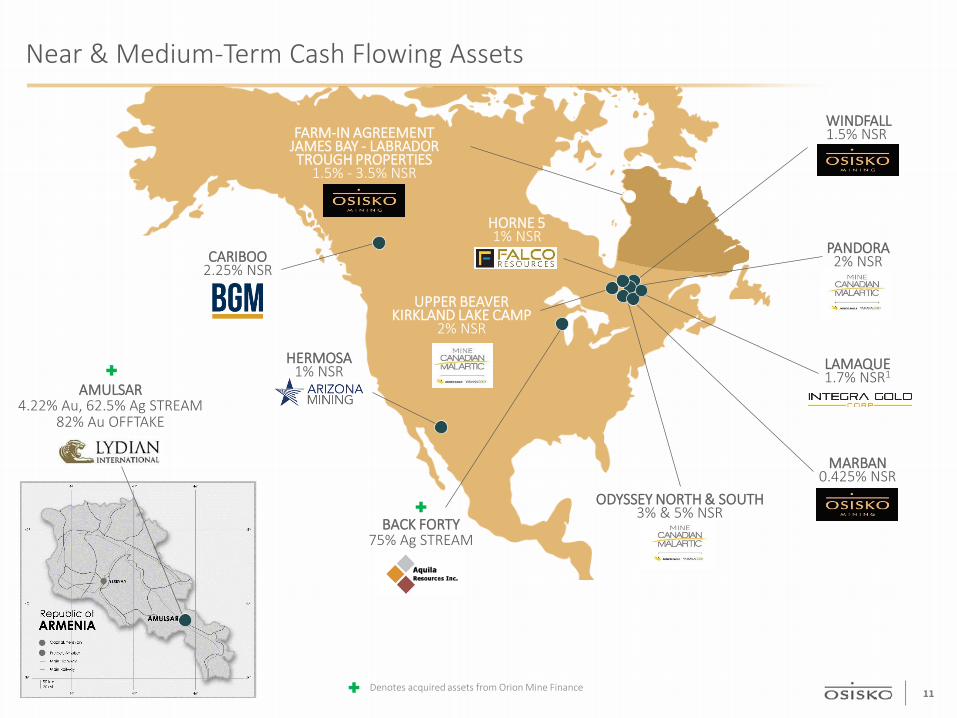
Near & Medium-Term Cash Flowing Assets
Denotes acquired assets from Orion Mine Finance
UPPER BEAVER KIRKLAND LAKE CAMP
2% NSR
CARIBOO2.25% NSR
MARBAN0.425% NSR
LAMAQUE1.7% NSR1
WINDFALL1.5% NSR
HERMOSA1% NSR
HORNE 51% NSR
FARM-IN AGREEMENTJAMES BAY - LABRADOR TROUGH PROPERTIES
1.5% - 3.5% NSR
ODYSSEY NORTH & SOUTH3% & 5% NSR
PANDORA2% NSR
BACK FORTY75% Ag STREAM
AMULSAR4.22% Au, 62.5% Ag STREAM
82% Au OFFTAKE
11
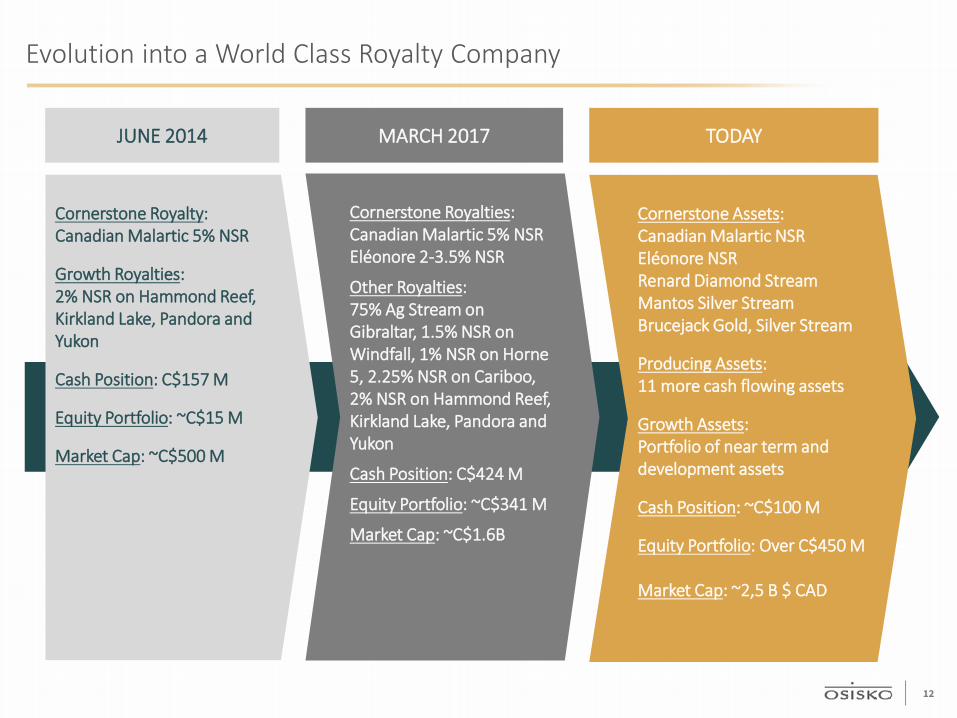
Evolution into a World Class Royalty Company
JUNE 2014 MARCH 2017 TODAY
Cornerstone Assets: Canadian Malartic NSREléonore NSRRenard Diamond StreamMantos Silver StreamBrucejack Gold, Silver Stream
Producing Assets:11 more cash flowing assets
Growth Assets:Portfolio of near term and development assets
Cash Position: ~C$100 M
Equity Portfolio: Over C$450 M
Market Cap: ~2,5 B $ CAD
Cornerstone Royalty: Canadian Malartic 5% NSR
Growth Royalties:2% NSR on Hammond Reef, Kirkland Lake, Pandora and Yukon
Cash Position: C$157 M
Equity Portfolio: ~C$15 M
Market Cap: ~C$500 M
Cornerstone Royalties: Canadian Malartic 5% NSREléonore 2-3.5% NSR
Other Royalties:75% Ag Stream on Gibraltar, 1.5% NSR on Windfall, 1% NSR on Horne 5, 2.25% NSR on Cariboo, 2% NSR on Hammond Reef, Kirkland Lake, Pandora and Yukon
Cash Position: C$424 M
Equity Portfolio: ~C$341 M
Market Cap: ~C$1.6B
12
Financings of over $750M (+ 290 M$ - Associates)
Secured a credit facility of $200M
Over $2B in transactions
Increased portfolio from 4 royalties → + 131 royalties, streams and offtakes
Revitalization of exploration & development mining camps through associates:
Solid financial position and financial partners
Accomplishments in 3 Years
13
APPENDIX A:Orion Transaction
14

45 4869
22 (Partial Year)
66
72
19
21
66
133
162
2017E 2020E 2023EOsisko Acquired Assets
Immediate Production, Significant Growth Pipeline & Future Optionality
Pro forma Osisko is uniquely positioned as the growth royalty company
• Cariboo NSR• Windfall NSR• Horne 5 NSR• Hermosa NSR
Pro Forma GEOs (k oz)
Dotted box represents contribution from Brucejack stream if not bought-back by the operator
Optionality
1. Includes the following assets: Canadian Malartic, Éléonore, Gibraltar, Cariboo, Vezza, Island Gold, Renard, Mantos, SASA, Seabee, Bald Mountain, Kwale, Parral, San Ramon, Brauna and Matilda.
1
• Marban NSR• Upper Beaver NSR• Highland Copper NSR• Casino NSR• Ollachea NSR• Yenipazar Offtake• Spring Valley NSR• Pan NSR• Nimbus Offtake
• Amulsar Stream & Offtake
• Back Forty Stream
• Lamaque NSR• Brucejack
Stream & Offtake
Source: Osisko management estimates. Note: Partial year for Orion portfolio from June 2017 onwards.
2017-2023 CAGR:Including Brucejack: 16%Exculding Brucejack: 13%
15
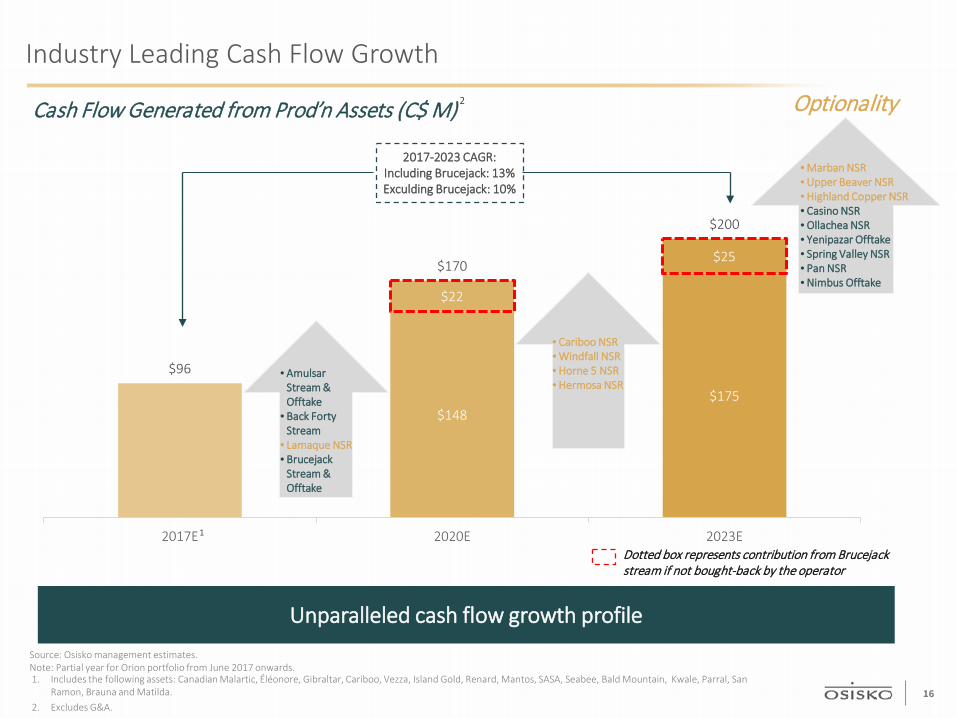
$148$175
$22
$25
$96
$170
$200
2017E 2020E 2023E
Industry Leading Cash Flow Growth
Source: Osisko management estimates. Note: Partial year for Orion portfolio from June 2017 onwards.
Unparalleled cash flow growth profile
Cash Flow Generated from Prod’n Assets (C$ M)
Dotted box represents contribution from Brucejack stream if not bought-back by the operator
• Marban NSR• Upper Beaver NSR• Highland Copper NSR• Casino NSR• Ollachea NSR• Yenipazar Offtake• Spring Valley NSR• Pan NSR• Nimbus Offtake
• Cariboo NSR• Windfall NSR• Horne 5 NSR• Hermosa NSR
• Amulsar Stream & Offtake
• Back Forty Stream
• Lamaque NSR• Brucejack
Stream & Offtake
Optionality
1. Includes the following assets: Canadian Malartic, Éléonore, Gibraltar, Cariboo, Vezza, Island Gold, Renard, Mantos, SASA, Seabee, Bald Mountain, Kwale, Parral, San Ramon, Brauna and Matilda.
2. Excludes G&A.
1
2
2017-2023 CAGR:Including Brucejack: 13%Exculding Brucejack: 10%
16
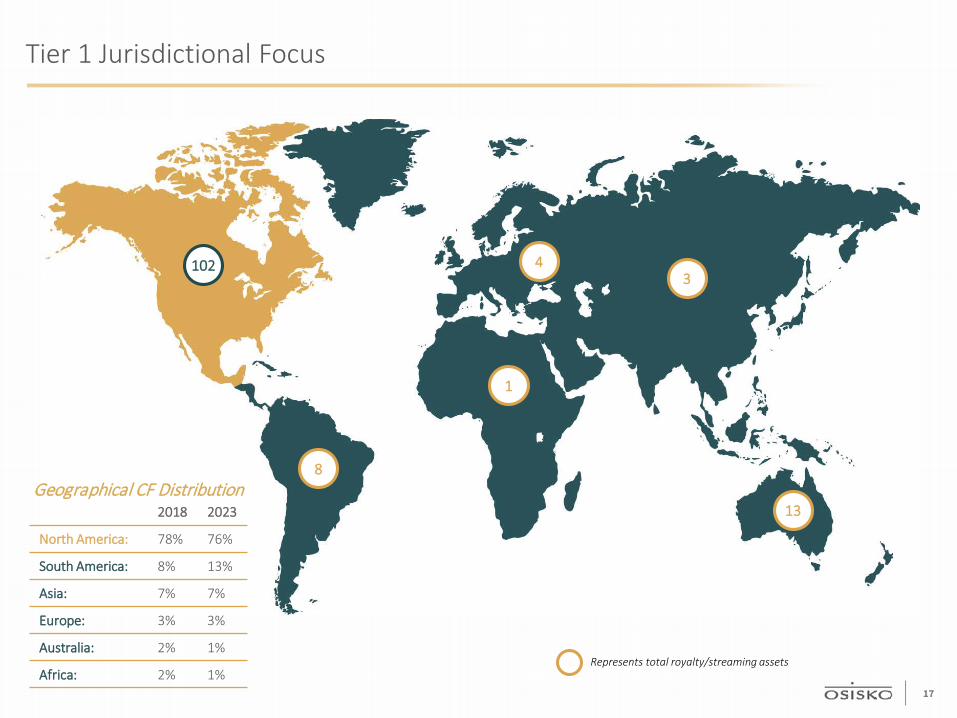
Tier 1 Jurisdictional Focus
8
1
3
13
4
Represents total royalty/streaming assets
102
2018 2023
North America: 78% 76%
South America: 8% 13%
Asia: 7% 7%
Europe: 3% 3%
Australia: 2% 1%
Africa: 2% 1%
Geographical CF Distribution
17

APPENDIX B:Mineral Reserves & Resources

Mineral Reserves and Resources
1. Agnico Eagle and Yamana public disclosure – as at December 31, 20162. Goldcorp public disclosure – as at June 30, 20163. Richmont public disclosure – as at December 31, 2016
CANADIAN MALARTIC1
RESERVES
CATEGORY AU GRADE (G/T) AU (M OZ) TONNES (MT)
Proven 0.95 1.57 51.1
Probable 1.13 5,53 152.5
Total Proven & Probable 1.08 7.10 203.7
GLOBAL RESOURCES (EXCLUDING RESERVES)*
CATEGORY AU GRADE (G/T) AU (M OZ) TONNES (MT)
Measured 1.34 0.17 4.0
Indicated 1.56 1.12 22.2
Total Meas. & Ind. 1.53 1.29 26.2
Inferred 1.46 0.43 9.2
ÉLÉONORE2
RESERVES
CATEGORY AU GRADE (G/T) AU (M OZ) TONNES (MT)
Total Proven & Probable 6.07 4.57 23.44
GLOBAL RESOURCES (EXCLUDING RESERVES)
CATEGORY AU GRADE (G/T) AU (M OZ) TONNES (MT)
Total Meas. & Ind. 5.66 0.93 5.14
Inferred 7.52 2.35 9.73
ISLAND GOLD3
RESERVES
CATEGORY AU GRADE (G/T) AU (K OZ) TONNES (KT)
Proven 8.68 159.8 573
Probable 9.31 592.4 1,978
Total Proven & Probable 9.17 752.2 2,551
GLOBAL RESOURCES (EXCLUDING RESERVES)
CATEGORY AU GRADE (G/T) AU (K OZ) TONNES (KT)
Measured 4.94 5.35 33.5
Indicated 6.01 86.10 445.5
Total Meas. & Ind. 5.94 91.45 479.0
Inferred 10.18 995.7 3,042
19
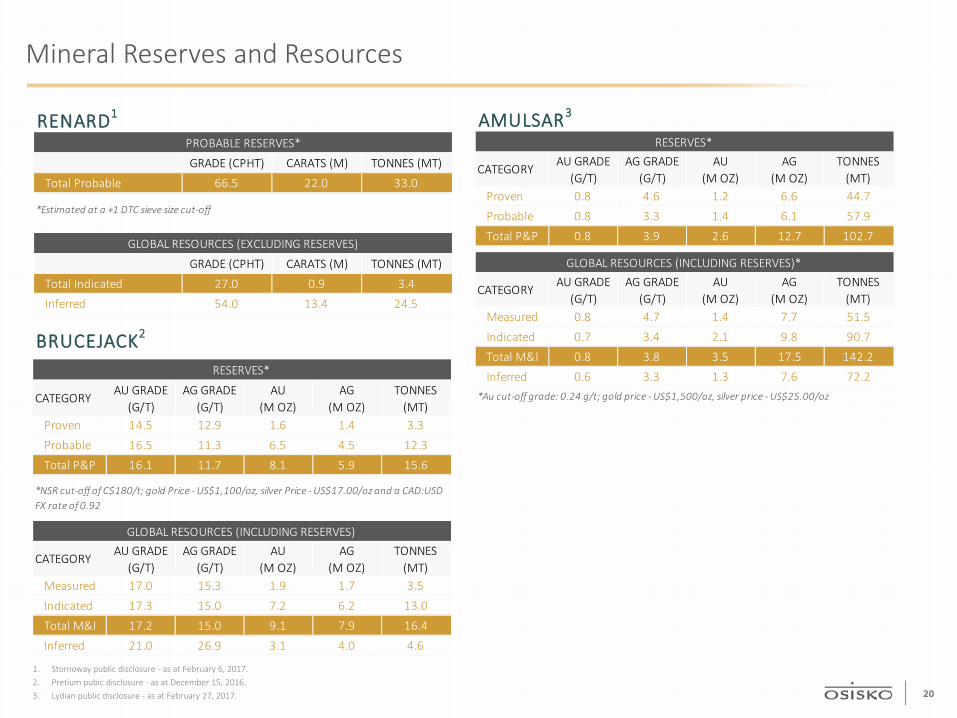
AMULSAR3
CATEGORYAU GRADE
(G/T)AG GRADE
(G/T)AU
(M OZ)AG
(M OZ)TONNES
(MT)Proven 0.8 4.6 1.2 6.6 44.7
Probable 0.8 3.3 1.4 6.1 57.9
Total P&P 0.8 3.9 2.6 12.7 102.7
CATEGORYAU GRADE
(G/T)AG GRADE
(G/T)AU
(M OZ)AG
(M OZ)TONNES
(MT)Measured 0.8 4.7 1.4 7.7 51.5
Indicated 0.7 3.4 2.1 9.8 90.7
Total M&I 0.8 3.8 3.5 17.5 142.2
Inferred 0.6 3.3 1.3 7.6 72.2*Au cut-off grade: 0.24 g/t; gold price - US$1,500/oz, silver price - US$25.00/oz
RESERVES*
GLOBAL RESOURCES (INCLUDING RESERVES)*
BRUCEJACK2
CATEGORYAU GRADE
(G/T)AG GRADE
(G/T)AU
(M OZ)AG
(M OZ)TONNES
(MT)Proven 14.5 12.9 1.6 1.4 3.3
Probable 16.5 11.3 6.5 4.5 12.3
Total P&P 16.1 11.7 8.1 5.9 15.6
CATEGORYAU GRADE
(G/T)AG GRADE
(G/T)AU
(M OZ)AG
(M OZ)TONNES
(MT)Measured 17.0 15.3 1.9 1.7 3.5
Indicated 17.3 15.0 7.2 6.2 13.0
Total M&I 17.2 15.0 9.1 7.9 16.4
Inferred 21.0 26.9 3.1 4.0 4.6
*NSR cut-off of C$180/t; gold Price - US$1,100/oz, silver Price - US$17.00/oz and a CAD:USD FX rate of 0.92
GLOBAL RESOURCES (INCLUDING RESERVES)
RESERVES*
RENARD1
PROBABLE RESERVES*
GRADE (CPHT) CARATS (M) TONNES (MT)
Total Probable 66.5 22.0 33.0
*Estimated at a +1 DTC sieve size cut-off
GLOBAL RESOURCES (EXCLUDING RESERVES)
GRADE (CPHT) CARATS (M) TONNES (MT)
Total Indicated 27.0 0.9 3.4
Inferred 54.0 13.4 24.5
Mineral Reserves and Resources
1. Stornoway public disclosure - as at February 6, 2017.2. Pretium pubic disclosure - as at December 15, 2016. 3. Lydian public disclosure - as at February 27, 2017. 20
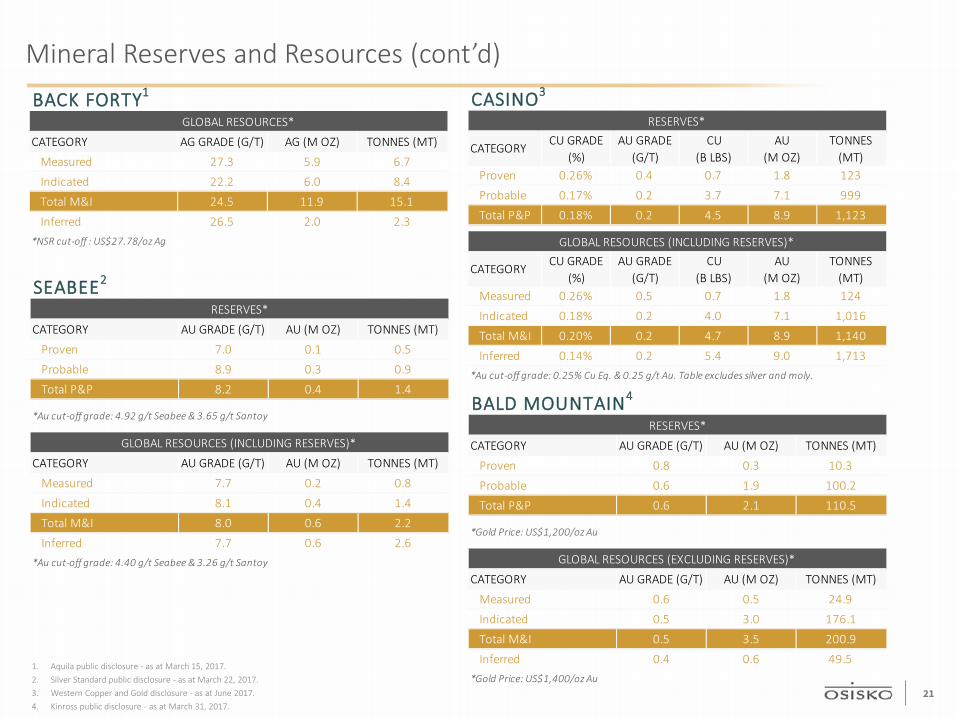
CASINO3
CATEGORYCU GRADE
(%)AU GRADE
(G/T)CU
(B LBS)AU
(M OZ)TONNES
(MT)Proven 0.26% 0.4 0.7 1.8 123
Probable 0.17% 0.2 3.7 7.1 999
Total P&P 0.18% 0.2 4.5 8.9 1,123
CATEGORYCU GRADE
(%)AU GRADE
(G/T)CU
(B LBS)AU
(M OZ)TONNES
(MT)Measured 0.26% 0.5 0.7 1.8 124
Indicated 0.18% 0.2 4.0 7.1 1,016
Total M&I 0.20% 0.2 4.7 8.9 1,140
Inferred 0.14% 0.2 5.4 9.0 1,713*Au cut-off grade: 0.25% Cu Eq. & 0.25 g/t Au. Table excludes silver and moly.
RESERVES*
GLOBAL RESOURCES (INCLUDING RESERVES)*
BALD MOUNTAIN4
RESERVES*
CATEGORY AU GRADE (G/T) AU (M OZ) TONNES (MT)
Proven 0.8 0.3 10.3
Probable 0.6 1.9 100.2
Total P&P 0.6 2.1 110.5
*Gold Price: US$1,200/oz Au
GLOBAL RESOURCES (EXCLUDING RESERVES)*
CATEGORY AU GRADE (G/T) AU (M OZ) TONNES (MT)
Measured 0.6 0.5 24.9
Indicated 0.5 3.0 176.1
Total M&I 0.5 3.5 200.9
Inferred 0.4 0.6 49.5*Gold Price: US$1,400/oz Au
BACK FORTY1
GLOBAL RESOURCES*
CATEGORY AG GRADE (G/T) AG (M OZ) TONNES (MT)
Measured 27.3 5.9 6.7
Indicated 22.2 6.0 8.4
Total M&I 24.5 11.9 15.1
Inferred 26.5 2.0 2.3*NSR cut-off : US$27.78/oz Ag
SEABEE2
RESERVES*
CATEGORY AU GRADE (G/T) AU (M OZ) TONNES (MT)
Proven 7.0 0.1 0.5
Probable 8.9 0.3 0.9
Total P&P 8.2 0.4 1.4
*Au cut-off grade: 4.92 g/t Seabee & 3.65 g/t Santoy
GLOBAL RESOURCES (INCLUDING RESERVES)*
CATEGORY AU GRADE (G/T) AU (M OZ) TONNES (MT)
Measured 7.7 0.2 0.8
Indicated 8.1 0.4 1.4
Total M&I 8.0 0.6 2.2
Inferred 7.7 0.6 2.6*Au cut-off grade: 4.40 g/t Seabee & 3.26 g/t Santoy
Mineral Reserves and Resources (cont’d)
1. Aquila public disclosure - as at March 15, 2017.2. Silver Standard public disclosure - as at March 22, 2017.3. Western Copper and Gold disclosure - as at June 2017. 4. Kinross public disclosure - as at March 31, 2017.
21


