1 © 2018 Ipsos.11111111
OUTBOUND TRAVEL FROM RUSSIA
© 2016 Ipsos. All rights reserved. Contains Ipsos' Confidential and Proprietary information and may not be disclosed or reproduced without the prior written consent of Ipsos.
Prepared for MITT’ 2018
13 March 2018
• OUTCOMES OF 2017
• OUTLOOK FOR 2018

2 © 2018 Ipsos.
Largest Russian nationwide research into consumers of goods and services
• 400 categories
• 3000 brands
• 300 lifestyle related statements
Target groupRussian population aged 10 - 75
Geography
50 Russian cities with a population of over 100,000 people
Sample
25 700 respondents (13 700 households) per year
Method Offline survey
Read more at our web site >>
BIG TRAVEL BLOCK (16+)
• Trips within Russia and outbound
• Trips abroad:• Type of trips• Number of trips and duration• Travel agencies services usage.
Travel companies• Destinations• Hotels• Means of transport• Expenses per person• Travel as lifestyle
RusIndex – quarterly surveyDATA SOURCE
3 © 2018 Ipsos.
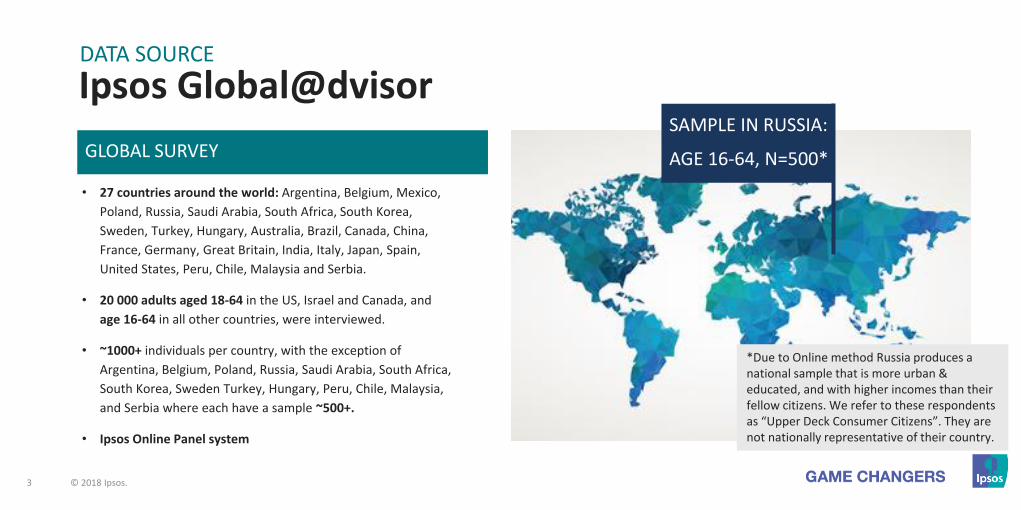
Ipsos Global@dvisorDATA SOURCE
• 27 countries around the world: Argentina, Belgium, Mexico,
Poland, Russia, Saudi Arabia, South Africa, South Korea,
Sweden, Turkey, Hungary, Australia, Brazil, Canada, China,
France, Germany, Great Britain, India, Italy, Japan, Spain,
United States, Peru, Chile, Malaysia and Serbia.
• 20 000 adults aged 18-64 in the US, Israel and Canada, and
age 16-64 in all other countries, were interviewed.
• ~1000+ individuals per country, with the exception of
Argentina, Belgium, Poland, Russia, Saudi Arabia, South Africa,
South Korea, Sweden Turkey, Hungary, Peru, Chile, Malaysia,
and Serbia where each have a sample ~500+.
• Ipsos Online Panel system
GLOBAL SURVEY
SAMPLE IN RUSSIA:
AGE 16-64, N=500*
*Due to Online method Russia produces a national sample that is more urban & educated, and with higher incomes than their fellow citizens. We refer to these respondents as “Upper Deck Consumer Citizens”. They are not nationally representative of their country.
4 © 2018 Ipsos.
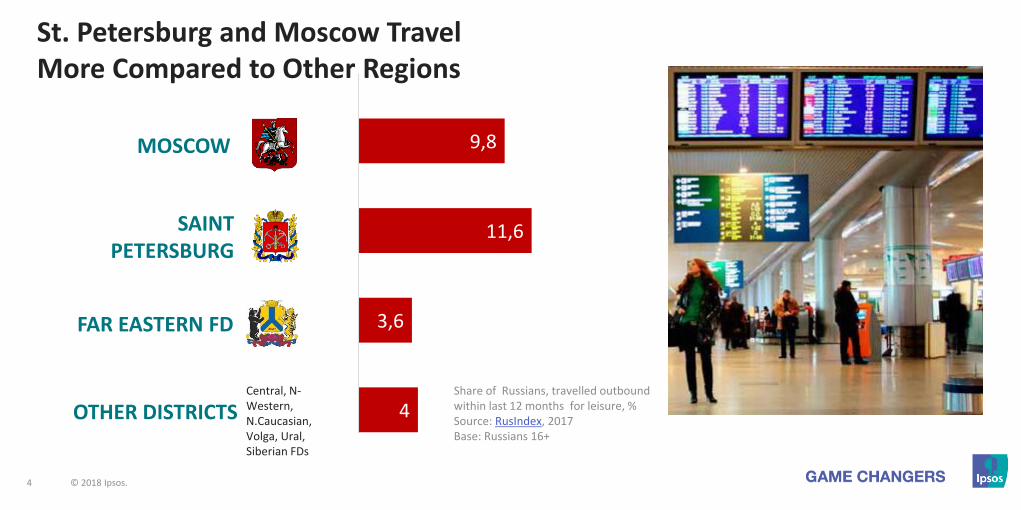
9,8
11,6
3,6
4
Moscow
St.Petersbur
g
Far EastFD
OtherFederalDistricts
Share of Russians, travelled outbound within last 12 months for leisure, %Source: RusIndex, 2017Base: Russians 16+
OTHER DISTRICTS
MOSCOW
SAINT PETERSBURG
FAR EASTERN FD
Central, N-Western, N.Caucasian, Volga, Ural, Siberian FDs
St. Petersburg and Moscow Travel More Compared to Other Regions

5 © 2018 Ipsos.
Different Regions – Different Directions
-
-
Saint Petersburg
Moscow
Europe:• FINLAND 40% • Baltic Countries 14% • Greece• Spain • Germany• BulgariaAsia:• Turkey• ThailandAfrica:• Tunisia
73
19
7
4
Europe
Asia
Africa
America
Tourism from St. Petersburg
N=297
Higher than total
Lower than total
Far Eastern
FDUral FD
Siberian FD
Volga FD
Asia:• China 52%• Thailand 18%• Turkey
Europe:• Italy
81
10
0
0
Asia
Europe
Africa
America
Tourism from Far Eastern FD
N=42
53
35
17
3
Europe
Asia
Africa
America
Travel destinations
Source: Ipsos Comcon. RusIndex, 2017Base: Russians 16+ travelled outbound (all types of travel except business, study, shop tours)
59
33
8
2
Asia
Europe
Africa
America
Tourism from Volga, Ural, Siberian FD
Asia:• TURKEY 28%• Thailand 11%
Europe:• Greece• Spain• Germany
N=493
Africa:• Egypt • Tunisia
56
38
7
4
Europe
Asia
Africa
America
Europe:• Greece 10%• Italy 8%• Bulgaria • Spain • Germany
Asia:• TURKEY 21%• Thailand
Africa:• TunisiaN=610
Tourism from Moscow

6 © 2018 Ipsos.
Which Leisure Activity Lost the Most of Russian Tourists
47
4345
27
2017
6 47
2013 2014 2015 2016 2017
Visit a resort
Excursions & sightseeing tours
Sea, river cruises
2,5
3,53,7
2,6
2,9
1,7
3,9
2,7 2,7
2013 2014 2015 2016 2017
Visiting events(festivals, sportscompetitions)
Wellness medicaltreatment
Mountain and skiholidays
Types of outbound travel. Leasure, %Source: RusIndex, 2013-2017Base: Russians 16+ travelled outbound (all types of travel except business, study, shop tours),%
vs 2016
-3 pp
Stat. significant growth/drop
+3pp
+2pp

7 © 2018 Ipsos.
34 977 ₽ 37 688 ₽ 38 564 ₽
54 230 ₽58 230 ₽
42 ₽ 51 ₽68 ₽ 74 ₽ 66 ₽
2013 2014 2015 2016 2017
Average weightedEuro rate
Source: Ipsos Comcon. RusIndex,Base: Russians 16+ travelled outbound (all types of travel except business, study, shop tours)
Average Spend per Person AVERAGE SPEND PER PERSON IN 2017INCREASED BY +7% COMPARED TO 2016
(830€)(740€) (570€)
(730€)(880€)

8 © 2018 Ipsos.
Travel Agency or Independent Booker?
Source: Ipsos Comcon. RusIndex, 2013 - 2016Base: Russians 16+ travelled outbound (all types of travel except business, study, shop tours)
77 7773
67 66
23 23 2733 34
2013 2014 2015 2016 2017
Independent travel
Used travel agencies

9 © 2018 Ipsos.
Use travel agencies
Independent travel
8%10%
6%4%
7%
2013 2014 2015 2016 2017
Saved, %
The Spend Gap Between Independent Travelers & Those Booking via a Travel Agency Grew
Source: Ipsos Comcon. RusIndexBase: Russians 16+ travelled outbound (all types of travel except business, study, shop tours)

10 © 2018 Ipsos.
Duration and Accommodation Bookings
85 84 8578 81
16 16 15 22 19
2013 2014 2015 2016 2017
Didn't use hotels services
Used hotels services
Source: Ipsos Comcon. RusIndex, 2013-2017Base: Russians 16+ travelled outbound (all types of travel except business, study, shop tours)
• In 2017 52% travelled outbound for 1,5-2weeks. Significantly grew share of those travelled for 1 week (+6pp). Significantly decreased share of those travelled longer than 2 weeks (-5pp).
• The most popular are 4* hotels
• In 2017-м share of 4* hotels users increased +2pp; 3* hotels decreased -3pp
• Usage of 5*hotels, 2* hotels and hostels didn’t change
11 © 2018 Ipsos.
Outlook for 2018Trends and environment

12 © 2018 Ipsos.
Financial Self-EstimationFinancial situation
self-estimation scale
Target Audience for
Outbound Travel
Have no financial difficulties YES
Have enough money for everything except for real estate purchase
YES
Have enough money for large household appliances
YES
Have enough money for food and clothing but not for large household appliances
no
Have enough money for food but not for clothing
no
Hardly have money for food no
45 46 45 44
38 3632
3632 33
2013H1
2013H2
2014H1
2014H2
2015H1
2015H2
2016H1
2016H2
2017H1
2017H2
TOP3 fin. self-estimate
In 2016/H2 financial situation of Russian households stopped falling and is stable for two years in a row
Russian Households. Financial elf-estimation TOP3 (Have no financial difficulties or Have enough money for everything except for real estate purchase or Have enough money for large household appliances) Source: RosIndex, 2013-2016

13 © 2018 Ipsos.
% Much Stronger / Somewhat Stronger
22%
19%
10%
15%
20%
25%
30%
35%
40%
Feb
'14
Mar
'14
Ap
r'1
4
May
'14
Jun
'14
Jul'1
4
Au
g'1
4
Sep
'14
Oct
'14
No
v'1
4
Dec
'14
Jan
'15
Feb
'15
Mar
'15
Ap
r'1
5
May
'15
Jun
e'1
5
July
'15
Au
g'1
5
Sep
'15
Oct
'15
No
v'1
5
Dec
'15
Jan
'16
Feb
'16
Mar
'16
Ap
r'1
6
May
'16
Jun
'16
Jul'1
6
Au
g'1
6
Sep
'16
Oct
'16
No
v'1
6
Dec
'16
Jan
'17
Feb
'17
Mar
'17
Ap
r'1
7
May
'17
Jun
'17
Jul'1
7
Au
g'1
7
Sep
'17
Oct
'17
No
v'1
7
Dec
'17
Jan
'18
Feb
'18
17%
23% 29%
23%
10%
15%
20%
25%
30%
35%
40%
Feb
'14
Mar
'14
Ap
r'1
4
May
'14
Jun
'14
Jul'1
4
Au
g'1
4
Sep
'14
Oct
'14
No
v'1
4
Dec
'14
Jan
'15
Feb
'15
Mar
'15
Ap
r'1
5
May
'15
Jun
e'1
5
July
'15
Au
g'1
5
Sep
'15
Oct
'15
No
v'1
5
Dec
'15
Jan
'16
Feb
'16
Mar
'16
Ap
r'1
6
May
'16
Jun
'16
Jul'1
6
Au
g'1
6
Sep
'16
Oct
'16
No
v'1
6
Dec
'16
Jan
'17
Feb
'17
Mar
20
17
Ap
r 2
01
7
May
20
17
Jun
20
17
Jul 2
01
7
Au
g 2
01
7
Sep
20
17
Oct
20
17
No
v 2
01
7
Dec
20
17
Jan
20
18
Feb
20
18
…Six Months From Now. Russia
Assessing The Economy in Local Area. Russia % Strong (Top 3 5-6-7)
Russia. Economic PulseRate the current state of the economy in your local area using a scale from 1 to 7, where 7 means a very strong economy today and 1 means a very weak economy.
Looking ahead 6 months from now, do you expect the economy in your local area to be much stronger, somewhat stronger, about the same, somewhat weaker, or much weaker than it is now?
The survey is conducted monthly in 26countries around the world via the Ipsos Online Panel system.Sample size in Russia = ~500+, aged 16-64

14 © 2018 Ipsos.
Now Close Future
Trends to Influence Travel
Russians refuse from Dachas
GenZ: “I want to see a happy face in the mirror”
Active aging: “I deserve
good rest or I continue working and have money to travel”
Real-time translation by Google Babel-Fish Earbuds
…

15 © 2018 Ipsos.
50%
Having a good education
20%Having a secure job
44%Having a successful career
37%
Having enough money to live well
83%
Having access to information
84%
Having access to entertainment like film, music, books
74%Being able to travel abroad
42%
Being able to own their own home
20%Being safe from crime or harm
24%Being able to live comfortably when they retire from work
Which of these do you think is or will be better or worse for today’s youth than for their parents? Russia, % better
38% Ipsos Global Trends 2017. Sample size in Russia = ~500+, aged 16-64
16 © 2018 Ipsos.
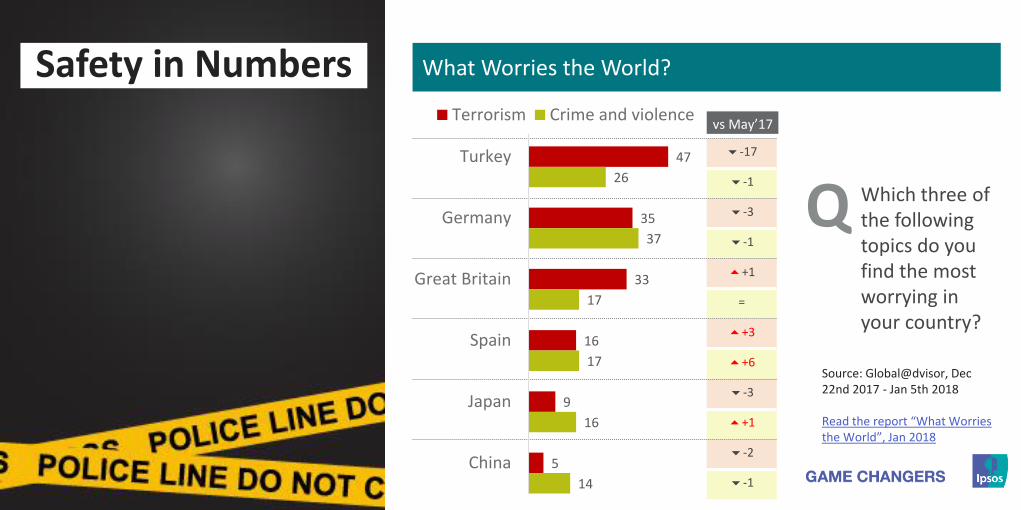
-17
-1
-3
-1
+1
=
+3
+6
-3
+1
-2
-1
47
35
33
16
9
5
26
37
17
17
16
14
Turkey
Germany
Great Britain
Spain
Japan
China
Terrorism Crime and violence
What Worries the World?
Source: Global@dvisor, Dec 22nd 2017 - Jan 5th 2018
Read the report “What Worries the World”, Jan 2018
Q
Safety in Numbers
Which three of the following topics do you find the most worrying in your country?
vs May’17
17 © 2018 Ipsos.
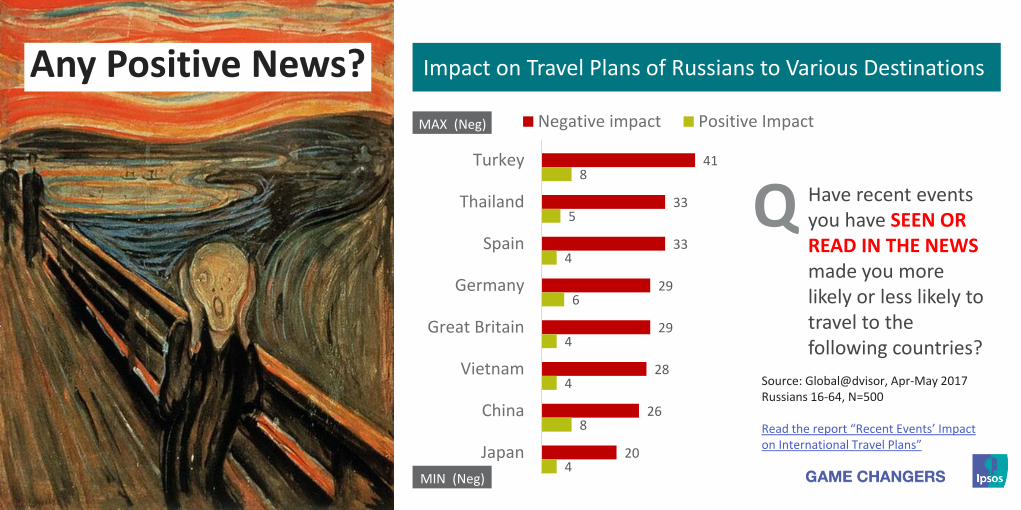
41
33
33
29
29
28
26
20
8
5
4
6
4
4
8
4
Turkey
Thailand
Spain
Germany
Great Britain
Vietnam
China
Japan
Negative impact Positive Impact
Impact on Travel Plans of Russians to Various Destinations
Source: Global@dvisor, Apr-May 2017Russians 16-64, N=500
Read the report “Recent Events’ Impact on International Travel Plans”
MAX (Neg)
MIN (Neg)
Q
Any Positive News?
Have recent events you have SEEN OR READ IN THE NEWS made you more likely or less likely to travel to the following countries?

18 © 2018 Ipsos.
Mila NovichenkovaMarketing and Communications Director
Tatyana GerasimenkoAssociate Client Service Director


