Outsourcing agile software development –
output-based metrics to manage team performance
VALUE Driven Contracting
About me2
Harold van Heeringen, Senior Consultant ADM Benchmarking at METRI.
▪ Supplier Performance Measurement
▪ IT Benchmarking
▪ Creating Price models
▪ Providing Sourcing advice
Other roles:
▪ International Software Benchmarking Standards GroupISBSG – President
▪ Netherlands Software Metrics AssociationNESMA–Board member
▪ Common Software Measurement International ConsortiumCOSMIC - Dutch representative International Advisory Council(IAC)
▪ International Cost Estimation and Analysis AssociationICEAA trainer of CEBoK chapter 12: Software Cost Estimation
▪ Speaker at many international conferences on softwaremeasurement, estimation and benchmarking
@haroldveendam
www.linkedin.com/in.haroldvanheeringen
Haroldveendam
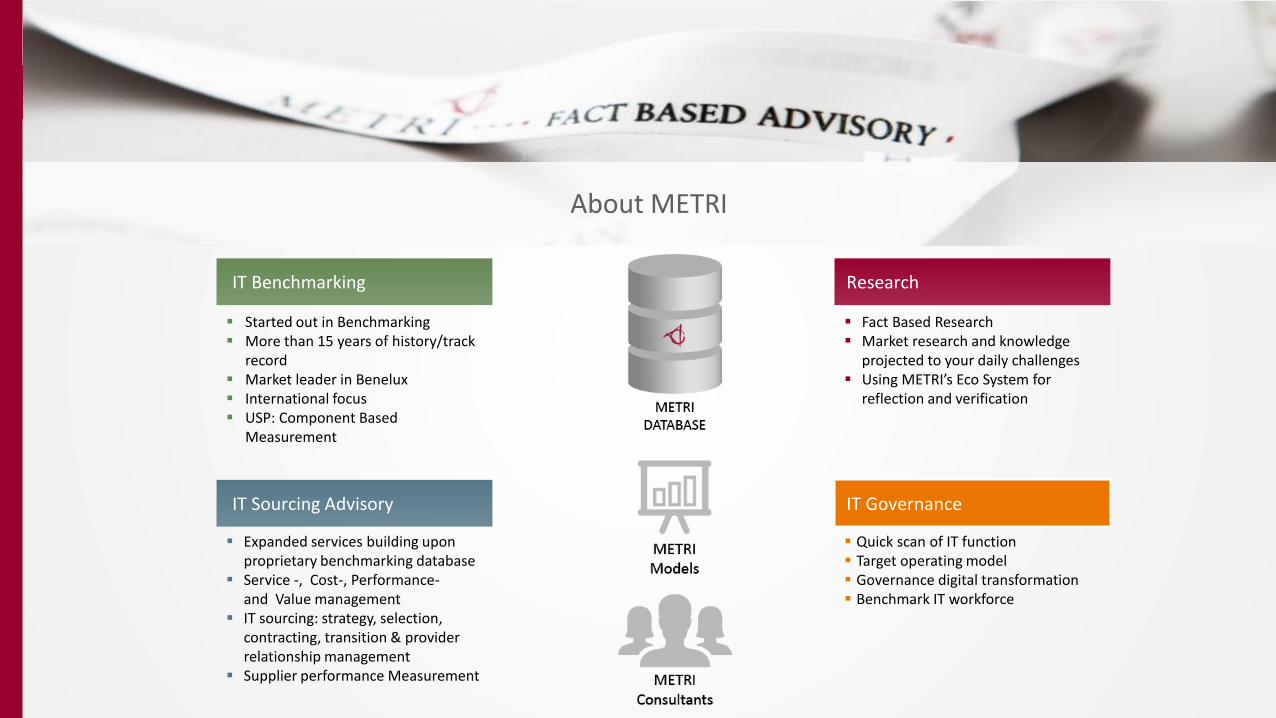
About METRI
▪ Started out in Benchmarking▪ More than 15 years of history/track
record▪ Market leader in Benelux▪ International focus▪ USP: Component Based
Measurement
▪ Expanded services building upon proprietary benchmarking database
▪ Service -, Cost-, Performance-and Value management
▪ IT sourcing: strategy, selection, contracting, transition & provider relationship management
▪ Supplier performance Measurement
▪ Fact Based Research▪ Market research and knowledge
projected to your daily challenges▪ Using METRI’s Eco System for
reflection and verification
IT Benchmarking
IT Sourcing Advisory
Research
▪ Quick scan of IT function▪ Target operating model▪ Governance digital transformation▪ Benchmark IT workforce
IT Governance
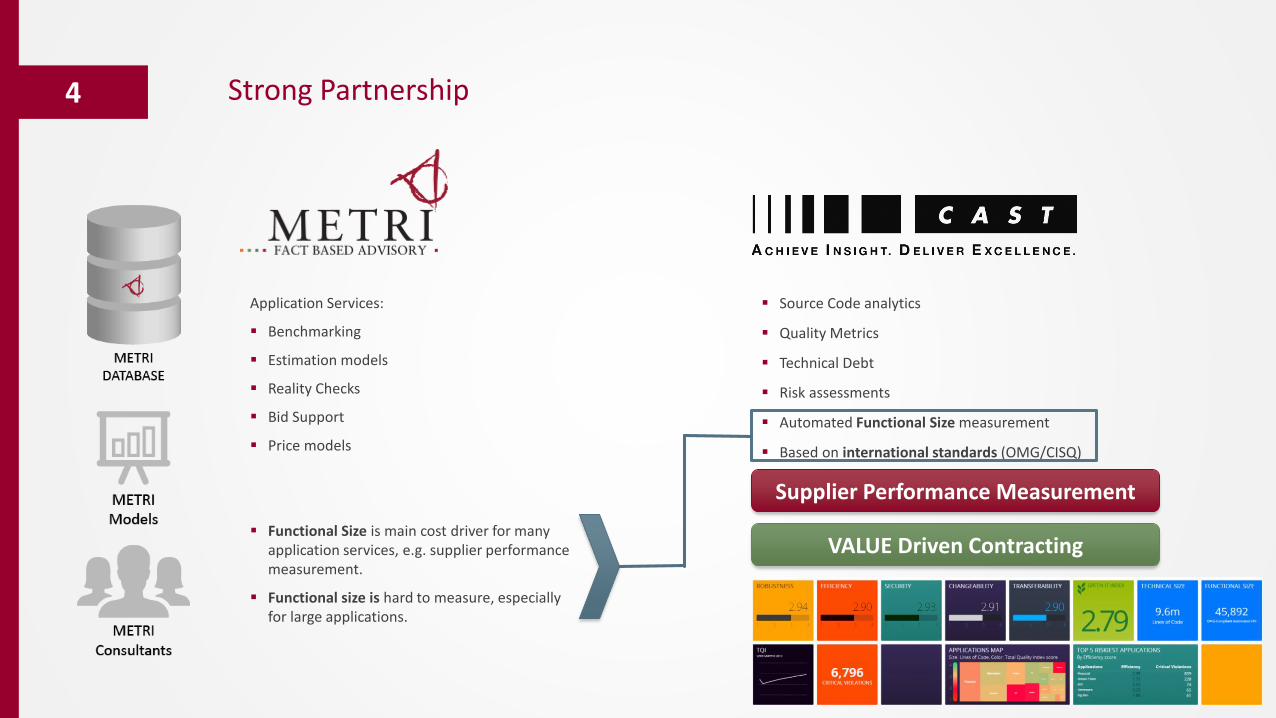
Strong Partnership4
Application Services:
▪ Benchmarking
▪ Estimation models
▪ Reality Checks
▪ Bid Support
▪ Price models
▪ Functional Size is main cost driver for many application services, e.g. supplier performance measurement.
▪ Functional size is hard to measure, especially for large applications.
▪ Source Code analytics
▪ Quality Metrics
▪ Technical Debt
▪ Risk assessments
▪ Automated Functional Size measurement
▪ Based on international standards (OMG/CISQ)
VALUE Driven Contracting
Supplier Performance Measurement
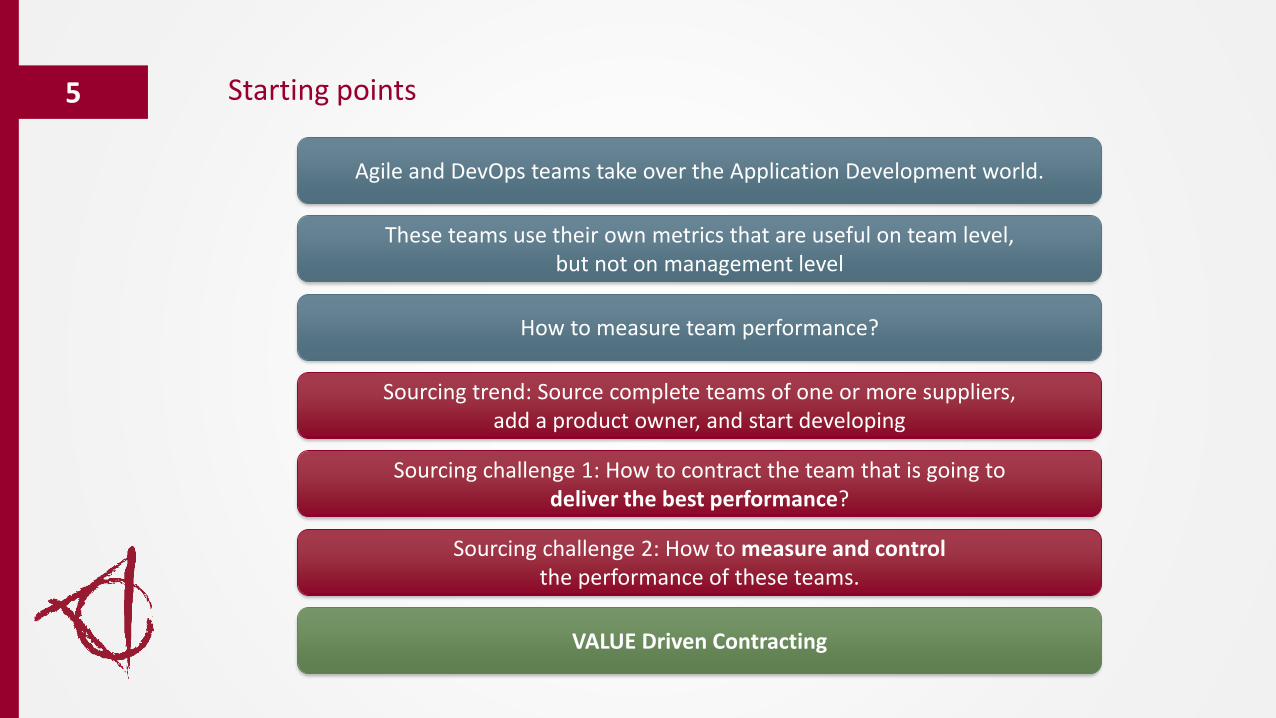
Starting points5
Agile and DevOps teams take over the Application Development world.
These teams use their own metrics that are useful on team level, but not on management level
How to measure team performance?
Sourcing trend: Source complete teams of one or more suppliers, add a product owner, and start developing
Sourcing challenge 1: How to contract the team that is going to deliver the best performance?
Sourcing challenge 2: How to measure and control the performance of these teams.
VALUE Driven Contracting
Performance Measurement of Agile/DevOps teams
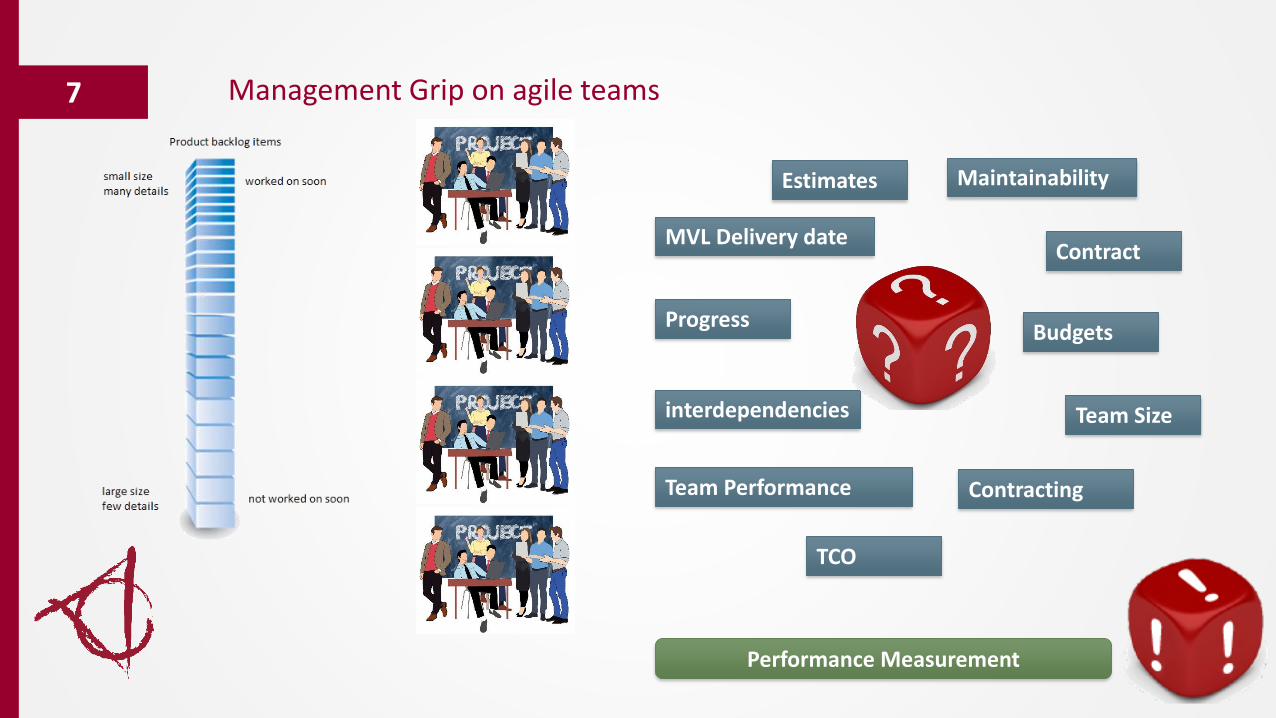
Management Grip on agile teams7
Estimates
Budgets
Team Sizeinterdependencies
Progress
MVL Delivery date
Team Performance
Maintainability
TCO
Contract
Contracting
Performance Measurement
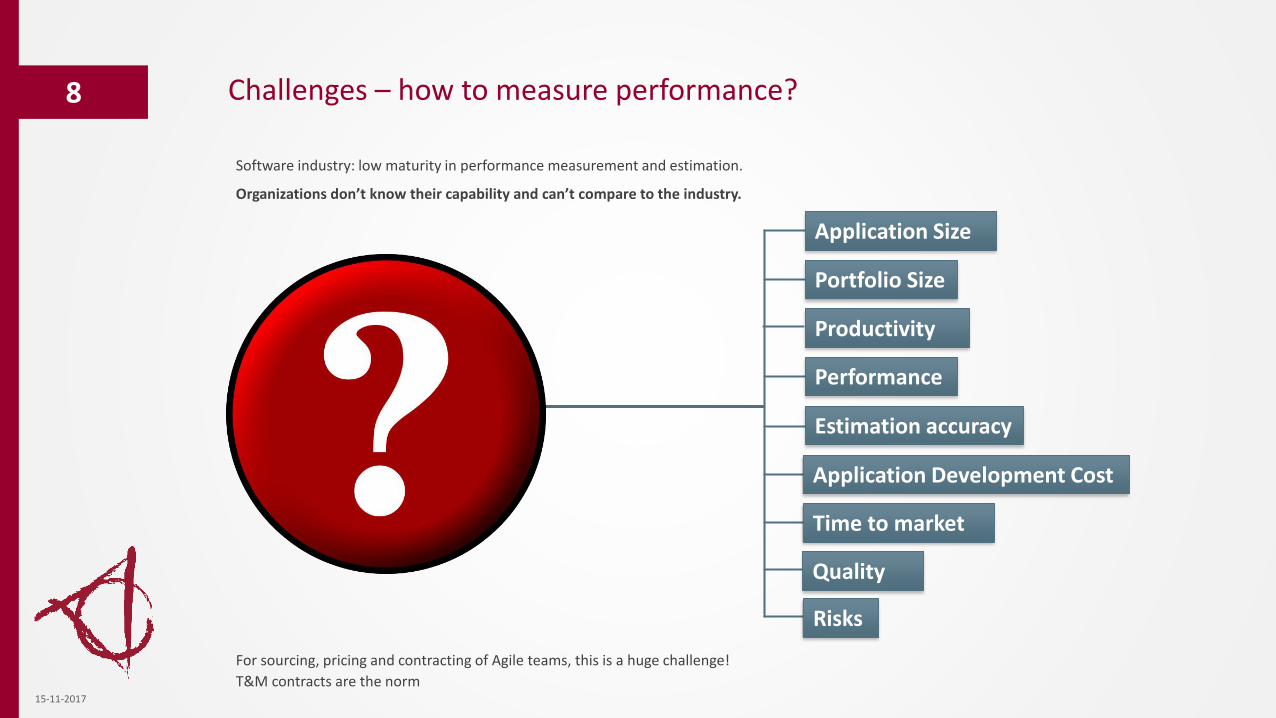
Challenges – how to measure performance?8
15-11-2017
Software industry: low maturity in performance measurement and estimation.
Organizations don’t know their capability and can’t compare to the industry.
Application Size
Time to market
Performance
Productivity
Application Development Cost
Portfolio Size
Quality
Risks
Estimation accuracy
For sourcing, pricing and contracting of Agile teams, this is a huge challenge!
T&M contracts are the norm
Performance Measurement9
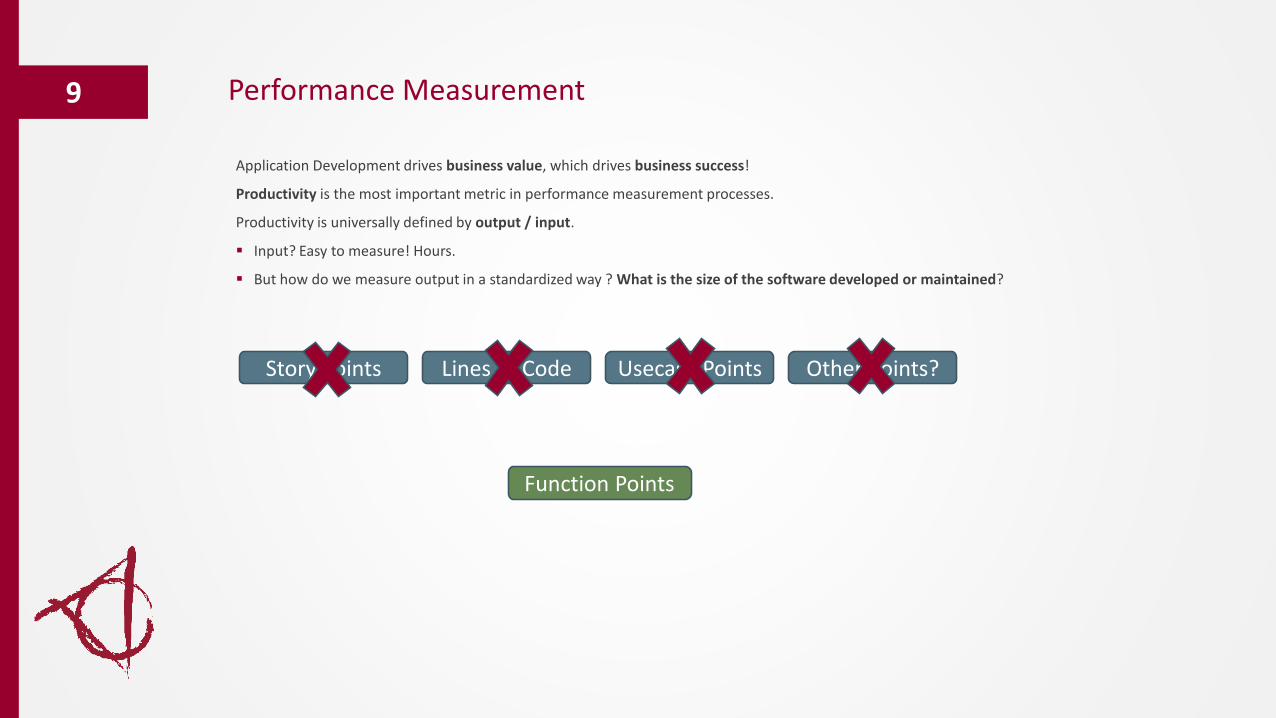
Application Development drives business value, which drives business success!
Productivity is the most important metric in performance measurement processes.
Productivity is universally defined by output / input.
▪ Input? Easy to measure! Hours.
▪ But how do we measure output in a standardized way ? What is the size of the software developed or maintained?
Story Points Lines of Code Usecase Points Other Points?
Function Points
Standardized output measurement: Functional Size10
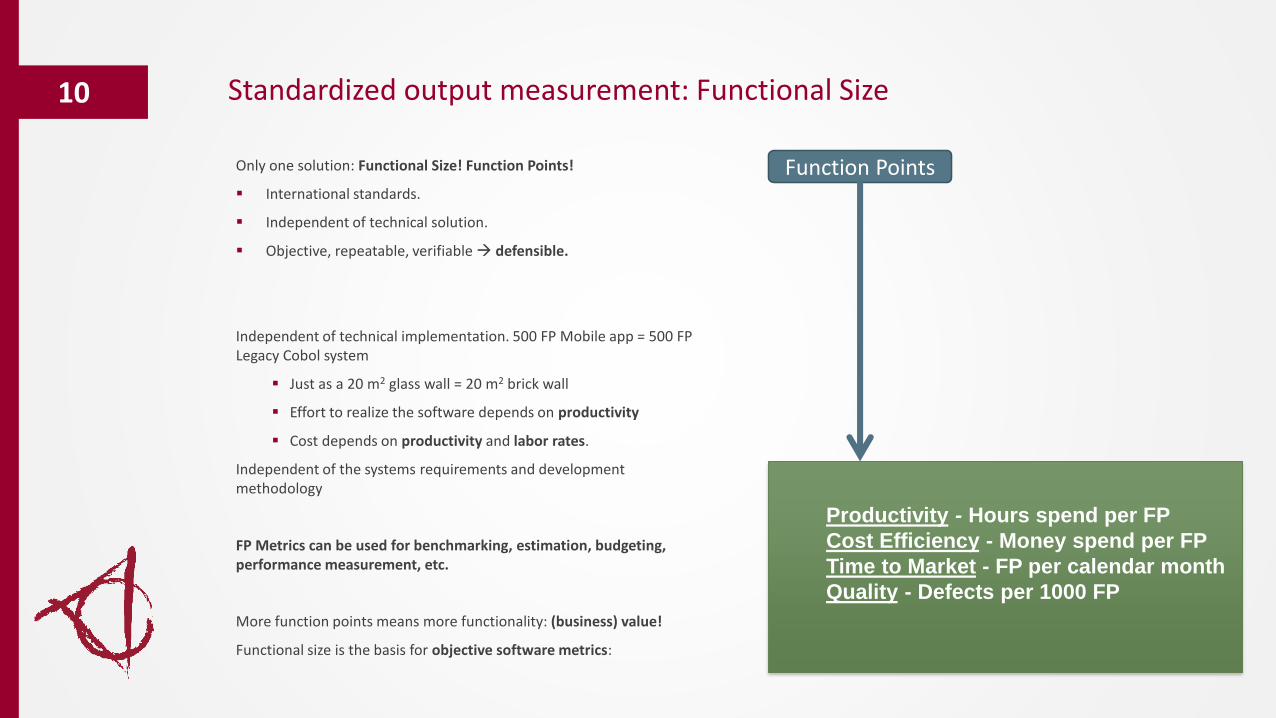
Productivity - Hours spend per FP
Cost Efficiency - Money spend per FP
Time to Market - FP per calendar month
Quality - Defects per 1000 FP
Only one solution: Functional Size! Function Points!
▪ International standards.
▪ Independent of technical solution.
▪ Objective, repeatable, verifiable defensible.
Independent of technical implementation. 500 FP Mobile app = 500 FP Legacy Cobol system
▪ Just as a 20 m2 glass wall = 20 m2 brick wall
▪ Effort to realize the software depends on productivity
▪ Cost depends on productivity and labor rates.
Independent of the systems requirements and development methodology
FP Metrics can be used for benchmarking, estimation, budgeting, performance measurement, etc.
More function points means more functionality: (business) value!
Functional size is the basis for objective software metrics:
Function Points

Value Driven Contracting
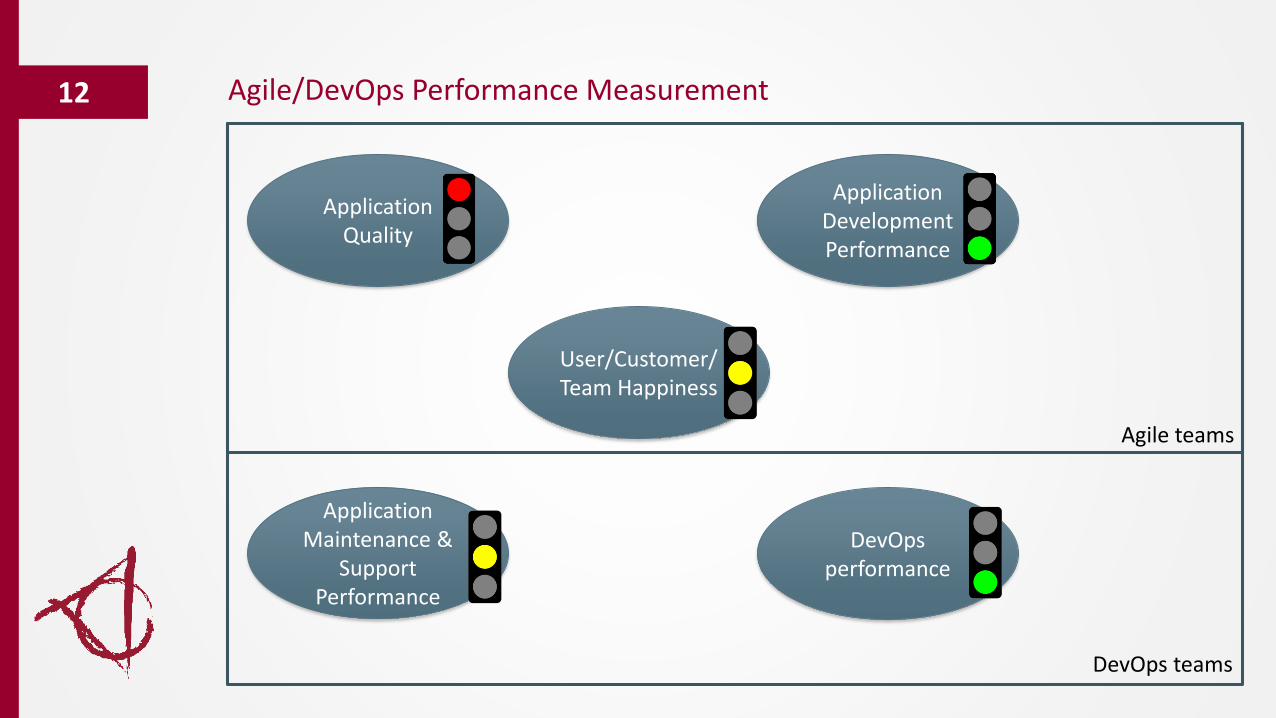
Agile/DevOps Performance Measurement12
Application Quality
Application Development Performance
Application Maintenance &
Support Performance
User/Customer/Team Happiness
DevOps performance
Agile teams
DevOps teams
Value Driven Contracting13
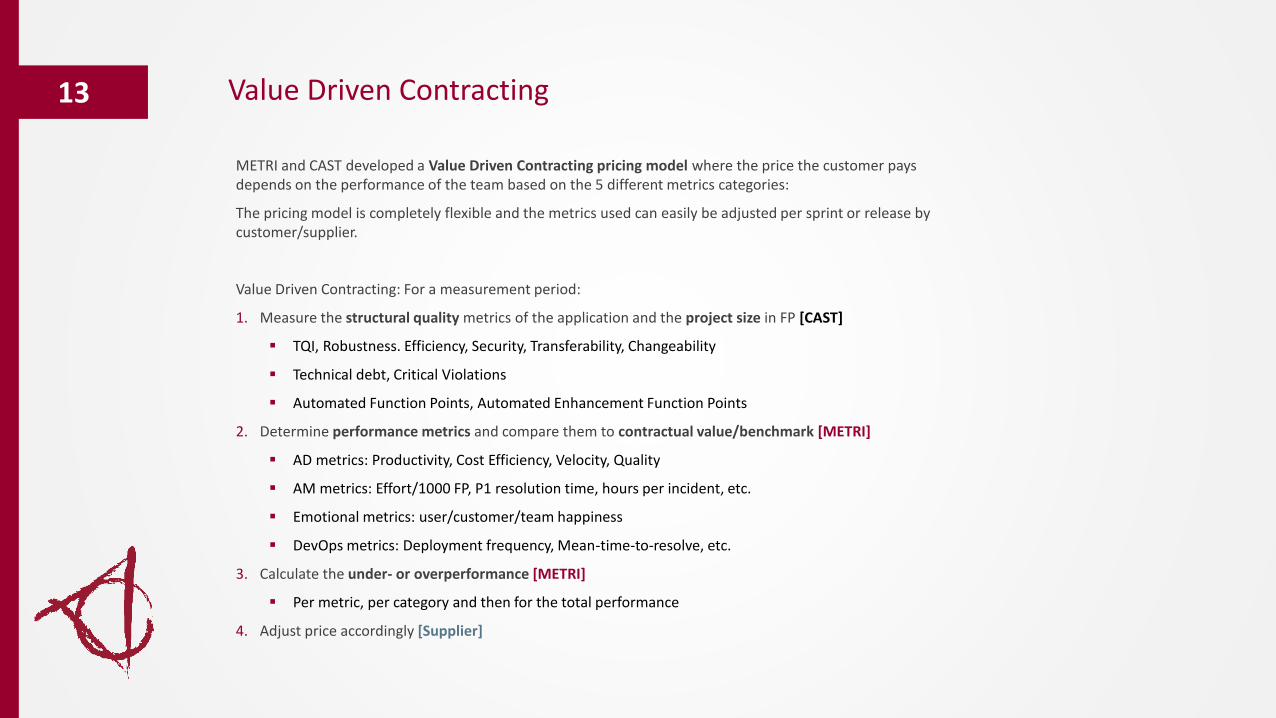
METRI and CAST developed a Value Driven Contracting pricing model where the price the customer pays depends on the performance of the team based on the 5 different metrics categories:
The pricing model is completely flexible and the metrics used can easily be adjusted per sprint or release by customer/supplier.
Value Driven Contracting: For a measurement period:
1. Measure the structural quality metrics of the application and the project size in FP [CAST]
▪ TQI, Robustness. Efficiency, Security, Transferability, Changeability
▪ Technical debt, Critical Violations
▪ Automated Function Points, Automated Enhancement Function Points
2. Determine performance metrics and compare them to contractual value/benchmark [METRI]
▪ AD metrics: Productivity, Cost Efficiency, Velocity, Quality
▪ AM metrics: Effort/1000 FP, P1 resolution time, hours per incident, etc.
▪ Emotional metrics: user/customer/team happiness
▪ DevOps metrics: Deployment frequency, Mean-time-to-resolve, etc.
3. Calculate the under- or overperformance [METRI]
▪ Per metric, per category and then for the total performance
4. Adjust price accordingly [Supplier]
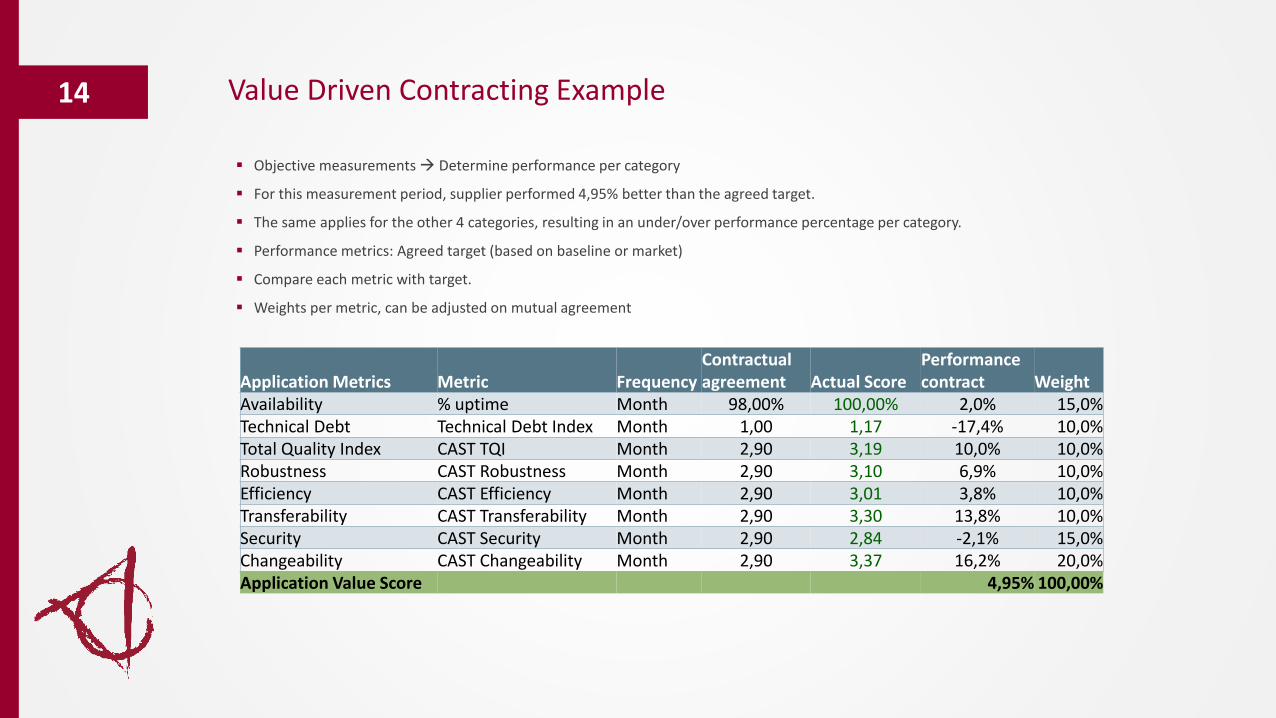
Value Driven Contracting Example14
Application Metrics Metric FrequencyContractual agreement Actual Score
Performance contract Weight
Availability % uptime Month 98,00% 100,00% 2,0% 15,0%Technical Debt Technical Debt Index Month 1,00 1,17 -17,4% 10,0%Total Quality Index CAST TQI Month 2,90 3,19 10,0% 10,0%Robustness CAST Robustness Month 2,90 3,10 6,9% 10,0%Efficiency CAST Efficiency Month 2,90 3,01 3,8% 10,0%Transferability CAST Transferability Month 2,90 3,30 13,8% 10,0%Security CAST Security Month 2,90 2,84 -2,1% 15,0%Changeability CAST Changeability Month 2,90 3,37 16,2% 20,0%Application Value Score 4,95% 100,00%
▪ Objective measurements Determine performance per category
▪ For this measurement period, supplier performed 4,95% better than the agreed target.
▪ The same applies for the other 4 categories, resulting in an under/over performance percentage per category.
▪ Performance metrics: Agreed target (based on baseline or market)
▪ Compare each metric with target.
▪ Weights per metric, can be adjusted on mutual agreement
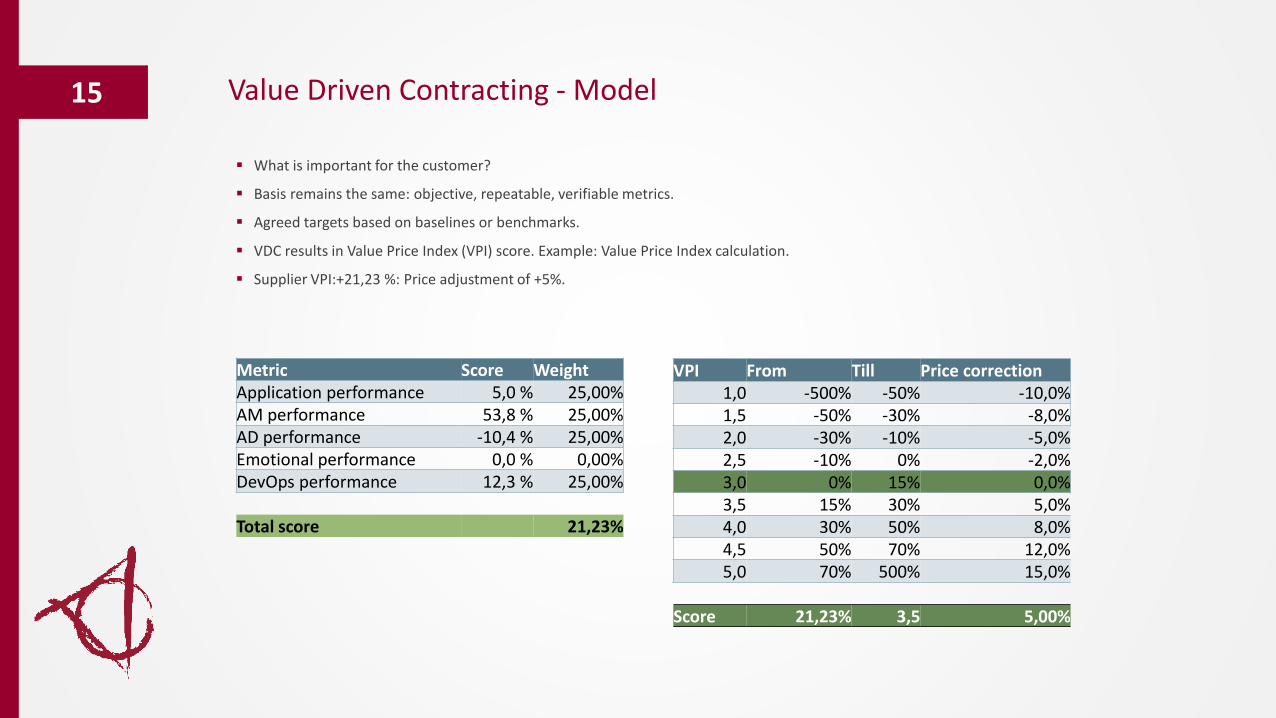
Value Driven Contracting - Model15
▪ What is important for the customer?
▪ Basis remains the same: objective, repeatable, verifiable metrics.
▪ Agreed targets based on baselines or benchmarks.
▪ VDC results in Value Price Index (VPI) score. Example: Value Price Index calculation.
▪ Supplier VPI:+21,23 %: Price adjustment of +5%.
Metric Score WeightApplication performance 5,0 % 25,00%AM performance 53,8 % 25,00%AD performance -10,4 % 25,00%Emotional performance 0,0 % 0,00%DevOps performance 12,3 % 25,00%
Total score 21,23%
VPI From Till Price correction1,0 -500% -50% -10,0%1,5 -50% -30% -8,0%2,0 -30% -10% -5,0%2,5 -10% 0% -2,0%3,0 0% 15% 0,0%3,5 15% 30% 5,0%4,0 30% 50% 8,0%4,5 50% 70% 12,0%5,0 70% 500% 15,0%
Score 21,23% 3,5 5,00%
Why is Value Driven Contracting interesting for Customer and Suppliers?16
Customers
▪ Improved transparency.
▪ Contracting based on output instead of input and cheap rates.
▪ Incentive for supplier to deliver value, not burn hours.
▪ Influence to adjust the measurement model every period.
▪ Pay more for excellent value, pay less for underperformance.
Suppliers
▪ Win business by being transparent.
▪ Stay away from rate card sourcing.
▪ Rewarded for improvement and delivering value to the customer.
▪ Higher profits by overperformance instead of lower profits by discounts on hour rates.
▪ Show the world how good you are.


Backup slides
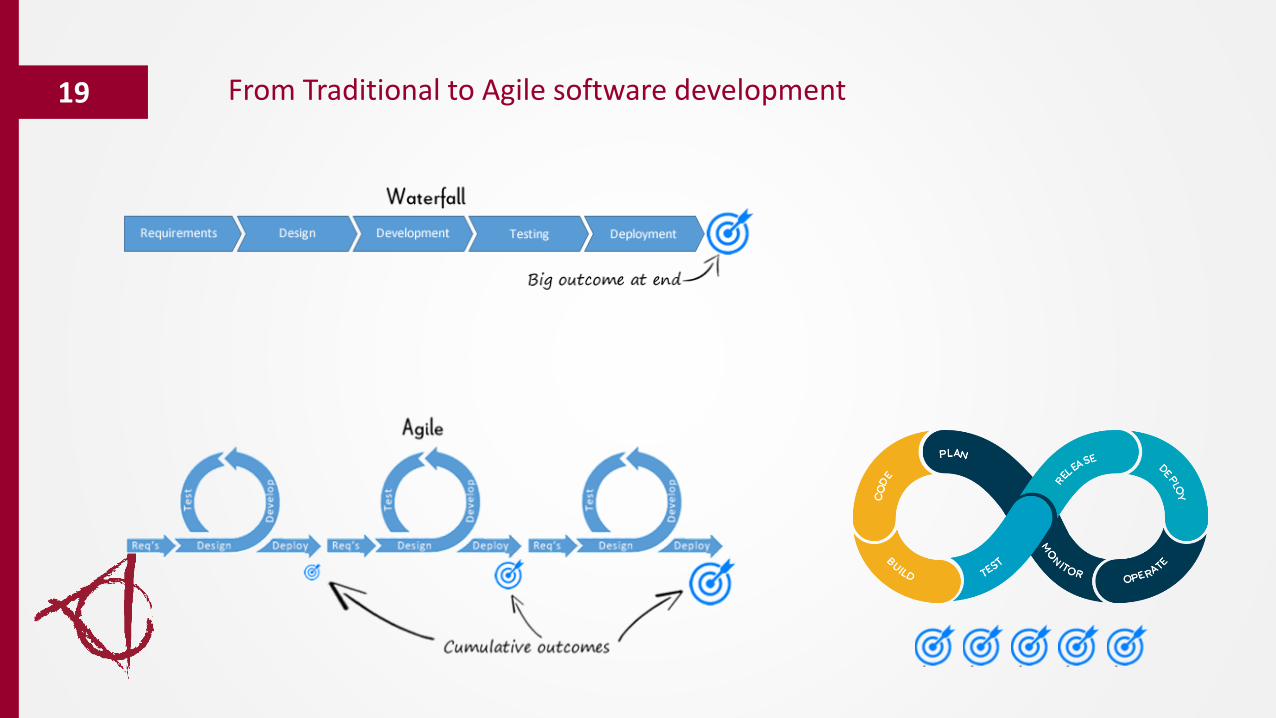
From Traditional to Agile software development19
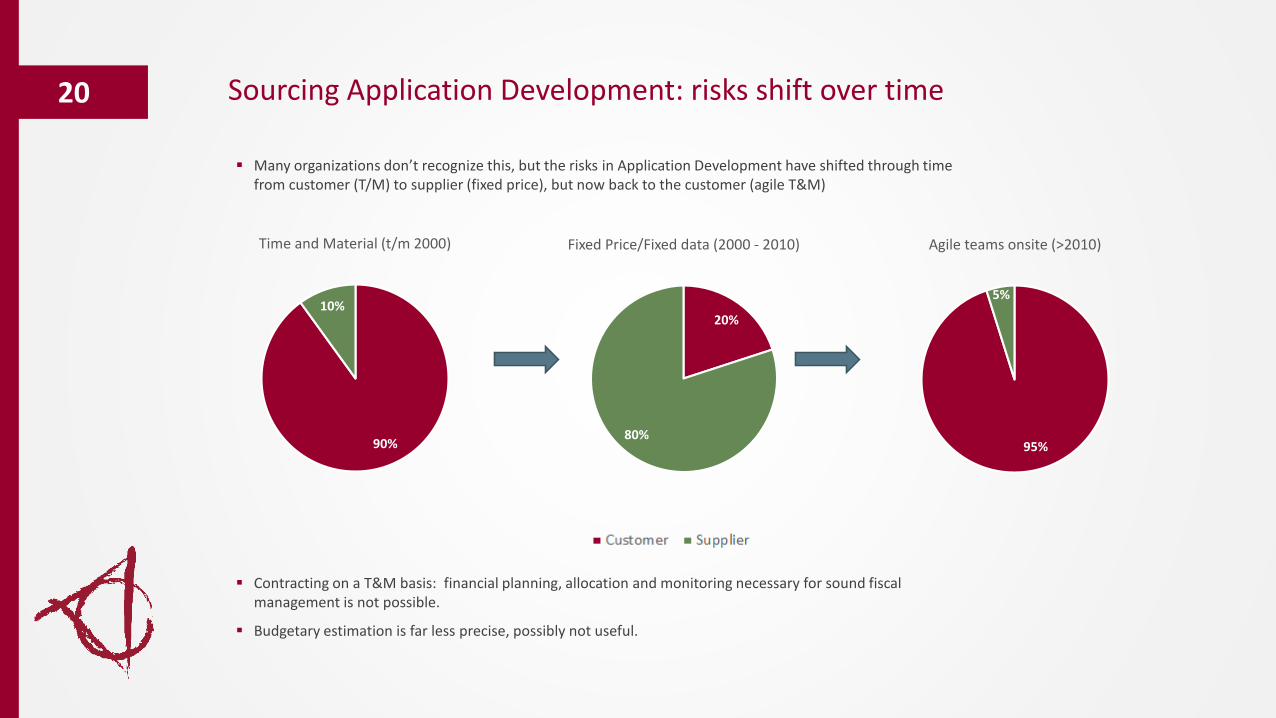
Sourcing Application Development: risks shift over time20
▪ Many organizations don’t recognize this, but the risks in Application Development have shifted through time from customer (T/M) to supplier (fixed price), but now back to the customer (agile T&M)
▪ Contracting on a T&M basis: financial planning, allocation and monitoring necessary for sound fiscal management is not possible.
▪ Budgetary estimation is far less precise, possibly not useful.
90%
10%
Time and Material (t/m 2000)
20%
80%
Fixed Price/Fixed data (2000 - 2010)
95%
5%
Agile teams onsite (>2010)
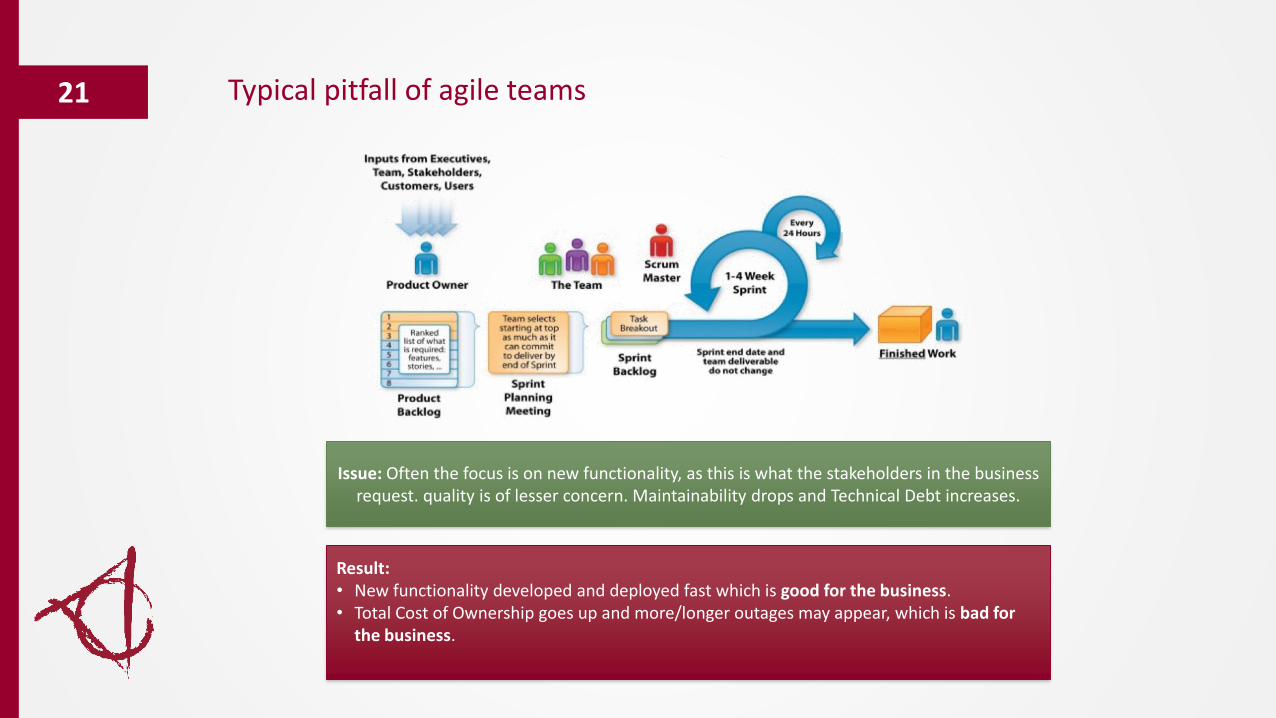
Typical pitfall of agile teams
Issue: Often the focus is on new functionality, as this is what the stakeholders in the business request. quality is of lesser concern. Maintainability drops and Technical Debt increases.
Result:• New functionality developed and deployed fast which is good for the business.• Total Cost of Ownership goes up and more/longer outages may appear, which is bad for
the business.
21
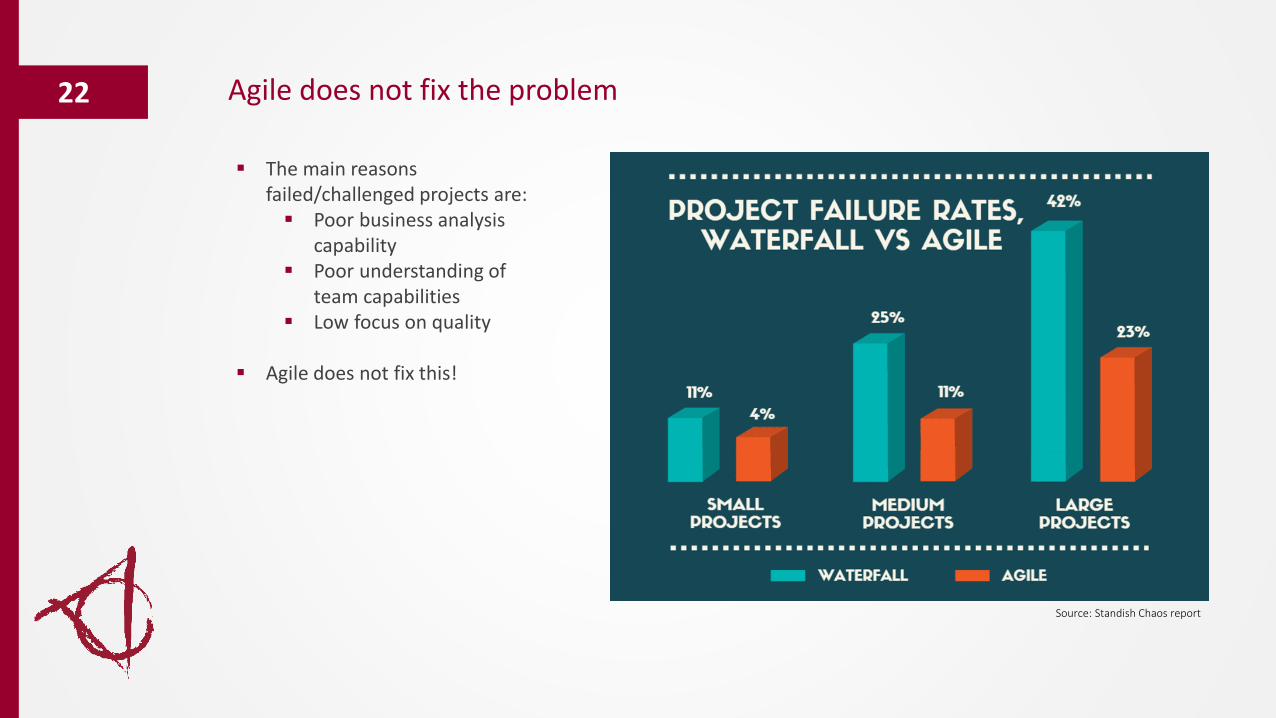
Agile does not fix the problem
Source: Standish Chaos report
▪ The main reasons failed/challenged projects are:▪ Poor business analysis
capability▪ Poor understanding of
team capabilities ▪ Low focus on quality
▪ Agile does not fix this!
22

Sourcing Application Development: risks shift over time23
▪ Many organizations don’t recognize this, but the risks in Application Development have shifted through time from customer (T/M) to supplier (fixed price), but now back to the customer (agile T&M)
▪ Contracting on a T&M basis: financial planning, allocation and monitoring necessary for sound fiscal management is not possible.
▪ Budgetary estimation is far less precise, possibly not useful.
90%
10%
Time and Material (t/m 2000)
20%
80%
Fixed Price/Fixed data (2000 - 2010)
95%
5%
Agile teams onsite (>2010)
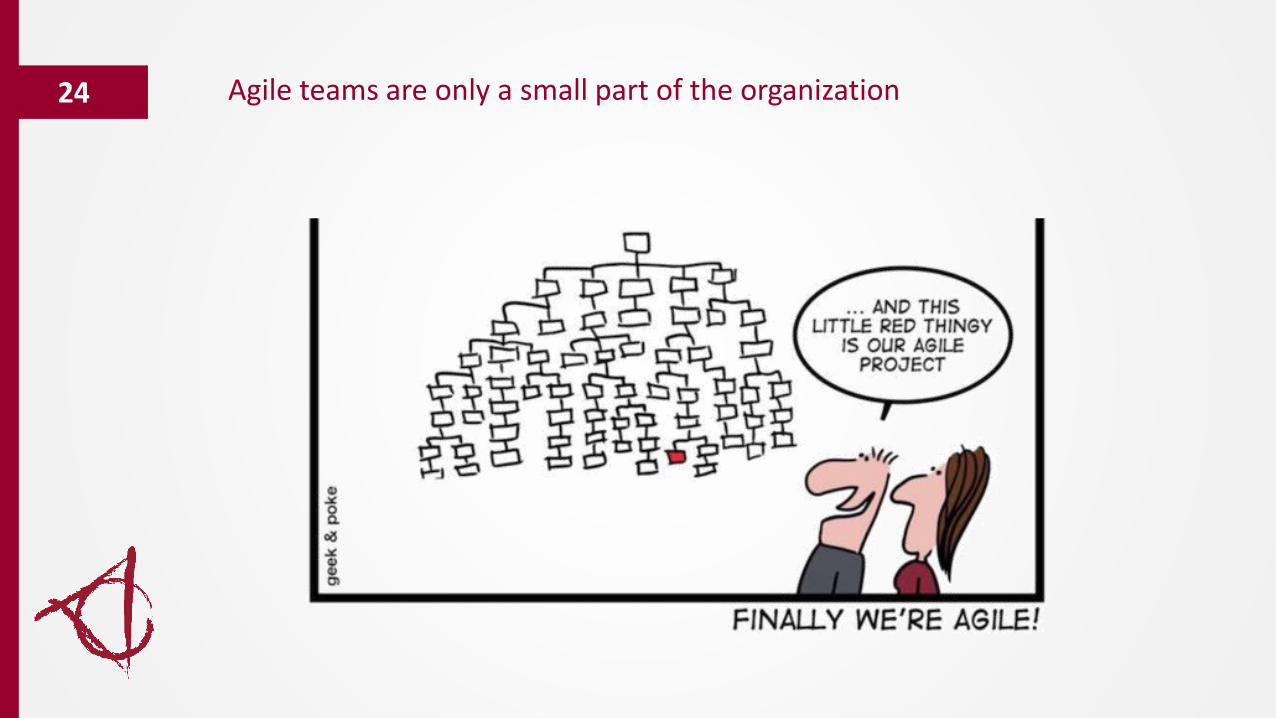
Agile teams are only a small part of the organization24
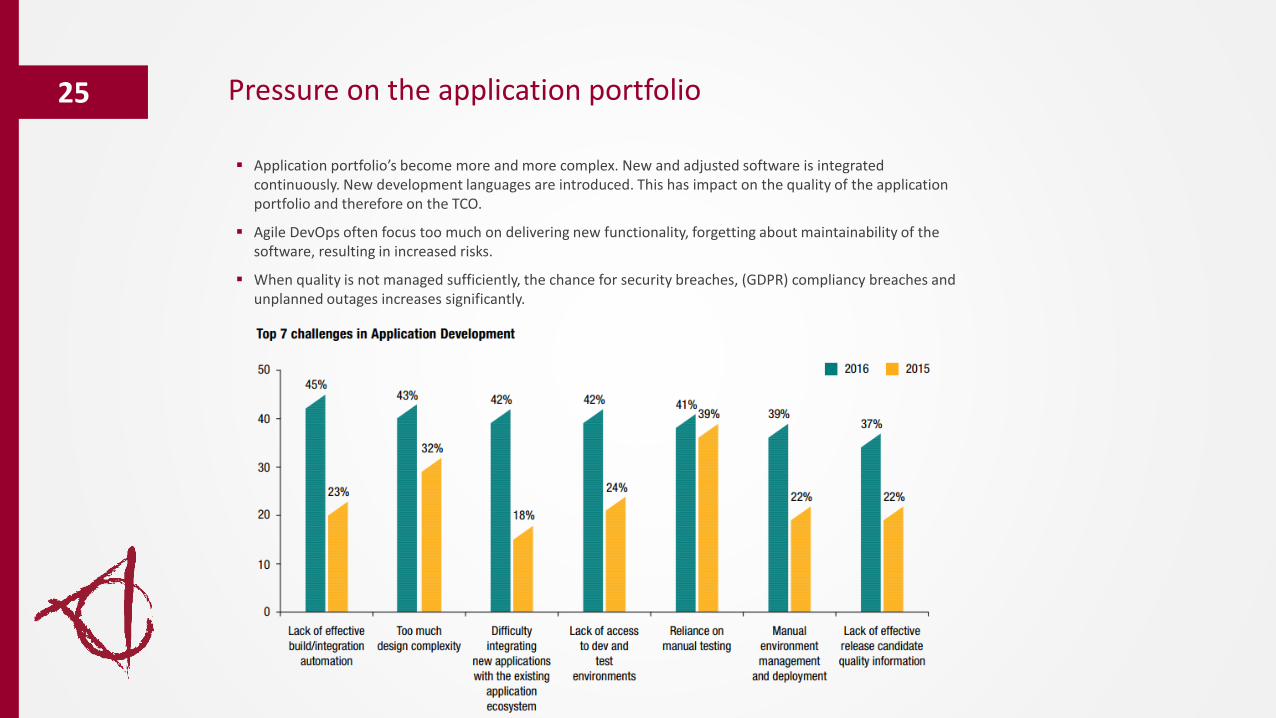
Pressure on the application portfolio25
▪ Application portfolio’s become more and more complex. New and adjusted software is integrated continuously. New development languages are introduced. This has impact on the quality of the application portfolio and therefore on the TCO.
▪ Agile DevOps often focus too much on delivering new functionality, forgetting about maintainability of the software, resulting in increased risks.
▪ When quality is not managed sufficiently, the chance for security breaches, (GDPR) compliancy breaches and unplanned outages increases significantly.
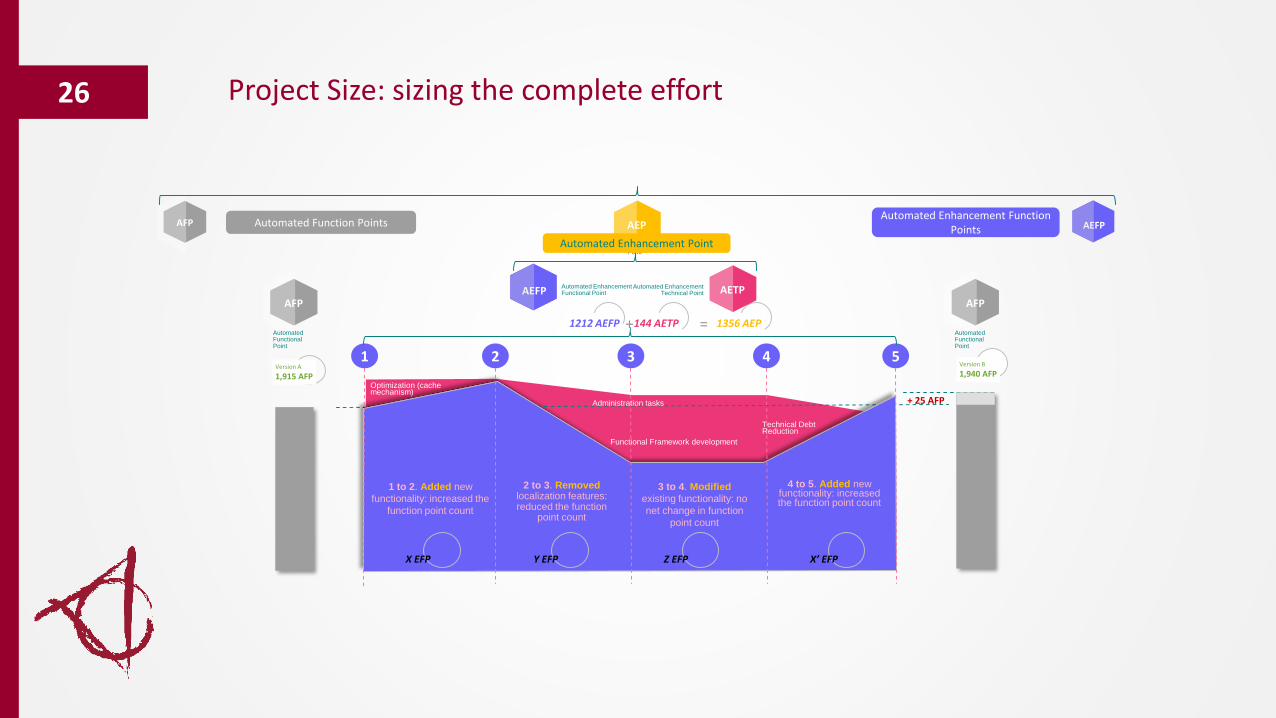
Project Size: sizing the complete effort26
Automated Function PointsAutomated Enhancement Function
Points
+ 25 AFP
1 to 2. Added new
functionality: increased the
function point count
2 to 3. Removedlocalization features: reduced the function
point count
3 to 4. Modified
existing functionality: no
net change in function
point count
4 to 5. Added new functionality: increased the function point count
X EFP Y EFP Z EFP X’ EFP
1 2 3 4 5
AFP
Automated Functional Point
Version A
1,915 AFP
Version B
1,940 AFP
AFP
Automated Functional Point
AFP AEFP
Functional Framework development
Optimization (cache mechanism)
Administration tasks
Technical Debt Reduction
1212 AEFP 144 AETP 1356 AEP+ =
AEP
AEFPAutomated Enhancement Functional Point AETPAutomated Enhancement
Technical Point
Automated Enhancement Point
Automated Enhancement Point
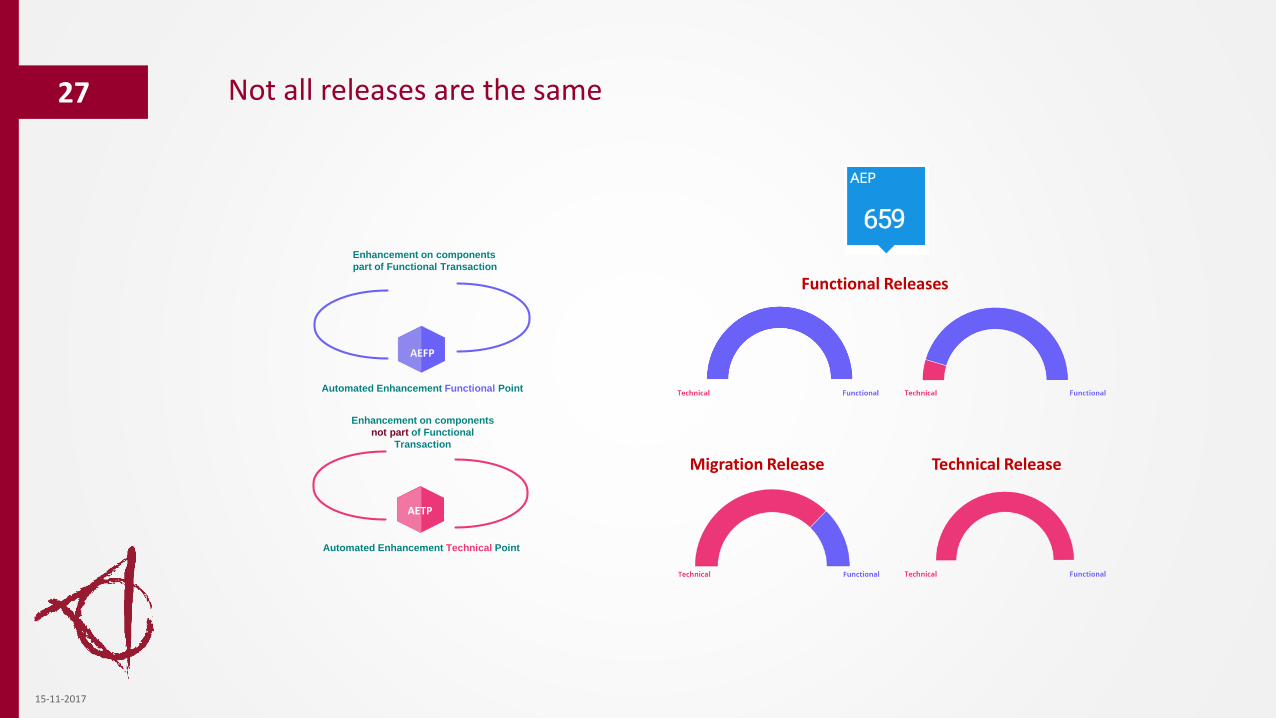
Not all releases are the same27
15-11-2017
AEFP
Automated Enhancement Functional Point
AETP
Automated Enhancement Technical Point
Enhancement on components
part of Functional Transaction
Enhancement on components
not part of Functional
Transaction
Functional Releases
Technical ReleaseMigration Release
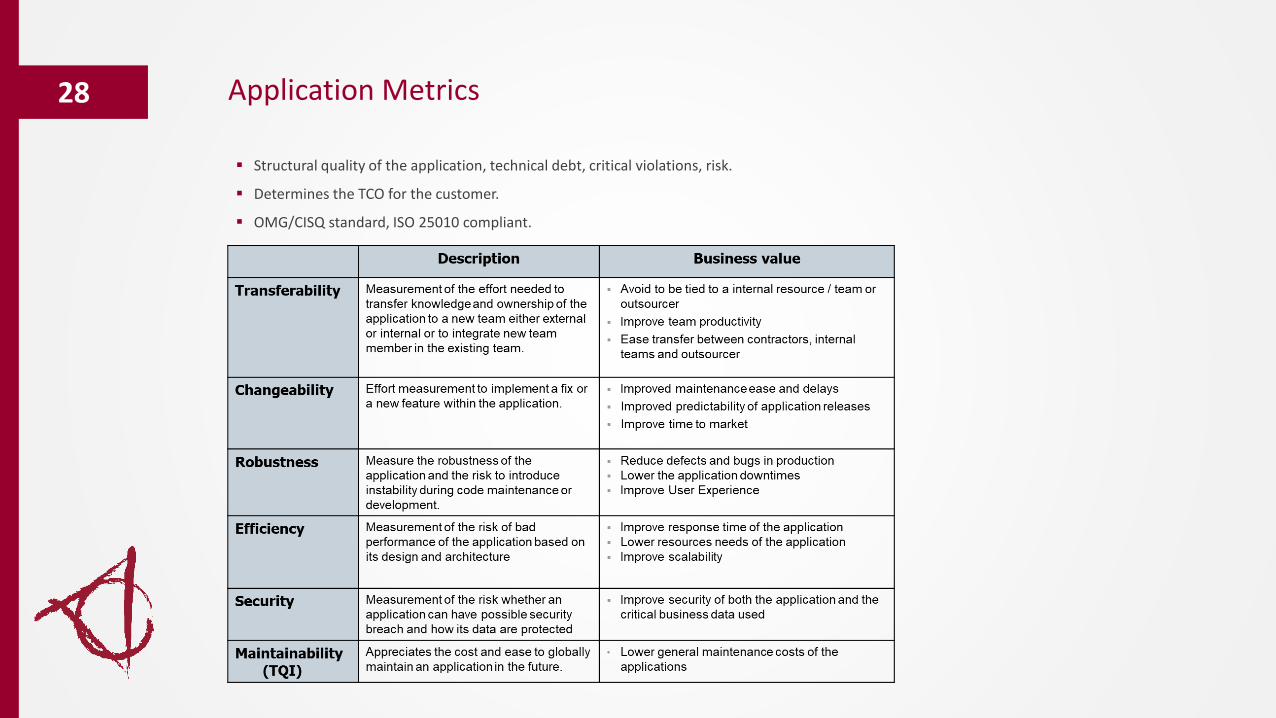
Application Metrics28
▪ Structural quality of the application, technical debt, critical violations, risk.
▪ Determines the TCO for the customer.
▪ OMG/CISQ standard, ISO 25010 compliant.
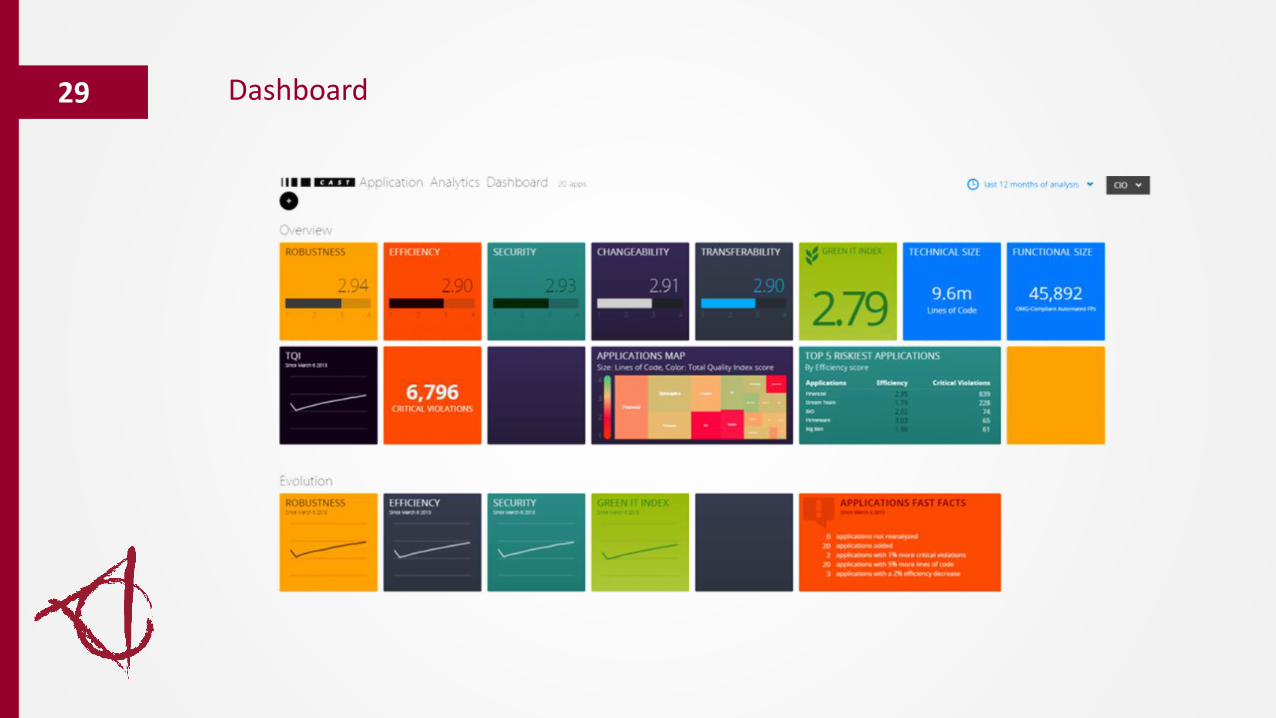
Dashboard29
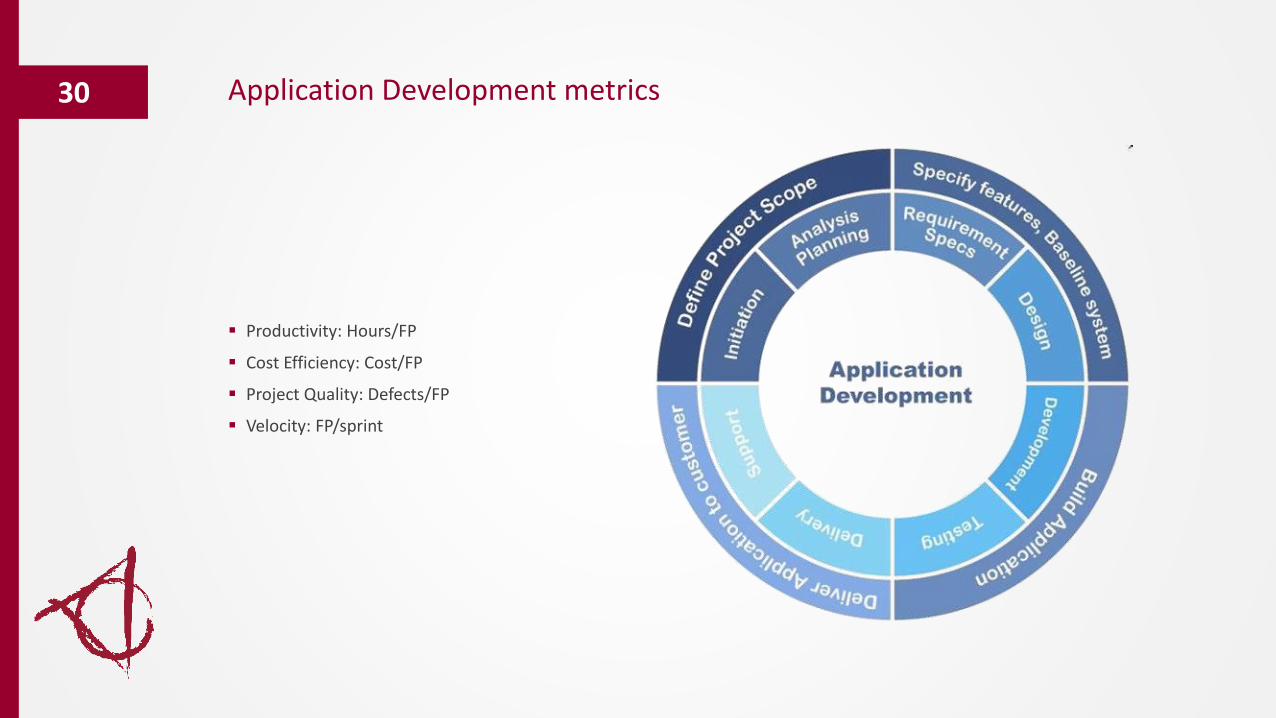
Application Development metrics30
▪ Productivity: Hours/FP
▪ Cost Efficiency: Cost/FP
▪ Project Quality: Defects/FP
▪ Velocity: FP/sprint
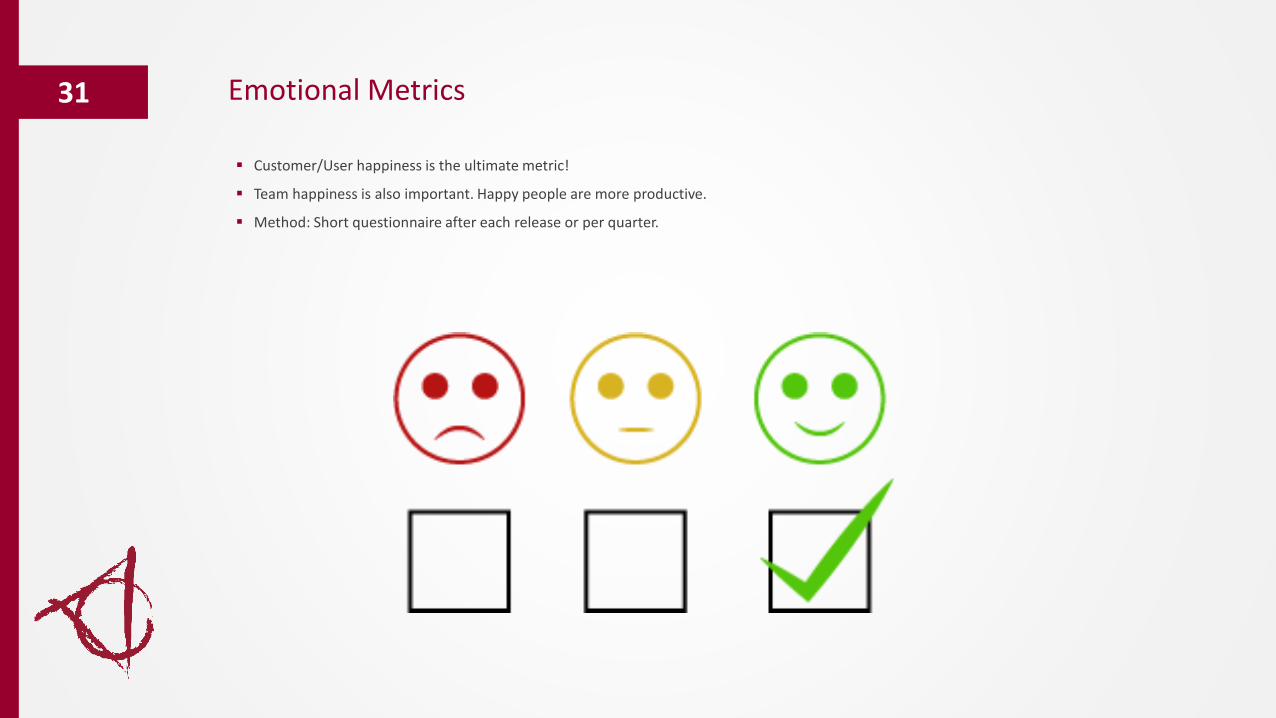
Emotional Metrics31
▪ Customer/User happiness is the ultimate metric!
▪ Team happiness is also important. Happy people are more productive.
▪ Method: Short questionnaire after each release or per quarter.
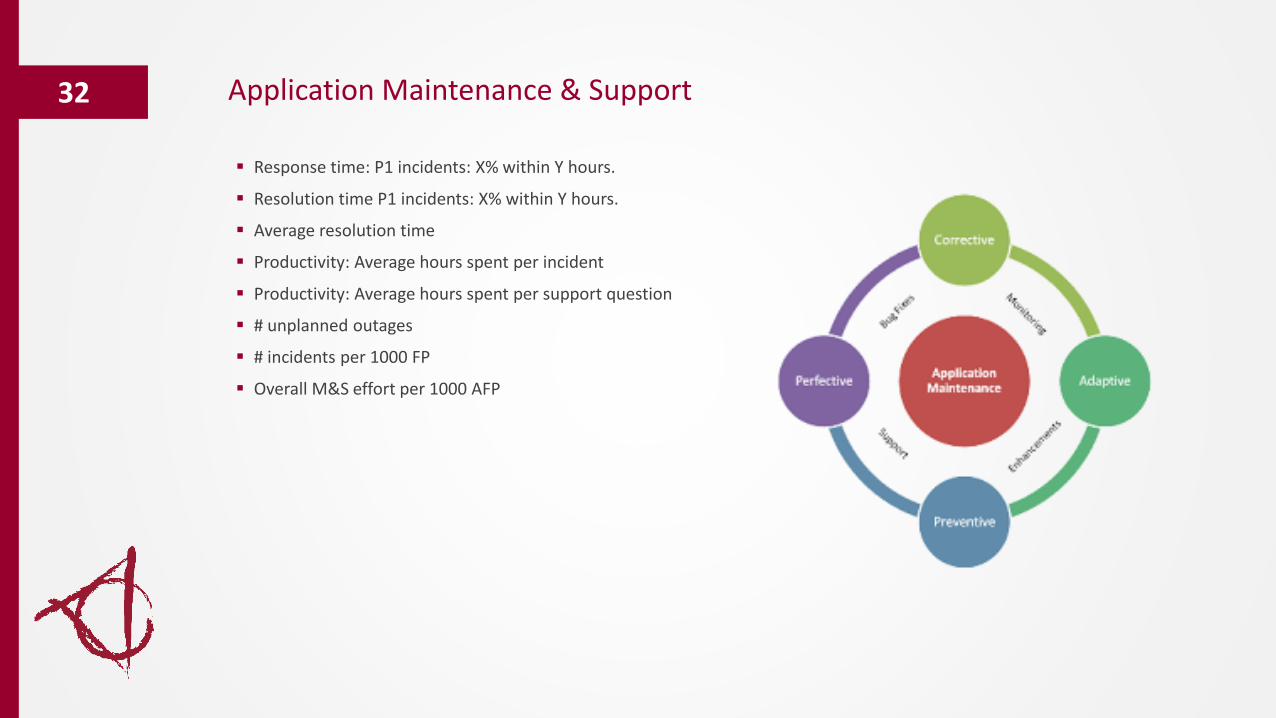
Application Maintenance & Support32
▪ Response time: P1 incidents: X% within Y hours.
▪ Resolution time P1 incidents: X% within Y hours.
▪ Average resolution time
▪ Productivity: Average hours spent per incident
▪ Productivity: Average hours spent per support question
▪ # unplanned outages
▪ # incidents per 1000 FP
▪ Overall M&S effort per 1000 AFP
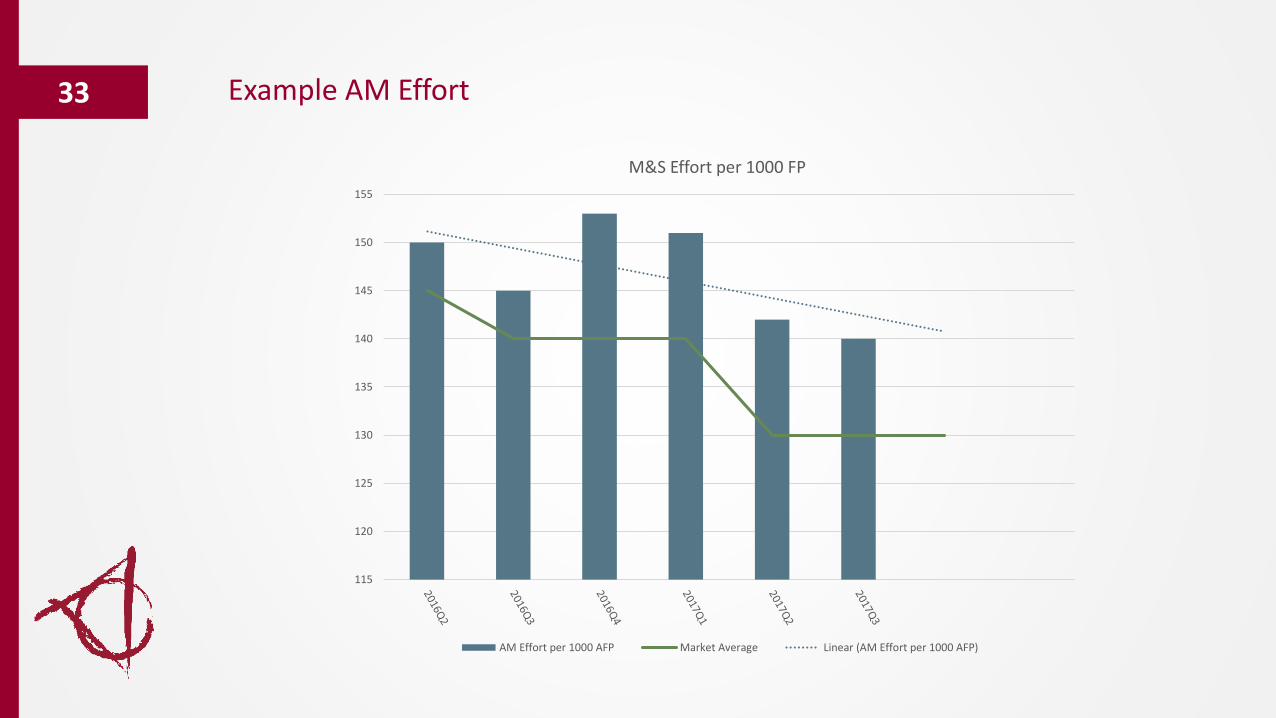
Example AM Effort33
115
120
125
130
135
140
145
150
155
M&S Effort per 1000 FP
AM Effort per 1000 AFP Market Average Linear (AM Effort per 1000 AFP)
DevOps Metrics34
DevOps teams have partly different goals from pure agile teams.
▪ Continuous integration and delivery.
▪ Increase deployment frequency.
▪ Reduce ‘Time to resolve’.
Metrics to measure performance:
▪ %Effort Dev/Ops.
▪ # bottlenecks removed.
▪ % Test automation.
▪ Deployment frequency.
▪ % Failed deployments.
▪ Mean Time to Recover (MTTR).
▪ Change Lead time.
© 2017 METRI. All rights reserved.
No part of this publication may be reproduced, stored in a retrieval system, transmitted or made public, in any form or by any means, electronic, mechanical, photocopying, recording or otherwise, without the prior written consent of METRI. www.metrigroup.com
Disclaimer
36


