
Statistical release P9115
Non-financial census of municipalities for the year ended
30 June 2007
Embargoed until:26 August 2008
14:30 Enquiries: Forthcoming issue: Expected release date
Jacob Shai P9115 June 2008 August 2009 +27 12 310 8306

Statistics South Africa P9115
Non-financial census of municipalities for the financial year ended 30 June 2007
i
PREFACE
Statistics South Africa (Stats SA) has undertaken an annual non-financial census of municipalities from 2002. The purpose of this census is to measure the level of service delivery performance of selected aspects of the functions of municipalities. The census provides information that can serve as a framework to stakeholders and policy-makers for analysis, planning and monitoring in terms of service delivery of water, electricity, solid waste management, sewerage and sanitation. This statistical release contains the preliminary results of the 2007 non-financial census of municipalities and the revised figures for 2006. In the event of revised figures being obtained for 2007, they will be incorporated into the 2008 non-financial census of municipalities (if applicable). For the purposes of this printed version, all results are presented at provincial level. Detailed information of each respondent (for 2006 and 2007) can be obtained from the Stats SA website (or can be made available upon request). PJ Lehohla Statistician-General PRETORIA 2008

Statistics South Africa P9115
Non-financial census of municipalities for the financial year ended 30 June 2007
ii
CONTENTS
NON-FINANCIAL CENSUS OF MUNICIPALITIES FOR THE YEAR ENDED 30 JUNE 2007
Introduction ............................................................................................................................................................................................................................ iv Methodology ........................................................................................................................................................................................................................... iv List of municipalities (2007) ................................................................................................................................................................................................... v Key findings ........................................................................................................................................................................................................................... viii
Tables
Table 1.1 Summary of managerial positions by province: South Africa ................................................................................................................................... 1
Table 1.2 Summary of managerial positions by province according to organogram: South Africa........................................................................................... 2
Table 1.3 Summary of councillors by province: South Africa ................................................................................................................................................... 3 Table 2.1 Summary of employment including managerial positions by province: South Africa ............................................................................................. 4 Table 2.2 Summary of employment excluding managerial positions by department: South Africa........................................................................................... 5
Table 3.1 Mechanism used to provide free basic services to indigent households .................................................................................................................. 6
Table 3.2 Mechanism used to provide free basic services to indigent households .................................................................................................................. 7 Table 4 Number of municipalities in each province with infrastructure to provide services: South Africa.............................................................................. 8
Table 5 Number of municipalities in each province responsible under the powers and functions allocated to it to provide services: South Africa ............... 9 Table 6 Number of municipalities in each province that provide services: South Africa ........................................................................................................ 10
Table 7 Number of consumer units in each province receiving selected basic services from municipalities and other service providers: South Africa ........ 11 Table 8 Number of municipalities in each province with a policy in place relating to free basic services: South Africa ......................................................... 12
Table 9 Number of municipalities in each province which have implemented a policy relating to free basic services: South Africa....................................... 13
Statistics South Africa P9115
Non-financial census of municipalities for the financial year ended 30 June 2007
iii
Table 10 Number of consumer units in each province receiving free basic services from municipalities: South Africa ........................................................... 14 Table 11 Number of municipalities in each province with an indigent support policy in place: South Africa............................................................................ 15
Table 12 Number of municipalities in each province which have implemented an indigent support policy: South Africa ........................................................ 16
Table 13.1Number of municipalities in each province that provide free alternative energy: South Africa 2006*....................................................................... 17 Table 13.2 Number of municipalities in each province that provide free alternative energy: South Africa 2007 ....................................................................... 18 Table 14.1 Number of indigent households in each province provided with free basic alternative energy: South Africa 2006*................................................ 19 Table 14.2 Number of indigent households in each province provided with free basic alternative energy: South Africa 2007 ................................................. 20 Table 15.1 Number of municipalities in each province that have submitted an Integrated Development Plan and Water Services Development Plan, have
a monitoring system in place for drinking water quality, effluent discharges and an HIV/AIDS policy, signed a funding agreement with Eskom, and acquired DWAF-run water schemes and have acquired the personnel: South Africa 2006* ............................................................................. 21
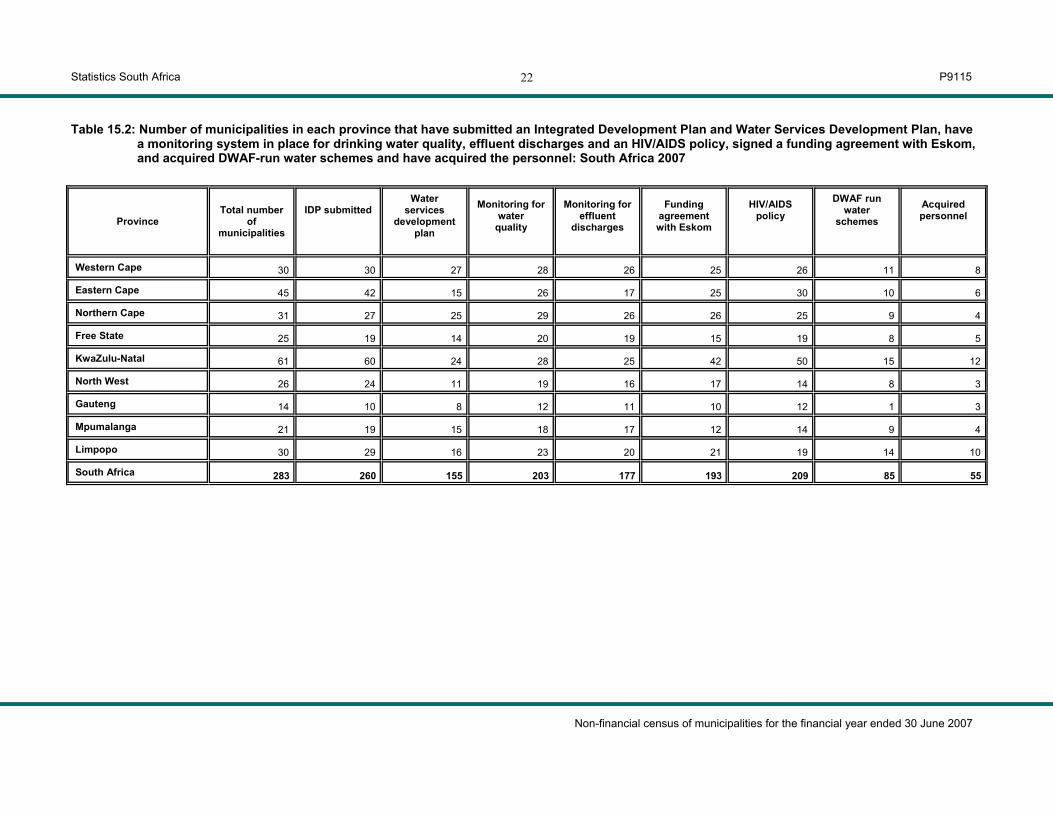
Table 15.2 Number of municipalities in each province that have submitted an Integrated Development Plan and Water Services Development Plan, have
a monitoring system in place for drinking water quality, effluent discharges and an HIV/AIDS policy, signed a funding agreement with Eskom, and acquired DWAF-run water schemes and have acquired the personnel: South Africa 2007............................................................................... 22
Table 16 Number of municipalities in each province that have commercialised or outsourced services: South Africa.......................................................... 23 Table 17.1 Number of consumer units connected to different types of toilet facilities in each province: South Africa 2006* .................................................... 24 Table 17.2 Number of consumer units connected to different types of toilet facilities in each province: South Africa 2007...................................................... 25 Explanatory notes................................................................................................................................................................................................................... 26
Glossary ................................................................................................................................................................................................................................ 27
General information................................................................................................................................................................................................................ 29 *Revised figures

Statistics South Africa P9115
Non-financial census of municipalities for the financial year ended 30 June 2007
iv
Introduction Background The census provides information that can serve as a framework to stakeholders and policy-makers for analysis, planning and monitoring in terms of service delivery of water, electricity, solid waste management, sewerage and sanitation. Purpose of the survey This publication serves the following major purposes:
• Assist in monitoring the progress made with regard to the implementation of service provision, free basic services and poverty alleviation as national priorities.
• Provide baseline non-financial information from those institutions classified as municipalities in terms of the Local Government Municipal Structures Act, 1998 (Act No. 117 of 1998).
• Provide information that can serve as a framework to stakeholders and policy-makers for planning, as well as monitoring and evaluating the performance of municipalities.
• Allow national and provincial governments and other stakeholders to analyse the actual services provided by municipalities.
• Make data available for use by researchers, organisations and individuals for research.
Questionnaire and data collection
• The methods used for collection included personal visits, telephone calls, facsimiles, e-mails and post. Data are generally comparable for both the 2006 and 2007 publications.
Methodology Scope of the survey All 283 municipalities were covered in this census for 2006 and 2007. For both years there were 100% response rates. Limitations of the survey • This publication is not necessarily comparable with the Stats SA
population census of 2001 and/or household survey data, due mainly to: i. The data source is municipalities as opposed to households. ii. The different definitions of 'household'. Most municipalities do not
have a system for identifying multiple households served by one billing unit or delivery point.
• ‘Household’ refers to a billing unit and is therefore not comparable with
other Stats SA surveys on households.

Statistics South Africa P9115
Non-financial census of municipalities for the financial year ended 30 June 2007
v
List of municipalities (2007)
Western Cape City of Cape Town Metro West Coast District Municipality Matzikama Cederberg Bergrivier Saldanha Bay Swartland Cape Winelands Municipality Witzenberg Drakenstein Stellenbosch Breede Valley Breede River Overberg District Municipality Theewaterskloof Overstrand Cape Agulhas Swellendam Eden District Municipality Kannaland Hassequa Mossel Bay George Oudtshoorn Bitou Knysna Central Karoo District Municipality Laingsburg Prince Albert Beaufort West
Eastern Cape Nelson Mandela Metro Cacadu District Municipality Camdeboo Blue Crane Route Ikwezi Makana Ndlambe Sunday’s River Valley Baviaans Kouga Kou-Kamma Amatole District Municipality Mbhashe Mnquma Great Kei Amahlathi Buffalo City Ngqushwa Nkonkobe Nxuba Chris Hani District Municipality Inxuba Yethemba Tsolwana Inkwanca Lukanji Intsika Yethu Emalahleni Engcobo Sakhisizwe Alfred Nzo District Municipality Matatiele Umzimvubu
Eastern Cape (concluded) O.R. Tambo District Municipality Mbizana Ntabankulu Qaukeni Port St Johns Nyandeni Mhlontlo King Sabata Dalindyebo Ukhahlamba District Municipality Elundini Gariep Maletswai Senqu
Northern Cape Namakwa District Municipality Richtersveld Nama Khoi Kamiesberg Hantam Karoo Hoogland Khai-Ma Pixley kaSeme District Municipality Ubuntu Umsobomvu Emthanjeni Kareeberg Renosterberg Thembelihle Siyathemba Siyancuma Siyanda District Municipality Mier Kai !Garib Khara Hais !Kheis Tsantsabane Kgatelopele Kalahari-Kgalagadi District Municipality Ga-Segonyana Gamagara Francis Baard District Municipality Dikgatlong Magareng Phokwane Sol Plaatje

Statistics South Africa P9115
Non-financial census of municipalities for the financial year ended 30 June 2007
vi
Free State Xhariep District Municipality Letsemeng Kopanong Mohokare Motheo District Municipality Naledi Mangaung Mantsopa Lejweleputswa District Municipality Masilonyana Tokologo Tswelopele Matjhabeng Nala Thabo Mofutsanyane District Municipality Setsoto Dihlabeng Nketoana Maluti a Phofung Phumelela Fezile Dabi District Municipality Moqhaka Ngwathe Metsimaholo Mafube
KwaZulu-Natal eThekwini Metro Ugu District Municipality Vulamehlo Umdoni Umzumbe UMuziwabantu Ezinqolweni Hibiscus Coast uMgungundlovu District Municipality uMshwathi uMngeni Mooi Mpofana Impendle Msunduzi Mkhambathini Richmond uThukela District Municipality Emnambithi-Ladysmith Indaka Umtshezi Okhahlamba Imbabazane Umzinyathi District Municipality Endumeni Nqutu Msinga Umvoti Amajuba District Municipality Newcastle Utrecht Dannhauser
KwaZulu-Natal (concluded) Zululand District Municipality eDumbe uPhongolo Abaqulusi Nongoma Ulundi uMkhanyakude District Municipality uMhlabuyalingana Jozini The Big 5 False Bay Hlabisa Mtubatuba uThungulu District Municipality Mbonambi uMhlathuze Ntambanana uMlalazi Mthonjaneni Nkandla ILembe District Municipality Mandeni KwaDukuza Ndwedwe Maphumulo Sisonke District Municipality Ingwe Kwa Sani Greater Kokstad Ubuhlebezwe Umzimkhulu
North West Bojanala District Municipality Moretele Madibeng Rustenburg Kgetlengrivier Moses Kotane Ngaka Modiri Molema District Municipality Ratlou Tswaing Mafikeng Ditsobotla Ramotshere Moila Bophirima District Municipality Kagisano Naledi Mamusa Greater Taung Molopo Lekwa-Teemane Southern District Municipality Ventersdorp Potchefstroom City of Matlosana Maquassi Hills Moshaweng Merafong City

Statistics South Africa P9115
Non-financial census of municipalities for the financial year ended 30 June 2007
vii
Gauteng City of Johannesburg Metro City of Tshwane Metro Ekurhuleni Metro Sedibeng District Municipality Emfuleni Midvaal Lesedi Metsweding District Municipality Nokeng tsa Taemane Kungwini West Rand District Municipality Mogale City Randfontein Westonaria
Mpumalanga Gert Sibande District Municipality Albert Luthuli Msukaligwa Mkhondo Pixley ka Seme Lekwa Dipaleseng Govan Mbeki Nkangala District Municipality Delmas Emalahleni Steve Tshwete Emakhazeni Thembisile Dr J.S. Moroka Ehlanzeni District Municipality Bushbuckridge Thaba Chweu Mbombela Umjindi Nkomazi
Limpopo Mopani District Municipality Ba-Phalaborwa Greater Giyani Greater Letaba Greater Tzaneen Maruleng Vhembe District Municipality Musina Mutale Thulamela Makhado Capricorn District Municipality Blouberg Aganang Molemole Polokwane Lepele-Nkumpi Waterberg District Municipality Thabazimbi Lephalale Mookgopong Modimolle Bela-Bela Mogalakwena Sekhukhune District Municipality Makhudutamaga Fetakgomo Greater Marble Hall Greater Groblersdal Greater Tubatse

Statistics South Africa P9115
Non-financial census of municipalities for the financial year ended 30 June 2007
viii
Key findings Figure A: Number of consumer units receiving basic services from municipalities in South Africa over the period 2006* and 2007
0
2 000 000
4 000 000
6 000 000
8 000 000
10 000 000
12 000 000
Num
ber o
f con
sum
er u
nits
2006 9 141 481 7 089 666 7 474 446 7 380 4052007 10 345 797 7 809 580 8 635 341 8 062 866
Water Electricity and gas Sewerage and sanitation Solid waste management
* Revised figures
The number of consumer units receiving basic services from municipality and service providers increased between 30 June 2006* and 2007. The largest increase from 2006* to 2007 in the provision of services was in
sewerage and sanitation (15,5%), followed by water (13,2%), electricity and gas (10,2%) and solid waste management (9,2%).

Statistics South Africa P9115
Non-financial census of municipalities for the financial year ended 30 June 2007
ix
Figure B: Number of consumer units receiving basic services and free basic services from municipalities and service providers in South
Africa for the year ended 2007
0
2 000 000
4 000 000
6 000 000
8 000 000
10 000 000
12 000 000
Num
ber o
f con
sum
er u
nits
Basic services 10 345 797 7 809 580 8 635 341 8 062 866Free basic services 7 281 862 2 969 306 4 214 367 3 220 782
Water Electricity and gas Sewerage and sanitation Solid waste management
Figure B shows the proportion of consumer units that benefited from the free basic services policy. Of the 10,3 million consumer units receiving basic water from municipalities and service providers in South Africa, 7,3 million consumer units had access to free basic water. Of the 7,8 million consumer units receiving basic electricity and gas, 3,0 million consumer units were receiving free basic electricity. About 8,6 million consumer units received
basic sewerage and sanitation services from municipalities and service providers, while 4,2 million consumer units received sewerage and sanitation as free basic services from municipalities and service providers. There were 8,1 million consumer units receiving basic solid waste management services, while 3,2 million consumer units received free basic solid waste management services from municipalities and service providers.
Statistics South Africa P9115
Non-financial census of municipalities for the financial year ended 30 June 2007
x
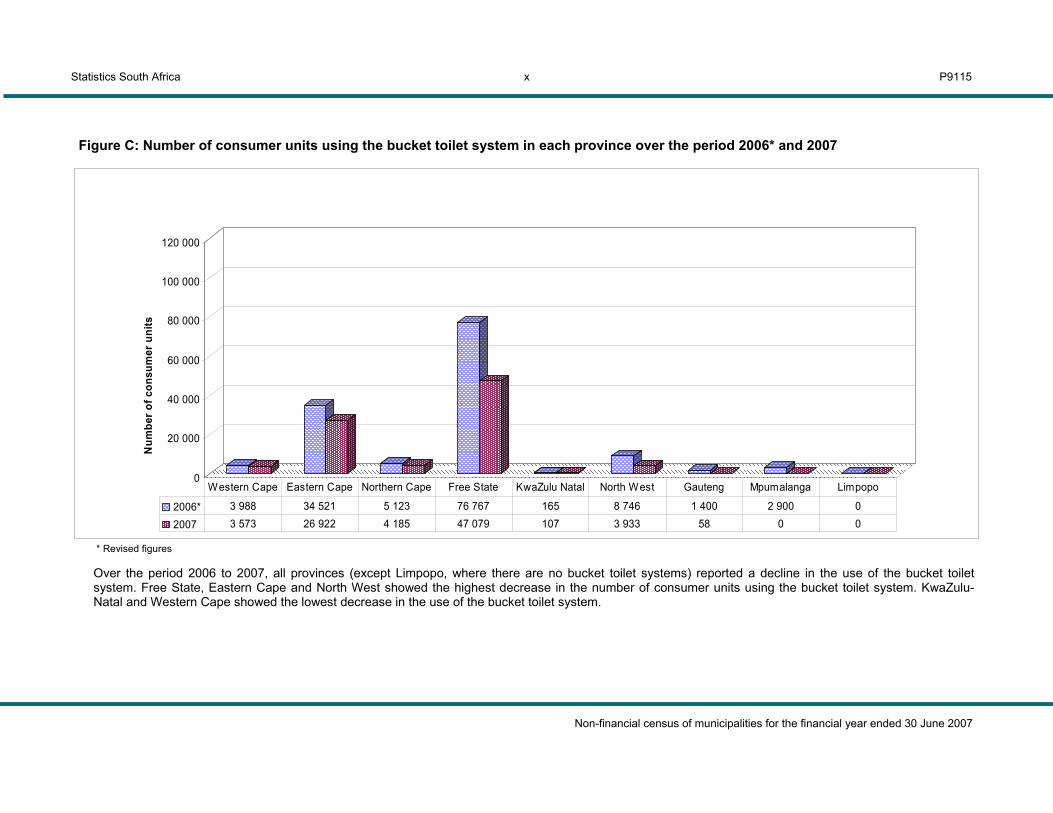
Figure C: Number of consumer units using the bucket toilet system in each province over the period 2006* and 2007
0
20 000
40 000
60 000
80 000
100 000
120 000
Num
ber o
f con
sum
er u
nits
2006* 3 988 34 521 5 123 76 767 165 8 746 1 400 2 900 0
2007 3 573 26 922 4 185 47 079 107 3 933 58 0 0
Western Cape Eastern Cape Northern Cape Free State KwaZulu Natal North West Gauteng Mpumalanga Limpopo
* Revised figures
Over the period 2006 to 2007, all provinces (except Limpopo, where there are no bucket toilet systems) reported a decline in the use of the bucket toilet system. Free State, Eastern Cape and North West showed the highest decrease in the number of consumer units using the bucket toilet system. KwaZulu-Natal and Western Cape showed the lowest decrease in the use of the bucket toilet system.

Statistics South Africa P9115
Non-financial census of municipalities for the financial year ended 30 June 2007
xi
Table A: Consumer units receiving basic and free basic water services from municipalities and service providers
Free basic water services Free basic water services
Province
Number of consumer units receiving
basic water services (2006)*
Number of consumer
units (2006)*
%
Number of consumer units receiving
basic water services (2007)
Number of consumer units (2007)
%
Western Cape 866 554 788 336 91,0 941 516 857 008 91,0
Eastern Cape 1 183 307 620 664 52,5 1 220 607 574 165 47,0
Northern Cape 187 163 87 341 46,7 198 350 87 489 44,1
Free State 603 828 494 760 81,9 692 003 572 762 82,8
KwaZulu-Natal 1 577 319 1 247 186 79,1 1 995 424 1 559 022 78,1
North West 733 557 459 583 62,7 795 856 502 345 63,1
Gauteng 2 240 571 2 240 085 100,0 2 571 131 2 060 021 80,1
Mpumalanga 679 817 507 365 74,6 805 999 554 045 68,7
Limpopo 1 069 365 504 916 47,2 1 124 911 515 005 45,8
South Africa 9 141 481 6 950 236 76,0 10 345 797 7 281 862 70,4 * Revised figures
Table A shows the proportion of consumer units receiving basic and free basic water services from municipalities and service providers. In 2007, there were 10,3 million consumer units receiving water from municipalities and service providers while 7,3 million consumer units had access to free basic water. Western Cape showed the highest proportion (91,0%), followed by Free State (82,8%) and Gauteng (80,1%).
The province with the lowest proportion was Northern Cape (44,1%). There were 7,3 million consumer units receiving free basic water from municipalities and service providers in 2007, compared with 7,0 million consumer units in 2006. Fluctuations between 2006 and 2007 are due to the change in the mechanisms used by municipalities to roll out such services, from broad-based to either self-targeting, technical or geographical mechanisms.
Statistics South Africa P9115
Non-financial census of municipalities for the financial year ended 30 June 2007
xii
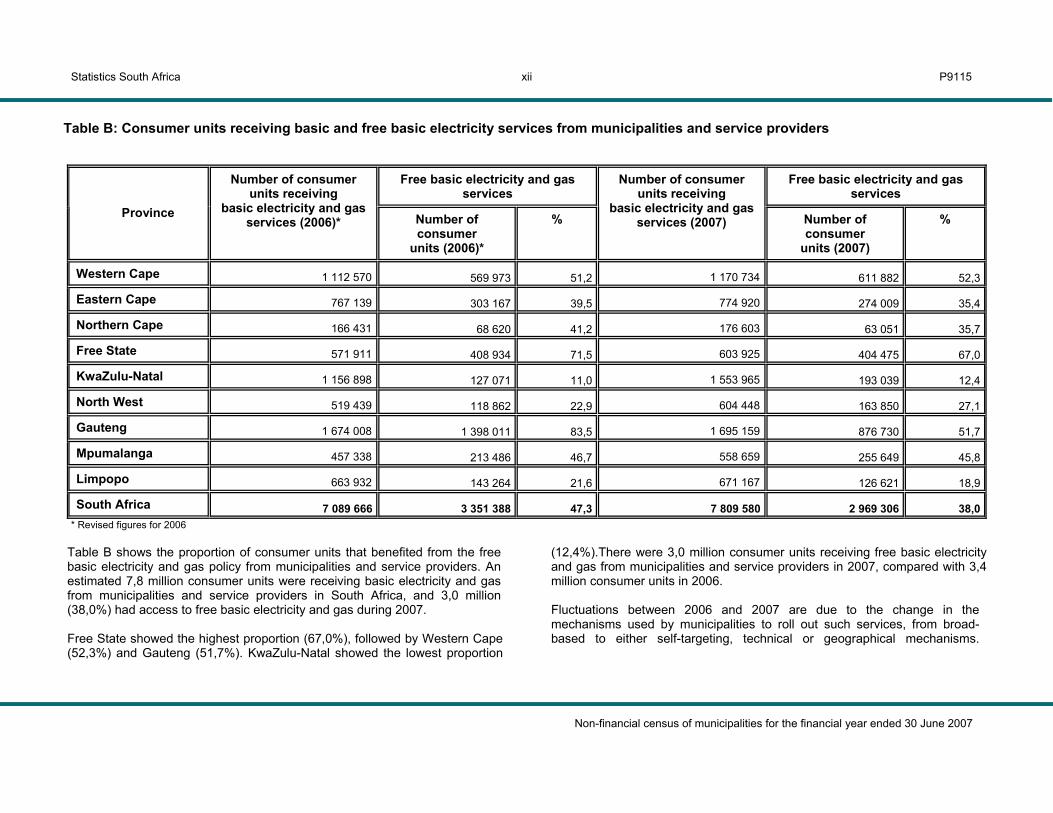
Table B: Consumer units receiving basic and free basic electricity services from municipalities and service providers
Free basic electricity and gas services
Free basic electricity and gas services
Province
Number of consumer units receiving
basic electricity and gas services (2006)* Number of
consumer units (2006)*
%
Number of consumer units receiving
basic electricity and gas services (2007) Number of
consumer units (2007)
%
Western Cape 1 112 570 569 973 51,2 1 170 734 611 882 52,3
Eastern Cape 767 139 303 167 39,5 774 920 274 009 35,4
Northern Cape 166 431 68 620 41,2 176 603 63 051 35,7
Free State 571 911 408 934 71,5 603 925 404 475 67,0
KwaZulu-Natal 1 156 898 127 071 11,0 1 553 965 193 039 12,4
North West 519 439 118 862 22,9 604 448 163 850 27,1
Gauteng 1 674 008 1 398 011 83,5 1 695 159 876 730 51,7
Mpumalanga 457 338 213 486 46,7 558 659 255 649 45,8
Limpopo 663 932 143 264 21,6 671 167 126 621 18,9
South Africa 7 089 666 3 351 388 47,3 7 809 580 2 969 306 38,0* Revised figures for 2006
Table B shows the proportion of consumer units that benefited from the free basic electricity and gas policy from municipalities and service providers. An estimated 7,8 million consumer units were receiving basic electricity and gas from municipalities and service providers in South Africa, and 3,0 million (38,0%) had access to free basic electricity and gas during 2007. Free State showed the highest proportion (67,0%), followed by Western Cape (52,3%) and Gauteng (51,7%). KwaZulu-Natal showed the lowest proportion
(12,4%).There were 3,0 million consumer units receiving free basic electricity and gas from municipalities and service providers in 2007, compared with 3,4 million consumer units in 2006. Fluctuations between 2006 and 2007 are due to the change in the mechanisms used by municipalities to roll out such services, from broad-based to either self-targeting, technical or geographical mechanisms.

Statistics South Africa P9115
Non-financial census of municipalities for the financial year ended 30 June 2007
xiii
Table C: Consumer units receiving basic and free basic sewerage and sanitation services from municipalities and service providers
Free basic sewerage and sanitation services
Free basic sewerage and sanitation services
Province
Number of consumer units receiving basic
sewerage and sanitation services (2006)*
Number of consumer
units (2006)*
%
Number of consumer units receiving
basic sewerage and sanitation services
(2007) Number of consumer
units (2007)
%
Western Cape 888 868 599 853 67,5 959 542 737 059 76,8
Eastern Cape 882 225 411 691 46,7 883 620 402 467 45,5
Northern Cape 181 919 73 335 40,3 188 579 66 153 35,1
Free State 574 651 299 616 52,1 688 416 400 409 58,2
KwaZulu-Natal 1 248 038 545 345 43,7 1 684 952 348 514 20,7
North West 546 728 111 082 20,3 905 075 128 548 14,2
Gauteng 2 174 231 1 427 019 65,6 2 369 879 1 783 998 75,3
Mpumalanga 368 066 161 561 43,9 473 662 143 446 30,3
Limpopo 609 720 112 207 18,4 481 616 203 773 42,3
South Africa 7 474 446 3 741 709 50,1 8 635 341 4 214 367 48,8* Revised figures for 2006 Table C shows the proportion of consumer units receiving free basic sewerage and sanitation services from municipalities and service providers. There were 8,6 million consumer units receiving basic sewerage and sanitation from municipalities and service providers in South Africa, and 48,8% had access to free basic sewerage and sanitation in 2007. Western Cape showed the highest proportion (76,8%), followed by Gauteng (75,3%) and Free State (58,2%). The province with the lowest proportion was North West (14,2%).
There were 4,2 million consumer units receiving free basic sewerage and sanitation services from municipalities and service providers in 2007, compared with 3,7 million consumer units in 2006. Fluctuations between 2006 and 2007 are due to the change in the mechanisms used by municipalities to roll out such services, from broad-based to either self-targeting, technical or geographical mechanisms.
Statistics South Africa P9115
Non-financial census of municipalities for the financial year ended 30 June 2007
xiv
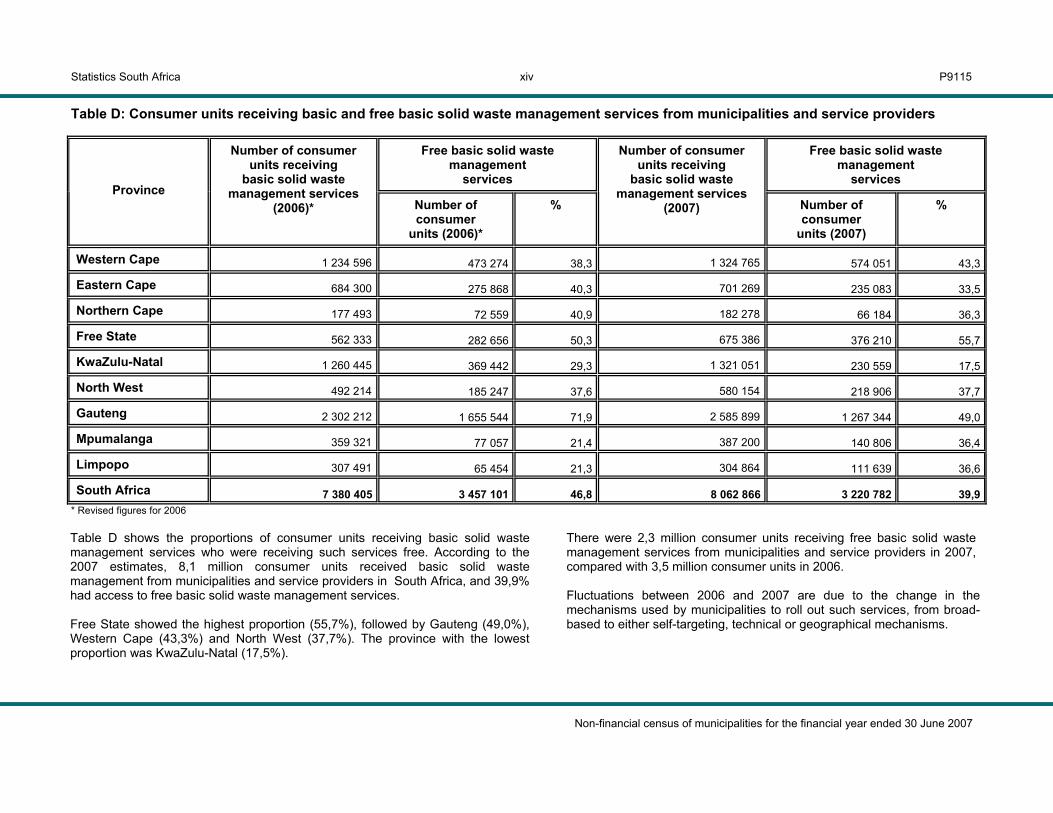
Table D: Consumer units receiving basic and free basic solid waste management services from municipalities and service providers
Free basic solid waste management
services
Free basic solid waste management
services Province
Number of consumer units receiving
basic solid waste management services
(2006)* Number of consumer
units (2006)*
%
Number of consumer units receiving
basic solid waste management services
(2007) Number of consumer
units (2007)
%
Western Cape 1 234 596 473 274 38,3 1 324 765 574 051 43,3
Eastern Cape 684 300 275 868 40,3 701 269 235 083 33,5
Northern Cape 177 493 72 559 40,9 182 278 66 184 36,3
Free State 562 333 282 656 50,3 675 386 376 210 55,7
KwaZulu-Natal 1 260 445 369 442 29,3 1 321 051 230 559 17,5
North West 492 214 185 247 37,6 580 154 218 906 37,7
Gauteng 2 302 212 1 655 544 71,9 2 585 899 1 267 344 49,0
Mpumalanga 359 321 77 057 21,4 387 200 140 806 36,4
Limpopo 307 491 65 454 21,3 304 864 111 639 36,6
South Africa 7 380 405 3 457 101 46,8 8 062 866 3 220 782 39,9* Revised figures for 2006 Table D shows the proportions of consumer units receiving basic solid waste management services who were receiving such services free. According to the 2007 estimates, 8,1 million consumer units received basic solid waste management from municipalities and service providers in South Africa, and 39,9% had access to free basic solid waste management services. Free State showed the highest proportion (55,7%), followed by Gauteng (49,0%), Western Cape (43,3%) and North West (37,7%). The province with the lowest proportion was KwaZulu-Natal (17,5%).
There were 2,3 million consumer units receiving free basic solid waste management services from municipalities and service providers in 2007, compared with 3,5 million consumer units in 2006.
Fluctuations between 2006 and 2007 are due to the change in the mechanisms used by municipalities to roll out such services, from broad-based to either self-targeting, technical or geographical mechanisms.
Statistics South Africa P9115
Non-financial census of municipalities for the financial year ended 30 June 2007
xv
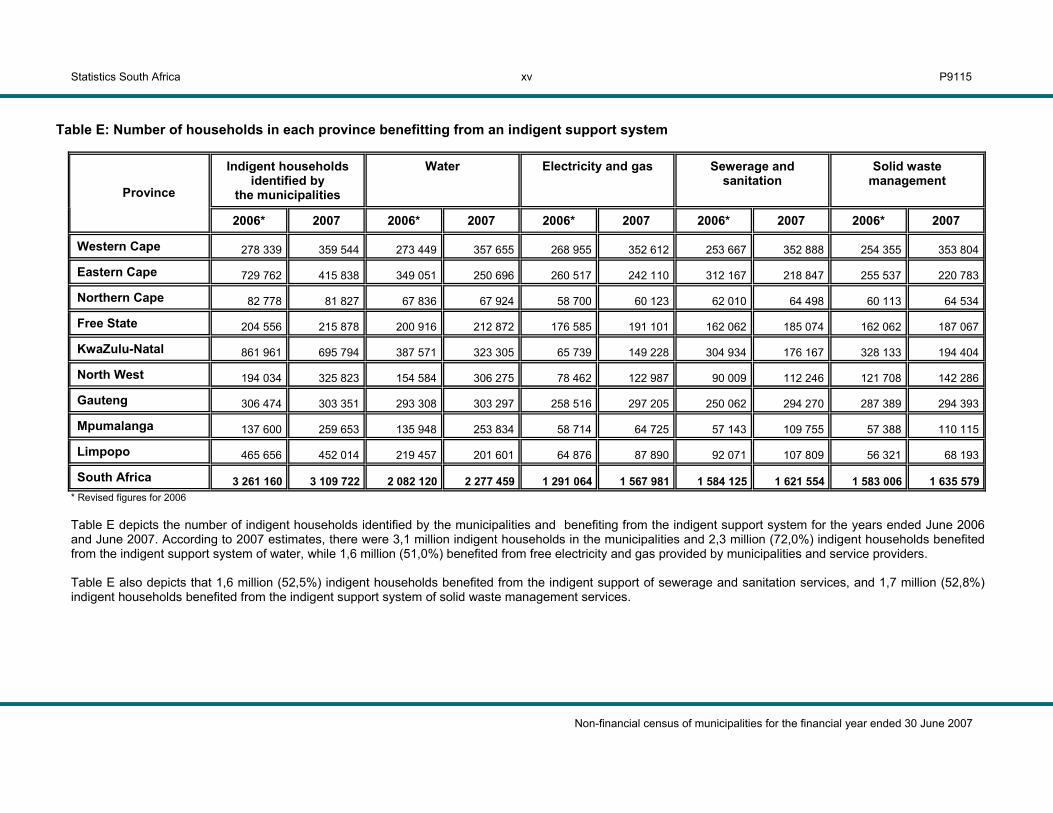
Table E: Number of households in each province benefitting from an indigent support system
Indigent households
identified by the municipalities
Water Electricity and gas Sewerage and sanitation
Solid waste management
Province
2006* 2007 2006* 2007 2006* 2007 2006* 2007 2006* 2007
Western Cape 278 339 359 544 273 449 357 655 268 955 352 612 253 667 352 888 254 355 353 804
Eastern Cape 729 762 415 838 349 051 250 696 260 517 242 110 312 167 218 847 255 537 220 783
Northern Cape 82 778 81 827 67 836 67 924 58 700 60 123 62 010 64 498 60 113 64 534
Free State 204 556 215 878 200 916 212 872 176 585 191 101 162 062 185 074 162 062 187 067
KwaZulu-Natal 861 961 695 794 387 571 323 305 65 739 149 228 304 934 176 167 328 133 194 404
North West 194 034 325 823 154 584 306 275 78 462 122 987 90 009 112 246 121 708 142 286
Gauteng 306 474 303 351 293 308 303 297 258 516 297 205 250 062 294 270 287 389 294 393
Mpumalanga 137 600 259 653 135 948 253 834 58 714 64 725 57 143 109 755 57 388 110 115
Limpopo 465 656 452 014 219 457 201 601 64 876 87 890 92 071 107 809 56 321 68 193
South Africa 3 261 160 3 109 722 2 082 120 2 277 459 1 291 064 1 567 981 1 584 125 1 621 554 1 583 006 1 635 579* Revised figures for 2006
Table E depicts the number of indigent households identified by the municipalities and benefiting from the indigent support system for the years ended June 2006 and June 2007. According to 2007 estimates, there were 3,1 million indigent households in the municipalities and 2,3 million (72,0%) indigent households benefited from the indigent support system of water, while 1,6 million (51,0%) benefited from free electricity and gas provided by municipalities and service providers. Table E also depicts that 1,6 million (52,5%) indigent households benefited from the indigent support of sewerage and sanitation services, and 1,7 million (52,8%) indigent households benefited from the indigent support system of solid waste management services.
Statistics South Africa P9115
Non-financial census of municipalities for the financial year ended 30 June 2007
1
TABLES
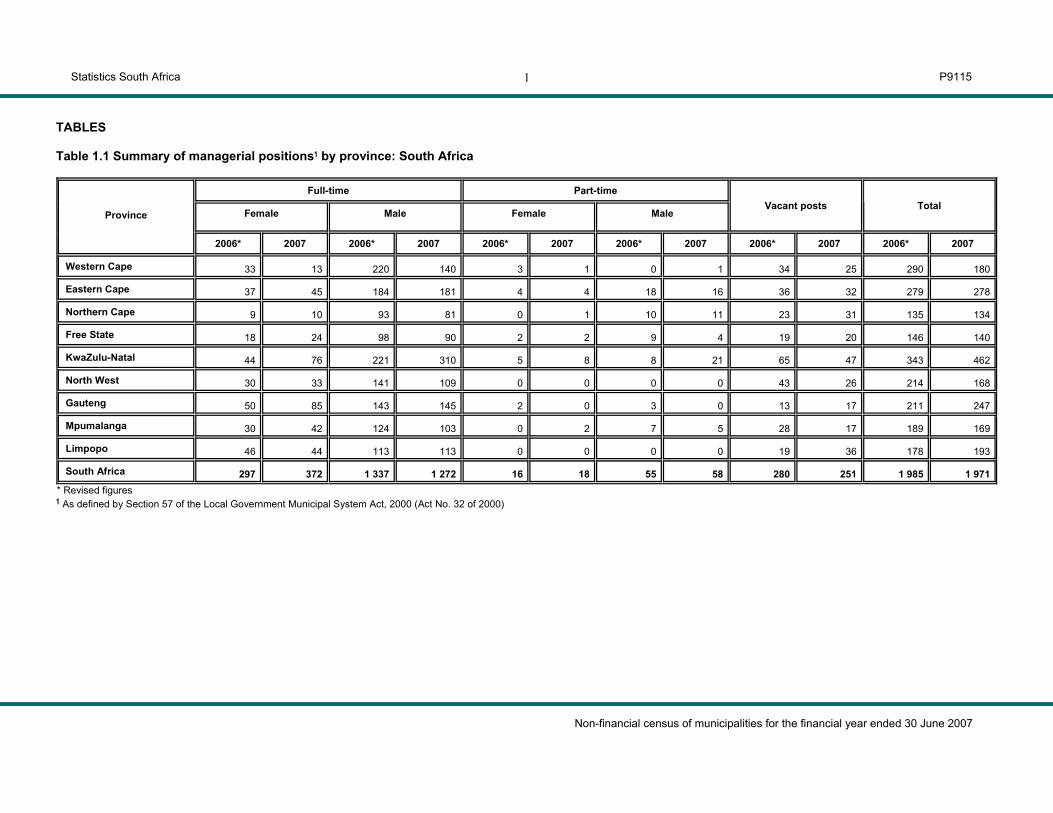
Table 1.1 Summary of managerial positions1 by province: South Africa
Full-time Part-time
Female Male Female Male
Vacant posts
Total
Province
2006* 2007 2006* 2007 2006* 2007 2006* 2007 2006* 2007 2006* 2007
Western Cape 33 13 220 140 3 1 0 1 34 25 290 180
Eastern Cape 37 45 184 181 4 4 18 16 36 32 279 278
Northern Cape 9 10 93 81 0 1 10 11 23 31 135 134
Free State 18 24 98 90 2 2 9 4 19 20 146 140
KwaZulu-Natal 44 76 221 310 5 8 8 21 65 47 343 462
North West 30 33 141 109 0 0 0 0 43 26 214 168
Gauteng 50 85 143 145 2 0 3 0 13 17 211 247
Mpumalanga 30 42 124 103 0 2 7 5 28 17 189 169
Limpopo 46 44 113 113 0 0 0 0 19 36 178 193
South Africa 297 372 1 337 1 272 16 18 55 58 280 251 1 985 1 971 * Revised figures
1 As defined by Section 57 of the Local Government Municipal System Act, 2000 (Act No. 32 of 2000)

Statistics South Africa P9115
Non-financial census of municipalities for the financial year ended 30 June 2007
2
Table 1.2: Summary of managerial positions by province according to organogram: South Africa
Full-time Part-time
Female Male Female Male
Vacant posts
Total
Province
2006* 2007 2006* 2007 2006* 2007 2006* 2007 2006* 2007 2006* 2007
Western Cape 32 416 214 885 0 1 3 15 139 449 388 1 766
Eastern Cape 114 115 242 234 4 14 3 9 73 87 436 459
Northern Cape 42 20 231 104 7 0 4 5 90 43 374 172
Free State 39 59 381 253 0 1 5 15 26 119 451 447
KwaZulu-Natal 167 175 465 601 0 5 3 15 85 85 720 881
North West 39 75 149 232 10 0 13 0 59 64 270 371
Gauteng 325 404 986 963 0 0 0 1 80 128 1 391 1 496
Mpumalanga 43 29 79 103 0 0 0 0 26 30 148 162
Limpopo 69 130 783 307 6 7 4 4 75 155 937 603
South Africa 870 1 423 3 530 3 682 27 28 35 64 653 1 160 5 115 6 357 * Revised figures

Statistics South Africa P9115
Non-financial census of municipalities for the financial year ended 30 June 2007
3
Table 1.3: Summary of councillors by province: South Africa
Full-time Part-time
Female Male Female Male
Vacant posts
Total
Province
2006* 2007 2006* 2007 2006* 2007 2006* 2007 2006* 2007 2006* 2007
Western Cape 71 61 187 197 187 177 358 342 42 1 845 778
Eastern Cape 128 106 148 139 507 541 689 716 4 4 1 476 1 506
Northern Cape 73 37 74 36 112 215 135 178 19 2 413 468
Free State 124 94 171 130 165 184 240 288 3 0 703 696
KwaZulu-Natal 126 183 348 435 392 331 950 831 16 34 1 832 1 814
North West 115 126 166 178 274 238 329 308 1 6 885 856
Gauteng 185 193 231 220 225 217 264 296 22 0 927 926
Mpumalanga 83 118 89 148 242 248 384 343 3 4 801 861
Limpopo 54 51 72 67 483 460 588 607 0 1 1 197 1 186
South Africa 959 969 1 486 1 550 2 587 2 611 3 937 3 909 110 52 9 079 9091 * Revised figures

Statistics South Africa P9115
Non-financial census of municipalities for the financial year ended 30 June 2007
4
Table 2.1: Summary of employment including managerial positions by province: South Africa
Employment type
Full-time Part-time Vacant posts Total Province
2006* 2007 2006* 2007 2006* 2007 2006* 2007
Western Cape 34 481 35 817 2 865 1 514 4 622 3 888 41 968 41 219
Eastern Cape 22 943 21 436 1 004 1 413 4 612 4 195 28 559 27 044
Northern Cape 6 491 5 898 520 494 1 166 1 184 8 177 7 576
Free State 13 089 13 578 429 290 860 3 286 14 378 17 154
KwaZulu-Natal 33 406 38 862 990 1 550 21 902 23 362 56 298 63 774
North West 9 865 10 582 973 763 2 989 2 925 13 827 14 270
Gauteng 61 136 63 957 2 098 2 131 18 091 15 966 81 325 82 054
Mpumalanga 10 450 10 564 511 870 948 1 972 11 909 13 406
Limpopo 9 013 9 342 371 386 2 033 2 037 11 417 11 765
South Africa 200 874 210 036 9 761 9 411 57 223 58 815 267 858 278 262* Revised figures

Statistics South Africa P9115
Non-financial census of municipalities for the financial year ended 30 June 2007
5
Table 2.2: Summary of employment excluding managerial positions by department: South Africa
Employment type
Full-time Part-time Vacant posts Total Employment section
2006* 2007 2006* 2007 2006* 2007 2006* 2007
Community and Social Services 21 225 23 332 1 285 1 272 8 364 9 319 30 874 33 923
Finance and Administration 27 284 29 616 1 696 1 511 4 972 6 110 33 952 37 237
Electricity and Gas 14 669 15 323 437 195 4 985 5 998 20 091 21 516
Environmental Protection 6 762 5 810 315 340 940 1 656 8 017 7 806
Health 9 502 7 807 406 538 2 577 2 887 12 485 11 232
Public Safety 21 884 24 403 1 146 995 6 346 5 928 29 376 31 326
Road Transport 16 607 16 369 558 654 4 516 4 105 21 681 21 128
Sport and Recreation 11 018 9 459 372 495 2 440 1 867 13 830 11 821
Waste Management 19 029 21 288 1 616 841 3 427 5 338 24 072 27 467
Waste Water Management 6 642 6 530 371 447 1 502 1 550 8 515 8 527
Water 15 966 16 967 316 573 6 368 5 441 22 650 22 981
Other 24 252 26 330 1 110 1 382 9 853 7 258 35 215 34 970
Total employment 194 840 203 234 9 628 9 243 56 290 57 457 260 758 269 934 * Revised figures

Statistics South Africa P9115
Non-financial census of municipalities for the financial year ended 30 June 2007
6
Table 3.1 Mechanism used to provide free basic service to indigent households
Technical approach Geographical approach
Province Water Electricity and
gas Sewerage and
sanitation Solid waste
management Water Electricity and gas
Sewerage and sanitation
Solid waste management
Western Cape 2 2 2 2 2 2 3 2
Eastern Cape 4 6 1 3 1 1 1 1
Northern Cape 5 4 4 5 1 0 0 0
Free State 2 2 2 1 0 0 0 0
KwaZulu-Natal 5 6 5 9 1 4 1 4
North West 1 4 2 2 1 0 1 0
Gauteng 1 2 1 1 0 0 0 0
Mpumalanga 1 1 1 1 0 0 0 0
Limpopo 1 2 1 1 1 1 2 2
South Africa 22 29 19 25 7 8 8 9

Statistics South Africa P9115
Non-financial census of municipalities for the financial year ended 30 June 2007
7
Table 3.2 Mechanism used to provide free basic service to indigent households
Broad-based approach Self targeting approach
Province Water Electricity and
gas Sewerage and
sanitation Solid waste
management Water Electricity and gas
Sewerage and sanitation
Solid waste management
Western Cape 15 10 2 3 9 14 19 19
Eastern Cape 5 4 3 3 19 26 21 22
Northern Cape 3 2 2 2 20 22 21 21
Free State 13 7 6 5 4 10 11 12
KwaZulu-Natal 14 7 7 7 7 20 8 13
North West 10 1 1 1 10 15 14 14
Gauteng 8 5 3 2 2 4 7 8
Mpumalanga 8 5 1 1 8 11 13 13
Limpopo 8 2 3 2 13 19 15 16
South Africa 84 43 28 26 92 141 129 138

Statistics South Africa P9115
Non-financial census of municipalities for the financial year ended 30 June 2007
8
Table 4: Number of municipalities in each province with infrastructure to provide services: South Africa
Water Electricity and gas Sewerage and sanitation Solid waste management
Province Total number
of municipalities
2006* 2007 2006* 2007 2006* 2007 2006* 2007
Western Cape 30 28 28 27 28 28 28 28 28
Eastern Cape 45 33 33 28 30 33 33 40 41
Northern Cape 31 30 30 26 26 30 30 29 30
Free State 25 20 20 19 19 20 20 20 19
KwaZulu-Natal 61 27 26 30 34 25 23 40 42
North West 26 22 23 15 17 20 22 20 21
Gauteng 14 11 11 11 11 11 11 11 11
Mpumalanga 21 18 18 15 15 18 18 18 18
Limpopo 30 24 24 18 19 25 26 24 24
South Africa 283 213 213 189 199 210 211 230 234 * Revised figures

Statistics South Africa P9115
Non-financial census of municipalities for the financial year ended 30 June 2007
9
Table 5: Number of municipalities in each province responsible under powers and functions allocated to it to provide services: South Africa
Water Electricity and gas Sewerage and sanitation Solid waste management
Province Total number
of municipalities
2006* 2007 2006* 2007 2006* 2007 2006* 2007
Western Cape 30 28 28 27 28 28 28 28 28
Eastern Cape 45 31 28 29 27 31 28 41 39
Northern Cape 31 30 30 26 26 30 30 30 30
Free State 25 20 20 20 20 20 20 20 20
KwaZulu-Natal 61 19 18 31 46 19 17 39 47
North West 26 21 21 16 17 19 20 20 22
Gauteng 14 11 11 11 11 11 11 10 11
Mpumalanga 21 18 18 15 15 18 18 18 18
Limpopo 30 21 19 16 17 23 21 24 25
South Africa 283 199 193 191 207 199 193 230 240 * Revised figures

Statistics South Africa P9115
Non-financial census of municipalities for the financial year ended 30 June 2007
10
Table 6: Number of municipalities in each province that provide services: South Africa
Water Electricity and gas Sewerage and sanitation Solid waste management
Province Total number
of municipalities
2006* 2007 2006* 2007 2006* 2007 2006* 2007
Western Cape 30 28 28 26 27 28 28 28 28
Eastern Cape 45 29 26 24 26 29 26 40 37
Northern Cape 31 30 30 25 24 30 30 29 29
Free State 25 19 18 18 17 20 19 20 20
KwaZulu-Natal 61 20 18 29 31 20 19 36 44
North West 26 22 22 14 16 19 20 19 20
Gauteng 14 10 11 11 11 10 10 10 10
Mpumalanga 21 18 18 15 15 18 18 18 18
Limpopo 30 24 19 16 12 22 20 23 25
South Africa 283 200 190 178 179 196 190 223 231 * Revised figures

Statistics South Africa P9115
Non-financial census of municipalities for the financial year ended 30 June 2007
11
Table 7: Number of consumer units in each province receiving selected basic services from municipalities: South Africa
Water Electricity and gas Sewerage and sanitation Solid waste management
Province
2006* 2007 2006* 2007 2006* 2007 2006* 2007
Western Cape 866 554 941 516 1 112 570 1 170 734 888 868 959 542 1 234 596 1 324 765
Eastern Cape 1 183 307 1 220 607 767 139 774 920 882 225 883 620 684 300 701 269
Northern Cape 187 163 198 350 166 431 176 603 181 919 188 579 177 493 182 278
Free State 603 828 692 003 571 911 603 925 574 651 688 416 562 333 675 386
KwaZulu-Natal 1 577 319 1 995 424 1 156 898 1 553 965 1 248 038 1 684 952 1 260 445 1 321 051
North West 733 557 795 856 519 439 604 448 546 728 905 075 492 214 580 154
Gauteng 2 240 571 2 571 131 1 674 008 1 695 159 2 174 231 2 369 879 2 302 212 2 585 899
Mpumalanga 679 817 805 999 457 338 558 659 368 066 473 662 359 321 387 200
Limpopo 1 069 365 1 124 911 663 932 671 167 609 720 481 616 307 491 304 864
South Africa 9 141 481 10 345 797 7 089 666 7 809 580 7 474 446 8 635 341 7 380 405 8 062 866 *Revised figures
Statistics South Africa P9115
Non-financial census of municipalities for the financial year ended 30 June 2007
12
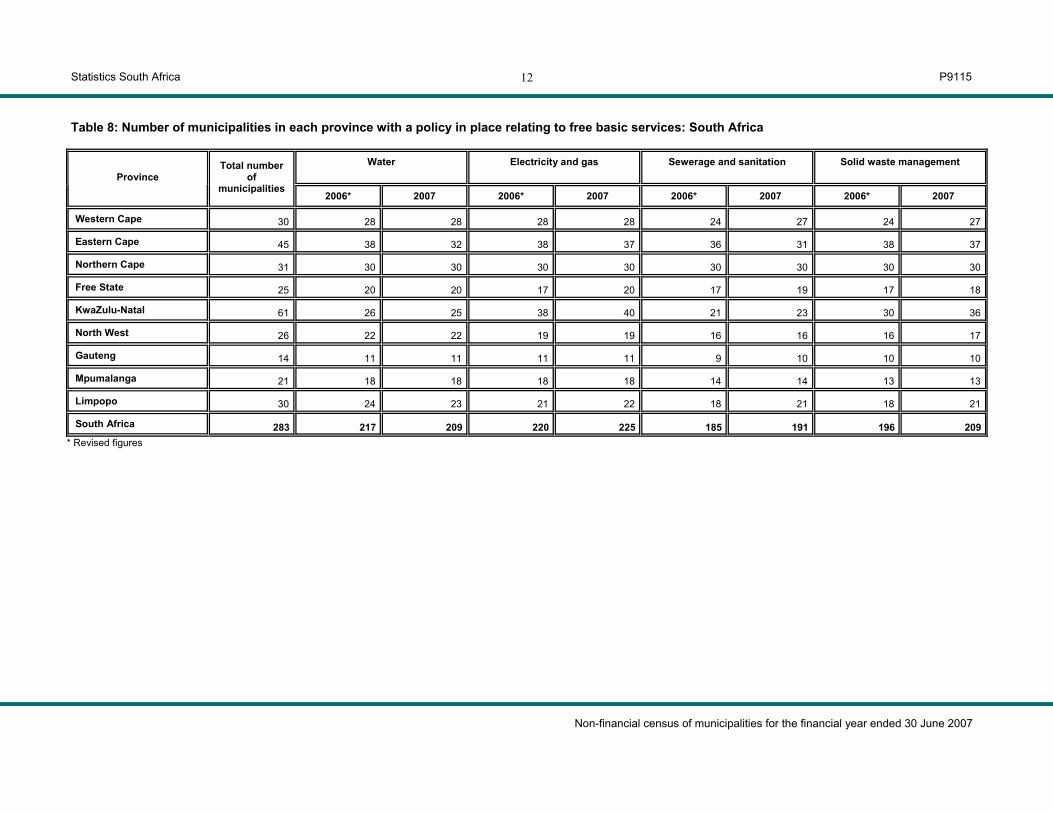
Table 8: Number of municipalities in each province with a policy in place relating to free basic services: South Africa
Water Electricity and gas Sewerage and sanitation Solid waste management Province
Total number of
municipalities 2006* 2007 2006* 2007 2006* 2007 2006* 2007
Western Cape 30 28 28 28 28 24 27 24 27
Eastern Cape 45 38 32 38 37 36 31 38 37
Northern Cape 31 30 30 30 30 30 30 30 30
Free State 25 20 20 17 20 17 19 17 18
KwaZulu-Natal 61 26 25 38 40 21 23 30 36
North West 26 22 22 19 19 16 16 16 17
Gauteng 14 11 11 11 11 9 10 10 10
Mpumalanga 21 18 18 18 18 14 14 13 13
Limpopo 30 24 23 21 22 18 21 18 21
South Africa 283 217 209 220 225 185 191 196 209 * Revised figures

Statistics South Africa P9115
Non-financial census of municipalities for the financial year ended 30 June 2007
13
Table 9: Number of municipalities in each province which have implemented a policy relating to free basic services: South Africa
Water Electricity and gas Sewerage and sanitation Solid waste management
Province Total number
of municipalities
2006* 2007 2006* 2007 2006* 2007 2006* 2007
Western Cape 30 28 28 28 28 24 27 24 27
Eastern Cape 45 33 27 36 37 29 25 33 31
Northern Cape 31 30 30 29 29 30 30 29 29
Free State 25 20 20 17 20 17 19 17 17
KwaZulu-Natal 61 20 18 35 35 14 14 28 33
North West 26 22 22 17 17 14 14 15 15
Gauteng 14 11 11 11 11 9 10 10 10
Mpumalanga 21 17 17 17 18 13 13 12 13
Limpopo 30 22 19 19 19 16 17 16 18
South Africa 283 203 192 209 214 166 169 184 193 * Revised figures

Statistics South Africa P9115
Non-financial census of municipalities for the financial year ended 30 June 2007
14
Table 10: Number of consumer units in each province receiving free basic services from municipalities: South Africa
Water Electricity and gas Sewerage and sanitation Solid waste management
Province
2006* 2007 2006* 2007 2006* 2007 2006* 2007
Western Cape 788 336 857 008 569 973 611 882 599 853 737 059 473 274 574 051
Eastern Cape 620 664 574 165 303 167 274 009 411 691 402 467 275 868 235 083
Northern Cape 87 341 87 489 68 620 63 051 73 335 66 153 72 559 66 184
Free State 494 760 572 762 408 934 404 475 299 616 400 409 282 656 376 210
KwaZulu-Natal 1 247 186 1 559 022 127 071 193 039 545 345 348 514 369 442 230 559
North West 459 583 502 345 118 862 163 850 111 082 128 548 185 247 218 906
Gauteng 2 240 085 2 060 021 1 398 011 876 730 1 427 019 1 783 998 1 655 544 1 267 344
Mpumalanga 507 365 554 045 213 486 255 649 161 561 143 446 77 057 140 806
Limpopo 504 916 515 005 143 264 126 621 112 207 203 773 65 454 111 639
South Africa 6 950 236 7 281 862 3 351 388 2 969 306 3 741 709 4 214 367 3 457 101 3 220 782 * Revised figures
Statistics South Africa P9115
Non-financial census of municipalities for the financial year ended 30 June 2007
15
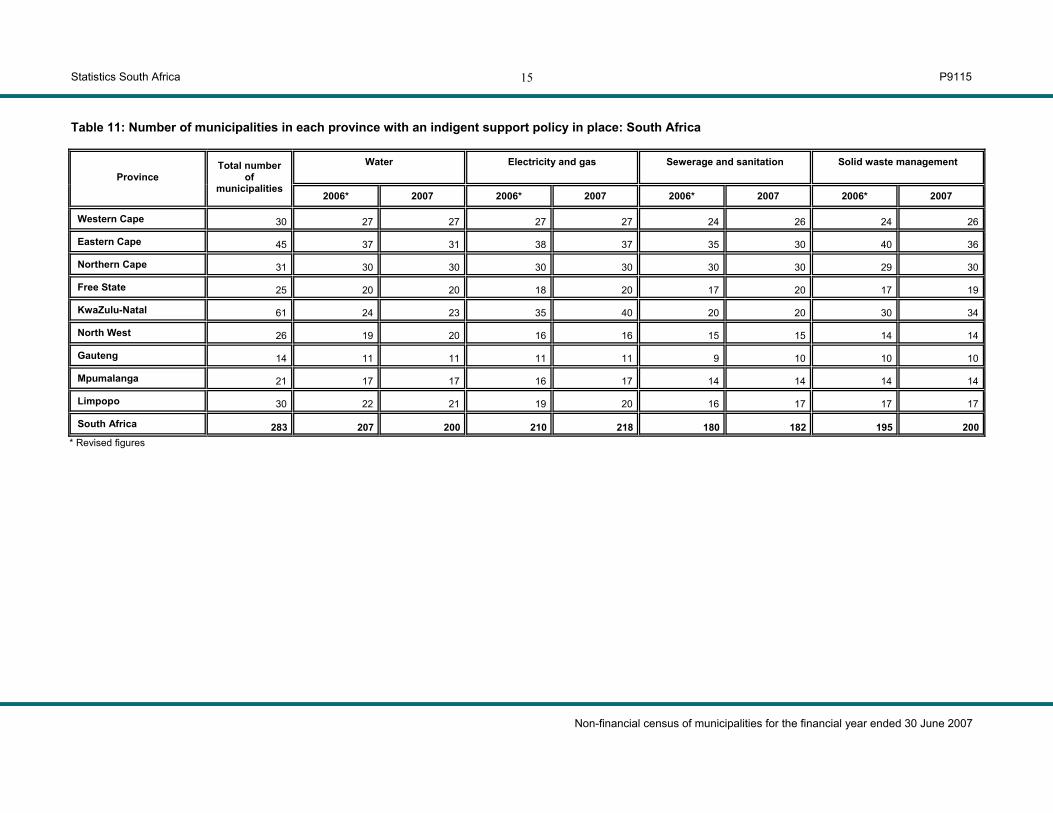
Table 11: Number of municipalities in each province with an indigent support policy in place: South Africa
Water Electricity and gas Sewerage and sanitation Solid waste management
Province Total number
of municipalities
2006* 2007 2006* 2007 2006* 2007 2006* 2007
Western Cape 30 27 27 27 27 24 26 24 26
Eastern Cape 45 37 31 38 37 35 30 40 36
Northern Cape 31 30 30 30 30 30 30 29 30
Free State 25 20 20 18 20 17 20 17 19
KwaZulu-Natal 61 24 23 35 40 20 20 30 34
North West 26 19 20 16 16 15 15 14 14
Gauteng 14 11 11 11 11 9 10 10 10
Mpumalanga 21 17 17 16 17 14 14 14 14
Limpopo 30 22 21 19 20 16 17 17 17
South Africa 283 207 200 210 218 180 182 195 200 * Revised figures
Statistics South Africa P9115
Non-financial census of municipalities for the financial year ended 30 June 2007
16
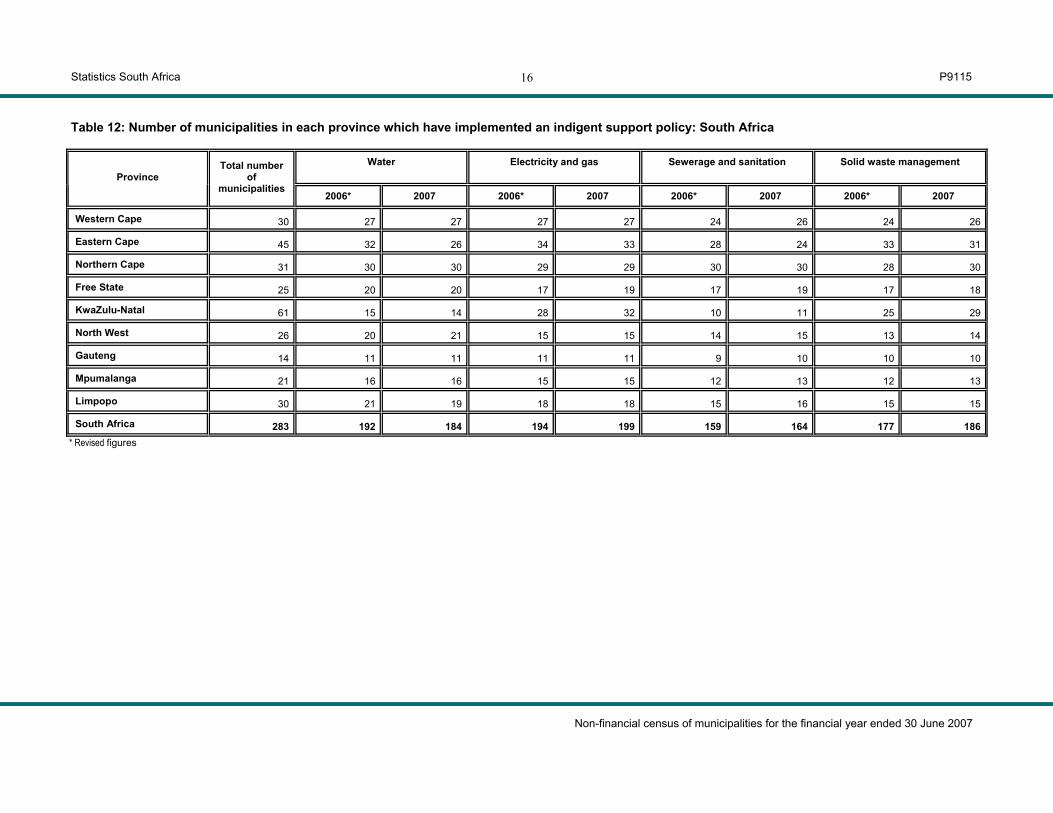
Table 12: Number of municipalities in each province which have implemented an indigent support policy: South Africa
Water Electricity and gas Sewerage and sanitation Solid waste management Province
Total number of
municipalities 2006* 2007 2006* 2007 2006* 2007 2006* 2007
Western Cape 30 27 27 27 27 24 26 24 26
Eastern Cape 45 32 26 34 33 28 24 33 31
Northern Cape 31 30 30 29 29 30 30 28 30
Free State 25 20 20 17 19 17 19 17 18
KwaZulu-Natal 61 15 14 28 32 10 11 25 29
North West 26 20 21 15 15 14 15 13 14
Gauteng 14 11 11 11 11 9 10 10 10
Mpumalanga 21 16 16 15 15 12 13 12 13
Limpopo 30 21 19 18 18 15 16 15 15
South Africa 283 192 184 194 199 159 164 177 186 * Revised figures

Statistics South Africa P9115
Non-financial census of municipalities for the financial year ended 30 June 2007
17
Table 13.1: Number of municipalities in each province that provide free alternative energy: South Africa 2006*
Province Total number of municipalities
Coal Liquefied petroleum gas Paraffin Candles Solar home
system Fire gel Other
Western Cape 30 0 0 0 0 2 0 0
Eastern Cape 45 0 1 2 1 3 1 1
Northern Cape 31 0 0 3 1 1 0 2
Free State 25 0 0 1 1 0 0 0
KwaZulu-Natal 61 0 0 1 1 5 13 4
North West 26 0 1 0 0 0 0 0
Gauteng 14 0 0 0 0 0 0 0
Mpumalanga 21 0 1 1 0 1 0 0
Limpopo 30 0 0 0 0 3 1 1
South Africa 283 0 3 8 4 15 15 8 * Revised figures
Statistics South Africa P9115
Non-financial census of municipalities for the financial year ended 30 June 2007
18
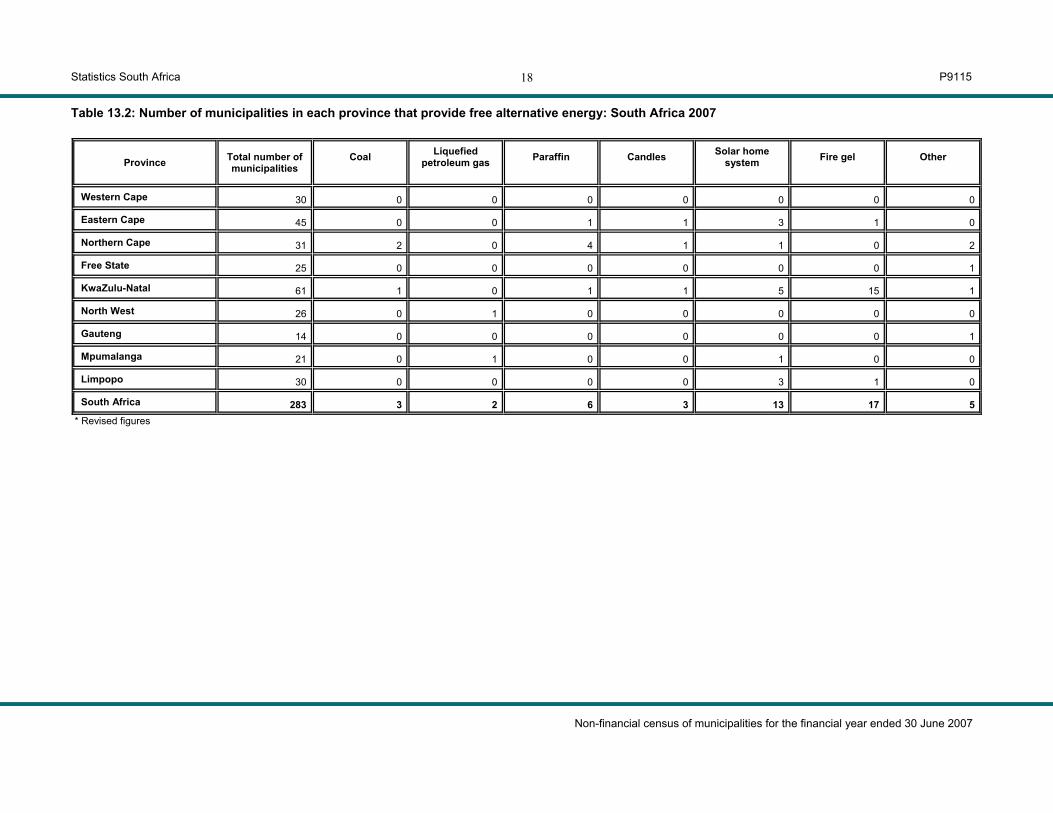
Table 13.2: Number of municipalities in each province that provide free alternative energy: South Africa 2007
Province Total number of municipalities
Coal Liquefied petroleum gas Paraffin Candles Solar home
system Fire gel Other
Western Cape 30 0 0 0 0 0 0 0
Eastern Cape 45 0 0 1 1 3 1 0
Northern Cape 31 2 0 4 1 1 0 2
Free State 25 0 0 0 0 0 0 1
KwaZulu-Natal 61 1 0 1 1 5 15 1
North West 26 0 1 0 0 0 0 0
Gauteng 14 0 0 0 0 0 0 1
Mpumalanga 21 0 1 0 0 1 0 0
Limpopo 30 0 0 0 0 3 1 0
South Africa 283 3 2 6 3 13 17 5 * Revised figures
Statistics South Africa P9115
Non-financial census of municipalities for the financial year ended 30 June 2007
19
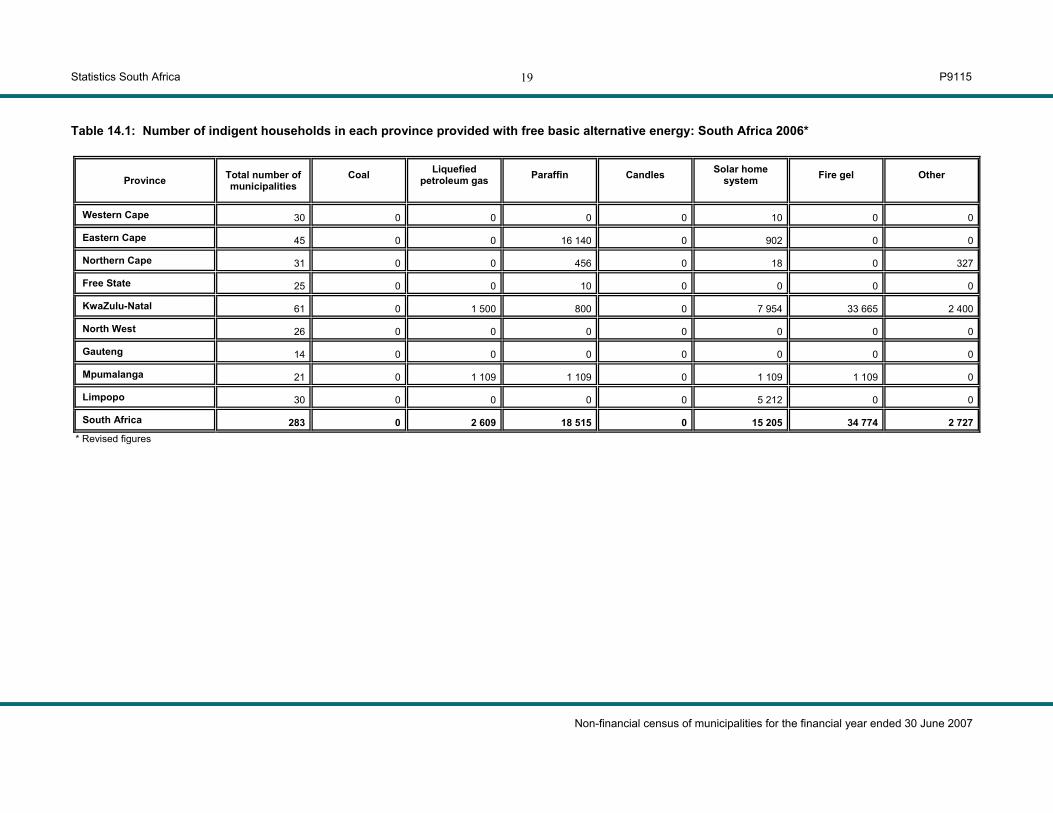
Table 14.1: Number of indigent households in each province provided with free basic alternative energy: South Africa 2006*
Province Total number of municipalities
Coal Liquefied petroleum gas Paraffin Candles Solar home
system Fire gel Other
Western Cape 30 0 0 0 0 10 0 0
Eastern Cape 45 0 0 16 140 0 902 0 0
Northern Cape 31 0 0 456 0 18 0 327
Free State 25 0 0 10 0 0 0 0
KwaZulu-Natal 61 0 1 500 800 0 7 954 33 665 2 400
North West 26 0 0 0 0 0 0 0
Gauteng 14 0 0 0 0 0 0 0
Mpumalanga 21 0 1 109 1 109 0 1 109 1 109 0
Limpopo 30 0 0 0 0 5 212 0 0
South Africa 283 0 2 609 18 515 0 15 205 34 774 2 727 * Revised figures
Statistics South Africa P9115
Non-financial census of municipalities for the financial year ended 30 June 2007
20
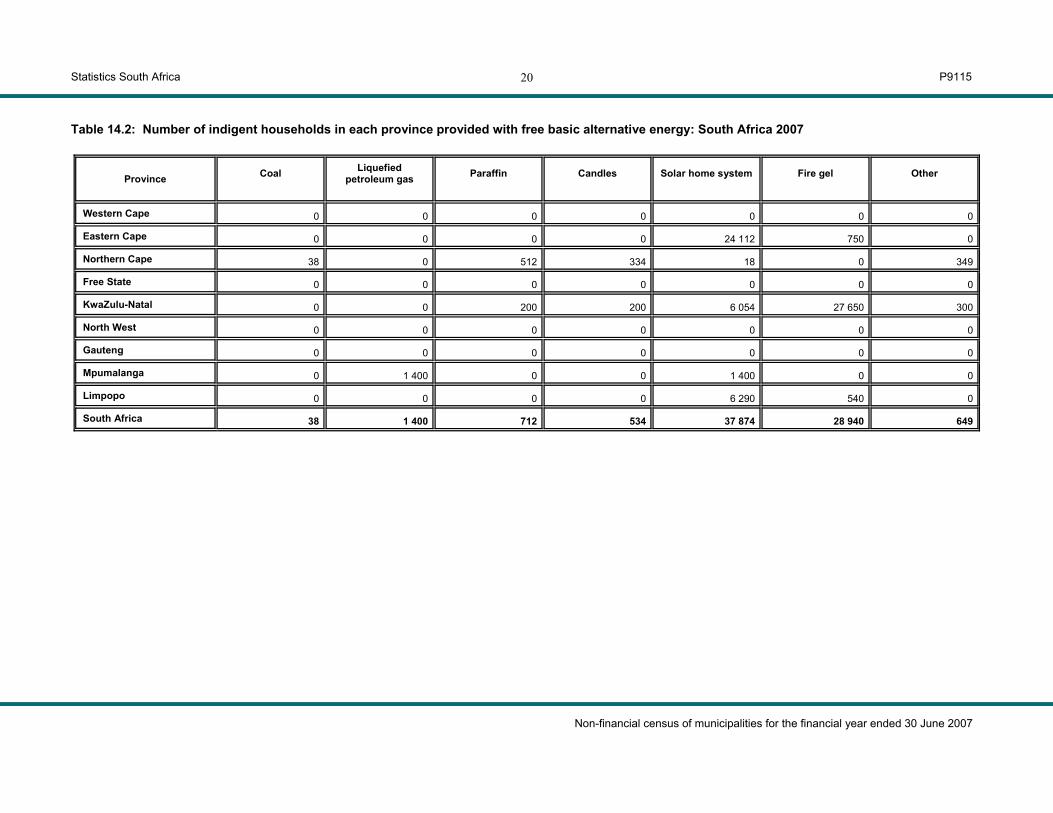
Table 14.2: Number of indigent households in each province provided with free basic alternative energy: South Africa 2007
Province Coal Liquefied petroleum gas Paraffin Candles Solar home system Fire gel Other
Western Cape 0 0 0 0 0 0 0
Eastern Cape 0 0 0 0 24 112 750 0
Northern Cape 38 0 512 334 18 0 349
Free State 0 0 0 0 0 0 0
KwaZulu-Natal 0 0 200 200 6 054 27 650 300
North West 0 0 0 0 0 0 0
Gauteng 0 0 0 0 0 0 0
Mpumalanga 0 1 400 0 0 1 400 0 0
Limpopo 0 0 0 0 6 290 540 0
South Africa 38 1 400 712 534 37 874 28 940 649

Statistics South Africa P9115
Non-financial census of municipalities for the financial year ended 30 June 2007
21
Table 15.1: Number of municipalities in each province that have submitted an Integrated Development Plan and Water Services Development Plan, have a monitoring system in place for drinking water quality, effluent discharges and an HIV/AIDS policy, signed a funding agreement with Eskom, and acquired DWAF-run water schemes and have acquired the personnel: South Africa 2006*
Province Total number
of municipalities
IDP submitted
Water services
development plan
Monitoring for water
quality
Monitoring for effluent
discharges
Funding agreement with Eskom
HIV/AIDS policy
DWAF run water
schemes
Acquired personnel
Western Cape 30 29 27 29 27 24 24 7 4
Eastern Cape 45 45 27 38 29 36 39 7 1
Northern Cape 31 31 23 29 23 26 24 10 2
Free State 25 25 13 22 17 11 15 7 5
KwaZulu-Natal 61 59 23 28 28 39 47 17 14
North West 26 24 11 20 15 13 17 6 1
Gauteng 14 13 10 12 11 8 13 0 0
Mpumalanga 21 20 10 18 16 16 14 7 4
Limpopo 30 30 22 25 21 19 16 13 7
South Africa 283 276 166 221 187 192 209 74 38 * Revised figures
Statistics South Africa P9115
Non-financial census of municipalities for the financial year ended 30 June 2007
22
Table 15.2: Number of municipalities in each province that have submitted an Integrated Development Plan and Water Services Development Plan, have a monitoring system in place for drinking water quality, effluent discharges and an HIV/AIDS policy, signed a funding agreement with Eskom, and acquired DWAF-run water schemes and have acquired the personnel: South Africa 2007
Province Total number
of municipalities
IDP submitted
Water services
development plan
Monitoring for water
quality
Monitoring for effluent
discharges
Funding agreement with Eskom
HIV/AIDS policy
DWAF run water
schemes
Acquired personnel
Western Cape 30 30 27 28 26 25 26 11 8
Eastern Cape 45 42 15 26 17 25 30 10 6
Northern Cape 31 27 25 29 26 26 25 9 4
Free State 25 19 14 20 19 15 19 8 5
KwaZulu-Natal 61 60 24 28 25 42 50 15 12
North West 26 24 11 19 16 17 14 8 3
Gauteng 14 10 8 12 11 10 12 1 3
Mpumalanga 21 19 15 18 17 12 14 9 4
Limpopo 30 29 16 23 20 21 19 14 10
South Africa 283 260 155 203 177 193 209 85 55

Statistics South Africa P9115
Non-financial census of municipalities for the financial year ended 30 June 2007
23
Table 16: Number of municipalities in each province that have commercialised or outsourced services: South Africa
Water Electricity and gas Sewerage and sanitation Solid waste management Province
Total number of
municipalities 2006* 2007 2006* 2007 2006* 2007 2006* 2007
Western Cape 30 1 1 5 14 1 2 5 4
Eastern Cape 45 5 4 15 23 3 2 0 2
Northern Cape 31 1 3 13 19 0 3 1 4
Free State 25 2 3 10 16 1 1 0 0
KwaZulu-Natal 61 12 12 17 31 8 10 7 4
North West 26 7 8 10 17 5 4 6 6
Gauteng 14 2 1 6 6 4 3 4 4
Mpumalanga 21 1 3 5 9 0 2 1 3
Limpopo 30 3 8 15 23 2 4 4 5
South Africa 283 34 43 96 158 24 31 28 32 * Revised figures

Statistics South Africa P9115
Non-financial census of municipalities for the financial year ended 30 June 2007
24
Table 17.1: Number of consumer units connected to different types of toilet facilities in each province: South Africa 2006*
Province Flush toilets connected
to public sewerage system
Flush toilets connected to septic tank Bucket system Ventilated improved
pit latrines Other
Western Cape 836 705 28 182 3 988 3 564 16 069
Eastern Cape 656 135 43 663 34 521 117 973 46 103
Northern Cape 133 731 19 587 5 123 25 362 0
Free State 363 283 87 746 76 767 41 099 5 910
KwaZulu-Natal 786 674 61 964 165 340 600 58 389
North West 344 473 28 028 8 746 85 711 89 470
Gauteng 2 047 503 18 412 1 400 21 985 84 931
Mpumalanga 350 872 15 200 2 900 22 375 16 329
Limpopo 201 906 24 542 0 164 424 218 502
South Africa 5 721 282 327 324 133 610 823 093 535 703 * Revised figures
Statistics South Africa P9115
Non-financial census of municipalities for the financial year ended 30 June 2007
25
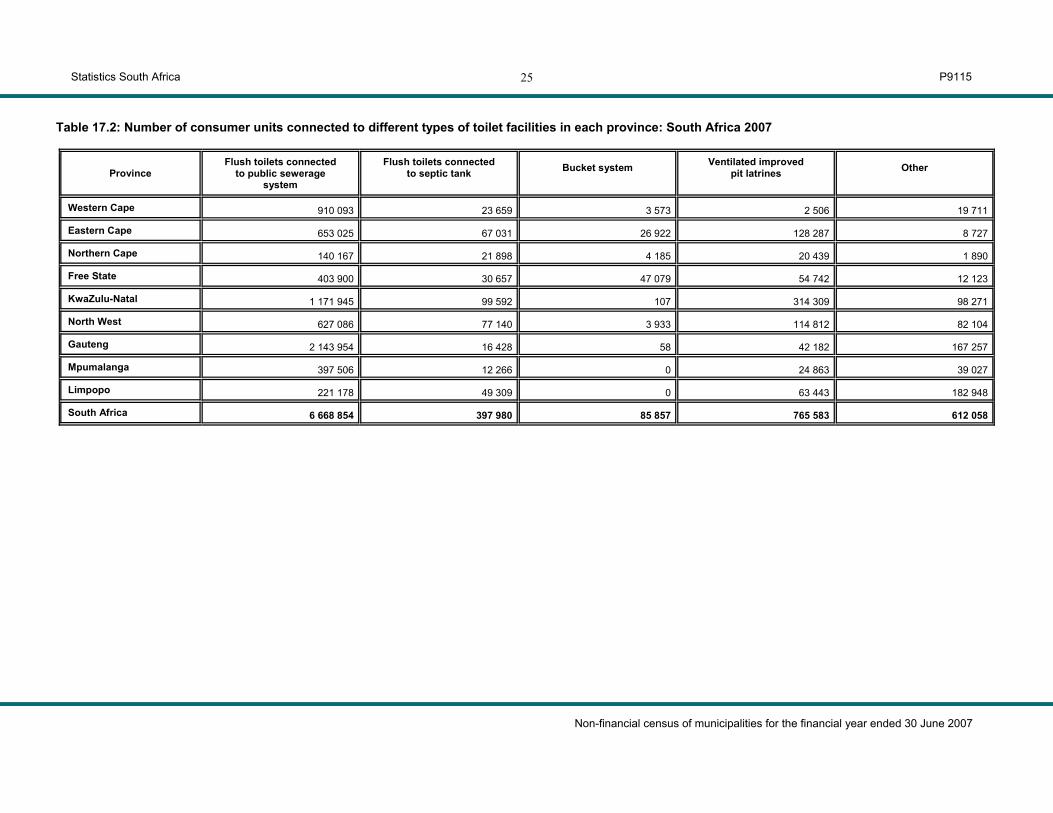
Table 17.2: Number of consumer units connected to different types of toilet facilities in each province: South Africa 2007
Province Flush toilets connected
to public sewerage system
Flush toilets connected to septic tank Bucket system Ventilated improved
pit latrines Other
Western Cape 910 093 23 659 3 573 2 506 19 711
Eastern Cape 653 025 67 031 26 922 128 287 8 727
Northern Cape 140 167 21 898 4 185 20 439 1 890
Free State 403 900 30 657 47 079 54 742 12 123
KwaZulu-Natal 1 171 945 99 592 107 314 309 98 271
North West 627 086 77 140 3 933 114 812 82 104
Gauteng 2 143 954 16 428 58 42 182 167 257
Mpumalanga 397 506 12 266 0 24 863 39 027
Limpopo 221 178 49 309 0 63 443 182 948
South Africa 6 668 854 397 980 85 857 765 583 612 058

Statistics South Africa P9115
Non-financial census of municipalities for the financial year ended 30 June 2007
26
Explanatory notes Introduction This publication contains results of the annual non-financial census of municipalities for the years ended 30 June 2006 and
30 June 2007. Scope of the survey This survey covers non-financial information of all 283 municipalities for 2006 and 2007. The census provides information
that can serve as a framework to stakeholders and policy-makers for analysis, planning and monitoring in terms of service delivery of water, electricity, solid waste management, sewerage and sanitation.
Statistical unit The statistical unit for the collection of information is the municipality. Survey methodology and design The information is collected annually from 283 municipalities administered through questionnaires by means of post, email
and facsimile. Reliability of estimates Inaccuracies may occur because of imperfections in reporting by municipalities. Every effort is made to reduce errors to a
minimum by carefully designing the questionnaire, undertaking pilot studies, workshops and editing the data. Abbreviations and symbols 0 Nil or not applicable IDP Integrated Development Plan WSDP Water Services Development Plan SIC Standard Industrial Classification of all Economic Activities ISIC International Standard Industrial Classification of all Economic Activities Stats SA Statistics South Africa DWAF Department of Water Affairs and Forestry Comparability with previous census The 2007 non-financial census of municipalities is generally comparable with the 2006 non-financial census of
municipalities. Revision of data 2007 information is preliminary, and may be revised. The revised figures are due to respondents reporting revisions.
Estimations made in 2006 have been revised on information provided by respondents.

Statistics South Africa P9115
Non-financial census of municipalities for the financial year ended 30 June 2007
27
Glossary Broad-based approach Each consumer unit in that municipality receiving free basic services on the current billing system of the municipality. Consumer unit An entity to which the service is (or would be) delivered, and which receives one bill if the service is billed, alternatively
known as a delivery point. (This concept is often referred to as a household by municipalities, but this is not strictly correct, as households and consumer units do not coincide one to one, particularly in blocks of flats, on stands where there are multiple households in the same dwelling, or in additional dwellings, such as garden flats, backyard rooms, etc. and in the case of public taps.)
District municipality District municipality means a municipality that has municipal executive and legislative authority in an area that includes
more than one municipality, and which is described in section 155(1) of the Constitution as a category C municipality. (Refer to Local Government: Municipal Structures Act, 1998 (Act No.117 of 1998).)
Employees Employees are those people employed by the individual/enterprise/business/organisation who received payment (in
salaries, wages, commission, piece rates or payments in kind) for any part of the reference period (excluding independent contractors and employers).
Free basic electricity An amount of electricity determined by government that should be provided free to poor households to meet basic needs,
currently set at 50 kWh per month per household. Free basic water An amount of water determined by government that should be provided free to poor households to meet basic needs,
currently set at 6 kl per month per household within 200 meters from each dwelling. Full-time employees Full-time employees are those employees (permanent, temporary or casual) who normally work the agreed hours for a full-
time employee in a specific occupation. If agreed hours do not apply, employees are regarded as full-time if they normally work 35 hours per week, including seasonal employees.
Geographical targeting The process whereby consumers living in a particular area are assumed to have the same socio-economic profile and
therefore tariffs can be set on location. Household (a) A group of persons who live together and provide themselves jointly with food or other essentials for living, or a single
person who lives alone. (b) A billing unit or delivery point. (Both definitions were specified in the questionnaire.) Given the different meanings of ‘household’, users are advised to use caution when comparing this publication with other Stats SA publications that report data at the household level (for example, the General Household Survey and the Labour Force Survey).
Indigent household These are poor households as defined by municipalities. The basis on which a municipality determines if a household is
indigent (and the criteria used for such determination) can vary.

Statistics South Africa P9115
Non-financial census of municipalities for the financial year ended 30 June 2007
28
Infrastructure Physical structures used for the delivery of services (e.g. power lines, pipes, roads and assets such as trucks and
equipment to unblock sewerage, pay point offices and computers). Integrated Development Plan This is a process by which municipalities prepare 5-year strategic plans that are reviewed annually in consultation with
communities and stakeholders. Local municipality Local municipality means a municipality that shares municipal executive and legislative authority in its area with a district
municipality within whose area it falls, and which is described in section 155(1) of the Constitution as a category B municipality. (Refer to Local Government: Municipal Structures Act, 1998 (Act No. 117 of 1998).)
Managerial position For the purpose of this survey, managerial positions refer to section 57 managers, according to the Local Government
Municipal System Act, 2000 (Act No. 1187 of 20 Nov 2000) and other managers according to the organogram. Metropolitan municipality Metropolitan municipality means a municipality that has exclusive executive and legislative authority in its area, and which
is described in section 155(1) of the Constitution as a category A municipality. (Refer to Local Government: Municipal Structure Act 1998, (Act No. 117 of 1998).)
Municipality Municipality is a generic term describing the “unit” of government in the local spheres responsible for local government in a
geographically demarcated area and includes district, local and metropolitan municipalities. A municipality is an institution consisting of a municipal council (elected political representatives) and the municipal administration (appointed officials).
Part-time employees Part-time employees are employees (permanent, temporary or casual) who are not full-time employees as defined above
or who normally work less than 35 hours per week, including seasonal employees. Self-targeting approach A system whereby only indigent households receive the benefits of the free basic services programme as mutually
determined by the service provider and service authority. Technical targeting The process whereby technology is used to regulate the provision of free basic services (including water and electricity
maters). Water Service Development Plan The WSDP is a sectoral plan that falls within the inter-sectoral umbrella plan of the IDP.

Statistics South Africa P9115
Non-financial census of municipalities for the financial year ended 30 June 2007
29
General information Stats SA publishes approximately 300 different releases each year. It is not economically viable to produce them in more than one of South Africa’s eleven official languages. Since the releases are used extensively, not only locally but also by international economic and social-scientific communities, Stats SA releases are published in English only. Stats SA has copyright on this publication. Users may apply the information as they wish, provided that they acknowledge Stats SA as the source of the basic data wherever they process, apply, utilise, publish or distribute the data, and also that they specify that the relevant application and analysis (where applicable) result from their own processing of the data. Stats SA products A complete set of Stats SA publications is available at the Stats SA Library and from the following libraries: State Library, Pretoria Library of Parliament, Cape Town South African Library, Cape Town Bloemfontein Public Library Natal Society Library, Pietermaritzburg Johannesburg Public Library
Eastern Cape Library Services, King William’s Town Central Regional Library, Polokwane Central Reference Library, Nelspruit Central Reference Collection, Kimberly Central Reference Library, Mmabatho
Stats SA also provides a subscription service. Electronic services A large range of data is available via on-line services, diskette and computer printouts. For more details about our electronic data services, contact 012 310 8095. You can visit us on the Internet at: www.statssa.gov.za Enquiries Telephone number 012 310 8600/ 8390/ 8351/ 8351/ 8496/ 4892/ 8095 (user information services) 012 310 8306/ 2931/ 8605/ (technical enquiries) 012 310 8161 (orders) 012 310 8490 (library) Fax number: 012 310 8332 (technical enquiries) Email address: [email protected] (user information service) [email protected] (technical enquiries) [email protected] (orders) Postal address: Private Bag X44, Pretoria, 0001


