
Passive Acoustic Contributions to Stock Assessment in the Cetacean
Research Program
Erin Oleson Cetacean Research Program NOAA Fisheries, Pacific Islands Fisheries Science Center
2015 External Review: Protected Species Division

Passive acoustic techniques are a proven tool for cetacean monitoring • Sounds travels further through water than light, such that most
cetacean species use sound for foraging, communication, and navigation
• Poor sea conditions reduce visual detection, but have less impact on acoustic detection
• Autonomous systems provide for remote, long-term, mobile or stationary monitoring
• Today there is wide-spread use and development of highly capable systems to monitor species distribution, movements, habitat, abundance, and the impacts of ocean noise
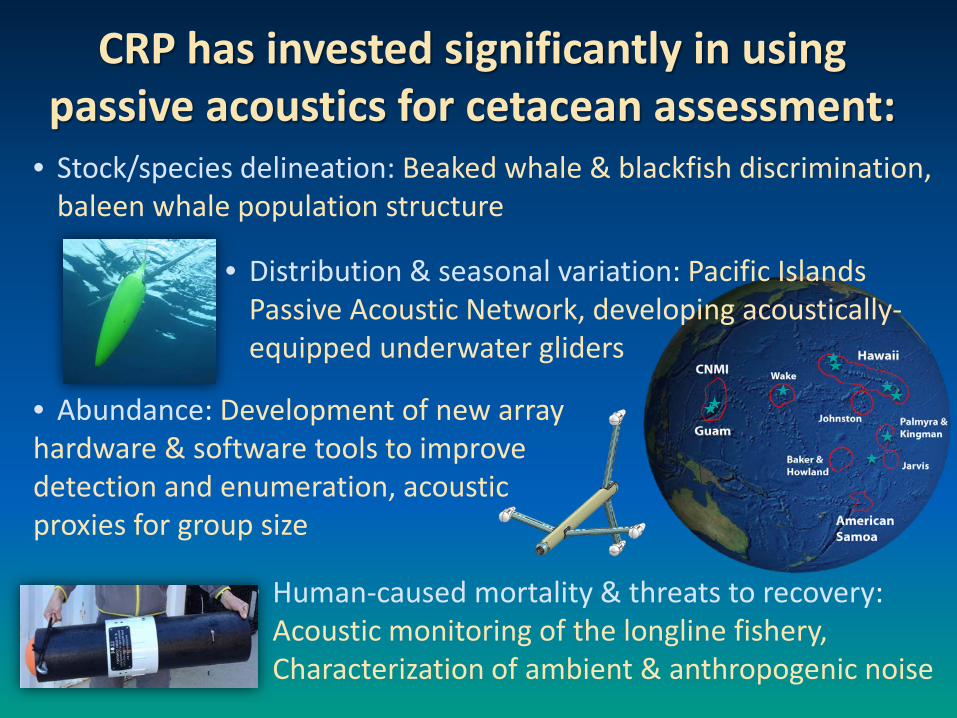
CRP has invested significantly in using passive acoustics for cetacean assessment:
• Stock/species delineation: Beaked whale & blackfish discrimination, baleen whale population structure
• Distribution & seasonal variation: Pacific Islands Passive Acoustic Network, developing acoustically-equipped underwater gliders
• Abundance: Development of new array hardware & software tools to improve detection and enumeration, acoustic proxies for group size
• Human-caused mortality & threats to recovery: Acoustic monitoring of the longline fishery, Characterization of ambient & anthropogenic noise
We also rely heavily on collaboration to advance the technology & our goals
Currently four Cooperative Institute, contract, and PhD student bioacousticians working within the Cetacean Research Program
Major collaborators- • Scripps Institution of Oceanography • Southwest Fisheries Science Center • University of Hawaii Department of Ocean Engineering &
Hawaii Institute of Marine Biology • Hawaii Longline Association • Cascadia Research Collective

Species identification & Stock delineation
Acoustic discrimination of species and stocks provides the basis for all other passive acoustic assessment applications.
• Species discrimination using acoustic signals • Examples: Discrimination of blackfish & beaked whales using echolocation
clicks
• Stock identification using acoustic signals • Example: Stock identification of Hawaiian false killer whales • Population differences in North Pacific fin whales • Geographic variation in Rissos’ dolphins
Oleson et al. 2014. Synchronous seasonal change in fin whale song in the North Pacific. PLoS One 9(12). Soldevilla, et al. in review. Geographic variation in Risso’s dolphin echolocation click spectra.
Passive Acoustic Contributions to Cetacean Assessment
CRP provides visually-verified single species recordings for community development of species and stock discrimination algorithms

False killer whale vs. pilot whale species discrimination using echolocation clicks
• False killer whales whistles are readily identifiable to species
• Click classification is complicated by recording system response – Requires calibrated sensors or
system-specific classifiers
Baumann-Pickering, et al. False killer whale and pilot whale acoustic identification. ESR in press.
Click classification from calibrated Acoustic Network stations is possible through association of acoustic detections of satellite tagged whales.
Hawaii
Kauai
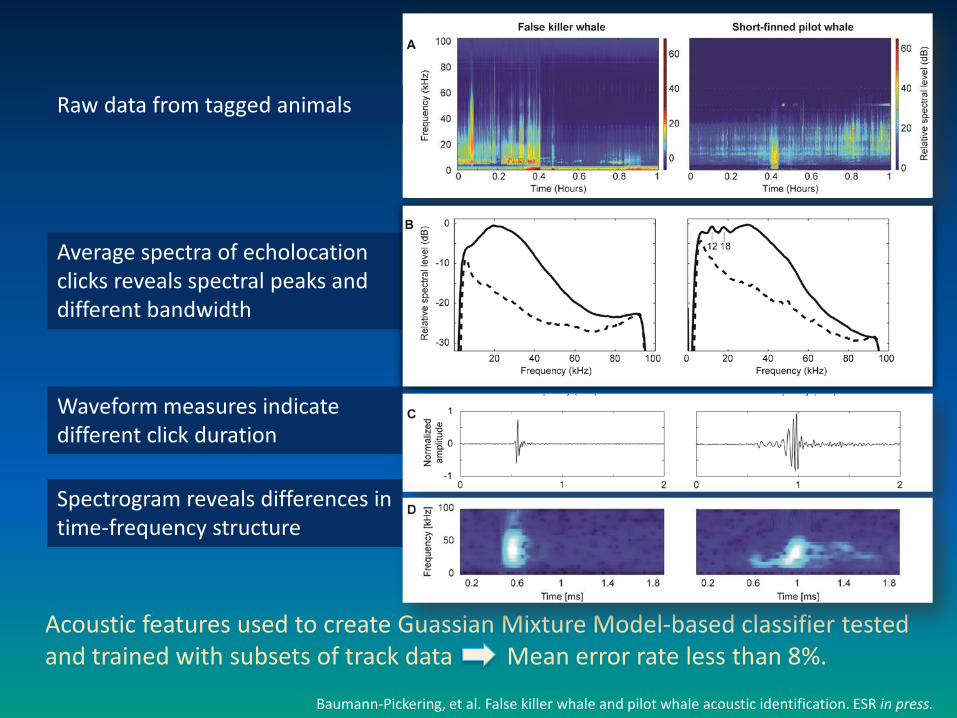
Raw data from tagged animals
Average spectra of echolocation clicks reveals spectral peaks and different bandwidth
Waveform measures indicate different click duration
Spectrogram reveals differences in time-frequency structure
Baumann-Pickering, et al. False killer whale and pilot whale acoustic identification. ESR in press.
Acoustic features used to create Guassian Mixture Model-based classifier tested and trained with subsets of track data Mean error rate less than 8%.

Beaked whale clicks can be discriminated using the same methods
Baumann-Pickering et al. 2013. Species-specific beaked whale echolocation signals. JASA .
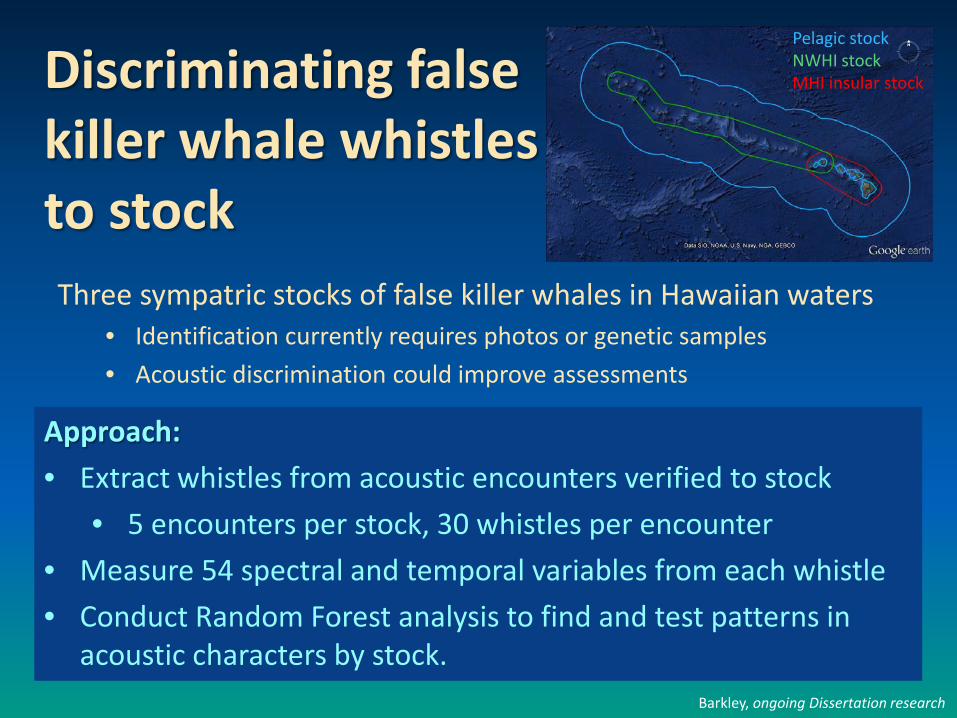
Discriminating false killer whale whistles to stock Three sympatric stocks of false killer whales in Hawaiian waters
• Identification currently requires photos or genetic samples • Acoustic discrimination could improve assessments
Barkley, ongoing Dissertation research
Pelagic stock NWHI stock MHI insular stock
Approach: • Extract whistles from acoustic encounters verified to stock
• 5 encounters per stock, 30 whistles per encounter • Measure 54 spectral and temporal variables from each whistle • Conduct Random Forest analysis to find and test patterns in
acoustic characters by stock.

Random Forest Analysis
1/5 for test data (3 groups, 90 whistles)
4/5 for training data (12 groups, 360 whistles )
NO
OVE
RLAP
Barkley, ongoing Dissertation research
Pelagic stock NWHI stock MHI insular stock

NWHI 54% (27) 28% (14) 18% (9) 50
MHI 4% (2) 0 96% (48) 50
Pelagic NWHI MHI Total Groups
Pelagic 80% (40) 14% (7) 6% (3) 50
Random Forest Classification Results
Compiled results for 10 trials
True
Sto
ck
Classified Stock
Barkley, ongoing Dissertation research
• Some success with MHI & pelagic stocks • With additional data classification success varies
– Exploring sensitivity to group size, # whistles per encounter, unequal sample size, and other factors

Stock distribution, including seasonality
Acoustic assessment of distribution has increased species inventories in regions with little survey effort and identified
occurrence of cryptic species.
• Pacific Islands Passive Acoustic Network • Occurrence analyses focus on rarely seen and/or
Endangered species • Examples: Baleen whales & beaked whales across the central and
western Pacific • Example: Identification of Kogia occurrence • Sperm whale & blackfish occurrence patterns
Passive Acoustic Contributions to Cetacean Assessment
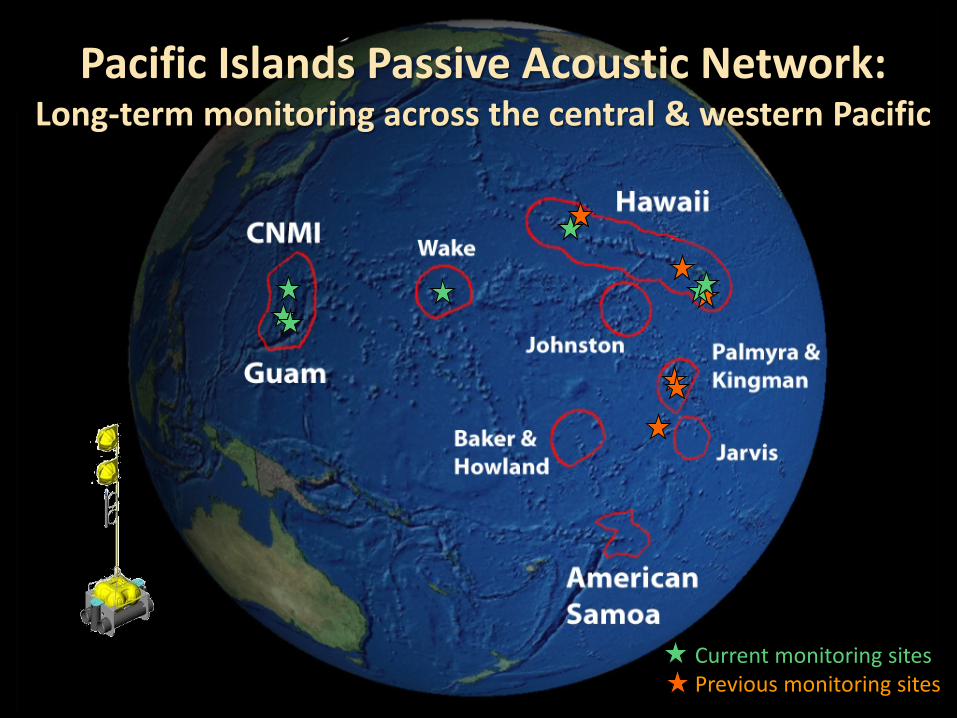
Pacific Islands Passive Acoustic Network: Long-term monitoring across the central & western Pacific
Current monitoring sites Previous monitoring sites

High-Frequency Acoustic Recording Packages (HARPs)
Capabilities: • Acoustic sensing from 10 Hz to 100-160kHz • Can record acoustic data for 2 months to 2
years • Calibrated for measurements of ambient
noise and sound received levels
CRPs primary tool for assessing broad spatial and temporal patterns of cetacean occurrence in the central and western Pacific
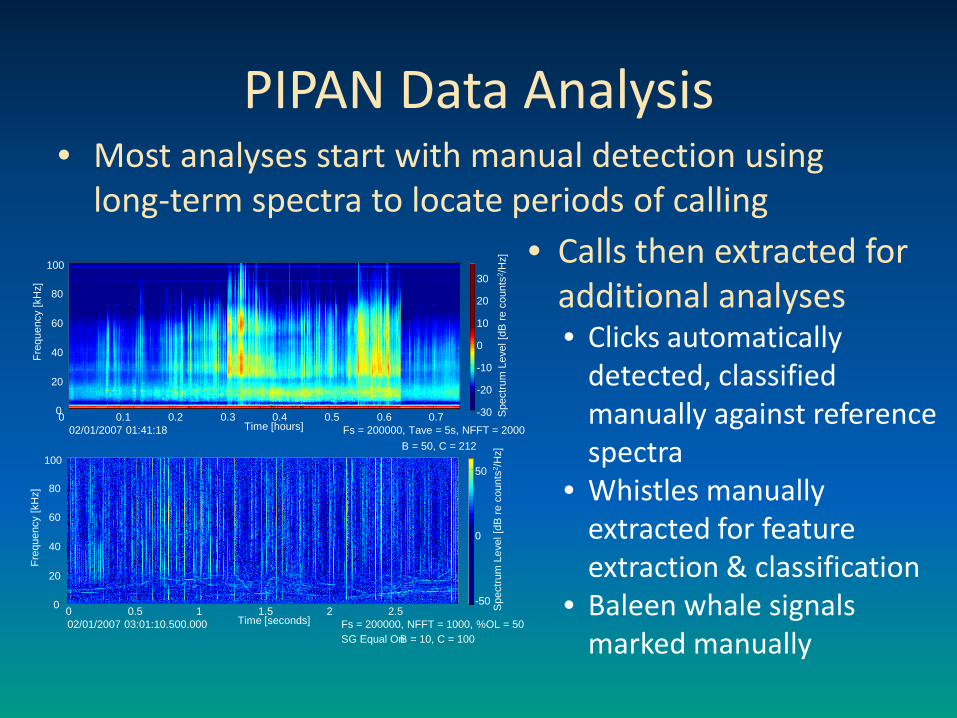
• Most analyses start with manual detection using long-term spectra to locate periods of calling
PIPAN Data Analysis
Time [seconds]
Freq
uenc
y [k
Hz]
02/01/2007 03:01:10.500.000 Fs = 200000, NFFT = 1000, %OL = 50 B = 10, C = 100 SG Equal On
0 0.5 1 1.5 2 2.5 0
20
40
60
80 S
pect
rum
Lev
el [d
B re
cou
nts2 /H
z]
-50
0
50 100
Time [hours]
Freq
uenc
y [k
Hz]
02/01/2007 01:41:18 Fs = 200000, Tave = 5s, NFFT = 2000 B = 50, C = 212
0 0.1 0.2 0.3 0.4 0.5 0.6 0.7 0
20
40
60
80
100
-30
-20
-10
0
10
20
30
Spe
ctru
m L
evel
[dB
re c
ount
s2 /Hz]
• Calls then extracted for additional analyses • Clicks automatically
detected, classified manually against reference spectra
• Whistles manually extracted for feature extraction & classification
• Baleen whale signals marked manually

• All species more common at eastern sites
• Primarily in winter-time occurrence • Blue whales within the Network
year-round • Gaps in recording effort hinder full
assessment of seasonality
Baleen whales across the PIR
2009-2011
More than one population of blue whales at some sites

• Clicks automatically extracted from long-term record
• Use species-specific echolocation click features for classification
• Allows “rapid” assessment of beaked whale occurrence
Acoustic Detection of Beaked Whales in Remote Regions
Blainville’s beaked whale (Md) “Cross” beaked whale (BWC) “40kHz” beaked whale (BW40) Cuvier’s beaked whale (Zc) Deraniyagala’s beaked whale (Mh)
Baumann-Pickering, et al. 2014. Spatio-temporal patterns of beaked whale echolocation signals in the North Pacific. PlosONE

Monitoring for Kogia
Very high-frequency “smears” … are made up of clicks, but are clipped at 200kHz sample rate
August-October, 2014 98 encounters
0
2
4
6
8
10
12
14
8/1 8/16 8/31 9/15 9/30 10/15
# En
coun
ters
/Day
NOAA Ocean Acoustics Program supported the upgrade of one HARP to 320kHz sampling
HICEAS 2010 0 sightings
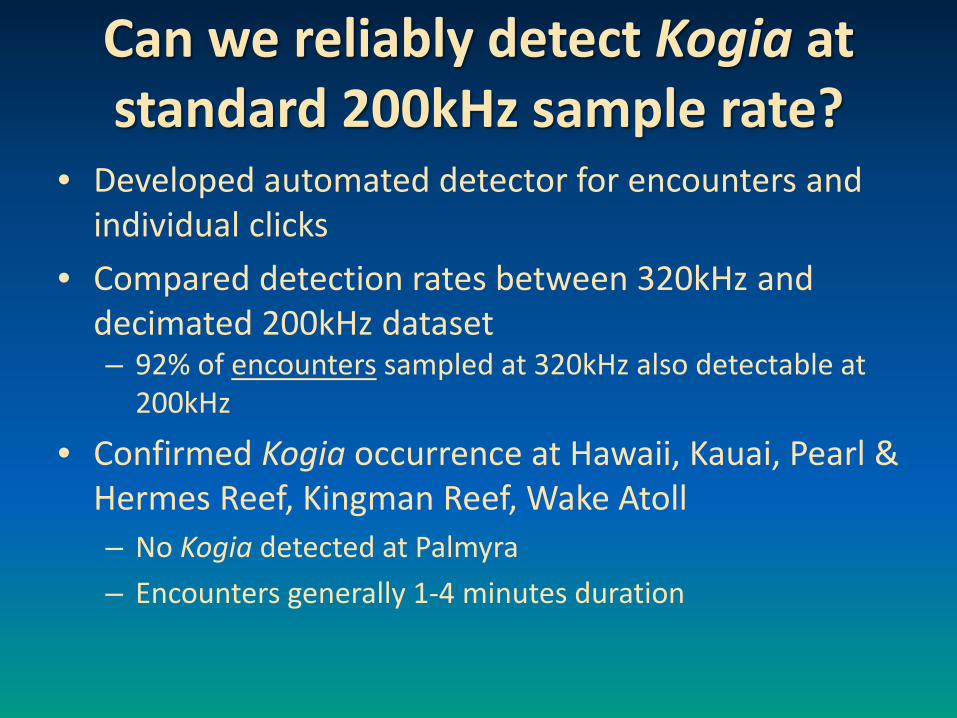
Can we reliably detect Kogia at standard 200kHz sample rate?
• Developed automated detector for encounters and individual clicks
• Compared detection rates between 320kHz and decimated 200kHz dataset – 92% of encounters sampled at 320kHz also detectable at
200kHz
• Confirmed Kogia occurrence at Hawaii, Kauai, Pearl & Hermes Reef, Kingman Reef, Wake Atoll – No Kogia detected at Palmyra – Encounters generally 1-4 minutes duration
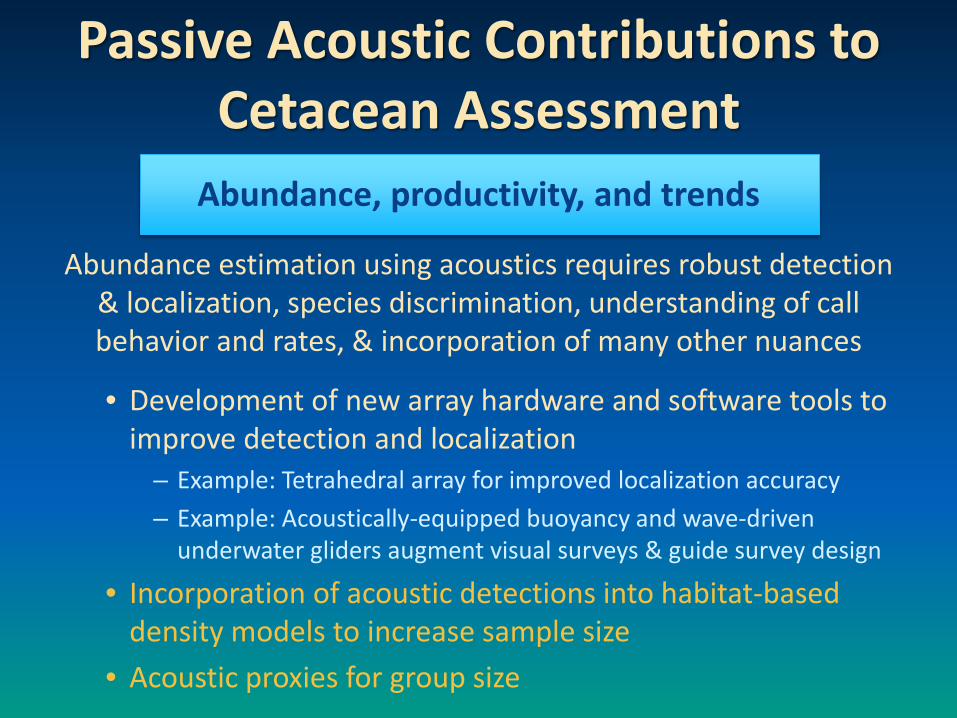
Abundance, productivity, and trends
Abundance estimation using acoustics requires robust detection & localization, species discrimination, understanding of call behavior and rates, & incorporation of many other nuances
• Development of new array hardware and software tools to improve detection and localization
– Example: Tetrahedral array for improved localization accuracy – Example: Acoustically-equipped buoyancy and wave-driven
underwater gliders augment visual surveys & guide survey design
• Incorporation of acoustic detections into habitat-based density models to increase sample size
• Acoustic proxies for group size
Passive Acoustic Contributions to Cetacean Assessment

• But there are limitations: • Hydrophones in a line
• Left – right ambiguity limits location accuracy
• Must turn the ship to locate the school
• Requires time and distance for bearings to converge • Whales may have moved toward
or away before localized • Visual and acoustic effort not
always compatible
Towed hydrophone arrays augment standard visual surveys

With partners at SWFSC, SIO, and funds from ASTWG we set out to design the
Towed ‘Tetrahedral’ Hydrophone Array
Cooperation bring progress...
Design goals: • Improve localization accuracy & efficiency
Resolve left/right and depth Finer-scale acoustic tracking
• Capable of towing at survey speed (10kts) • Low flow noise
Hydrodynamic design
Currently awaiting ASTWG SBIR award for development partner
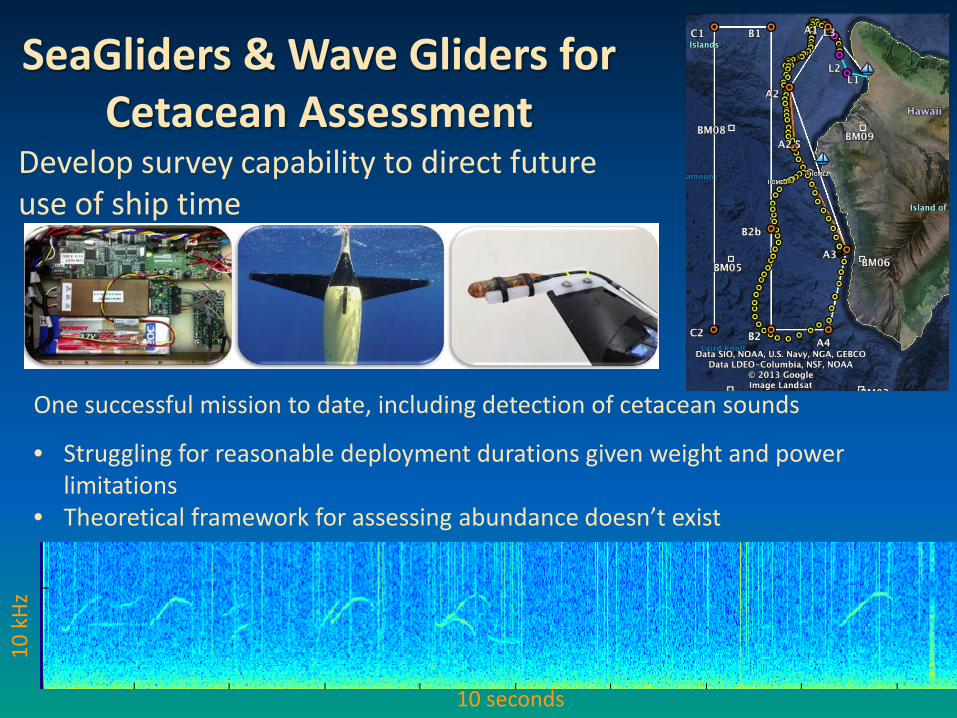
SeaGliders & Wave Gliders for Cetacean Assessment
Develop survey capability to direct future use of ship time
10 seconds
10 k
Hz
One successful mission to date, including detection of cetacean sounds
• Struggling for reasonable deployment durations given weight and power limitations
• Theoretical framework for assessing abundance doesn’t exist

Human-caused mortality & other factors impeding recovery
• Acoustic assessment of fishery interactions
• Example: Alternative observation of cetacean-fishery interaction rates • Example: Examining the mechanism of fisheries interactions
• Description, evaluation, and response to anthropogenic noise
• Annual and seasonal variations in ambient noise • Impacts of anthropogenic sounds on species distribution and
behavior
Passive Acoustic Contributions to Cetacean Assessment
Širović et al. 2013. Ocean noise in the tropical and subtropical Pacific Ocean. JASA

• False killer whales depredate fish at high rates
• Interactions create financial loss for fishermen and result in seriously injured or dead whales
• Observations of interactions are rare, fish heads are common
• Our hope: listening during fishing sets may reveal mitigation measures to reduce depredation & bycatch
Acoustic assessment of interactions with the deep-set longline fishery
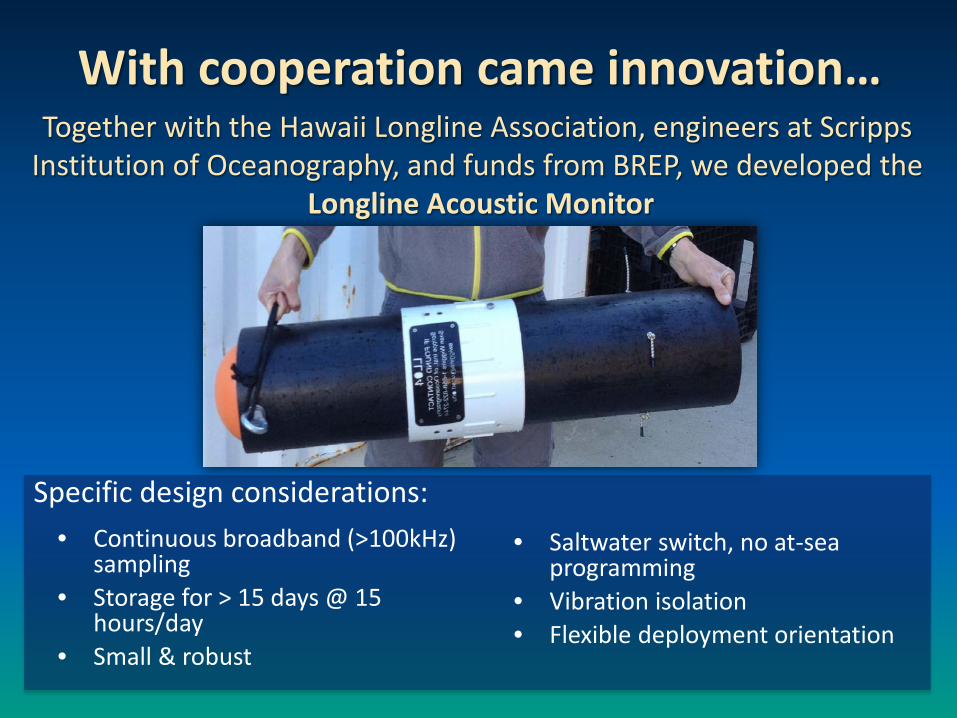
With cooperation came innovation…
Specific design considerations:
• Continuous broadband (>100kHz) sampling
• Storage for > 15 days @ 15 hours/day
• Small & robust
Together with the Hawaii Longline Association, engineers at Scripps Institution of Oceanography, and funds from BREP, we developed the
Longline Acoustic Monitor
• Saltwater switch, no at-sea programming
• Vibration isolation • Flexible deployment orientation

Three phases: 1. Testing attachment mechanism & placement, and mitigating
interference with setting & hauling of fishing gear
2. Charter deployments - multiple recorders on each set – Observer Program supported deployment & additional data collection
3. Voluntary deployment - single recorder on each set – Recorder provided through Observer Program following captain/owner
agreement – Vietnamese translator assists with placements in that sector
• Where are whales detected within the set? • How do they move through the gear? • Are there acoustic cues to depredation? • Are whales detected on sets with no catch depredation?

Charter trips- Multiple recorders
# of Sets monitored
Sets w/ False killer whale
whistles Sets w/
depredation
14 5 2
14 1 1
15 7 0
15 5 2
15 1 0
17 1 2
Volunteer trips- Single recorders
7 0 1
7 0 2
7 0 0
6 0 0
3 1 0
7 2 0
127 30 10
• 6 chartered trips in 2013-14
• 15 volunteer trips (so far) since mid-2014
• 140+ sets monitored to date
• False killer whale sounds detected in 24% monitored sets
• Catch depredation recorded on ~8% of monitored sets

Hauling Soaking Setting
Time (total 15-18 hrs)
Timeline of Fishing Operations
Trip1-set3 Set ID False killer whale whistle detections per instrument
~40 nmi of longline gear

Hauling Soaking Setting Timeline of Fishing Operations
Trip6-set5
Trip6-set7
Trip2-set1
Trip6-set10
Trip6-set11
Trip6-set15
Trip1-set3 Set ID False killer whale whistle detections per instrument
~40 nmi of longline gear
Time (total 15-18 hrs)

False Killer Whale Whistle Detections
• False killer whale detections peak during the haul • And generally don’t correspond with observed depredation
• Bait depredation may be more common than reported
0
2
4
6
8
10
12
14
Begi
n
Mid
End
Begi
n
Mid
End
Begi
n
Mid En
d
Set Soak Haul
# Ac
oust
ic E
ncou
nter
s
No Depredation 62%
Bait depredation 22%
Catch depredation
16%
Relative to timing of fishing operations Relative to timing of observed depredation

Acoustic monitoring of the fishery continues…
• Project announcements are being circulated to fishermen
• The announcement was translated to Vietnamese
• To date, ~40 boats have agreed to participate (out of ~135 total boats)
Trip summaries are provided to captains within 1 week of return, including:
• # sets monitored • # sets with cetacean sound • Relation to observed
depredation

Acoustic Contributions to Assessment Summary
• Successes: • Engaged in productive and extensive partnerships resulting in development of new
hardware & software for PIR species & assessment needs • Identified species and stock-level differences in acoustic calls forming the baseline
for acoustic assessments of high priority species • Documented species occurrence using the Acoustic Network in regions with sparse
or no visual survey coverage • Using acoustic monitoring to improve understanding and development of
mitigation strategies for cetacean interactions with the longline fishery
• Challenges: • Acoustic datasets can be massive. Analyses are time consuming, especially when
approached manually. • CRP must rely on partnerships to advance acoustic assessment. • Many species calls are not yet described or reliably classified. Impact of behavior on
call characters and calling rates is largely unknown.

We’re just getting started … • Partners:
– SWFSC: Jay Barlow, Shannon Rankin, Karin Forney & Elizabeth Becker
– SIO: Simone Baumann-Pickering, Ana Širović, John Hildebrand, Anne Simonis, Ryan Griswold & Sean Wiggins
– UH: Lora Van Uffelen, Bruce Howe & Erik Franklin – Jupiter Research Foundation: Beth Goodwin – Cascadia Research Collective: Robin Baird
• Funding: NMFS BREP, ASTWG, NOAA Ocean Acoustics Program, NMFS Assessment Methods Working Group, & Take-Reduction Program, U.S. Navy Pacific Fleet


