University of New MexicoUNM Digital Repository
Water Resources Professional Project Reports Water Resources
2014
Past, Present, Future: The Evolution of a WetlandTreatment System in Dutchman Canyon onVermejo Park RanchZoe Isaacson
Follow this and additional works at: https://digitalrepository.unm.edu/wr_sp
This Technical Report is brought to you for free and open access by the Water Resources at UNM Digital Repository. It has been accepted for inclusionin Water Resources Professional Project Reports by an authorized administrator of UNM Digital Repository. For more information, please [email protected].
Recommended CitationIsaacson, Zoe. "Past, Present, Future: The Evolution of a Wetland Treatment System in Dutchman Canyon on Vermejo Park Ranch."(2014). https://digitalrepository.unm.edu/wr_sp/109

1
Past, Present Future: The Evolution
of a Wetland Treatment System in
Dutchman Canyon on Vermejo Park
Ranch
By
Zoe Isaacson
Committee
Dr. Bruce M. Thomson, Chair
Dr. Abdulmehdi Ali
Dr. Marc Stone
A Professional Project Proposal Submitted in Partial Fulfillment of the Requirements for
the Degree of
Master of Water Resources Water Resources Program
The University of New Mexico
Albuquerque, New Mexico
November 2014

2
Past, Present, Future: The Evolution of a Wetland
Treatment System in Dutchman Canyon on
Vermejo Park Ranch
Zoe Isaacson
Masters of Water Resources Candidate
2014

3
Table of Contents
Purpose: ........................................................................................................................................................ 6
Background: .................................................................................................................................................. 7
Permitting: ................................................................................................................................................ 8
Wetland Creation: ......................................................................................................................................... 8
Phase I: Mine Seepage Management (Construction of Evaporation Ponds- 1986) .................................. 8
Phase II: Environmental Assessment (2009) .......................................................................................... 11
Phase III: Installation of Spillway and Wetland Creation (2012) ........................................................... 14
Wetland Function: ...................................................................................................................................... 17
Ecological Functions: .............................................................................................................................. 18
Wetlands as Bird Habitats: ................................................................................................................. 19
Hydrologic Functions: ............................................................................................................................ 20
Monitoring Methods: .................................................................................................................................. 21
Vegetation: .............................................................................................................................................. 21
Water Quality: ......................................................................................................................................... 22
Remote Sensing: ..................................................................................................................................... 22
Reclamation Success Standards: ................................................................................................................. 23
Results: ........................................................................................................................................................ 25
Wetland Extents: ..................................................................................................................................... 25
Vegetation: .............................................................................................................................................. 26
Water Quality: ......................................................................................................................................... 29
Conclusion: ................................................................................................................................................. 32
Appendix 1: Impacts of a September 2014 Flood Event ............................................................................. 38
Appendix 2: Location Information .............................................................................................................. 41
Climate: ................................................................................................................................................... 41
4
Geology: .................................................................................................................................................. 41
Soils: ....................................................................................................................................................... 42
Hydrology: .............................................................................................................................................. 42
Plant Community: ................................................................................................................................... 43
Wildlife: .................................................................................................................................................. 44
Appendix 3: What is a Wetland? ................................................................................................................. 47
What is a Wetland? ................................................................................................................................. 47
Wetland Trends: ...................................................................................................................................... 48
Types of Wetlands: ................................................................................................................................. 52
System: ................................................................................................................................................ 53
Class: .................................................................................................................................................. 54
Subclass: ............................................................................................................................................. 54
The Hydrologic Process in Wetlands: ..................................................................................................... 55
Water Chemistry: .................................................................................................................................... 57
pH Modifiers: ...................................................................................................................................... 57
Salinity Modifiers: .............................................................................................................................. 58
Submerged Soil: Chemistry and Behavior .............................................................................................. 58
Hydric Soils: ....................................................................................................................................... 58
Oxygen Availability: ........................................................................................................................... 59
pH: ...................................................................................................................................................... 61
Carbon: ............................................................................................................................................... 61
Appendix 4: Site Maps ................................................................................................................................ 62
Appendix 5: Seed Mixes .............................................................................................................................. 66
Dutchman Wetland Seed Mix: ................................................................................................................ 66
Swastika Upland Seed Mix: .................................................................................................................... 66

5
Apendix 6: Water Quality Reports .............................................................................................................. 68

6
Purpose:
The purpose of this research was to track the evolution of a constructed wetland system through
time while taking into consideration anthropogenic perturbations to the system. It was
accomplished by reviewing 30 year’s-worth of literature associated with the project site,
gleaning relevant information, and then synthesizing the information to form a complete
evolutionary timeline.
In the mid-1980’s, a series of evaporation ponds were built to manage mine effluent originating
from three collapsed coal mine adits.
The site was revisited in 2009 to
conduct an Environmental
Assessment (EA) at which time
vegetation and basic water quality
data were collected. The EA was
conducted to establish a baseline
habitat and water quality assessment
to determine the environmental
impact of a large-scale mine
reclamation project on the site. Based
on the information provided in the
EA, the Office of Surface Mining (in
coordination with State and Federal
agencies) issued a Finding of No
Significant Impact (FONSI).
In August 2012 a wetland was constructed using water from the evaporation ponds. The
Dutchman Canyon wetland, a continuous flow, free surface wetland, was thus formed. The
wetland was intended to passively treat poor-quality mine seepage and impart an improved
wetland habitat for a diversity fauna occupying the almost 600,000 acre Vermejo Park Ranch
(Ranch) where this system is located (Figure 1). The expanded wetland acreage at Dutchman
Figure 1: Location map (Isaacson, 2013)

7
Figure 2: Swastika Dutchman Mine Complex Pre-Reclamation
(Isaacson, 2014)
was also expected to offset wetland losses associated with a large-scale reclamation project
within the same mine complex.
Background:
The project area is approximately one mile west of the I-25 corridor near Raton, NM on land
owned by the Vermejo
Park Ranch, a holding of
Ted Turner Enterprises.
The entire 600,000 acre
ranch lies within the
Raton Coal Field. The
north-south-trending
basin extends into
Colorado and is 150
miles long by 120 miles
wide. Its southern
boundary is near Mora in
the Canadian River
Valley, and its northern
limit is Pueblo,
Colorado. The Sangre de
Cristo Mountains bound
the basin on the west and
the High Plains can be
thought of as the eastern
border. The project area
lies in the Raton Mesa
group which is
8
characterized by lava-capped erosional mesas. The Raton Basin exhibits variable physiography,
structure, stratigraphy, and petrography, with differences in elevation, climate, vegetation, and
land use (Lee 1922).
The Dutchman Canyon Ponds are located within the Swastika Mine Complex in Dillon Canyon
on the Ranch. These ponds were constructed in the late 1980’s to impound perennial flow from
underground mine workings of the Dutchman Canyon Mine. For more information regarding the
project location, climate, geology, wildlife uses, and plant community, please see Appendix 2 :
Project Location.
Permitting:
The wetland creation was authorized by the United States Army Corps of Engineers (USACE)
through the issuance of an USACE Nationwide Permit 27 (Aquatic Habitat Restoration,
Establishment, and Enhancement Activities) under Section 404 of the Clean Water Act
(Ecosphere Environmental Services 2014).
A Preliminary Jurisdictional Determination request and wetland delineation report for the
Vermejo Park Ranch Historic Mine Reclamation Project Area, which included the Swastika
Mine area and Dillon Canyon drainage, was submitted to the USACE in November 2009 (WET
2009). A wetland mitigation and monitoring plan, Wetland Mitigation Plan for Reclamation and
Safeguarding of Abandoned Coal Mine Sites in Dillon Canyon, Colfax County, New Mexico
(WET 2010), was also provided to the USACE in March 2010 (Ecosphere Environmental
Services 2014). The monitoring plan included special success standards in addition to those
outlined in the Nationwide 27 Permit. Success criteria are discussed in greater detail later in this
paper.
Wetland Creation:
Phase I: Mine Seepage Management (Construction of Evaporation Ponds- 1986)
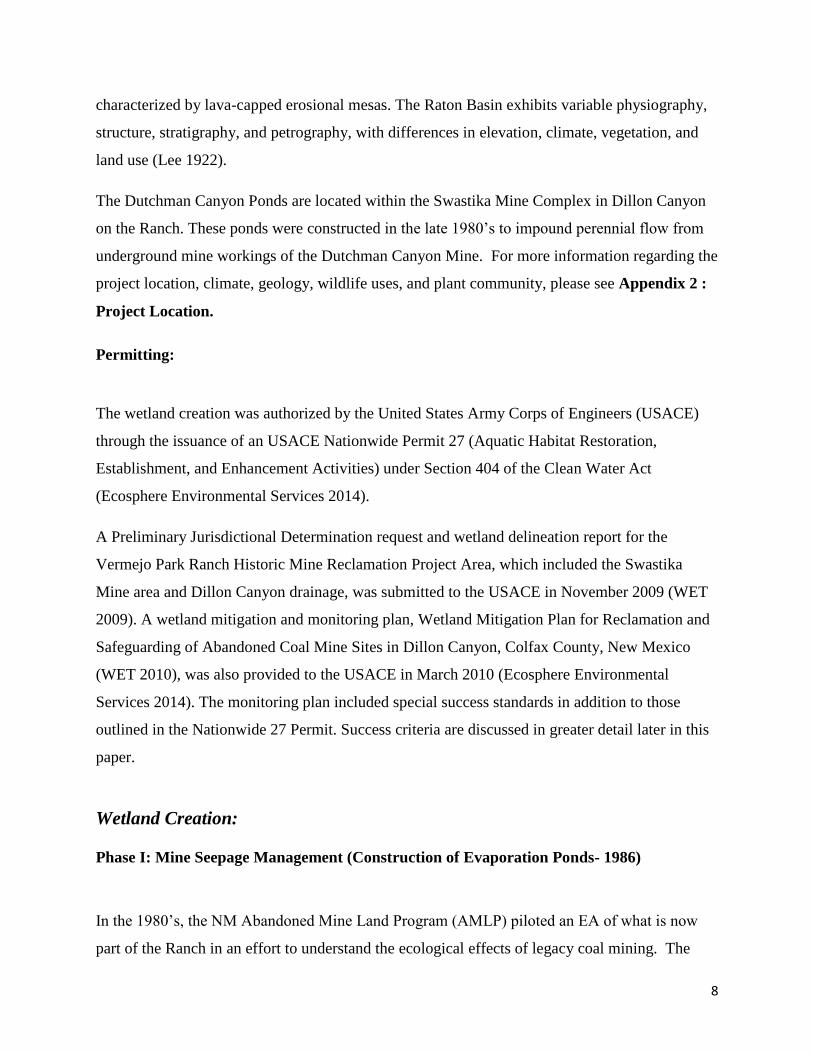
In the 1980’s, the NM Abandoned Mine Land Program (AMLP) piloted an EA of what is now
part of the Ranch in an effort to understand the ecological effects of legacy coal mining. The
9
ultimate
goal was to
safeguard mine openings and mitigate water quality impacts related to water seeping from the
mines. In the late 70’s to early 80’s, three adits associated with the Dutchman Mine collapsed,
either from natural or human causes. This resulted in water draining from the inner workings of
the mine and flowing down the center of the valley. Water quality from the mine drainage is
summarized in Table 1.

10
The poor quality of the wastewater was a primary concern of the AMLP and was believed to be
affecting wildlife and cattle birthing rates:
“Ranching, mining, and hunting are the prime sources of income in Raton.
The acid mine drainage problem that exists in the Raton area is not only a
detriment to the environment, but also a threat to the cattle and wildlife in
the area. These two commodities can be adversely affected by low birth
rates and weights due to the heavy metal contamination of the water
resource (New Mexico Abandoned Mine Land Program 1986).”
The 1986 EA goes on to state “…Dutchman Canyon is the site of three abandoned and closed
adits. Water flows from each of these adits and into the creek.” The water flowing from the adits
is mentioned as being “very high in alkalinity” and subsequently contaminates the creek- a main
watering source for wildlife and cattle in the area. Exact values or results from water quality
testing are below.
Na
K
Mg
CO3 14.7
mg/L
mg/LSO42-
Cl-
ND
uS/cm
mg/L
mg/L
mg/L
mg/L
mg/L
mg/L
3700
3886
2785
10
2.6
6.7
1030
37
Ca
pH 8.4 SU
EC @25 °C
TDS
HCO3
Concentration UnitsAnalyte
1986 Dutchman Canyon Water Quality Report (water samples
collected from seepage)
Table 1: Water Quality Results, Dutchman Mines 1986 (1986 EA)
Brackish water seeping from
collapsed mine adits
Figure 3: Mine effluent from upper adit (2009 EA)

11
Ultimately, the main channel flows into the Canadian River and offered potential impacts for
downstream users. The preferred alternative to address this issue was to “construct an
evaporating pond so that the alkali can be precipitated out prior to the discharge entering the
creek and revegetate all areas disturbed (New Mexico Abandoned Mine Land Program 1986).”
The dated EA discusses a second alternative: vegetating the flow area with plant species capable
of fixing salts; however, “this would be an expensive means of reclamation. As research into this
problem is in its advent and the appropriate plant species for alkaline fixation have not been
clearly identified (New Mexico Abandoned Mine Land Program 1986)”. However, vegetation
surveys were not conducted for this EA; halophytic vegetation suitable for uptake and
bioremediation may have been present on the property at this time. According to the EA, both
alternatives would improve riparian and fish habitat along the creek channel in Dutchman
Canyon, and the revegetation of disturbed sites would enhance wildlife habitat.
In total, two ponds were built (fall of 1987); an upper, westernmost pond, and a lower,
easternmost pond and cattails were planted. However, vegetation in these ponds failed to survive
due in part to the salinity of the water. During the initial construction, a culvert was placed at the
lower end of the easternmost pond to convey water under the road and into the Dutchman
Canyon drainage (the stream) adjacent to ponds. The outfall location of the culvert caused
considerable erosion into the stream bank and roadside, while large storm events and periods of
high flow would wash the road out entirely. Lack of water quality improvement, road
maintenance, culvert degradation, and restrictive access in the rainy season was of concern to the
ranch managers and instigated a revisit of the Dutchman Pond sites 20 years later in 2009.
Phase II: Environmental Assessment (2009)
In a field visit in 2009, the ponds were re-visited and the water quality analyzed for pH,
Electrical Conductivity (EC) and temperature. The westernmost pond (the upper pond) had a pH
of 10.24 and an EC of 3777 μs/cm at 23.6 °C and the easternmost pond (lower pond) tested for
pH of 10.04 and an EC of 4184 μs/c at 23.5 °C (cation and anion concentrations were not
measured) and discharge into the ponds was estimated to be 30 to 50 gallons per minute. pH and
EC values were significantly higher in 2009 than in 1986; reasons for this are unknown.
Water seeping from
collapsed adits

12
The areas immediately adjacent to the evaporation ponds and along the path of the mine effluent
evolved as emergent marsh wetland zones. In total, 0.49 acres were delineated as part of the
wetland delineation required for the EA. 0.28 acres were considered emergent marsh (areas
where the vegetation is rooted in saturates soils for much of the growing season), and another
0.01 acre was categorized as wet meadow (lands dominated by wetland vegetation and exhibit
indicators of wetland hydrology). According to the 2009 Wetland Delineation, the dominant
obligate vegetation in the emergent marsh zone were: mountain rush (Juncus arcticus),
cosmopolitan bulrush (Schoenoplecus maritimus), and common threesquare (Schoenoplectus
pungens).
Dominant wetland indicatior species for Dutchman Canyon (in 2009) included the following:
Lower Pond
Figure 4: Above lower pond looking southeast (2009 EA)
Mine Effluent Lower Pond
Mine Effluent
13
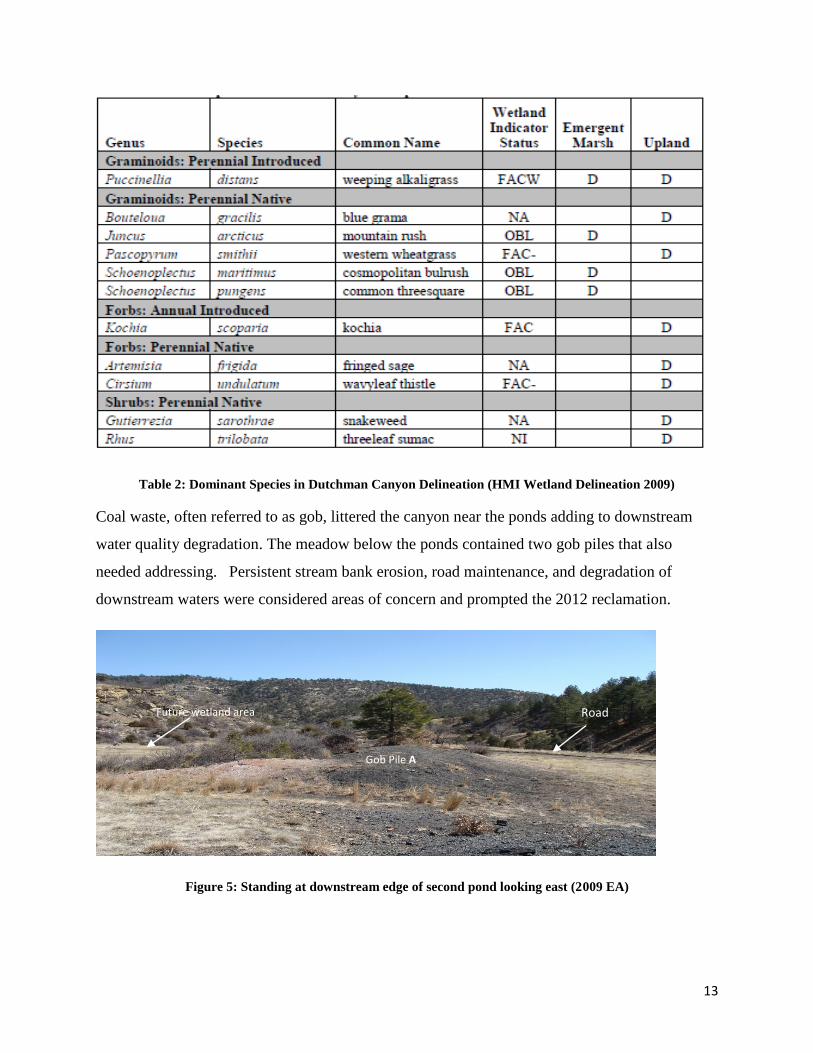
Table 2: Dominant Species in Dutchman Canyon Delineation (HMI Wetland Delineation 2009)
Coal waste, often referred to as gob, littered the canyon near the ponds adding to downstream
water quality degradation. The meadow below the ponds contained two gob piles that also
needed addressing. Persistent stream bank erosion, road maintenance, and degradation of
downstream waters were considered areas of concern and prompted the 2012 reclamation.
Figure 5: Standing at downstream edge of second pond looking east (2009 EA)
Future wetland area
Gob Pile A
Future wetland area
Road
Gob Pile A
Road

14
Figure 6: Looking north from road below ponds (2009 EA)
Phase III: Installation of Spillway and Wetland Creation (2012)
The primary objective of the 2012 reclamation was to manage mine effluent in a manner that
would reduce erosion of the stream bank and road flanking the pond system while improving
water quality. To mitigate the effects of the mine seepage, the culvert was removed and a
spillway was excavated in native soil at the downstream end of the last pond, immediately north
of a constructed embankment that now forms the south side of the pond system. The spillway is
essentially a rock rundown approximately 15 ft. by 4 ft. composed of basalt riprap 8 in. to 10 in.
in diameter.
Gob Pile B
Future Wetland
15
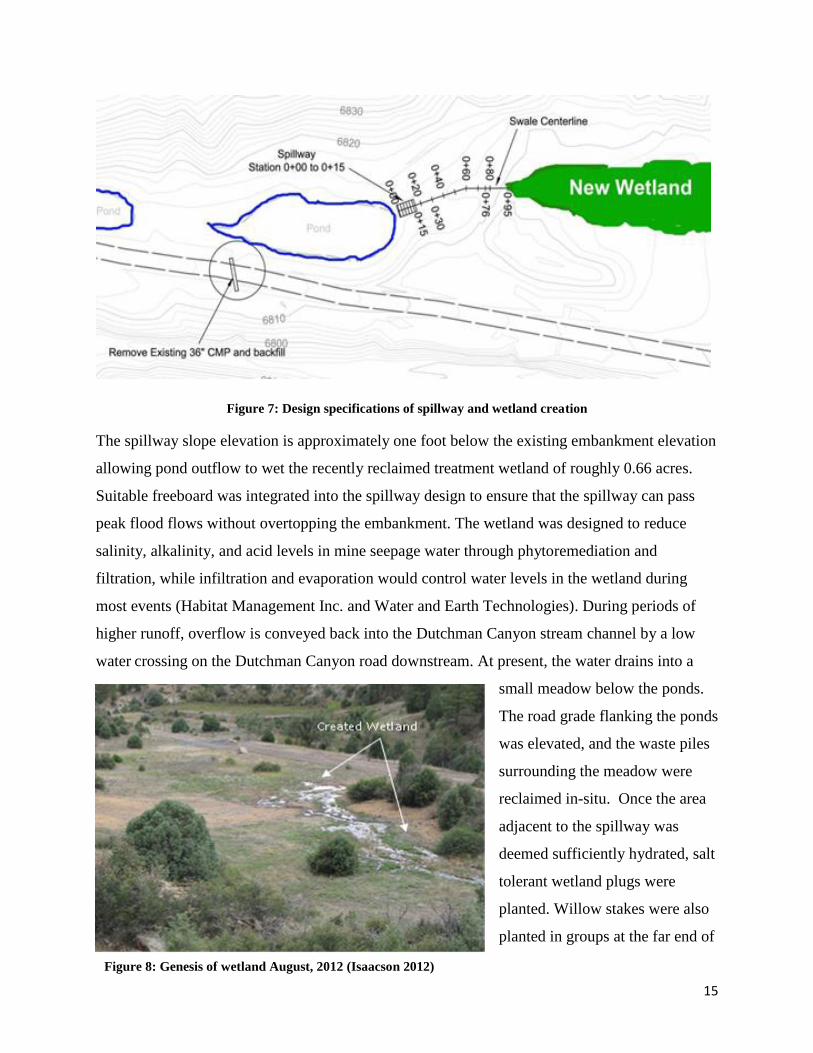
Figure 7: Design specifications of spillway and wetland creation
The spillway slope elevation is approximately one foot below the existing embankment elevation
allowing pond outflow to wet the recently reclaimed treatment wetland of roughly 0.66 acres.
Suitable freeboard was integrated into the spillway design to ensure that the spillway can pass
peak flood flows without overtopping the embankment. The wetland was designed to reduce
salinity, alkalinity, and acid levels in mine seepage water through phytoremediation and
filtration, while infiltration and evaporation would control water levels in the wetland during
most events (Habitat Management Inc. and Water and Earth Technologies). During periods of
higher runoff, overflow is conveyed back into the Dutchman Canyon stream channel by a low
water crossing on the Dutchman Canyon road downstream. At present, the water drains into a
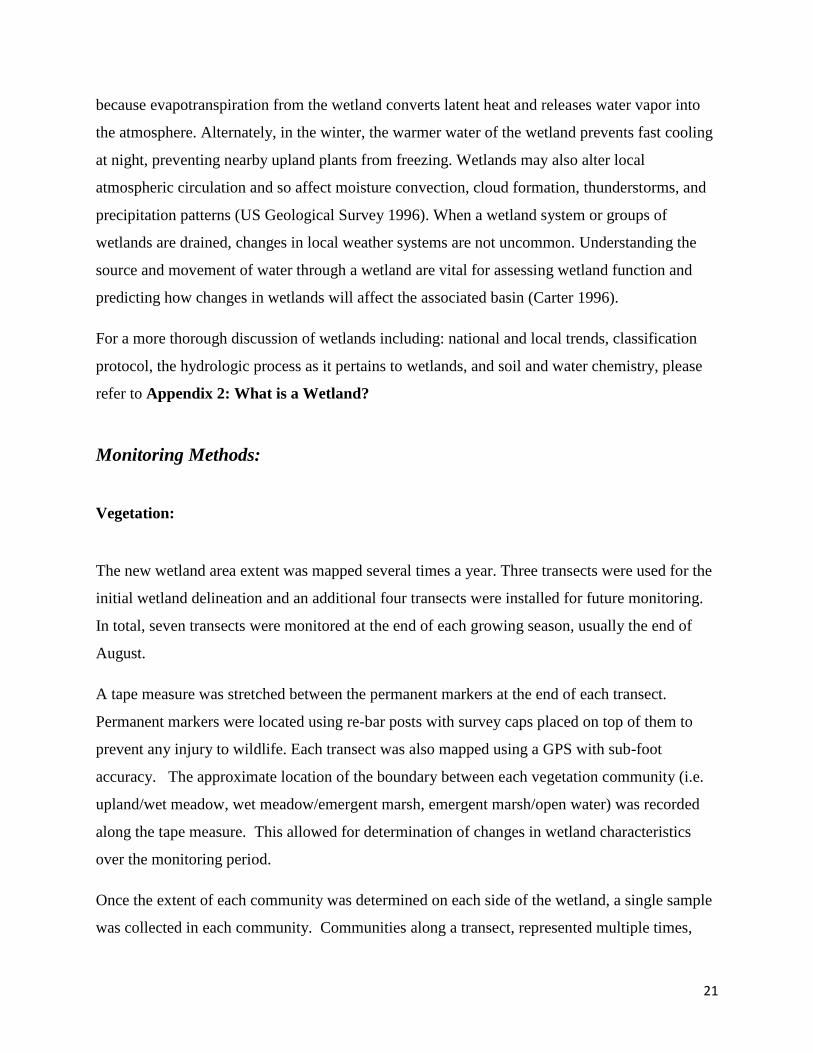
small meadow below the ponds.
The road grade flanking the ponds
was elevated, and the waste piles
surrounding the meadow were
reclaimed in-situ. Once the area
adjacent to the spillway was
deemed sufficiently hydrated, salt
tolerant wetland plugs were
planted. Willow stakes were also
planted in groups at the far end of
Figure 8: Genesis of wetland August, 2012 (Isaacson 2012)
Wetland Vegetation

16
Standing Water
Lower Pond
the saturated meadow. The intent is to maintain a mosaic of vegetation by encouraging both
wetland grasses and
shrub coverage.
The gob piles within the
saturated meadow were
reclaimed in place by
amending the waste
material with gypsum
and lime. Compost was
then ripped to a depth of
eight inches. Once the
piles were re-graded after
ripping with perpendicular furrows, the piles were seeded and covered with wood straw mulch.
Wetland plugs harvested onsite, were planted along the tongue of hydrated soil resulting from
the installed spillway. Each of the wetland plugs contained several different plant species and
were collected from nearby wetlands. Since the water entering the system has distinct alkaline
characteristics, testing the water quality of the effluent leaving the wetland system would help
give insight as to whether the salt tolerant plugs were in fact acting as bio-accumulators and
naturally treating the water. The entire area was also seeded with mixes specially formulated for
this site and referred to as either the Dutchman Wetland Mix (for the low-lying, flat areas within
the saturated zone), or the Swastika Upland Mix (for elevated areas above the saturation zone).
For seed mixes, refer to Appendix 5.
Black and narrow leaf willows (Salix nigra and Salix exigua, respectively) were also planted in
the wetted meadow. Narrow leaf willow stakes were harvested onsite and the black willow was
harvested from the waste water treatment plant in Santa Fe, NM. Black willow tends to have a
higher salt tolerance than the narrow leaf. Both willow varieties were planted along the
channelized flow and downstream where the water begins fanning out. Three animal exclosures
were built surrounding the poles furthest downstream to prevent grazing.
Standing water
Figure 9: Standing water and wetland vegetation (Isaacson 2013)

17
Another important component of wetland ecology is the presence of hydric soils, which by
definition is: “a soil that formed under conditions of saturation, flooding or ponding long enough
during the growing season to develop anaerobic conditions in the upper 10 inches of soil
(Laboratory, 1987).” According to USACE, not all areas containing hydric soils may be
considered a wetland; “only when a hydric soil supports hydrophytic vegetation and the area has
indicators of wetland hydrology may the soil be referred to as wetland soils (Laboratory, 1987).”
Wetland soils take decades to develop, therefore the timing of this project does not allow for the
formation of such soils. However, if monitoring and data collection show that this landscape is
saturated for seven months during each year, we can be fairly confident that this area could
develop into a wetland meeting all the criteria presented by the USACE.
To determine whether the behavior of this man-induced system mimics that of a true wetland, the
guidelines and methods set forth in the Army Corps of Engineers Wetland Delineation Manual
were followed. Vegetation and soil data information was used to help inform hydrologic
characteristics.
The objective of the reclamation efforts in this canyon was to not only improve water quality, but
to do so using a method that would create a wetland habitat. To assess the success of that goal,
several items were addressed. For instance, did the area of saturated soil behave like a wetland?
If so, what was the effectiveness of the wetland treatment in mitigating the water quality issues at
present?
Wetland Function:
In the past 25 years, society has come to understand and appreciate the ecological benefit and
economic value of wetlands. For example, federal wetland policy has recently shifted from
promoting wetland conversion to encouraging wetland protection and restoration (Ralph E.
Heimlich 1998). Wetlands improve and maintain water quality, offer habitat for fish and wildlife,
inhibit erosion, attenuate damage caused by flooding, and provide visually pleasing open spaces
and recreational opportunities. Wetlands are complex ecosystems that provide many ecological,
Exclosures Exclosures
Standing Water
Exclosures

18
biological, and hydrologic functions that benefit the overall health of the landscape and enhance
quality of life for many.
Ecological Functions:
Wetlands function as living filters by removing nutrients and sediments from surface and ground
waters thus maintaining, and at times, improving water quality (Ralph E. Heimlich 1998).
Wetlands retain or remove nutrients through uptake by plant life, adsorption into sediments,
deposition of organic matter and
chemical precipitation. The vegetation
and often flat topography associated
with wetland systems decreases the
velocity of surface waters causing the
deposition of sediments in turn,
limiting the siltation of streams, rivers,
and lakes. Sediment deposited by flood
events is often rich in nutrients and can
cause spikes in wetland productivity
and nutrient cycling.
In drier, more common upland
systems, flooding or significant periods
of inundation can be quite stressful for
ecosystems not used to such events. However, wetland inhabitants, especially vascular plants,
have adapted to deal with these types of stresses. Adaptations including: pressurized gas flow,
the creation of oxidized root zones, and anaerobic respiration, allow wetland plants to remain
productive in otherwise stressful conditions, making wetlands among the most productive
ecosystems in the world (Whittaker 1973). Primary producers support secondary producers that
exceed those of terrestrial ecosystems.

19
Biological Functions:
Wetlands are the most biologically productive ecosystems in temperate regions, rivalling tropical
rain forests (Ralph E. Heimlich 1998), and they provide food and habitat for 45 percent of the
nation’s wildlife (Lawler 2007). Wetland biological productivity stems from their ability to
recycle nutrients and energy. Wetlands are habitats for a diverse group of fish and wildlife; some
species spend their entire lives in wetlands, while others use them intermittently to mate, feed or
rear their young. Most freshwater fish depend on wetlands, however, both fresh and saltwater
species feed in wetlands or on food produced in wetlands. Wetlands also serve as nurseries for
fauna that use wetlands as safe havens to rear their young, and many species of commercial sport
fish use wetlands as spawning grounds. Amphibians and reptiles, which are particularly sensitive
to water quality issues, also depend on wetlands for habitat. Over one-third of all bird species in
North America depend on wetlands for migratory respites, breeding, feeding, and cover from
predation (Ralph E. Heimlich 1998).
Wetlands as Bird Habitats:
Wetlands provide exceptional
bird habitat. The value of a
wetland to a specific bird
species is affected by the
presence of surface water and
the duration and timing of
flooding. Some avian species
have adapted to wetlands to
such an extent that their
survival as individual species
depends on the availability of
certain types of wetlands within
their geographic range. While other species use wetlands only intermittently depending on their
life stage.
Figure 11: Migratory bird routes of North America (US Geological
Survey 1996)

20
Due to the variety of wetland types, bird adaptation to, and the use of, wetlands varies greatly
between species. Birds’ utilization of wetlands during breeding cycles ranges widely; birds
depend on wetlands for breeding, nesting, feeding and or shelter during the breeding period.
Birds that require functional access to wetlands or wetland products during their lifecycle are
considered wetland dependent; of the 1,900 bird species in North America, 138 are considered
wetland dependent (US Geological Survey 1996).
Hydrologic Functions:
Since wetlands are often found where the water table is close to the surface, the degree of
saturation can vary seasonally, especially in dry climates. Wetlands enhance soil accumulation
through sediment trapping and reduce erosion by damping wave action and slowing water
currents. Wetlands also act as sponges, temporarily storing flood waters and releasing them
slowly. This ephemeral loading of water decreases runoff velocity, reduces flood peaks and
distributes storm flows over longer time periods causing tributary and main channels to peak at
different times. However this is a constructed wetland and its water levels are not determined
by an associated creek, so its impact on adjacent stream hydrology is limited.
Wetlands act as natural flood conveyances channeling flood waters form upland areas into
receiving waters and attenuating extreme flood events. A strong correlation exists between the
size of flood peaks and basin storage. Surface water hydrologists found that basins with 30
percent or more areal coverage by lakes and wetlands have flood peaks that are 60 to 80 percent
lower than the peaks in basins with no lake or wetland acreage (US Geological Survey 1996).
However, not all wetlands are able to store floodwaters or modify storm runoff; the location and
storage capacity of the wetland controls how effective a wetland will be at flood attenuation. In
addition, wetlands in basin headwaters are often sources of runoff because they are commonly
groundwater discharge zones. For example, wetlands in Alaska that are underlain by permafrost
have little to no storage capacity, runoff is therefore rapid and flood peaks tend to be high (US
Geological Survey 1996).
Wetlands can also influence local and regional climate regimes. Wetlands tend to temper
seasonal temperature variations. During the summer, wetlands maintain lower temperatures
21
because evapotranspiration from the wetland converts latent heat and releases water vapor into
the atmosphere. Alternately, in the winter, the warmer water of the wetland prevents fast cooling
at night, preventing nearby upland plants from freezing. Wetlands may also alter local
atmospheric circulation and so affect moisture convection, cloud formation, thunderstorms, and
precipitation patterns (US Geological Survey 1996). When a wetland system or groups of
wetlands are drained, changes in local weather systems are not uncommon. Understanding the
source and movement of water through a wetland are vital for assessing wetland function and
predicting how changes in wetlands will affect the associated basin (Carter 1996).
For a more thorough discussion of wetlands including: national and local trends, classification
protocol, the hydrologic process as it pertains to wetlands, and soil and water chemistry, please
refer to Appendix 2: What is a Wetland?
Monitoring Methods:
Vegetation:
The new wetland area extent was mapped several times a year. Three transects were used for the
initial wetland delineation and an additional four transects were installed for future monitoring.
In total, seven transects were monitored at the end of each growing season, usually the end of
August.
A tape measure was stretched between the permanent markers at the end of each transect.
Permanent markers were located using re-bar posts with survey caps placed on top of them to
prevent any injury to wildlife. Each transect was also mapped using a GPS with sub-foot
accuracy. The approximate location of the boundary between each vegetation community (i.e.
upland/wet meadow, wet meadow/emergent marsh, emergent marsh/open water) was recorded
along the tape measure. This allowed for determination of changes in wetland characteristics
over the monitoring period.
Once the extent of each community was determined on each side of the wetland, a single sample
was collected in each community. Communities along a transect, represented multiple times,
22
were sampled each time they were encountered. Upland communities within the reclamation
were sampled as well as wetland communities as a measure of reclamation success. Data was
collected at the height of the growing season (generally August through early September).
The perimeter of the wetted area was recorded with a GPS multiple times throughout the study.
This data, once imported to a map, showed the change of wetland hydration through time and
any seasonal trends that have may occurred.
Water Quality:
The constructed wetland is approximately one acre in size, however, only water in the hydrated
zones was tested. Water samples collected for analysis by the lab utilized a near-surface grab
sample technique where possible. All samples were collected where surface water was present,
but not stagnant. Samples were placed in a cooler with ice (to maintain a temperature at or below
6 degrees Celsius), and transported to either the University of New Mexico or Energy Labs in
Billings, MT for analysis. Water samples were collected from the lower pond and two
downstream locations. The following analytes were measured: pH, EC, Ca Na, Mg, K, CO3,
HCO3, Cl
-, and SO4
2-.
Remote Sensing:
This area is currently being surveyed by aerial photography on a quarterly basis to gather data by
remote sensing method. This information can be used in conjunction with visual assessments
and transect measurements to measure changes in wetland vegetation through time. However,
these results were not available at time of publishing.
The AMLP currently has 2012 (pre-construction) imagery; 2013 and 2014 (post construction)
imagery has been gathered, but at this time remains unprocessed. The next step in analyzing this
data is to apply a new algorithm to test for wet soils; this has direct implications for ease of
measuring wetland extents and changes through time.
Remote sensing data is gathered using the World View 2 mapping technology with eight spectral
bands rather than the usual four. The use of eight bands allows for greater resolution regarding

23
vegetation than the color infrared used with four bands. The eight band spectrum utilizes both the
near infrared and red edge which provides greater insight into vegetation health and plant
discrimination through increased sensitivity to adsorption and reflection of chlorophyll.
The pixel resolution is 0.5 meters meaning it can pick up individual objects 1.5 meters wide; one
of the goals of this research was to see if individuals of a community could be identified to the
species level.
Reclamation Success Standards:
In addition to the generic standards for success outlined in a basic Nationwide Permit 27, this
reclamation included the following conditions based on the 2009 Wetland Delineation:
1. The mitigation and monitoring plan (Wetland Mitigation Plan for Reclamation and
Safeguarding of Abandoned Coal Mine Sites in Dillon Canyon, Colfax County, New
Mexico) submitted in the application will be implemented, including proposed
monitoring requirements (Ecosphere Environmental Services 2014).
2. Annual monitoring reports, to include information as described in the permit
application shall be due each year on December 31 for a period of not less than five
years. After Year 3, should the proposed restoration reach the success criteria in the
application, final approval from the USACE may be requested (Ecosphere 2014).
As outlined in the Wetland Mitigation Plan, “ … reconstructed wetlands and mitigation areas
in the Reclamation Project area will be deemed successful if quantitative vegetation
monitoring, photo documentation and post project walkthroughs indicate an establishing
riparian community, healthy jurisdictional wetland communities, and functioning stream
channels (WET 2010).” Therefore, success for this portion of the greater Swastika
Reclamation Project were evaluated on the degree of wetland species establishment. The
following goals to determine success for the wetland area were detailed in the Wetland
Mitigation Plan (WET 2010):
1. Success criteria shall be evaluated through annual monitoring of the reconstructed
channel and wet l and functions in the mitigation area for a period of 5 years
using methodology identified in the restoration and mitigation plan.

24
Table 3: Vegetation Success Criteria by Year (Ecosphere Environmental Services 2014)
In addition to the total vegetation cover standard, each wetland community (wet meadow and
emergent marsh) must meet several additional criteria:
1. Hydrophytic plant species—i.e., Obligate (OBL), Facultative Wet (FACW), or
Facultative (FAC)— must represent a minimum of 50 percent of the dominant
species present using the “50/20” rule.
2. Indicators of wetland hydrology must be present.
3. Native species must represent a minimum of 50 percent of the dominant species
present using the “50/20” rule.
4. A minimum of three plant species shall be classified as dominant in each
community using the “50/20” rule.
These vegetation goals and standards were applied for both emergent marsh and wet
meadow vegetation communities within the Dutchman wetland mitigation area (Ecosphere
Environmental Services 2014, WET 2010).”
Growing
Season
Total Vegetation Cover Goal or Standard
(Percent)
1 10
2 15
3 30
4 60
5 or
subsequent
Standard=80
25
Results:
Wetland Extents:
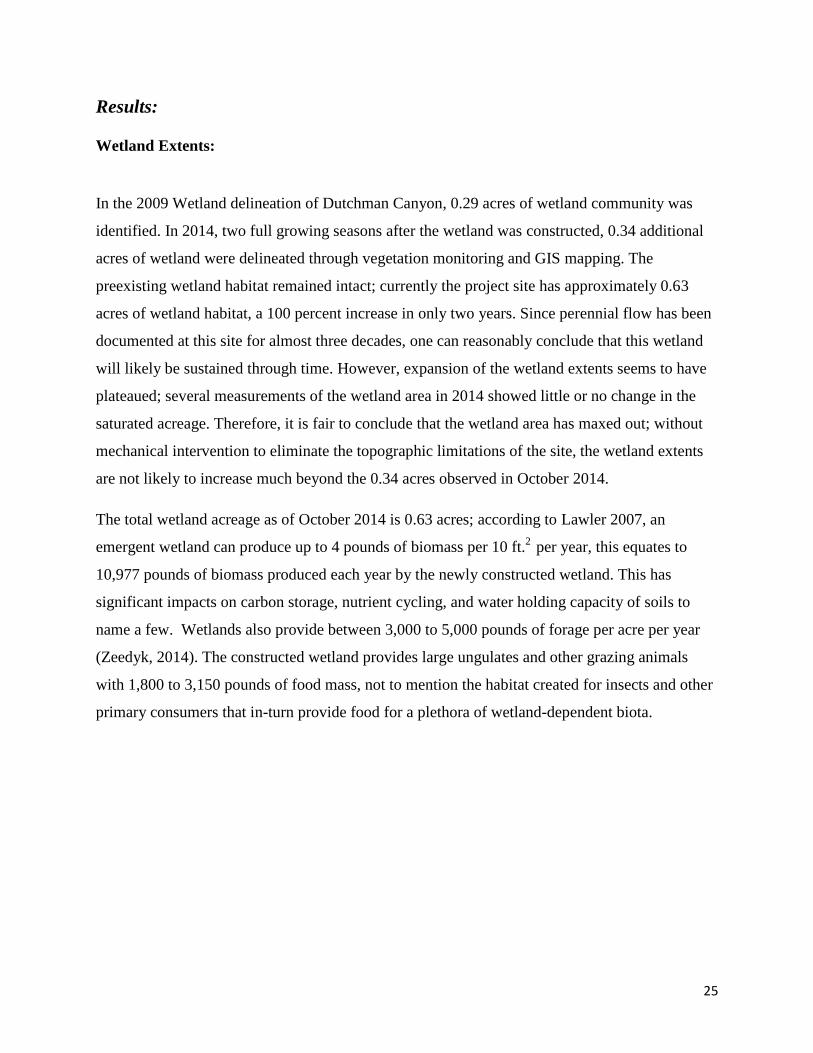
In the 2009 Wetland delineation of Dutchman Canyon, 0.29 acres of wetland community was
identified. In 2014, two full growing seasons after the wetland was constructed, 0.34 additional
acres of wetland were delineated through vegetation monitoring and GIS mapping. The
preexisting wetland habitat remained intact; currently the project site has approximately 0.63
acres of wetland habitat, a 100 percent increase in only two years. Since perennial flow has been
documented at this site for almost three decades, one can reasonably conclude that this wetland
will likely be sustained through time. However, expansion of the wetland extents seems to have
plateaued; several measurements of the wetland area in 2014 showed little or no change in the
saturated acreage. Therefore, it is fair to conclude that the wetland area has maxed out; without
mechanical intervention to eliminate the topographic limitations of the site, the wetland extents
are not likely to increase much beyond the 0.34 acres observed in October 2014.
The total wetland acreage as of October 2014 is 0.63 acres; according to Lawler 2007, an
emergent wetland can produce up to 4 pounds of biomass per 10 ft.2
per year, this equates to
10,977 pounds of biomass produced each year by the newly constructed wetland. This has
significant impacts on carbon storage, nutrient cycling, and water holding capacity of soils to
name a few. Wetlands also provide between 3,000 to 5,000 pounds of forage per acre per year
(Zeedyk, 2014). The constructed wetland provides large ungulates and other grazing animals
with 1,800 to 3,150 pounds of food mass, not to mention the habitat created for insects and other
primary consumers that in-turn provide food for a plethora of wetland-dependent biota.

26
Figure 12: Change in wetland extents through time (Isaacson 2014)
Vegetation:
Vegetation monitoring occurred at seven transects located just upstream of the reclamation area
and extended through the most downstream extent. The methods used for measuring vegetative
cover and species diversity are described in the monitoring section of this paper. In total, 45
species were identified in both the wetland and upland fringes of the reclamation. Of those, only
six are considered wetland obligate or facultative species (Table 4). Four communities were
identified based on vegetation cover and type: dry channel (disturbed), emergent marsh, wet
meadow and upland.
Dry channels are areas of the study site that exhibit frequent episodes of disturbance and
overland flow. These areas contain little vegetation and will not support wetland vegetation due

27
to lack of water and/or poor soil conditions. Dry channels occurred along the roadside and at
mine seeps where the water is alkaline and saline. Dry channels accounted for five percent of the
total 587 linear feet of delineation.
An area described as an emergent marsh is areas where the vegetation is rooted in saturates soils
for much of the growing season; soils in this community were flooded for most of the year. The
vegetation is usually dominated by species with an obligate (OBL) or facultative wetland
(FACW) wetland indicator status, meaning they can tolerate anaerobic soil conditions resulting
from inundation. Of the 11 wetland indicator species found, only three are considered OBL:
Schoenoplectus pungens (common three square), Schoenoplectus maritimus (cosmopolitan
bulrush), and Juncus articus (mountain rush). Four species in the Ducthman delineation were
considered FACW by the USACE: Puccinellia distans (weeping alkali grass), Polygonum
aviculare (prostrate knotweed), Agrostis gigantean (redtop), and Hordeum jubatum (foxtail
barley). Emergent marsh communities accounted for 36 percent of the total delineation.
Wet meadow communities were dominated by wetland vegetation and exhibited indicators of
wetland hydrology although, these areas are flooded only part of the year and are therefore
inundated for shorter periods than emergent marsh communities and tend to lack saturated
surface soils. Wet meadow and upland boundaries were hard to identify due to the abundance of
disturbed soils in Dutchman Canyon.
All communities identified as emergent marsh existing in the constructed wetland had a cover of
wetland vegetation of 80 percent or greater, with the exception of transect ZI1, which had a
cover of less than 10 percent. This may be a function of its proximity to the spillway as well as
the vegetative type. In this area, the contractors planted non-halophytic vegetation which may
have out-competed the more suitable vegetation, though ultimately dying off once the salinity
levels exceeded their tolerances.
The following classification, from the “Handbook of Wetland Vegetation Communities of New
Mexico” best describes the current vegetative community at the constructed wetland as
Threesquare Bulrush Alliance.

28
Figure 13: Map depicting wetland changes through time (Isaacson 2014)
Threesquare Bulrush Alliance:
NM Classification: Lowland Western Persistent Emergent Wetland, Semi permanently Flooded.
Distribution: Widespread in the Rocky Mountains and Southwest. In New Mexico it occurs in
every major basin of the state including watersheds of the Gila, Pecos, San Juan, Canadian and
Rio Grande.
This emergent herbaceous wetland is characterized by the dominance of threesquare bulrush in
association with a wide variety of wetland graminoids to form a canopy of 90 percent total cover.
Within the wetland extents, current canopy coverage exceeds 80 percent total cover in most areas
of saturated soil conditions. However, it will take several years for this wetland to fully develop,
29
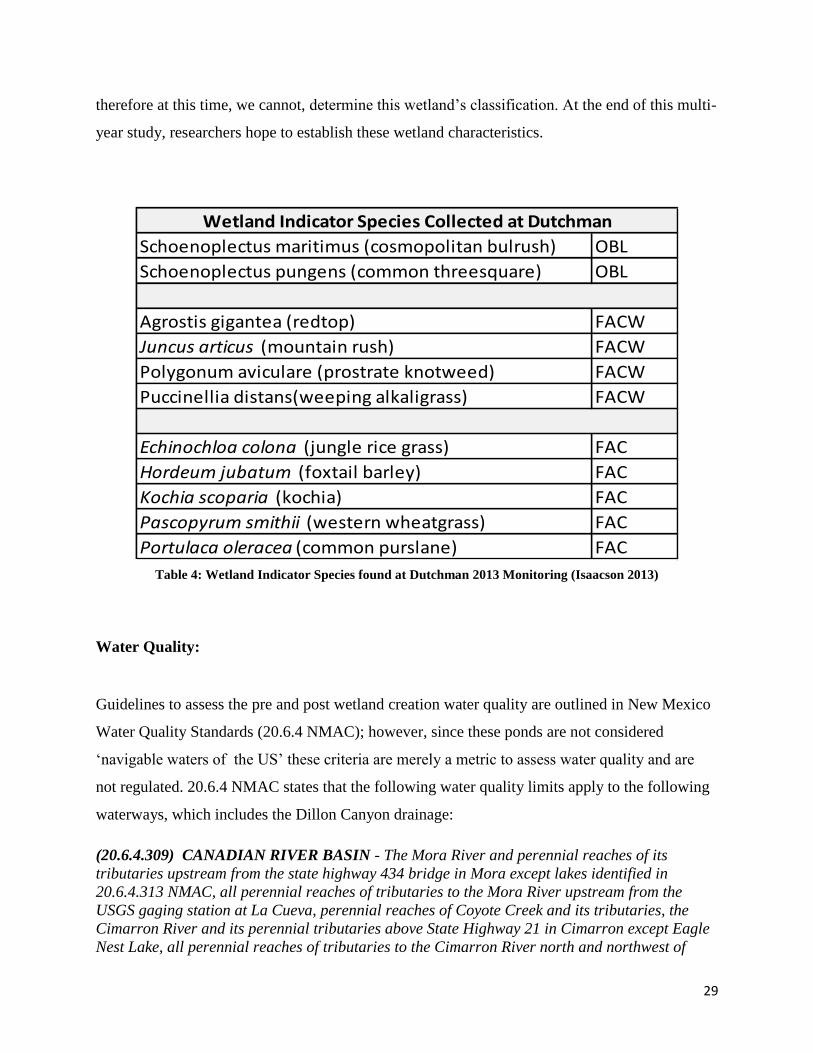
therefore at this time, we cannot, determine this wetland’s classification. At the end of this multi-
year study, researchers hope to establish these wetland characteristics.
Schoenoplectus maritimus (cosmopolitan bulrush) OBL
Schoenoplectus pungens (common threesquare) OBL
Agrostis gigantea (redtop) FACW
Juncus articus (mountain rush) FACW
Polygonum aviculare (prostrate knotweed) FACW
Puccinellia distans(weeping alkaligrass) FACW
Echinochloa colona (jungle rice grass) FAC
Hordeum jubatum (foxtail barley) FAC
Kochia scoparia (kochia) FAC
Pascopyrum smithii (western wheatgrass) FAC
Portulaca oleracea (common purslane) FAC
Wetland Indicator Species Collected at Dutchman
Table 4: Wetland Indicator Species found at Dutchman 2013 Monitoring (Isaacson 2013)
Water Quality:
Guidelines to assess the pre and post wetland creation water quality are outlined in New Mexico
Water Quality Standards (20.6.4 NMAC); however, since these ponds are not considered
‘navigable waters of the US’ these criteria are merely a metric to assess water quality and are
not regulated. 20.6.4 NMAC states that the following water quality limits apply to the following
waterways, which includes the Dillon Canyon drainage:
(20.6.4.309) CANADIAN RIVER BASIN - The Mora River and perennial reaches of its
tributaries upstream from the state highway 434 bridge in Mora except lakes identified in
20.6.4.313 NMAC, all perennial reaches of tributaries to the Mora River upstream from the
USGS gaging station at La Cueva, perennial reaches of Coyote Creek and its tributaries, the
Cimarron River and its perennial tributaries above State Highway 21 in Cimarron except Eagle
Nest Lake, all perennial reaches of tributaries to the Cimarron River north and northwest of
30
Highway 64 except north and south Shuree Ponds, perennial reaches of Rayado Creek and its
tributaries above Miami Lake diversion, Ocate Creek and perennial reaches of its tributaries
upstream of Ocate, perennial reaches of the Vermejo River upstream from Rail Canyon and all
other perennial reaches of tributaries to the Canadian River northwest and north of U.S.
Highway 64 in Colfax County unless included in other segments.
Limits for pH for Primary Contact are in the range of 6.6 to 9.0;
Limits for Marginal Warm-water Aquatic Life are Temperature: 32.2⁰ C (90⁰
F)(maximum) and pH: 6.6 to 9.0;
Limits for TDS is <3,500mg/l for flows less than 10 cfs;
Limits for electrical conductivity (EC) or specific conductance 500 μS/cm or less; and
Standard thresholds or limits for turbidity are not defined in 20.6.4 NMAC.
In 2009, prior to initiation of reclamation, The westernmost pond (the upper pond) had a pH of
10.24 and an EC of 3777 μs/cm at 23.6 °C and the easternmost pond (lower pond) tested for pH
of 10.04 and an EC of 4184 μs/c at 23.5 °C (cation and anion concentrations were not measured).
At the time of sampling, the Dutchman ponds were well above the thresholds of the Surface
Water Quality Standards.
Water in the ponds prior to the construction of the spillway was tested. These tests were basic
water tests testing: pH, temperature, EC and turbidity. More recently, unfiltered surface water
samples were taken from four locations throughout the project site: from the upper-most adit
(believed to be the largest contributor of volume into the ponds), the lower pond, a pool upstream
from a sediment long approximately 100 ft. from the spillway, and the most downstream extent.
The water samples are being tested for: pH, EC, Ca, Mg, Na, K, CO3, HCO3, Cl, and SO4 . The
sample locations are shown on Map 3 in Appendix 4.
Although monitoring water quality is not a requirement of the Nationwide 27 Permit issued by
the USACE, it was tested several times over an 18 month period to help evaluate the impacts of a
living system on water quality of the mine effluent- water testing proved to be inconclusive:
Water temperature never exceeded 90 °F, and therefore met the State’s criteria on all sampling
dates between 5/21/13 and 10/7/14. However, EC measurements exceeded the State standard on
all occasions hitting above 3000 μs/cm often. pH fell below the State standard of 9.0 on all

31
occasions except on testing date 05/21/2013; transect ZI-4 had a pH value of 9.2. All samples
indicated that this water was extremely alkaline. Bicarbonate as HCO3 more often than not,
exceeded 2000 mg/l. The alkalinity of this water indicates that the water body has a robust
capacity to buffer against larger shifts in pH, however, this contradicts the comparison of the
2009 results to the latest 2014 results. This suggests that there was an error in the reports from
2009.
*
*
32
0
200
400
600
800
1000
1200
1986 May-13 Jul-13 Oct-14Sod
ium
Co
nce
ntr
atio
n (
pp
m)
Month/Year
Sodium Concentrations of Lower Pond Through Time
0
2
4
6
8
10
12
1986 May-13 Jul-13 Oct-14
Co
nce
ntr
atio
n m
g/L
Month/Year
Ca, Mg, K Concentrations of Lower Pond Through Time
Calcium
Magnesium
Potassium
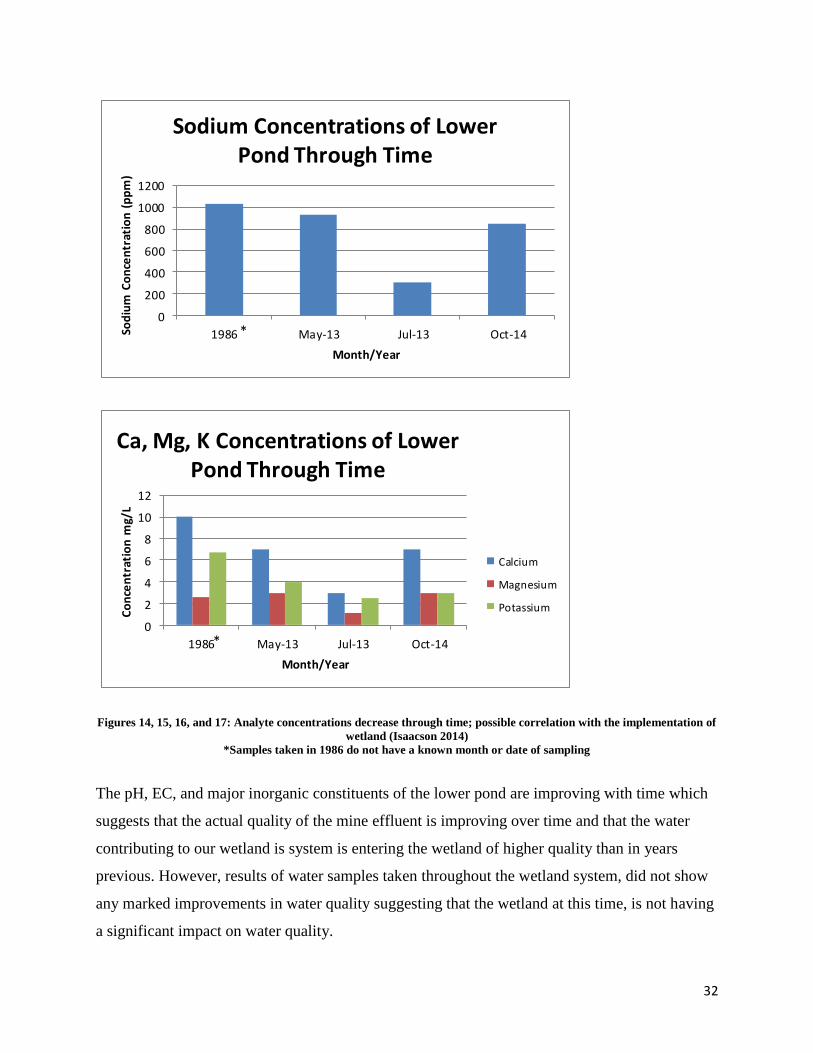
Figures 14, 15, 16, and 17: Analyte concentrations decrease through time; possible correlation with the implementation of
wetland (Isaacson 2014)
*Samples taken in 1986 do not have a known month or date of sampling
The pH, EC, and major inorganic constituents of the lower pond are improving with time which
suggests that the actual quality of the mine effluent is improving over time and that the water
contributing to our wetland is system is entering the wetland of higher quality than in years
previous. However, results of water samples taken throughout the wetland system, did not show
any marked improvements in water quality suggesting that the wetland at this time, is not having
a significant impact on water quality.
*
*

33
Conclusion:
After two growing seasons, the Dutchman Canyon Constructed Wetland is meeting the
requirements of the Nationwide 27 permit. Results from vegetation monitoring and observed soil
conditions (saturated soil at depth/ ponding of water at surface greater than 7 months out of the
year) prove this wetland has seen a marked increase of wetland vegetation ( percent cover exceed
the year two threshold of 20 percent) and had positive impacts on the wetland vegetation, no
adverse impacts on the system’s hydrology. This project has increased the emergent marsh zone
of wetland vegetation by almost 100 percent; wetland vegetation now spans over 0.63 acres.
34
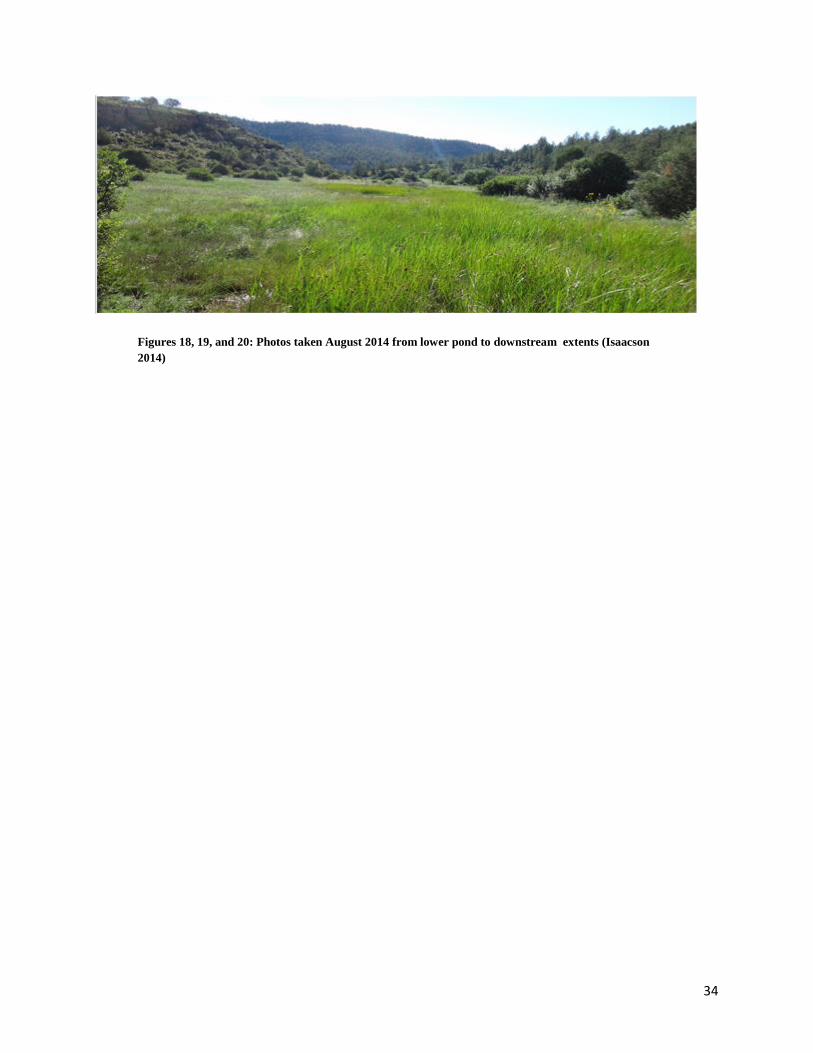
Figures 18, 19, and 20: Photos taken August 2014 from lower pond to downstream extents (Isaacson
2014)
35
Works Cited
Apps, Tim. What do you water results mean? PhD Thesis, Gembrook: Apps Laboratories, 2004.
Bruce Rieman, Jim Clayton. "Wildfire and Native Fish: Issues of Forest Health and Conservation of
Sensitive Species." Fisheries, 1997: 6-9.
Burned Area Emergency Response Team . Whitewater Baldy Complex Executive Summary. Silver City:
US Forest Service, 2012.
Carter, Virginia. Techincal Aspects of Wetlands. Paper, Washington, DC: United States Geological
Survey, 1996.
Certini, Giacomo. "Effects of fire on properties of forest soils: a review." Oecologia, 2005: 1-10.
Cherry, Julia A. "Ecology of Wetland Ecosystems: Water, Substrate, and Life." Nature Education
Knowledge, 2012: 10-16.
Cowardin, Lewis M. Classification of Wetlands and Deepwater Habitats of the U.S. Washington, D.C.:
DIANE Publishing, 1971.
D. Kendell Brown, Athony A. Echelle, David L. Propst, James E. Brooks, and William L. Fisher.
"Carastrophic Wildfire and Number of Populations as Factors Influencing Risk of Extinction for
Gila Trout (Orcorhynchus Gilae)." Western North American Naturalist, 2001: 139-148.
Dahl, T.E. Wetlands- Losses in the United States, 1780's-1980's. 5 year, Washington, DC: US Fish and
Wildlife Service Report to Congress, 1990.
EcologyDictionary.org . 2008. http://www.ecologydictionary.org/WETLANDS (accessed 12 04, 2013).
Ecosphere Environmental Services. Swastika/Dillon Canyon Reclamation Project: Site Characterization
Field Summary Colfax County, New Mexico. Durango: Ecosphere Environmental Services, 2014.
Emmanuel j. Gabet, Paul Sternberg. "The effects of vegetatuve ash on infiltration capacity, sediment
transport, and the gerneration of progressively bulked debris flows." Geomorphology, 2008: 666-
673.
Environmental Protection Agency. "Types of Wetlands." EPA. September 2001. http://water.epa.gov
(accessed 12 04, 2013).
Fish and Wildlife Service. "BSI Wetland Survey." 1984.
Habitat Management Inc. and Water and Earth Technologies. Environmental Assessment for Reclamation
and Safeguarding of Abandoned Coal Mine Sites in Dillon Canyon, Colfax County, New Mexico.
Santa Fe: NM Abandoned Mine Land Program, 2010.
Hugh G. Smith, Gary J. Sheridan, Patrick N.J. Lane, Petter Nyman, Shane Haydon. "Wildfire effects on
water quality in forest catchments: A review with implications for water supply." Journal of
Hydrology, 2011: 170-192.
36
Kercher, Suzanne & Zedler, Joy B. "Wetland Resources: Status, Trends, Ecosystem Services, and
Restorability." Annual Review of Environmental Resources, 2005: 39-74.
Laboratory, Environmental. Wetlands Delineation Manual. Washington DC: US Army Corps of
Engineers, 1987.
Lee, WillisT. Geologic Atlas of the United States: Raton, Brilliant- Koehler Folio. Washington DC: US
Geological Survey, 1922.
Minshall, G. Wayne. "Responses of stream benthic macroinvertebrates to fire." Forest Ecology and
Management, 2003: 155-161.
New Mexico Abandoned Mine Land Program. Envrionmental Assessment Raton Coal Field AML
Projects . Santa Fe: EMNRD, 1986.
New Mexico Bureau of Geology and Mineral Resources. "Geologic Map of New Mexico, 1:500,000."
New Mexico Bureau of Geology and Mineral Resources, 2003.
Nicks, A.D., L.J. Lane, and G.A. Gander. Weather generator. West Lafayette: USDA, 1995.
Oakes, Dorothy A. & Zamora, Yvonne R. The Coal Camps of Vermejo Park Ranch, Colfax County,New
Mexico Volume 1. Santa Fe, NM: Office of Archaeological Studies, 2010.
Peter A. Bisson, Bruce E. Rieman, Charlie Luce, Paul F. Hessburg, Danny C. Lee, Jeffrey L. Kershner,
Gordon H. Reeves, Robert E. Gresswell. "Fire and aquatic ecosystems of the western USA:
current knowledge and key questions." Forest Ecology and Management, 2003: 213-229.
Ponnamperuma, F.N. "The Chemistry of Submerged Soils." In Advances in Agronomy, by The
International Rice Research Institute, 29-94. Los Banos: Academic Press, 1972.
R. Spotts, P.E.2, M. Brennan, P.E., R. Wade, P.E., K.J. Malers, P.E.*, K.E. Carlson & Z. Isaacson.
Geomorphic Reclamation of Abandoned Coal Mines on Vermejo Park Ranch near Raton, New
Mexico. Fort Collins, CO: Water and Earth Technologies, Inc, 2013.
Ralph E. Heimlich, Keith De. Weibe, Roger Classes, Dwight Gadsby, and Robert M. House. Wetlands
and Agriculture: Private Interests and Public Benefits. Agriculture Economic Report,
Washington, DC: US Department of Agriculture, 1998.
Solano, Denise. Environmental Assessment for the Raton Coal Field AML Projects. EA, Santa Fe:
EMNRD- NM AML Program, 1986.
Stevan R.Earl, Dean W. Blinn. "Effects of wildfire ash on water chemistry and biota in South-Western
USA streams." Freshwater Biology, 2003: 1015-1030.
The Water and Earth Team. Vermejo Park Ranch Historic Mine Reclamation Project Wetland
Delineation Report. Environment Assessment, Santa Fe: New Mexico Abandoned Mine Land
Program, 2009.
37
US Army Corps of Engineers. "Wetland Delineation Manual." US Army Corps of Engineers. 11 16, 1995.
http://www.wetlands.com/coe/87mano3b.htm (accessed 12 03, 2013).
US Department of the Interior. Report to Congress: Wetland Status and Trends. Congressional Report,
Washington, D.C.: US Deptartment of the Interior, 2009.
US Fish and Wildlife Service . Regional wetlands concept plan-New Mexico Wetlands: Albuquerque, N.
Mex. US Fish and Wildlife Service, 1990.
US Geological Survey. National Water Summary on Wetland Resources. United States Geological Survey
Water Supply Paper 2425, US Geological Survey, 1996.
USDA. Websoil Survey. 2011. http://websoilsurvey.nrcs.usda.gov/app/WebSoilSurvey.aspx (accessed 3
7, 2013).
Western Regional Climate Center. "Western US Climate Series." http://www.wrcc.dri.edu. n.d.
Wetzel, R.G. Limnology. Philidelphia: W.B. Sanders Co, 1975.
Whittaker, R.H. & Likens, G.E. "Carbon in Biota." In Carbon in the Biosphere, by G.M. Woodwell and
E.R. Peacan, 281-302. Springfield: National Technical Information Service, 1973.
Yuhas, Roberta H. Loss of Wetlands in the Southwestern United States. Annual Report, Washington DC:
US Geological Survey, 1996.
Zeedyk, William. Quivira Coalition Conference, Albuquerque, 2014.
38
Appendix 1: Impacts of a September 2014 Flood Event
In September of 2014, the Dutchman Canyon wetland experienced a storm event of unknown
size; however, this event was large enough to create alluvial fans along the northern border of the
wetland (Figure 20 ‘sediment deposits’). These sediment flows originated in the foothills
flanking the wetland; fine sediment is now confining the wetland expansion to the south and to
the east.
Prior to this event, the wetland had established a 0.34 acre area of emergent marsh vegetation.
With the sudden deposition of sediment the wetland vegetation has been disturbed- to what
degree is unknown. The 2014 monitoring occurred before this event. During a recent
walkthrough however, the areas of new deposition were mapped and will be monitored over
time. If the wetland vegetation appears to be incapable of rebounding from this event, the AML
Program will look into mechanical options for mitigation. This may include, but is not limited to:
blading, berming, filling, and possibly excavating to increase slope, remove sediment, and re-
contour the hydrated zone to maximize wetland potential.
In addition to the sedimentation of the northern flank, the floodwaters carried a large load of
sediment to the southeastern end causing material to berm and slow the movement of water. This
caused a new pond to form (Figure 20 ‘new pond formation’). The pond is adjacent to a breached
berm; it is believed that conditions of the flood caused the breach due to overtopping and
subsequent erosion, however, the breach has since collapsed on itself, and has arrested the flow
of water.
The AML Program will continue to monitor this site. As a proactive measure, they have
contacted an engineering firm to develop two possible design scenarios for mitigation at this site.
If monitoring reveals unfavorable results, such as failing to meet year three vegetation standards,
the AML Program will implement the plans they have solicited.

39
Figure 21: Map showing areas of disturbance caused by flooding (Isaacson 2014)

40
Figure 22, 23, and 24: Photos of post flood damage (Isaacson 2014)
41
Appendix 2: Location Information
Climate:
The climate of the project area is described as semiarid. Precipitation mostly takes place during
the monsoon season which occurs throughout the months of July and August. Winters are
usually dry, but there can be heavy snow accumulations at higher elevations within the
watershed. The average annual precipitation is 15 to 16 inches, with up to 22 inches in the high
country (Western Regional Climate Center 2010). The mean annual maximum temperature
ranges from 55 to 68 ° F with variation caused by elevation changes, slope exposure, and pattern
of air drainage. This area of northern New Mexico has an annual average of 273 sunny days
including 134 that are frost-free (Water and Earth Team 2009).
Geology:
The Raton Formation (Paleocene and Upper Cretaceous Periods) is the dominant geologic strata
of the project area. The formation is located in the eastern Raton Basin and is composed of distal
sandstones, mudstones, and thin disconnected coal beds (New Mexico Bureau of Geology and
Mineral Resources 2003). Geological materials found in this area are mostly sedimentary formed
by residual deposits of a sea that once covered the landscape. Pierre Shale overlays the Niobrara
formation and together these marine formations constitute the lower elevations of Dillon Canyon
(Lee 1922). While the Niobrara is mostly comprised of lesser valued chalk, limestone, and shale,
the overlying Pierre Shale is prized for its oil and natural gas production. At the intersection of
these three formations, strata of the Vermejo Formation and Trinidad Sandstone are exposed
(New Mexico Bureau of Geology and Mineral Resources 2003).
Beds of high-grade bituminous coal and friable sandstone occur in horizons of the Vermejo
Formation. Coal beds can be 15’thick however, most of the formation consists of carbonaceous
shale. The quality of the coal varies throughout the coal field but is generally excellent, with no
42
significant faulting (Lee, 1922). Other mineral resources found in the region include graphite,
clay, building stone, and oil and gas.
Soils:
Data from the Natural Resource Conservation Service website shows that soils are indicative of
both the Deacon-La Brier- Manzano (DR) series and the Midnight-Rombo-Rock outcrop
complex (Mn) series. DR soil mapping units are generally level to minimally sloped (0-9
percent), are alluvial in nature, and are associated with canyon bottoms. These soils are derived
from igneous and sedimentary rock (USDA 2011).
The Mn soils have formed on moderately steep to very steep mountain slopes (25-65 percent)
and tend to be located on canyon side slopes and ridges of the project area from elevations of
6,500-9,000 ft. Rombo cobbly silty clay loam has the profile representative of the series; runoff
is very rapid and erosion from water is significant, while soil removal by wind is considered only
moderate (New Mexico Abandoned Mine Land Program 1986). Both components of this series
are formed from alluvium and colluvium derived from sandstone and shale (USDA 2011).
Rock outcrops in the area consist of sandstone and shale.
Hydrology:
The project area consists of steep slopes, relatively shallow soils, and substantial areas of
bedrock. In Dutchman Canyon where the Pierre Shale Formation is fairly shallow, the formation
acts as an aquitard forcing water to flow horizontally through the more permeable Trinidad
Sandstone. During a geotechnical investigation conducted in 2009, groundwater was
encountered at depths of eight to10 feet (The Water and Earth Team, 2009).
Groundwater in Dutchman Canyon is also likely fed by groundwater from the bedrock above and
behind canyon walls. While ground water elevations in this canyon have not been mapped,
perennial flow emanating from the collapsed adits further backs this hypothesis. The presence of
seeps at the mine portals indicates that the mines are flooded and are acting as collectors for
groundwater percolating through the overlying bedrock (Habitat Management Inc. and Water

43
and Earth Technologies, 2010). Discharge from the seeps is currently contained in two small
ponds. Water that leaves the ponds’ catchment system either flows into the adjacent stream or
soaks into highly permeable alluvial deposits.
Plant Community:
Prior to the installation of evaporation ponds at Dutchman, the area was lacking in emergent
marsh communities of any significant size. The straightened stream on the opposite side of the
road and the patches of hydrated soil from mine effluent were the only wetland areas near the
Dutchman Mine site, however, with the installation of the ponds in 1987, wetland acreage
increased significantly. The 2009 EA describes the wetland communities of the 1980’s as well as
a new acre-sized wetland related to the ponds.
Figure 25: Emergent Marsh coverage after installation of ponds (Isaacson, 2014)
Further east from the ponds and wetland down valley, the plant community transitions from
emergent marsh to a mesic grassland dominated by blue grama (Bouteloua gracilis), western
wheat grass (Pascopyrum smithii), sideoats grama (Bouteloua curtipendula), and galleta

44
(Pleuraphis jamesii). In areas that have been disturbed, weedy annual forbs are also dominant
(The Water and Earth Team 2009).
Wildlife:
Due to the assortment of habitat types found on the Vermejo Park Ranch, wildlife varies
dramatically. Common big game species include: elk (Cervus elaphus nelson), deer (Odocoileus
heminus), bear (Ursus americanus) and mountain lion (Felix concolor). Elk and deer populations
are abundant in this area. The Raton Basin and Upper Canadian River regions produce the largest
population of trophy elk and deer in New Mexico (New Mexico Abandoned Mine Land Program
1986). Elk, bear, buffalo (reintroduced), and mountain lion are the primary objectives of hunters
traveling to the Ranch for trophy animals. Other mammals found on the Ranch include: bobcat
(Lynx rufus), coyote (canis latrans), raccoon (Procyon lotor), and beaver (Castor canadensis). A
wide variety of small rodents and weasels also inhabit the Ranch.
The Raton Basin is home to the largest population of wild turkey in the State; hunters pay
substantially to hunt wild turkey on the Ranch. Several non-migratory and migratory bird species
live on and around the Ranch or pass through it during their migration. Birds protected under the
Migratory Bird Treaty Act (MBTA) found on the Ranch consist primarily of raptors and
songbirds. Raptors that nest on the Ranch include: Cooper’s hawk (Accipiter cooperii), sharp
shinned hawk (Accipiter striatus), golden eagle (Aquila chrysaetos), red-tailed hawk (Buteo
jamaicensis), American kestrel (Falco sparverius), and great horned owl (Bubo virginianus).
However, Dutchman Canyon lacks the tall trees and high cliffs that are vital for nesting grounds
of many of these species (Habitat Management Inc. and Water and Earth Technologies 2010).
A diverse population of songbirds and similar species are associated with the lower elevations of
Dutchman Canyon where the ponds and wetland are located. The majority of species occupies
the coniferous forests from early spring through fall, and migrates south to winter. A few,
however, reside in the canyon fulltime, these include: woodpeckers, jays, chickadees, nuthatches,
and finches. The Ranch is also home to birds listed under the Birds of Conservation Concern
(BCC) by the US Fish and Wildlife Service (USFWS) for region 16, the Southern
Rockies/Colorado Plateau (BCR 16); these include: golden eagle (Aquila chrysaetos), Lewis’
45
woodpecker (Melanerpes lewis), pinyon jay (Gymnorhinus cyanocephalus), Virginia’s warbler
(Vermivora virginiae), black-throated gray warbler (Dendroica nigrescens) and Grace’s warbler
(Dendroica dominica) (Habitat Management Inc. and Water and Earth Technologies 2010).
There are several fish species found within the waters of the Ranch, including, the endangered
Brook stickleback (Clueae inconstans). Other fish species include members of the Salmonidae
family, specifically Cutthroat and Rainbow trout are present in the watershed. These fish are
sought after game fish and attract fishermen from all over the Southwest. Although these fish
species are found within the Vermejo River system, they are not found in Dutchman Canyon or
in close proximity to the project area.
The New Mexico Natural Heritage Program and USFWS list a total of two invertebrate, four
fish, 11 bird and three mammal threatened and endangered species for Colfax County, NM;
however most of these are not likely to be found in or around Dutchman Canyon or wetland
areas (Habitat Management Inc. and Water and Earth Technologies 2010).
Mining History:
Mining in the Colfax County began in 1866 and primarily focused on gold. However, by 1881,
coal had become the principal subject of mining activities in the region and in 1909, Colfax
County produced 74.8 percent of all coal mined in New Mexico (Oakes, 2010). The Swastika
Mine, the mine complex that included the Dutchman Mine was operated by the St. Louis, Rocky
Mountain, and Pacific Coal Company. The mine employed 128 men and produced over 19,600
tons of coal (New Mexico Abandoned Mine Land Program 1986).
Coal mining operations were carried out by constructing a horizontal (adit) mine with its
entrance at the valley bottom. The adits then connected to the inner workings that spread
throughout the formation in multiple levels depending on the coal seam configuration. In
general, the mines in Vermejo produced little water and therefore had water systems installed in
them for dust abatement and washing of the ore (Oakes 2010).
The Dutchman Mine however, is believed to have contained water and additional piping
infrastructure was needed to dewater the inner workings. The water was piped across the small

46
valley (where the present day wetland is located) and allowed to drain to the artificially
straightened stream on the opposite side of the valley.
47
Appendix 3: What is a Wetland?
What is a Wetland?
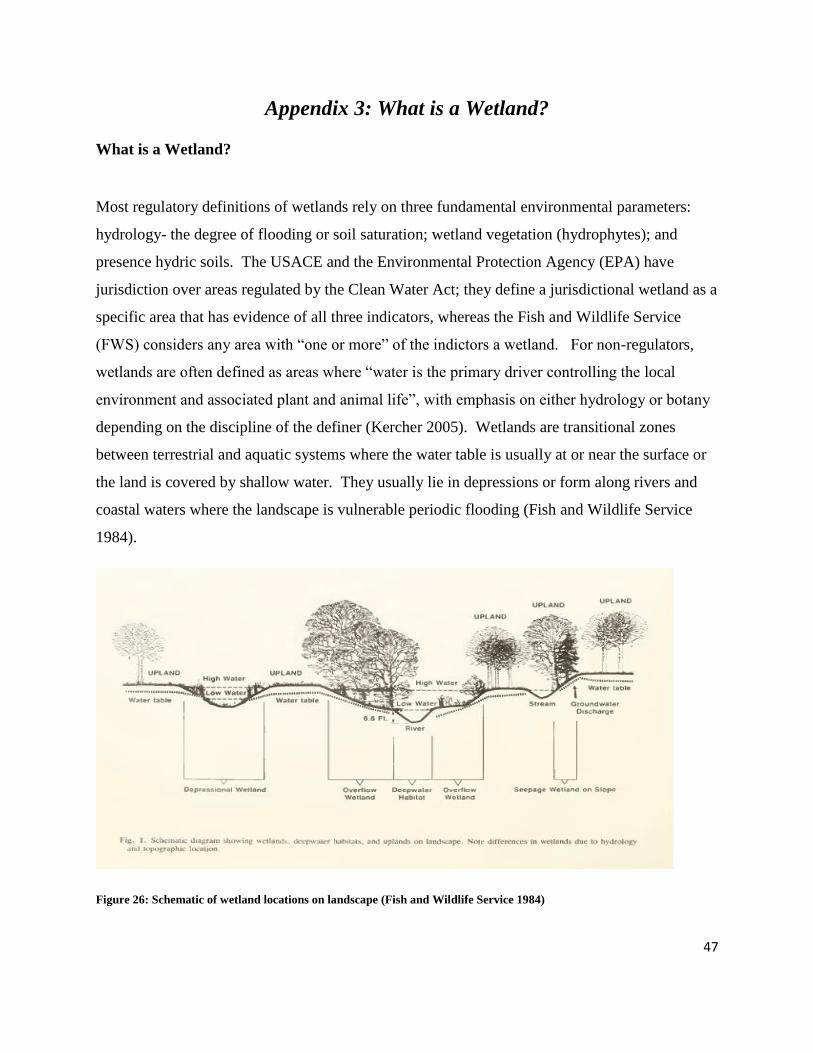
Most regulatory definitions of wetlands rely on three fundamental environmental parameters:
hydrology- the degree of flooding or soil saturation; wetland vegetation (hydrophytes); and
presence hydric soils. The USACE and the Environmental Protection Agency (EPA) have
jurisdiction over areas regulated by the Clean Water Act; they define a jurisdictional wetland as a
specific area that has evidence of all three indicators, whereas the Fish and Wildlife Service
(FWS) considers any area with “one or more” of the indictors a wetland. For non-regulators,
wetlands are often defined as areas where “water is the primary driver controlling the local
environment and associated plant and animal life”, with emphasis on either hydrology or botany
depending on the discipline of the definer (Kercher 2005). Wetlands are transitional zones
between terrestrial and aquatic systems where the water table is usually at or near the surface or
the land is covered by shallow water. They usually lie in depressions or form along rivers and
coastal waters where the landscape is vulnerable periodic flooding (Fish and Wildlife Service
1984).
Figure 26: Schematic of wetland locations on landscape (Fish and Wildlife Service 1984)

48
Wetland Trends:
Based on historical evidence and anecdotal data, it is estimated that about half of the world’s
wetlands have been lost over the past two centuries. Much of the loss occurred in northern
countries during the first half of the twentieth century, however, increasing need for agricultural
lands and housing in tropical and subtropical regions has accelerated wetland loss since the
1950’s (Kercher 2005). Wetlands are lost mainly due to draining for agricultural purposes,
reduced inflows and siltation, and encroachment. It has been estimated that 26 percent of the
global wetland area have been dewatered for intensive agricultural purposes since 1985. Land
reclaimed for agricultural use has been the primary cause of wetland destruction. Today,
wetlands cover less than nine percent of global land area.
It is estimated that of the available wetland area in North America, 27 percent has been replaced
by irrigable acreage or dried as a result of diverting water from wetlands to commercial
farmland. In the 48 contiguous states of the United States, 53 percent of wetlands were lost from
1780-1985 however, the annual rate of loss is currently 80 percent lower than the previous 200
years. The lower 48 states contained an estimated 103.3 million acres of wetlands in the mid-
1980’s compared to an estimated 220 million acres found over the same region in 1600’s (US
Department of the Interior 2009). In New Mexico alone, it is assumed that nearly 36 percent of
orginal wetland acreage has been lost (Yuhas 1996). In the United States, freshwater forested
wetlands have experienced the greatest loss in area, and total wetland acreage is declining
despite the wetland policy reform efforts of several administrations (Kercher 2005).
49
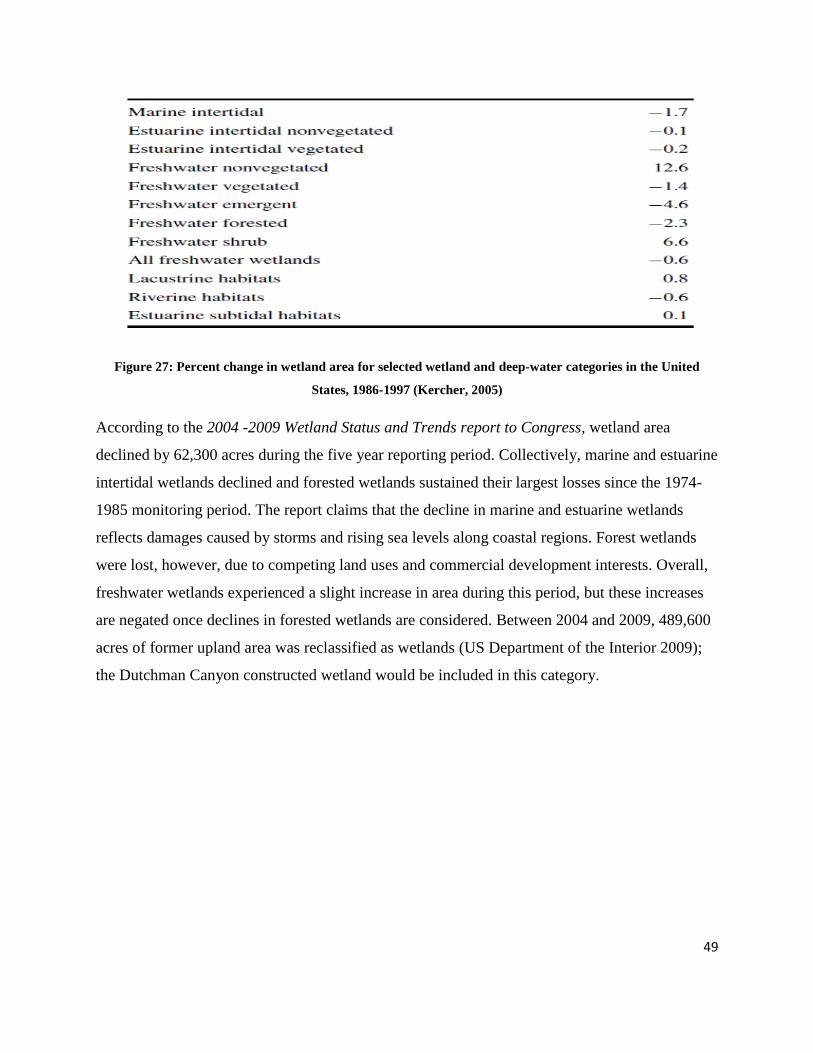
Figure 27: Percent change in wetland area for selected wetland and deep-water categories in the United
States, 1986-1997 (Kercher, 2005)
According to the 2004 -2009 Wetland Status and Trends report to Congress, wetland area
declined by 62,300 acres during the five year reporting period. Collectively, marine and estuarine
intertidal wetlands declined and forested wetlands sustained their largest losses since the 1974-
1985 monitoring period. The report claims that the decline in marine and estuarine wetlands
reflects damages caused by storms and rising sea levels along coastal regions. Forest wetlands
were lost, however, due to competing land uses and commercial development interests. Overall,
freshwater wetlands experienced a slight increase in area during this period, but these increases
are negated once declines in forested wetlands are considered. Between 2004 and 2009, 489,600
acres of former upland area was reclassified as wetlands (US Department of the Interior 2009);
the Dutchman Canyon constructed wetland would be included in this category.
50
The Wetland Status and Trends report cites that aggregate effects of reductions in freshwater
wetland systems have had fracturing effects on hydrologic and ecosystem connectivity. In certain
regions, profound drops in wetland extent have resulted “in habitat loss, fragmentation and
limited opportunities for reestablishment and watershed rehabilitation (US Department of the
Interior 2009).”
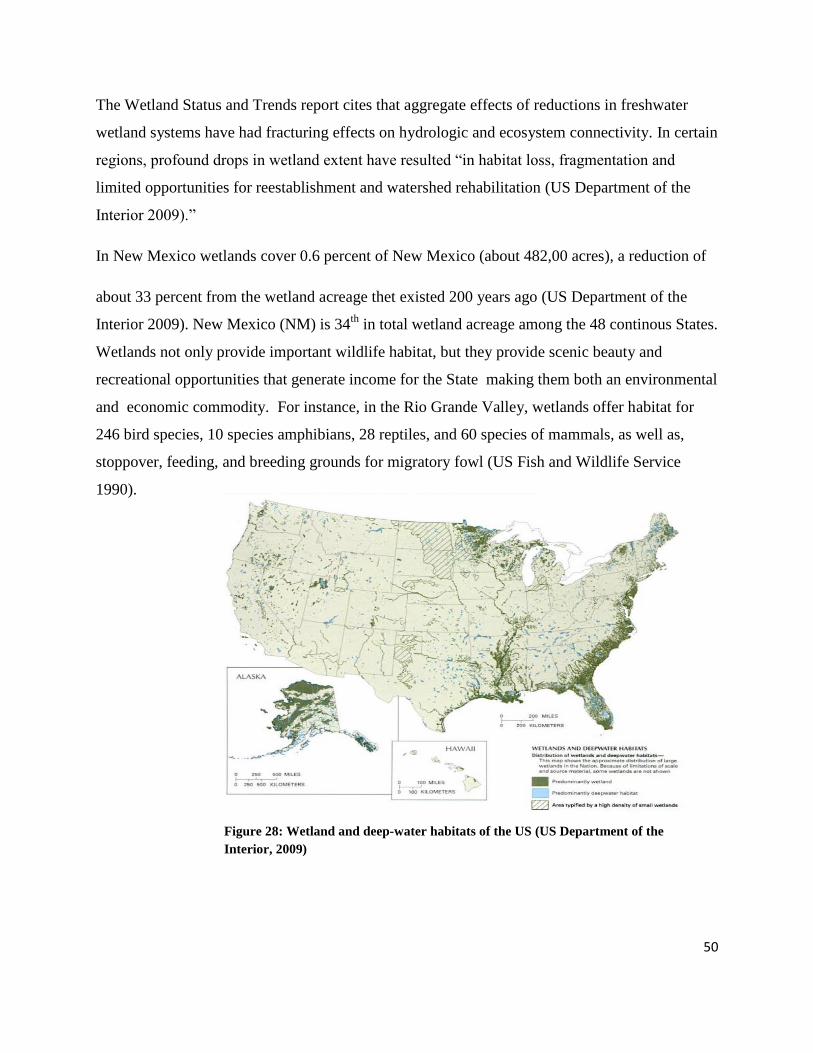
In New Mexico wetlands cover 0.6 percent of New Mexico (about 482,00 acres), a reduction of
about 33 percent from the wetland acreage thet existed 200 years ago (US Department of the
Interior 2009). New Mexico (NM) is 34th
in total wetland acreage among the 48 continous States.
Wetlands not only provide important wildlife habitat, but they provide scenic beauty and
recreational opportunities that generate income for the State making them both an environmental
and economic commodity. For instance, in the Rio Grande Valley, wetlands offer habitat for
246 bird species, 10 species amphibians, 28 reptiles, and 60 species of mammals, as well as,
stoppover, feeding, and breeding grounds for migratory fowl (US Fish and Wildlife Service
1990).
Figure 28: Wetland and deep-water habitats of the US (US Department of the
Interior, 2009)

51
Wetlands occur in all regions of NM,
however, they are most prevelant in
the eastern and northern areas of the
state. In the Southern Rocky
Mountains, wetlands are most
common in high elevation valleys and
intermountain basins. In the Eastern
Plains, wetlands occur along flood
plains of the Canadian and Pecos
Rivers and are associated with playa
lakes (US Geological Survey 1996).
In the Basin Range and Colorado
Plateau regions, wetlands are sparsely
distributed (with exception of those
associated with the Gila, San
Francisco and San Juan Rivers).
The Bosque del Apache National
Wildlife Refuge is one of the most well known riparian wetlands in NM. The refuge is
approximately 57,191 acres lying along a nine mile stretch of the Rio Grande in south-central
NM. Marshes within the refuge are the ultimate winter habitat for migrating birds including:
ducks, geese, sandhill cranes, and the endagered whooping crane and (southwestern) willow
flycatcher. Currently the Bosque is undergoing a reclamation campaign to restore cottonwood
and willow habitat that was loss during the expansion of water infrastructure projects in the first
half of the 20th
century (US Geological Survey 1996). However, streamflow regimes in the area
were greatly altered allowing the colonization of exotic species such as the Russian olive and salt
cedar.
Figure 29: Wetland areas of New Mexico (US Fish and Wildlife
Service, 1990)

52
Types of Wetlands:
The term wetland is a generic descriptor that is used to describe a variety of saturated zones; all
wetlands fall into one of five categories: 1) areas with hydrophytes and hydric soils (marshes,
bogs, and swamps); 2) areas devoid of hydrophytes but contain hydric soils (for instance, areas
with poor water quality that prevent the growth of hydrophytes); 3) areas with hydrophytes but
non-hydric soils (newly developed wetlands where hydric soils have yet to develop); 4) areas
without soils but provide hydrophytes (seaweed-covered rocky shores); and 5) wetlands without
soil and without hydrophytes (gravely beaches or rocky shores with vegetation) (Cowardin
1971).
There are five major systems of wetlands: marine, estuarine, riverine, lacustrine, and palustrine;
which, can further be broken down into subsystems: tidal, sub tidal and intertidal, lower
perennial, upper perennial, intermittent, limnetic, and littoral (palustrine does not include a
subsystem). These are then described in terms of classes (Figure14, Cowardin 1971).

53
Figure 30: Hierarchy of wetland systems (Cowardin 1971)
Although there are many categories of wetlands throughout the world, non-tidal marshes are the
most prevalent type of wetland in North America. Differentiations in wetland type are caused by
variations in soil, landscape, climate, water regime, chemistry, vegetation, and human
disturbance (Environmental Protection Agency 2001).
System:
In New Mexico, there are three systems present: Palustrine, Lacustrine, and Riverine. Palustrine
systems only include wetlands whereas other systems comprise wetlands and deep water
habitats. The term Palustrine encompasses all non-tidal wetlands dominated by trees, shrubs,

54
persistent emergent vegetation, emergent mosses or lichens, and all such wetlands that occur in
tidal areas where salinity is below 0.5percent. These systems also include wetlands lacking this
vegetation, but encompasses all of the following four characteristics: area less than 20 acres,
active wave-formed or bedrock shoreline feature is missing, water depth in the deepest part of
the basin is less than 2m at low water, and salinity due to ocean-derived salts is less than
0.5percent (Cowardin 1971). Palustrine wetlands often occur in the vicinity of springs, flowing
wells, and in this case, seeps. They may also be found on floodplains of riparian systems, around
the shores of some lakes, and reservoirs (EcologyDictionary.org 2008). The wetland in
Dutchman Canyon is consistent with the description of Palustrine wetlands.
Class:
The Emergent Wetland Class is characterized by erect, rooted, herbaceous hydrophytes,
excluding lichens and mosses. The vegetation is persistent throughout the growing season most
years and is predominantly composed of perennial species. All water regimes are included with
the exception of sub tidal and irregularly exposed (Cowardin 1971). In areas where climatic
regimes are relatively stable, such as the Vermejo Park Ranch, emergent wetlands remain
constant in appearance year after year. However, in areas that have violent climatic events,
emergent wetlands can revert to open water systems in some years. Emergent wetlands occur
throughout the United States and are present in all systems except the Marine. Emergent
wetlands are often referred to as marshes, fens, prairie potholes, and sloughs (Cowardin 1971).
Subclass:
The subclass Persistent simply means that the wetland is dominated by species that persist, or
remain standing until the beginning of the next growing season if not longer. Palustrine
persistent emergent wetlands often contain an array of grass like plants such as those seen in
Dutchman: redtop, western wheatgrass, alkali weeping grass, bulrush and others. The
constructed wetland in Dutchman Canyon qualifies; it is permanently flooded, is primarily
dominated by erect, rooted, hydrophytes that are well suited for anaerobic soil conditions. The
emergent vegetation adjacent to rivers and lakes is often referred to as the “shore zone” or “zone
of emergent vegetation”.
Dutchman Classification: Emergent Wetland, Saturated/Permanently Flooded, Mixosaline
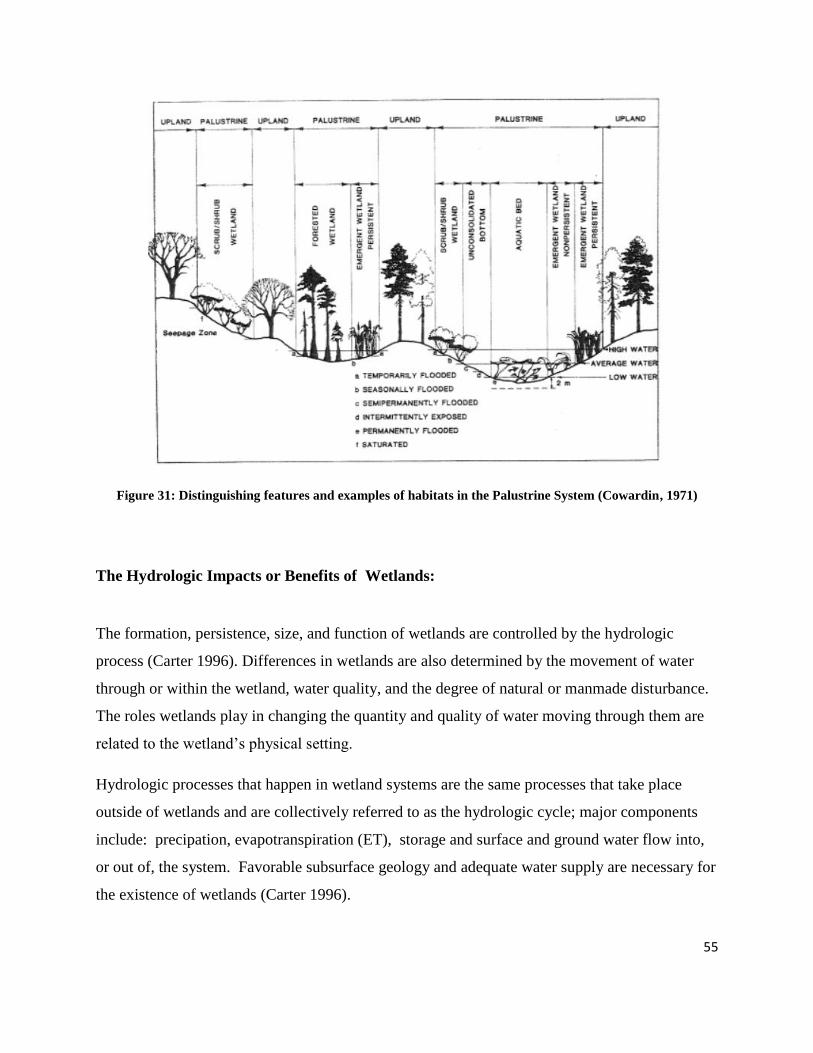
55
Figure 31: Distinguishing features and examples of habitats in the Palustrine System (Cowardin, 1971)
The Hydrologic Impacts or Benefits of Wetlands:
The formation, persistence, size, and function of wetlands are controlled by the hydrologic
process (Carter 1996). Differences in wetlands are also determined by the movement of water
through or within the wetland, water quality, and the degree of natural or manmade disturbance.
The roles wetlands play in changing the quantity and quality of water moving through them are
related to the wetland’s physical setting.
Hydrologic processes that happen in wetland systems are the same processes that take place
outside of wetlands and are collectively referred to as the hydrologic cycle; major components
include: precipation, evapotranspiration (ET), storage and surface and ground water flow into,
or out of, the system. Favorable subsurface geology and adequate water supply are necessary for
the existence of wetlands (Carter 1996).

56
Water budgets help provide a basis for understanding hydrologic processes of a wetland (Carter
1996). A wetland’s water budget is the sum of all the inflows and outflows of the system. The
addition of all the inflows minus the all of the outflow components is the change in storage. The
significance of each component’s role in maintaining wetlands varies both spatially and
temporally, however, all of these factors work in tandem to create the unique hydrology of a
wetland. The hydrology of a wetland system is largely responsible for the vegetative
communities present at that wetland. The type of vegetation that occurs in and around a wetland
greatly affects the quality of the the wetland as habitat and the value of the wetland as an
economic boon (Carter 1996).
The movement, distribution and quality of water are the primary factors influencing wetland
structure and function. Water regimes can greatly differ in regard to timing and duration of
surface water inundation as
well as the seasonality of such
patterns (Cherry 2012). Inland
wetlands, which are free of
diurnal tidal fluxes, can be
permanently flooded or
intermittently flooded with
fluctuations occurring on a
seasonal scale. In most wetland
systems, the inflow sources and
outflow mechanisms change with
time; therefore, the hydrologic
scenario is rarely stable and often goes through periods of hydrologic pulses. Pulses can cause
the system to become unbalanced as these influxes of surface water can introduce sediment and
nutrients or they can act as cleansing episodes by increasing productivity thus removing waste
materials and toxins (Cherry 2012).
Hydrologic pulses can drive system productivity by influencing species richness and increasing
rates of Organic Matter (OM) production in a wetland, whereas, permanent flooding can actually
Figure 32: Hydrologic process of wetlands (Carter, 1996)

57
cause a system to stall. Studies have shown the primary productivity and species richness
increase with in periods of flux and tend to stagnate in areas that are perennially flooded or, in
contrast, drained. Anaerobic conditions can limit decomposition rates, causing OM
accumulation, and can alter reduction-oxidation reactions controlling nutrient transformations in
wetland soils. Although scientists understand flooding tolerances of many plants species, the
effect of saturated soil conditions on root zone productivity is less known (Carter 1996). Golet
and Lowry (1987) found that surface flooding and duration of saturation within the root zone
accounted for as much as 50 percent of the variation in growth of some plants. Plant distribution
is also closely related to water chemistry: wetlands can be fresh or saline, acidic or basic and
contain high levels of nutrient loading depending on their location within the landscape.
Water Chemistry:
The water chemistry of a wetland is largely a result of the geologic setting, water balance, quality
of inflowing water, soil type, surrounding vegetation and local human activity (Carter 1996).
Wetlands that have limited outflow lose water primarily to ET, have a high concentration of
chemicals and tend to have brackish or saline water. Dissimilarly, wetlands that depend on
precipitation as a primary input of water, and lose water to surface water outflows or ground
seepage, tend to have lower concentrations of chemicals. In the case of the Dutchman ponds, the
wetland receives water primarily from precipitation and mine seepage. Often, plants serve as
indicators of wetland chemistry. In freshwater wetlands pH, mineral and nutrient composition
influence plant abundance and species diversity (Carter 1996).
pH Modifiers:
Acidic waters are characterized by high concentrations of chloride and/or sulfate and have
comparatively low concentrations of other ions (some very soft waters may have neutral pH
levels). Some studies suggest that acidity may not be the primary constituent controlling the
presence or absence of specific plants or animals Cowardin 1971). However, in systems where,
for example, a peat layer isolates overlying plant roots from the mineral substrate, the availability
of minerals in the root zone strongly influences the type of plant communities that occupy the
site. Therefore, rather than using plant and animal populations as indicators for pH levels,

58
scientist have used mineral rich and mineral poor categories to instead describe hydrogen ion
concentrations. The Dutchman system is very much in the Alkaline (>7.4) pH modifier category.
Salinity Modifiers:
Salinity refers to the Total Dissolved Solid (TDS) concentration in water. Brackish water is used
to describe waters with a TDS >1000 mg/L while saline is most often used to describe TDS
measurements above 35,000 mg/L, such as ocean or sea water. In a wetland system, salinity is
dictated by the interactions between precipitation, surface runoff, groundwater flow, and
evaporation and or transpiration. In inland wetlands, high soil salinities control the invasion or
establishment of many plants. These salinities are expressed in units of specific conductance as
well as percent salt. Measuring water’s electrical conductivity (EC) is also an indirect
measurement of TDS. High EC measurements are correlated to high concentrations of the
following ions: cations including calcium (Ca), magnesium (Mg), sodium (Na), and potassium
(K); and three major anions: carbonate (CO3), sulfate (SO4) and chloride (Cl) (Wetzel 1975).
Submerged Soil: Chemistry and Behavior
Hydric Soils:
According to the US USACE, a hydric soil is a soil that is formed under conditions of saturation,
flooding, or ponding long enough during the growing season to develop anaerobic conditions
that favor the growth and regeneration of hydrophytic vegetation (US Army Corps of Engineers
1995). Hydric soils develop under anoxic conditions and several biogeochemical transformations
take place shortly after the available oxygen is depleted, including nitrate reduction to nitrogen
gas, sulfur reduction to hydrogen sulfide, carbon reduction to methane, and increased solubility
(depending on soil pH and redox potential), (Kercher 2005).
Submerging a soil generates an assortment of electrochemical alterations, including: a decrease
in redox potential, an increase in pH of acid soils and a decrease in pH of alkaline soils, shifts in
conductance and ionic strength, changes in mineral equilibria, cation and anion exchange
interactions, and sorption/desorption of ions (Ponnamperuma 1972). The most significant
chemical difference between submerged soils and well drained soils is that submerged soils are
at a reduced state. Submerged soils tend to be a greenish grey hue and have a low oxidation -
reduction potential. Reduction of the soil is a result of anaerobic respiration by soil microbes.

59
During anaerobic respiration, OM is oxidized and soil components are reduced (Ponnamperuma
1972). Oxidation-reduction is a chemical reaction where electrons are transferred from a donor
to an electron acceptor. The electron donor releases electrons and is oxidized; the receiver gains
electrons and is reduced. The source of electrons for most biological reduction is OM. The
amount of energy available to an organism depends on the electron acceptor. For biological
reactions oxygen provides the greatest amount of energy and all higher life forms, including
most graduate students, require an aerobic environment in which oxygen is present. The state of
a soil can be defined quantitatively by measuring the intensity (redox potential) or capacity (total
concentration of reduction products) (Ponnamperuma 1972).
Soils at Dutchman are, at this time, on a trajectory to becoming marsh soils. Marsh soils are
defined as soils that are more or less permanently inundated (Cowardin 1971). Freshwater marsh
soils tend to be located on the edges of lakes and stream networks that are capable of producing a
constant source of submergence. There are also saltwater marshes and these often occur near
estuaries, tidal flats, and deltas (Ponnamperuma 1972).
Oxygen Availability:
The formation of anaerobic conditions in wetland soils occurs due to the fact that oxygen is
depleted faster than it can be replenished through diffusion. The rate of oxygen depletion varies
depending on factors such as: soil temperature, soil structure, the degree microbial respiration
and vegetative cover. Oxygen and other atmospheric gases can pass into the soil through
molecular diffusion in interstitial waters only (Ponnamperuma 1972); therefore, the oxygen
diffusion rate drastically decreases when a soil becomes inundated. Within a few hours,
microorganisms use up the oxygen in both the water and soil pore space and effectively render
the soil devoid of molecular oxygen (Ponnamperuma 1972). Scientists Evans and Scott (1955)
found that the concentration of oxygen in the water used to submerge soil decreased to one-
hundredth of its original value within 75 minutes (Ponnamperuma 1972).
Submerged soils are not uniformly devoid of oxygen (Ponnamperuma 1972). Oxygen
concentrations may be high in surface layers where there is contact with oxygenated water; these
layers are usually a few millimeters thick. In most wetlands, limited areas of oxidized soils
persist near the surface or surrounding the roots of vascular plants; generally however, anaerobic

60
or reduced conditions are found prominently throughout wetland systems (Cherry 2012).
Howeler and Bouldin (1971) found that submerged soils and lake muds are anoxic below the soil
water interface. These anaerobic soil conditions, or lack of molecular oxygen, are a key identifier
of wetland systems.
The existence of an oxygenated surface layer in wetland systems is important from an ecological
stand point; these muds act as sinks for phosphate and other vital plant nutrients (Ponnamperuma
1972). The mud acts as a chemical barrier to the exchange of certain plant nutrients from the soil
to the water body. The surface layer must have access to oxygenated water; this occurs through
turbulence from wind or by thermal movements (Ponnamperuma 1972). When this occurs,
oxygen availability exceeds the demand at the mud/water interface. By contrast, if the surface
utilizes the oxygen faster than it can be supplied, the surface will undergo reduction and release
large stores of nutrients from the mud into the water (Ponnamperuma 1972).
Submerging soils impedes the diffusion of oxygen to deeper zones. Aerobic organisms in the soil
become quiescent or die, while, the facultative and obligate anaerobes flourish. These organisms
proliferate using carbon compounds as substrate and oxidized soil components and dissimilation
products of organic matter as electron acceptors in respiration (Ponnamperuma 1972); the shift
from aerobic to anaerobic respiration occurs at oxygen levels of 3 x10⁻⁶
M or lower
(Ponnamperuma 1972). In the absence of oxygen, facultative and obligate anaerobes us NO3-,
Mn(IV), Fe(III), SO42-
, dissimilation compounds of organic matter, CO2, N2 and H+ ions as
electron acceptors in their respiration reducing NO3- to N2, Mn(IV) to Mn(II), Fe(III) to Fe(II),
SO42-
, to H2S, CO2, to CH1, N2 to NH3 and H+ to H2 (Ponnamperuma 1972). Anaerobic
respiration also produces chemically reducing by-products; therefore, switching from aerobic to
anaerobic respiration ignites the reduction of submerged soils. Soil reduction requires several
components: the absence of oxygen, presence of decomposable organic matter, and the
proliferation of anaerobic soil microbes. The path, rate, and level of reduction are dependent on
factors such as: pH, temperature, percent OM, and the nature and content of electron receptors
(Ponnamperuma 1972).

61
pH:
When an aerobic soil is submerged, as is the case at Dutchman Canyon, its pH decreases during
the initial days, arrives at a minimum, and then increases asymptotically to a somewhat stable
value of 6.7-7.2 with a few weeks (Ponnamperuma 1972). Generally, submerging soils increases
pH of acid soils and depresses the pH of sodic and calcareous soils and converges around a pH of
7. However, according to Ponnamperuma (1972), even though submerged soils exhibit changes
in pH, soil properties and temperature markedly influence the pattern of said changes. For
example, soils high in organic matter and reducible iron attain a pH of 6.5 after only a few weeks
of submergence. However, acid soils low in organic matter or active iron may not reach a pH of
5 or higher even after a few months of submergence. The presence of organic matter can amplify
the decreases in pH of sodic and calcareous soils while, low temperature or the presence of
nitrate retards the increase in pH of acidic soils (Ponnamperuma 1972).
pH values can radically affect hydroxide, carbonate, sulfide, phosphate, and silicate equilibria in
saturated soils. These equilibria control the precipitation and dissolution of solids, the sorption
and desorption of ions, and the concentrations of nutritionally significant ions or compounds
such as Al3+
, Fe2+
, H2S, H2CO3 and un-disassociated organic acids (Ponnamperuma 1972).
Carbon:
Organic matter decomposition in saturated soils contrasts with decomposition in well drained
soils in two ways: breakdown of organic materials is slower, and the end product is very
different. In porous or well drained soils, plant matter is decomposed by a large assembly of
microorganisms. Due to the elevated energy release associated with aerobic respiration,
decomposition occurs rapidly.

62
Appendix 4: Site Maps
Site Location Map (Isaacson, 2013)

63
The Swastika Mine Complex (Isaacson, 2014)

64
Sample Locations (Isaacson, 2014)
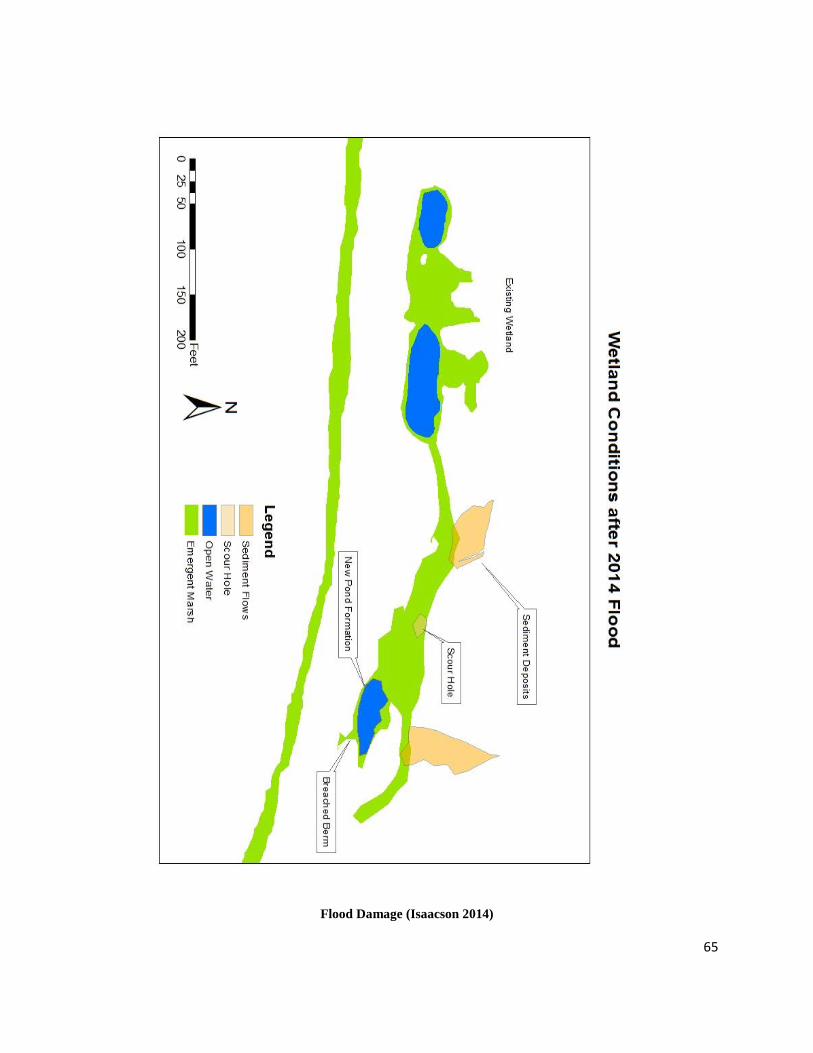
65
Flood Damage (Isaacson 2014)

66
Appendix 5: Seed Mixes
Dutchman Wetland Seed Mix:
Percent of Mix Species Common Name
8.26 Beckmannia syzigachne American Sloughgrass
9.75 Distichlis stricta Inland Saltgrass
1.72 Juncus balticus Baltic Rush
3.52 Muhlenbergia asperifolia Scratchgrass
13.00 Panicum virgatum Switchgrass
8.52 Phalaris arundinacea Reed Canarygrass
1.65 Puccinellia airoides Nuttall’s Alkaligrass
19.89 Scirpus maritimus Alkali Bulrush
29.56 Pascopyrum smithii Western Wheatgrass, var. Arriba
Application Rate: 6 LBS PLS per acre
Swastika Upland Seed Mix:
Percent of Mix Species Common Name
4.62 Oryzopsis hymenoides Indian Ricegrass
5.49 Bouteloua curtipedula Side-oats Grama
2.29 Bouteloua gracilis Blue Grama
3.45 Bromus ciliates Fringed Brome
12.31 Elymus trachycaulus Slender Wheatgrass
9.84 Stipa viridula Green Needlegrass

67
14.92 Pascopyrum smithii Western Wheatgrass
5.45 Hilaria jamesii Galleta
3.44 Schizachyrium scoparium Little Bluestem
0.30 Sporobolus cryptandrus Sand Dropseed
0.19 Artemsia frigida Fringed Sage
0.27 Artemesia ludoviciana Prairie Sage
1.09 Dalea purpurea Purple Prairie Clover
10.52 Helianthus annus Annual Sunflower
1.05 Sphaeralcea coccinea Scarlet Globemallow
1.11 Ratibida columnifera Prairie Coneflower
3.74 Ceratoides lanata Winterfat
7.10 Rhus trilobata Skunkbrush Sumac
3.95 Rosa Woodsii Wood’s Rose
Application Rate: 11.41 LBS PLS per Acre

68
Apendix 6: Water Quality Reports
1986: Dutchman Mines

69
Analyte (mg/L) Upper Adit Lower Pond ZI-1 ZI-4 Analyte (mg/L) Lower Pond Well 4 Well 5 Analyte (mg/L) Lower Pond ZI-1 ZI-2 ZI-4 Analyte (mg/L) Lower Pond ZI-1 ZI-3
Al 396.153 NA NA NA NA Al 396.154 31.864 35.512 39.16 Al 396.154 NA NA NA NA Al 396.154 NA NA NA
As 188.979 NA NA NA NA As 188.980 -0.0716667 -0.0741667 -0.0766667 As 188.980 NA NA NA NA As 188.980 NA NA NA
B 249.772 NA NA NA NA B 249.773 0.5523333 0.5878333 0.6233333 B 249.773 NA NA NA NA B 249.773 NA NA NA
Ba 455.403 NA NA NA NA Ba 455.404 0.7713333 0.8888333 1.0063333 Ba 455.404 NA NA NA NA Ba 455.404 NA NA NA
Be 313.107 NA NA NA NA Be 313.108 -0.0403333 -0.0398333 -0.0393333 Be 313.108 NA NA NA NA Be 313.108 NA NA NA
Ca 317.933 7 7 7 8 Ca 317.934 27.380667 29.038167 30.695667 Ca 317.934 6 6 6 5 Ca 317.934 7 8 9
Cd 228.802 NA NA NA NA Cd 228.803 -0.0103333 -0.0103333 -0.0103333 Cd 228.803 NA NA NA NA Cd 228.803 NA NA NA
Co 228.616 NA NA NA NA Co 228.617 -0.0166667 -0.0136667 -0.0106667 Co 228.617 NA NA NA NA Co 228.617 NA NA NA
Cr 267.716 NA NA NA NA Cr 267.717 0.004 0.0055 0.007 Cr 267.717 NA NA NA NA Cr 267.717 NA NA NA
Cu 324.752 NA NA NA NA Cu 324.753 0.0923333 0.1033333 0.1143333 Cu 324.753 NA NA NA NA Cu 324.753 NA NA NA
Fe 259.939 NA NA NA NA Fe 259.940 24.778 28.598 32.418 Fe 259.940 NA NA NA NA Fe 259.940 NA NA NA
K 766.490 4 4 5 3 K 766.491 10.02 11.062 12.104 K 766.491 4 4 4 4 K 766.491 3 2 2
Li 610.362 NA NA NA NA Li 610.363 0.09 0.093 0.096 Li 610.363 NA NA NA NA Li 610.363 NA NA NA
Mg 280.271 2 3 3 3 Mg 280.272 10.193333 11.019833 11.846333 Mg 280.272 2 2 2 2 Mg 280.272 3 3 3
Mn 257.610 NA NA NA NA Mn 257.611 0.4356667 0.5046667 0.5736667 Mn 257.611 NA NA NA NA Mn 257.611 NA NA NA
Mo 202.031 NA NA NA NA Mo 202.032 -0.023 -0.023 -0.023 Mo 202.032 NA NA NA NA Mo 202.032 NA NA NA
Na 589.592 895 932 961 1060 Na 589.593 311.83333 314.48333 317.13333 Na 589.593 876 926 900 856 Na 589.593 844 894 896
Ni 231.604 NA NA NA NA Ni 231.605 0.013 0.015 0.017 Ni 231.605 NA NA NA NA Ni 231.605 NA NA NA
Pb 220.353 NA NA NA NA Pb 220.354 0.1903333 0.2543333 0.3183333 Pb 220.354 NA NA NA NA Pb 220.354 NA NA NA
Se 196.026 NA NA NA NA Se 196.027 -0.3113333 -0.3468333 -0.3823333 Se 196.027 NA NA NA NA Se 196.027 NA NA NA
Si 251.611 NA NA NA NA Si 251.612 22.657333 27.062833 31.468333 Si 251.612 NA NA NA NA Si 251.612 NA NA NA
Sr 421.552 NA NA NA NA Sr 421.553 0.709 0.7805 0.852 Sr 421.553 NA NA NA NA Sr 421.553 NA NA NA
V 310.230 NA NA NA NA V 310.231 0.081 0.091 0.101 V 310.231 NA NA NA NA V 310.231 NA NA NA
Zn 213.857 NA NA NA NA Zn 213.858 0.1683333 0.1978333 0.2273333 Zn 213.858 NA NA NA NA Zn 213.858 NA NA NA
pH 8 8.9 8.9 9.2 pH NA NA NA pH 8.7 8.7 8.8 9 pH 8.7 8.7 8.9
EC 3310 3580 3550 4030 EC NA NA NA EC 3370 3380 3400 3330 EC 3370 3370 3270
TDS NA NA NA NA TDS NA NA NA TDS NA NA NA NA TDS 2160 2170 2150
HCO3 2370 2240 2220 2190 HCO3 NA NA NA HCO3 2250 2210 2210 2030 HCO3 2130 2130 2040
CO 3 ND 127 142 314 CO 3 NA NA NA CO 3 123 143 151 209 CO 3 137 137 175
Cl-35 37 38 42 Cl-
NA NA NA Cl-35 35 35 35 Cl-
35 35 33
SO42- ND ND ND ND SO4
2- NA NA NA SO42- ND ND ND ND SO4
2- 1 1 1
Da
te:
4/
2/
20
14
La
b:
En
erg
y L
ab
ora
tori
es
Bil
lin
gs,
MT
Da
te:
10
/1
5/
20
14
La
b:
En
erg
y L
ab
ora
tori
es
Bil
lin
gs,
MT
Sample ID Sample IDSample IDSample ID
Da
te:
5/
15
/2
01
3 L
ab
: E
ne
rgy
La
bo
rato
rie
s B
illi
ng
s, M
T
Da
te:
7/
31
/2
01
4 L
ab
: U
NM
Water Quality Results (5/15/2012-10/15/201

70
Analyte (mg/L) DM3 DM2 ZI-2 ZI-3
Al 396.153 304.7 344.1 295.7 243.2
As 188.979 -0.262 -0.159 -0.131 -0.149
B 249.772 3.895 2.828 2.324 1.941
Ba 455.403 8.104 8.373 7.015 5.626
Be 313.107 -0.01 -0.01 -0.015 -0.02
Ca 317.933 92.08 151.1 105.3 96.32
Cd 228.802 0.005 0.006 0.004 0.001
Co 228.616 0.271 0.303 0.246 0.196
Cr 267.716 0.307 0.239 0.303 0.14
Cu 324.752 0.699 1.043 0.719 0.518
Fe 259.939 552 459.2 393.4 340.3
K 766.490 69.63 82.8 68.32 46.29
Li 610.362 0.31 0.31 0.314 0.363
Mg 280.271 62.03 63.08 61.79 42.9
Mn 257.610 41.57 11.3 9.672 5.074
Mo 202.031 -0.105 -0.079 -0.068 -0.053
Na 589.592 95.36 7.521 96.97 150.7
Ni 231.604 0.375 0.361 0.366 0.227
Pb 220.353 0.508 0.533 0.376 0.367
Se 196.026 -9.191 -6.598 -5.114 -4.193
Si 251.611 0.214 0.557 0.609 0.656
Sr 421.552 2.678 3.514 1.946 3.184
V 310.230 0.801 0.675 0.657 0.532
Zn 213.857 1.983 2.148 1.812 1.518
Sample ID
Date:
7/31
/201
3 Lab
: UNM
Soil Samples (7/31/2013)
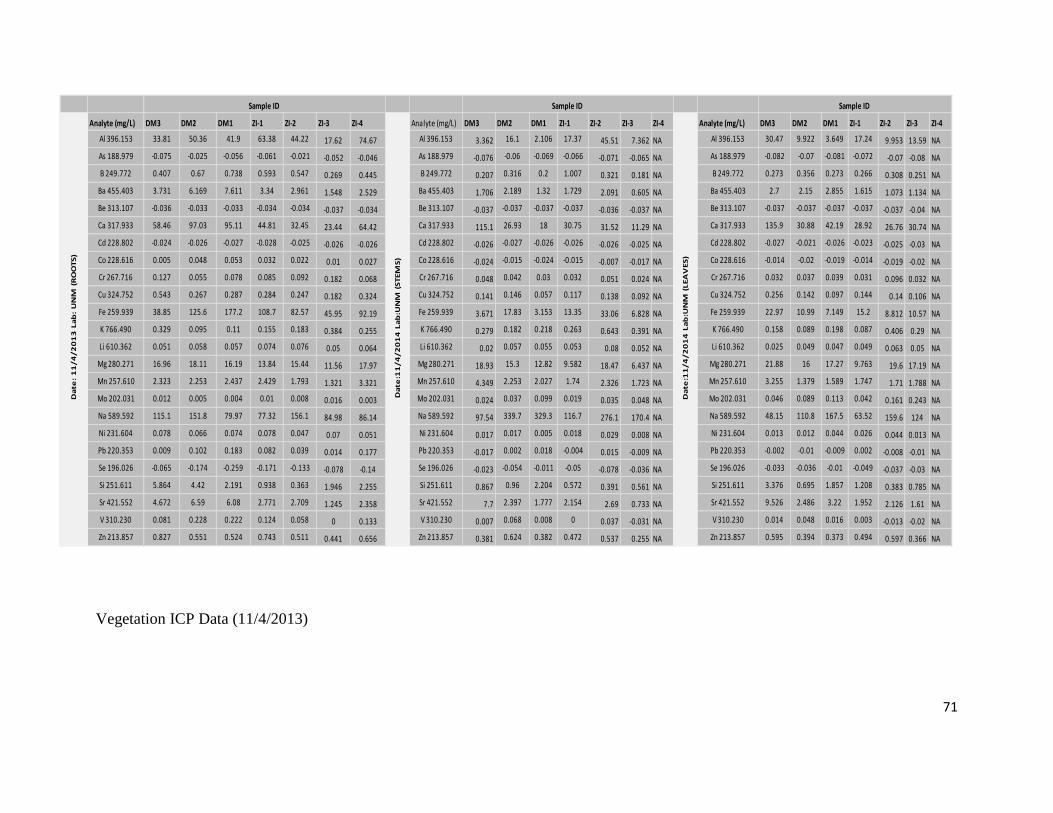
71
Analyte (mg/L) DM3 DM2 DM1 ZI-1 ZI-2 ZI-3 ZI-4 Analyte (mg/L) DM3 DM2 DM1 ZI-1 ZI-2 ZI-3 ZI-4 Analyte (mg/L) DM3 DM2 DM1 ZI-1 ZI-2 ZI-3 ZI-4
Al 396.153 33.81 50.36 41.9 63.38 44.22 17.62 74.67 Al 396.153 3.362 16.1 2.106 17.37 45.51 7.362 NA Al 396.153 30.47 9.922 3.649 17.24 9.953 13.59 NA
As 188.979 -0.075 -0.025 -0.056 -0.061 -0.021 -0.052 -0.046 As 188.979 -0.076 -0.06 -0.069 -0.066 -0.071 -0.065 NA As 188.979 -0.082 -0.07 -0.081 -0.072 -0.07 -0.08 NA
B 249.772 0.407 0.67 0.738 0.593 0.547 0.269 0.445 B 249.772 0.207 0.316 0.2 1.007 0.321 0.181 NA B 249.772 0.273 0.356 0.273 0.266 0.308 0.251 NA
Ba 455.403 3.731 6.169 7.611 3.34 2.961 1.548 2.529 Ba 455.403 1.706 2.189 1.32 1.729 2.091 0.605 NA Ba 455.403 2.7 2.15 2.855 1.615 1.073 1.134 NA
Be 313.107 -0.036 -0.033 -0.033 -0.034 -0.034 -0.037 -0.034 Be 313.107 -0.037 -0.037 -0.037 -0.037 -0.036 -0.037 NA Be 313.107 -0.037 -0.037 -0.037 -0.037 -0.037 -0.04 NA
Ca 317.933 58.46 97.03 95.11 44.81 32.45 23.44 64.42 Ca 317.933 115.1 26.93 18 30.75 31.52 11.29 NA Ca 317.933 135.9 30.88 42.19 28.92 26.76 30.74 NA
Cd 228.802 -0.024 -0.026 -0.027 -0.028 -0.025 -0.026 -0.026 Cd 228.802 -0.026 -0.027 -0.026 -0.026 -0.026 -0.025 NA Cd 228.802 -0.027 -0.021 -0.026 -0.023 -0.025 -0.03 NA
Co 228.616 0.005 0.048 0.053 0.032 0.022 0.01 0.027 Co 228.616 -0.024 -0.015 -0.024 -0.015 -0.007 -0.017 NA Co 228.616 -0.014 -0.02 -0.019 -0.014 -0.019 -0.02 NA
Cr 267.716 0.127 0.055 0.078 0.085 0.092 0.182 0.068 Cr 267.716 0.048 0.042 0.03 0.032 0.051 0.024 NA Cr 267.716 0.032 0.037 0.039 0.031 0.096 0.032 NA
Cu 324.752 0.543 0.267 0.287 0.284 0.247 0.182 0.324 Cu 324.752 0.141 0.146 0.057 0.117 0.138 0.092 NA Cu 324.752 0.256 0.142 0.097 0.144 0.14 0.106 NA
Fe 259.939 38.85 125.6 177.2 108.7 82.57 45.95 92.19 Fe 259.939 3.671 17.83 3.153 13.35 33.06 6.828 NA Fe 259.939 22.97 10.99 7.149 15.2 8.812 10.57 NA
K 766.490 0.329 0.095 0.11 0.155 0.183 0.384 0.255 K 766.490 0.279 0.182 0.218 0.263 0.643 0.391 NA K 766.490 0.158 0.089 0.198 0.087 0.406 0.29 NA
Li 610.362 0.051 0.058 0.057 0.074 0.076 0.05 0.064 Li 610.362 0.02 0.057 0.055 0.053 0.08 0.052 NA Li 610.362 0.025 0.049 0.047 0.049 0.063 0.05 NA
Mg 280.271 16.96 18.11 16.19 13.84 15.44 11.56 17.97 Mg 280.271 18.93 15.3 12.82 9.582 18.47 6.437 NA Mg 280.271 21.88 16 17.27 9.763 19.6 17.19 NA
Mn 257.610 2.323 2.253 2.437 2.429 1.793 1.321 3.321 Mn 257.610 4.349 2.253 2.027 1.74 2.326 1.723 NA Mn 257.610 3.255 1.379 1.589 1.747 1.71 1.788 NA
Mo 202.031 0.012 0.005 0.004 0.01 0.008 0.016 0.003 Mo 202.031 0.024 0.037 0.099 0.019 0.035 0.048 NA Mo 202.031 0.046 0.089 0.113 0.042 0.161 0.243 NA
Na 589.592 115.1 151.8 79.97 77.32 156.1 84.98 86.14 Na 589.592 97.54 339.7 329.3 116.7 276.1 170.4 NA Na 589.592 48.15 110.8 167.5 63.52 159.6 124 NA
Ni 231.604 0.078 0.066 0.074 0.078 0.047 0.07 0.051 Ni 231.604 0.017 0.017 0.005 0.018 0.029 0.008 NA Ni 231.604 0.013 0.012 0.044 0.026 0.044 0.013 NA
Pb 220.353 0.009 0.102 0.183 0.082 0.039 0.014 0.177 Pb 220.353 -0.017 0.002 0.018 -0.004 0.015 -0.009 NA Pb 220.353 -0.002 -0.01 -0.009 0.002 -0.008 -0.01 NA
Se 196.026 -0.065 -0.174 -0.259 -0.171 -0.133 -0.078 -0.14 Se 196.026 -0.023 -0.054 -0.011 -0.05 -0.078 -0.036 NA Se 196.026 -0.033 -0.036 -0.01 -0.049 -0.037 -0.03 NA
Si 251.611 5.864 4.42 2.191 0.938 0.363 1.946 2.255 Si 251.611 0.867 0.96 2.204 0.572 0.391 0.561 NA Si 251.611 3.376 0.695 1.857 1.208 0.383 0.785 NA
Sr 421.552 4.672 6.59 6.08 2.771 2.709 1.245 2.358 Sr 421.552 7.7 2.397 1.777 2.154 2.69 0.733 NA Sr 421.552 9.526 2.486 3.22 1.952 2.126 1.61 NA
V 310.230 0.081 0.228 0.222 0.124 0.058 0 0.133 V 310.230 0.007 0.068 0.008 0 0.037 -0.031 NA V 310.230 0.014 0.048 0.016 0.003 -0.013 -0.02 NA
Zn 213.857 0.827 0.551 0.524 0.743 0.511 0.441 0.656 Zn 213.857 0.381 0.624 0.382 0.472 0.537 0.255 NA Zn 213.857 0.595 0.394 0.373 0.494 0.597 0.366 NA
Da
te:
11
/4
/2
01
3 L
ab
: U
NM
(R
OO
TS
)
Sample ID Sample ID Sample ID
Da
te:1
1/
4/
20
14
La
b:U
NM
(S
TE
MS
)
Da
te:1
1/
4/
20
14
La
b:U
NM
(L
EA
VE
S)
Vegetation ICP Data (11/4/2013)


