Patient Experience Body of KnowledgeMetrics and Measurement Domain Team
Week 4 Check-in Call
www.theberylinstitute.org
Aug 24, 2012
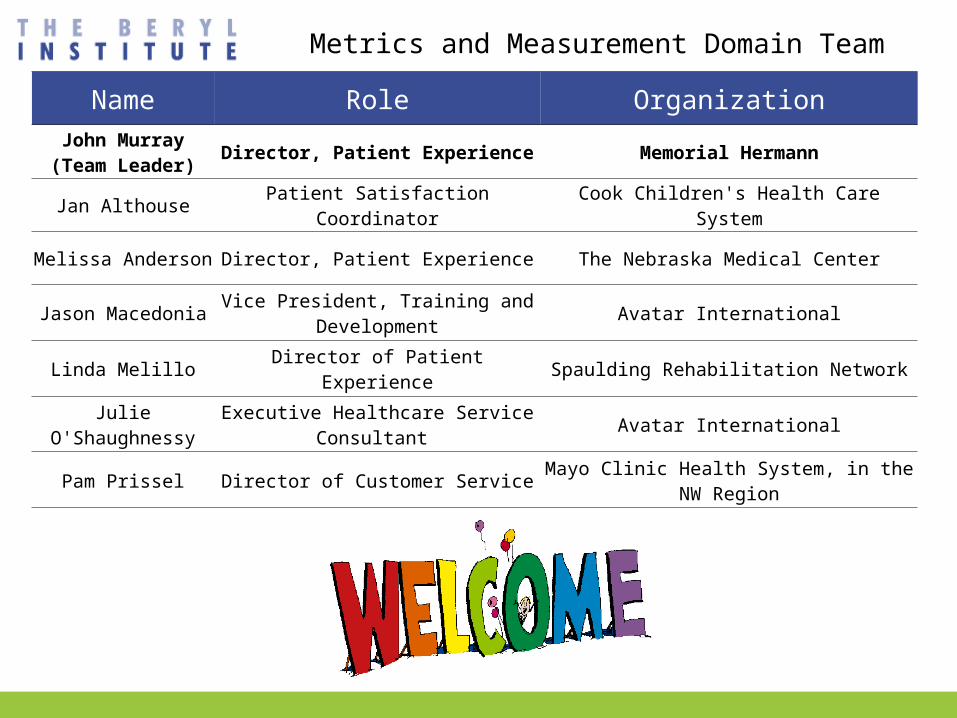
Metrics and Measurement Domain Team Name Role Organization
John Murray(Team Leader) Director, Patient Experience Memorial Hermann
Jan Althouse Patient Satisfaction Coordinator Cook Children's Health Care System
Melissa Anderson Director, Patient Experience The Nebraska Medical Center
Jason Macedonia Vice President, Training and Development Avatar International
Linda Melillo Director of Patient Experience Spaulding Rehabilitation Network
Julie O'Shaughnessy Executive Healthcare Service Consultant Avatar International
Pam Prissel Director of Customer Service Mayo Clinic Health System, in the NW Region
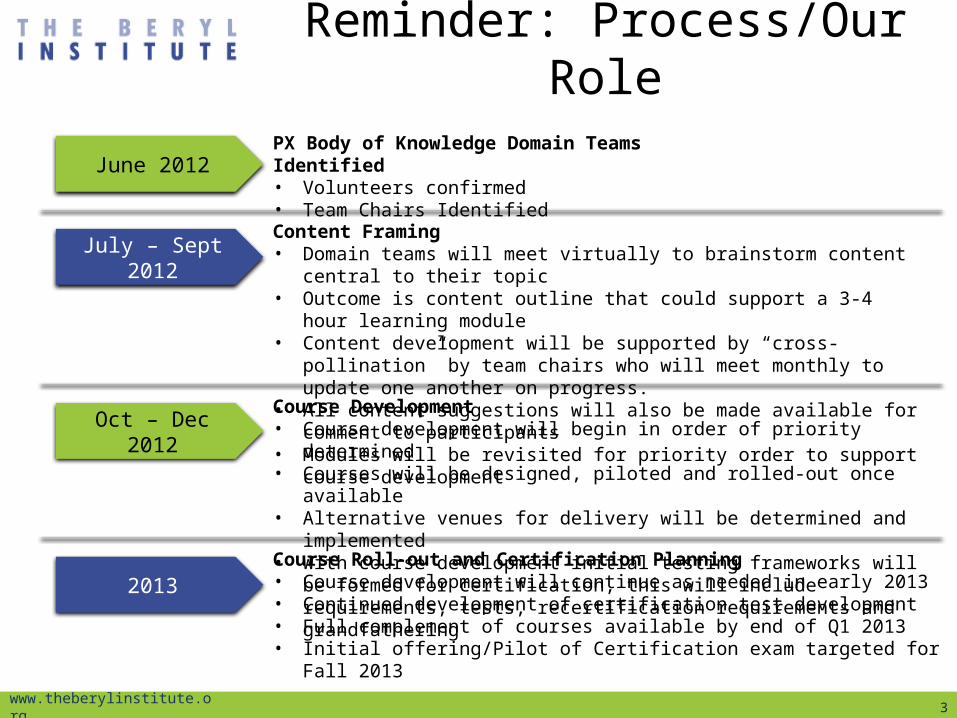
Reminder: Process/Our Role
June 2012PX Body of Knowledge Domain Teams Identified• Volunteers confirmed• Team Chairs Identified
July – Sept 2012Content Framing• Domain teams will meet virtually to brainstorm content central to their topic• Outcome is content outline that could support a 3-4 hour learning module• Content development will be supported by “cross-pollination” by team chairs who
will meet monthly to update one another on progress.• All content suggestions will also be made available for comment to participants• Modules will be revisited for priority order to support course development
Oct – Dec 2012Course Development• Course development will begin in order of priority determined• Courses will be designed, piloted and rolled-out once available• Alternative venues for delivery will be determined and implemented• With course development initial testing frameworks will be formed for certification,
this will include requirements, tests, recertification requirements and grandfathering
2013Course Roll-out and Certification Planning• Course development will continue as needed in early 2013• Continued development of certification test development• Full complement of courses available by end of Q1 2013• Initial offering/Pilot of Certification exam targeted for Fall 2013
3www.theberylinstitute.org
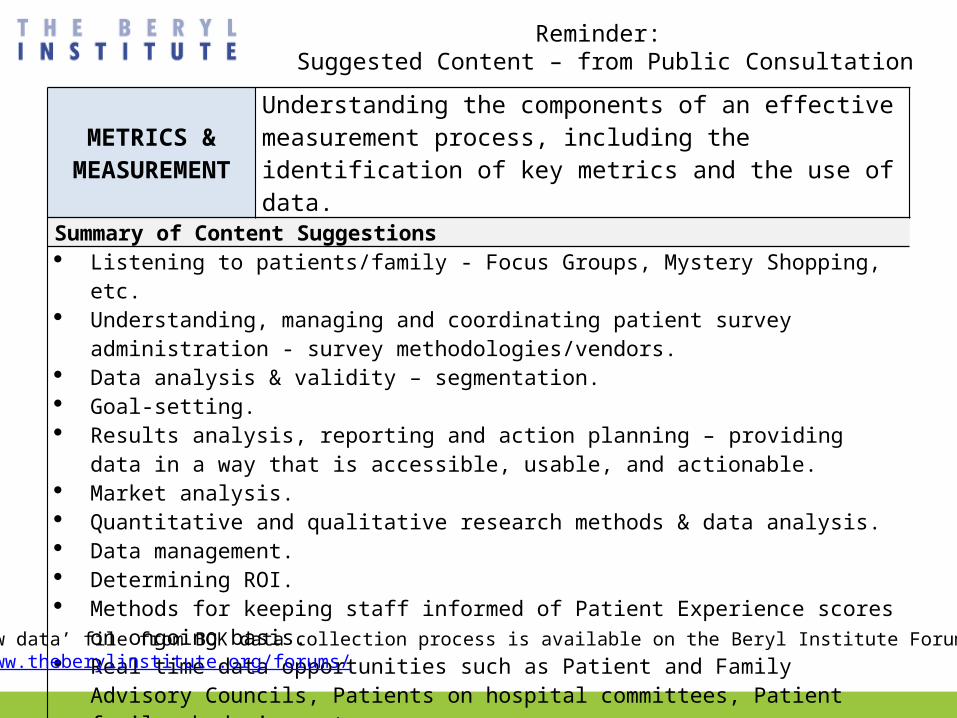
Reminder: Suggested Content – from Public Consultation
METRICS & MEASUREMENT
Understanding the components of an effective measurement process, including the identification of key metrics and the use of data.
Summary of Content Suggestions Listening to patients/family - Focus Groups, Mystery Shopping, etc. Understanding, managing and coordinating patient survey administration - survey
methodologies/vendors. Data analysis & validity – segmentation. Goal-setting. Results analysis, reporting and action planning – providing data in a way that is accessible,
usable, and actionable. Market analysis. Quantitative and qualitative research methods & data analysis. Data management. Determining ROI. Methods for keeping staff informed of Patient Experience scores on ongoing basis. Real time data opportunities such as Patient and Family Advisory Councils, Patients on
hospital committees, Patient family shadowing, etc. Use of Patient and Family Stories to drive change.
Full ‘raw data’ file from BOK data collection process is available on the Beryl Institute Forum:http://www.theberylinstitute.org/forums/
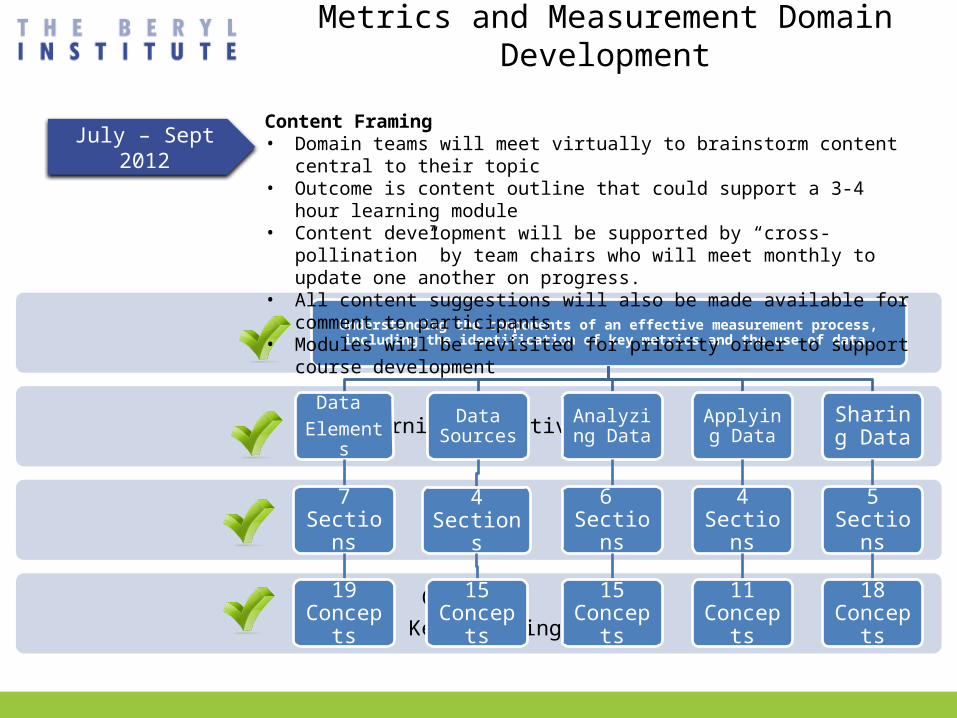
Metrics and Measurement Domain Development
Concepts & Key Learnings
Sections
Learning Objectives
Objective Understanding the components of an effective measurement process, including the identification of key metrics and the use of data.
Data Elements
7 Sections
19 Concepts
Data Sources
4 Sections
15 Concepts
Analyzing Data
6 Sections
15 Concepts
Applying Data
4 Sections
11 Concepts
Sharing Data
5 Sections
18 Concepts
July – Sept 2012Content Framing• Domain teams will meet virtually to brainstorm content central to their topic• Outcome is content outline that could support a 3-4 hour learning module• Content development will be supported by “cross-pollination” by team chairs who
will meet monthly to update one another on progress.• All content suggestions will also be made available for comment to participants• Modules will be revisited for priority order to support course development
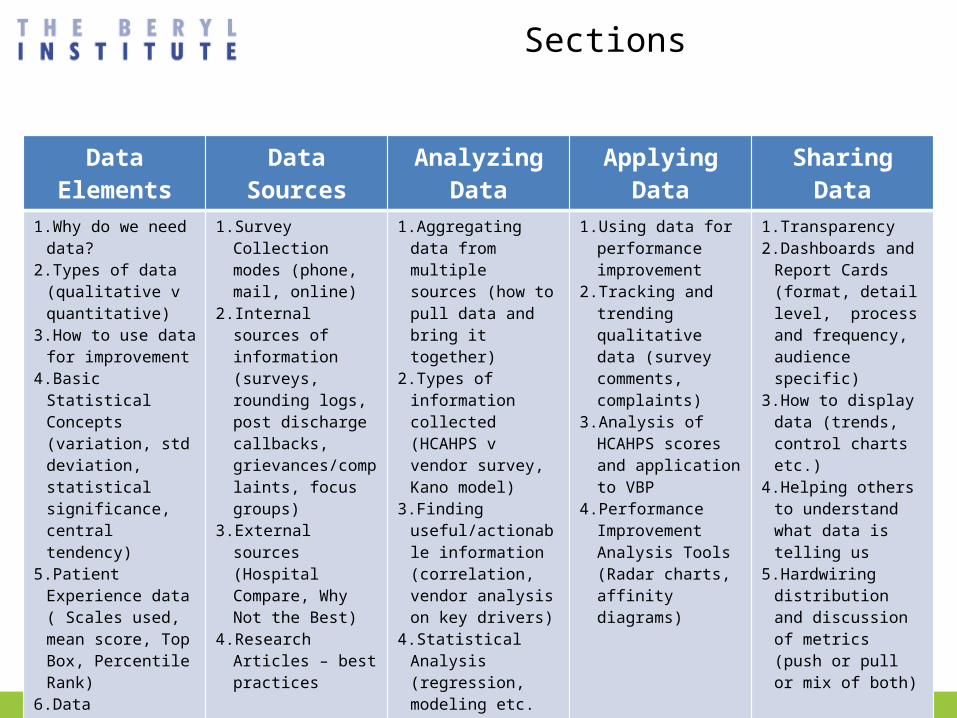
Sections
Data Elements Data Sources Analyzing Data Applying Data Sharing Data1.Why do we need data?2.Types of data
(qualitative v quantitative)
3.How to use data for improvement
4.Basic Statistical Concepts (variation, std deviation, statistical significance, central tendency)
5.Patient Experience data ( Scales used, mean score, Top Box, Percentile Rank)
6.Data limitations (small sample size)
7.Understanding measurement of inputs (actions/activity) and outcomes (survey scores)
1. Survey Collection modes (phone, mail, online)
2. Internal sources of information (surveys, rounding logs, post discharge callbacks, grievances/complaints, focus groups)
3. External sources (Hospital Compare, Why Not the Best)
4. Research Articles – best practices
1.Aggregating data from multiple sources (how to pull data and bring it together)
2.Types of information collected (HCAHPS v vendor survey, Kano model)
3.Finding useful/actionable information (correlation, vendor analysis on key drivers)
4.Statistical Analysis (regression, modeling etc. examples where used and relevant)
5.Looking for trends6.Understanding VBP
performance calculations (contribution of HCAHPS)
1. Using data for performance improvement
2. Tracking and trending qualitative data (survey comments, complaints)
3. Analysis of HCAHPS scores and application to VBP
4. Performance Improvement Analysis Tools (Radar charts, affinity diagrams)
1.Transparency2.Dashboards and
Report Cards (format, detail level, process and frequency, audience specific)
3.How to display data (trends, control charts etc.)
4.Helping others to understand what data is telling us
5.Hardwiring distribution and discussion of metrics (push or pull or mix of both)
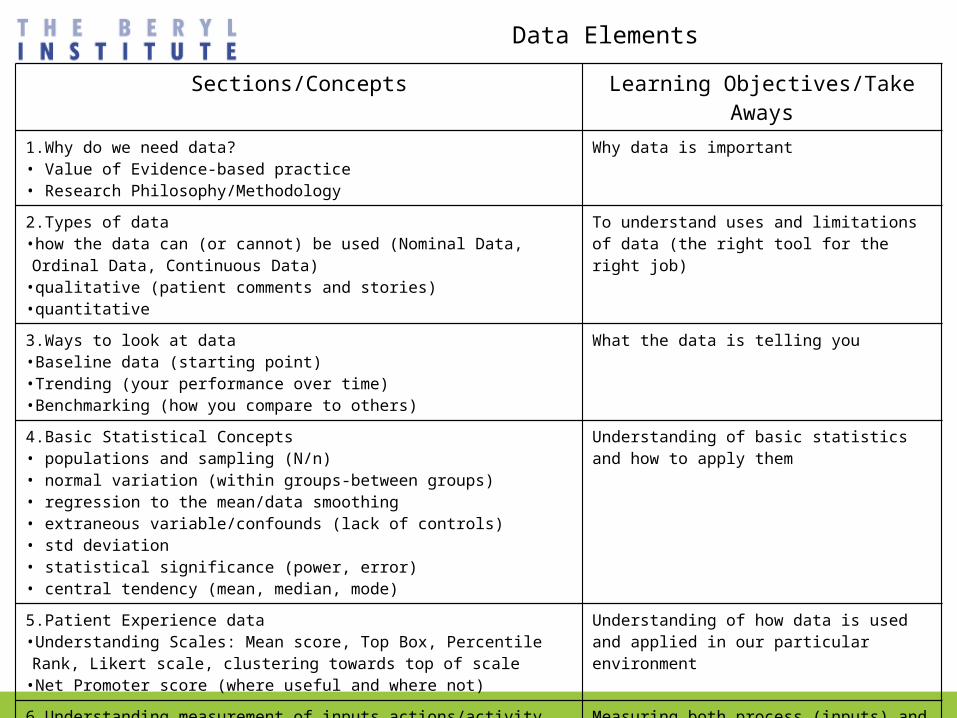
Data ElementsSections/Concepts Learning Objectives/Take Aways
1.Why do we need data?• Value of Evidence-based practice• Research Philosophy/Methodology
Why data is important
2.Types of data•how the data can (or cannot) be used (Nominal Data, Ordinal Data, Continuous Data)
•qualitative (patient comments and stories)•quantitative
To understand uses and limitations of data (the right tool for the right job)
3.Ways to look at data•Baseline data (starting point) •Trending (your performance over time)•Benchmarking (how you compare to others)
What the data is telling you
4.Basic Statistical Concepts• populations and sampling (N/n)• normal variation (within groups-between groups)• regression to the mean/data smoothing• extraneous variable/confounds (lack of controls)• std deviation • statistical significance (power, error)• central tendency (mean, median, mode)
Understanding of basic statistics and how to apply them
5.Patient Experience data•Understanding Scales: Mean score, Top Box, Percentile Rank, Likert scale, clustering towards top of scale
•Net Promoter score (where useful and where not)
Understanding of how data is used and applied in our particular environment
6.Understanding measurement of inputs actions/activity outcomes (survey scores) •Predictive Indicators (activities aimed at driving the score – e.g. response to call light, rounding, bedside shift report, employee engagement)
• Outcomes Measures (survey returns)
Measuring both process (inputs) and outcomes (scores)
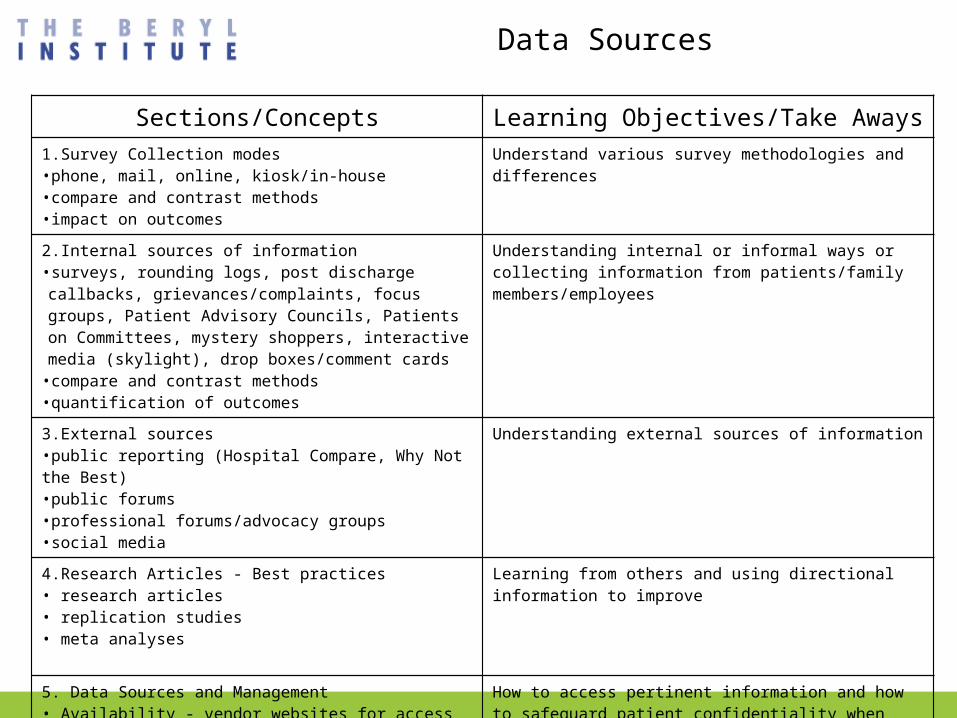
Data Sources
Sections/Concepts Learning Objectives/Take Aways1.Survey Collection modes•phone, mail, online, kiosk/in-house•compare and contrast methods•impact on outcomes
Understand various survey methodologies and differences
2.Internal sources of information•surveys, rounding logs, post discharge callbacks, grievances/complaints, focus groups, Patient Advisory Councils, Patients on Committees, mystery shoppers, interactive media (skylight), drop boxes/comment cards
•compare and contrast methods•quantification of outcomes
Understanding internal or informal ways or collecting information from patients/family members/employees
3.External sources •public reporting (Hospital Compare, Why Not the Best)•public forums•professional forums/advocacy groups•social media
Understanding external sources of information
4.Research Articles - Best practices• research articles• replication studies• meta analyses
Learning from others and using directional information to improve
5. Data Sources and Management• Availability - vendor websites for access to information•Internal analysis or databases• Ethical Data management
How to access pertinent information and how to safeguard patient confidentiality when using patient experience data
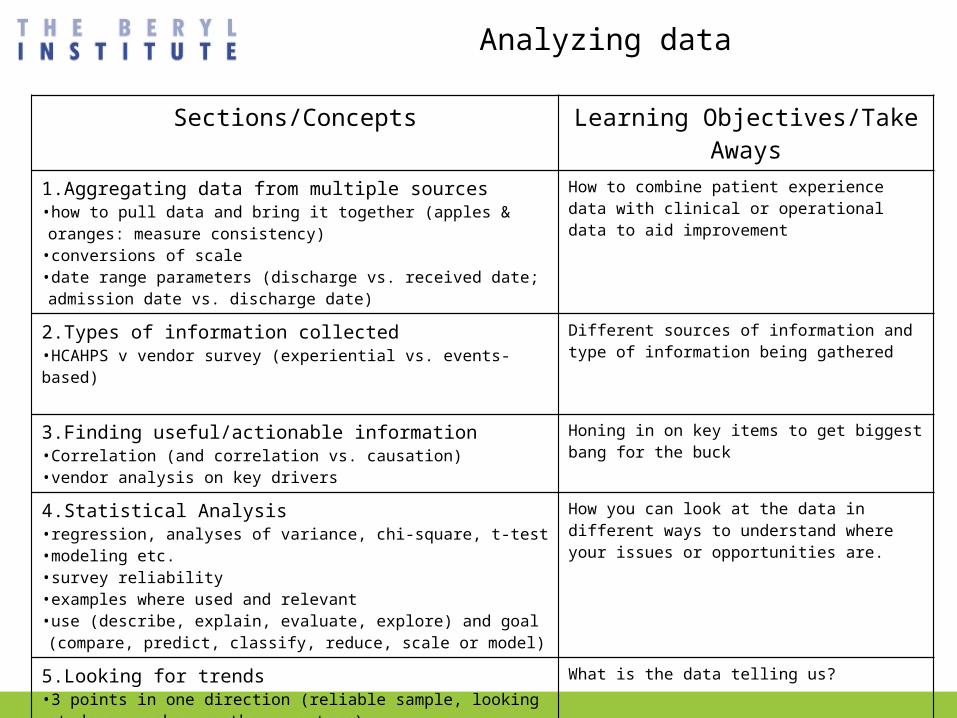
Analyzing data
Sections/Concepts Learning Objectives/Take Aways1.Aggregating data from multiple sources •how to pull data and bring it together (apples & oranges: measure consistency)
•conversions of scale•date range parameters (discharge vs. received date; admission date vs. discharge date)
How to combine patient experience data with clinical or operational data to aid improvement
2.Types of information collected •HCAHPS v vendor survey (experiential vs. events-based)
Different sources of information and type of information being gathered
3.Finding useful/actionable information•Correlation (and correlation vs. causation) •vendor analysis on key drivers
Honing in on key items to get biggest bang for the buck
4.Statistical Analysis •regression, analyses of variance, chi-square, t-test •modeling etc. •survey reliability•examples where used and relevant •use (describe, explain, evaluate, explore) and goal (compare, predict, classify, reduce, scale or model)
How you can look at the data in different ways to understand where your issues or opportunities are.
5.Looking for trends•3 points in one direction (reliable sample, looking at days, weeks, months, quarters)
•Run charts, control charts, histograms, paretos
What is the data telling us?
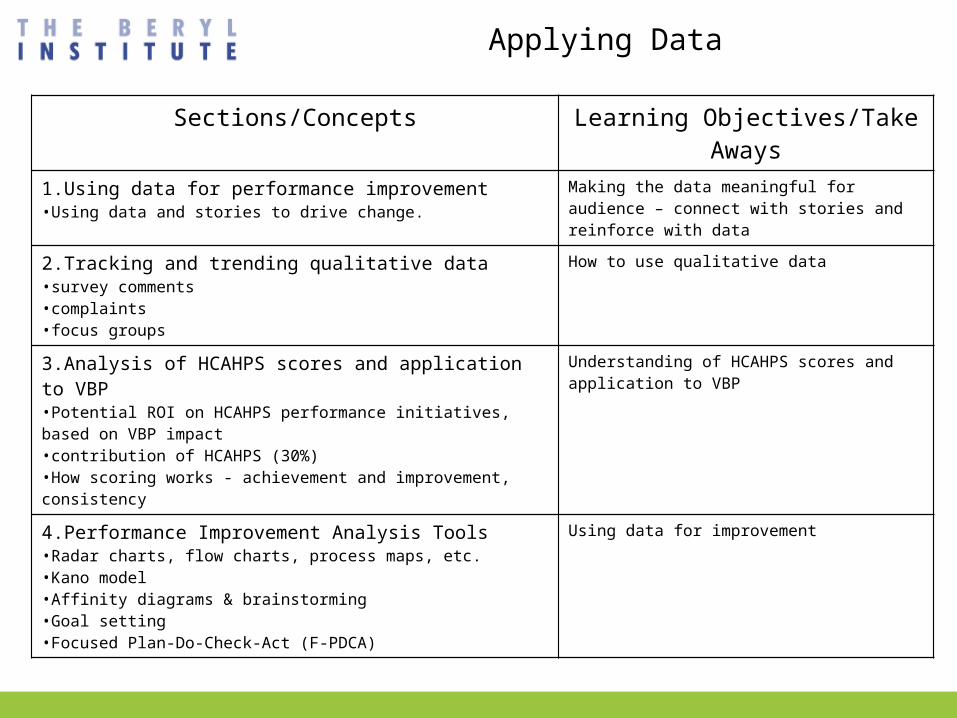
Applying Data
Sections/Concepts Learning Objectives/Take Aways1.Using data for performance improvement•Using data and stories to drive change.
Making the data meaningful for audience – connect with stories and reinforce with data
2.Tracking and trending qualitative data•survey comments •complaints•focus groups
How to use qualitative data
3.Analysis of HCAHPS scores and application to VBP•Potential ROI on HCAHPS performance initiatives, based on VBP impact•contribution of HCAHPS (30%) •How scoring works - achievement and improvement, consistency
Understanding of HCAHPS scores and application to VBP
4.Performance Improvement Analysis Tools •Radar charts, flow charts, process maps, etc. •Kano model•Affinity diagrams & brainstorming•Goal setting •Focused Plan-Do-Check-Act (F-PDCA)
Using data for improvement
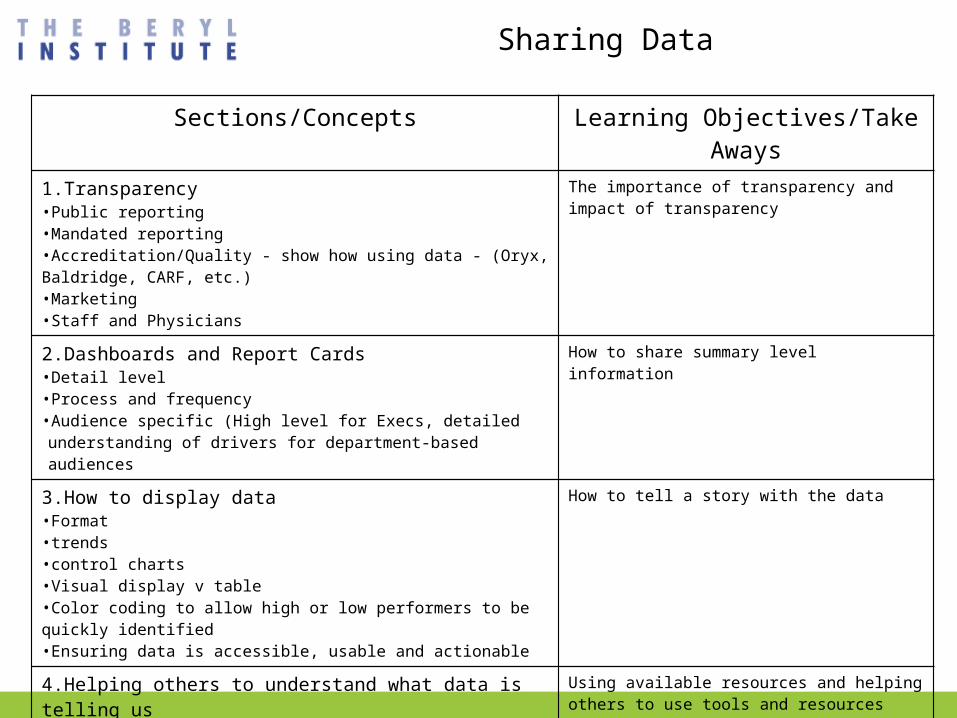
Sharing Data
Sections/Concepts Learning Objectives/Take Aways1.Transparency•Public reporting•Mandated reporting•Accreditation/Quality - show how using data - (Oryx, Baldridge, CARF, etc.)•Marketing•Staff and Physicians
The importance of transparency and impact of transparency
2.Dashboards and Report Cards •Detail level •Process and frequency •Audience specific (High level for Execs, detailed understanding of drivers for department-based audiences
How to share summary level information
3.How to display data •Format•trends •control charts •Visual display v table •Color coding to allow high or low performers to be quickly identified •Ensuring data is accessible, usable and actionable
How to tell a story with the data
4.Helping others to understand what data is telling us•Coaching others •Use of vendor tools
Using available resources and helping others to use tools and resources (teach them how to fish)
5.Hardwiring distribution and discussion of metrics •push or pull or mix of both •Intranet based-dashboards•Format/structure of Committees, teams, initiatives, champions, interdisciplinary
Options for using data to ensure sustainability
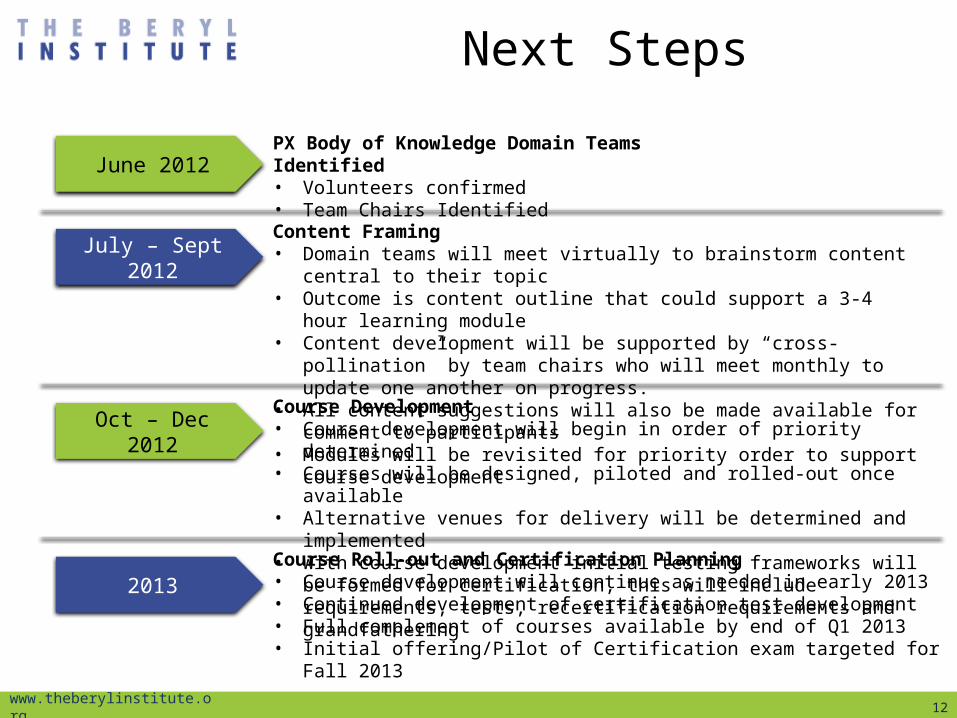
Next Steps
June 2012PX Body of Knowledge Domain Teams Identified• Volunteers confirmed• Team Chairs Identified
July – Sept 2012Content Framing• Domain teams will meet virtually to brainstorm content central to their topic• Outcome is content outline that could support a 3-4 hour learning module• Content development will be supported by “cross-pollination” by team chairs who
will meet monthly to update one another on progress.• All content suggestions will also be made available for comment to participants• Modules will be revisited for priority order to support course development
Oct – Dec 2012Course Development• Course development will begin in order of priority determined• Courses will be designed, piloted and rolled-out once available• Alternative venues for delivery will be determined and implemented• With course development initial testing frameworks will be formed for certification,
this will include requirements, tests, recertification requirements and grandfathering
2013Course Roll-out and Certification Planning• Course development will continue as needed in early 2013• Continued development of certification test development• Full complement of courses available by end of Q1 2013• Initial offering/Pilot of Certification exam targeted for Fall 2013
12www.theberylinstitute.org


![arXiv:1603.01700v2 [stat.ML] 1 Aug 2016 · arXiv:1603.01700v2 [stat.ML] 1 Aug 2016 HIGH-DIMENSIONAL METRICS IN R VICTOR CHERNOZHUKOV, CHRISTIAN HANSEN, MARTIN SPINDLER Abstract. The](https://cdn.vdocument.in/doc/165x107/5ec3d3bbc2c2f25aa555ae26/arxiv160301700v2-statml-1-aug-2016-arxiv160301700v2-statml-1-aug-2016.jpg)
