Patterns of Coral Disease across the HawaiianArchipelago: Relating Disease to EnvironmentGreta S. Aeby1*, Gareth J. Williams2,3*, Erik C. Franklin1, Jean Kenyon4, Evelyn F. Cox5,6, Steve Coles7,
Thierry M. Work8
1 Hawai’i Institute of Marine Biology, University of Hawaii, Kaneohe, Hawai’i, United States of America, 2 School of Biological Sciences, Victoria University of Wellington,
Wellington, New Zealand, 3 Center for Marine Biodiversity and Conservation, Scripps Institution of Oceanography, La Jolla, California, United States of America, 4 Joint
Institute for Marine and Atmospheric Research, University of Hawai’i, and NOAA Pacific Islands Fisheries Science Center, Honolulu, Hawai’i, United States of America,
5 University of Hawai’i — West Oahu, Pearl City, Hawai’i, United States of America, 6 Hawai’i Institute of Marine Biology, Kane’ohe, Hawai’i, United States of America,
7 Bishop Museum, Honolulu, Hawai’i, United States of America, 8 U. S. Geological Survey, National Wildlife Health Center, Honolulu Field Station, Honolulu, Hawai’i, United
States of America
Abstract
In Hawaii, coral reefs occur across a gradient of biological (host abundance), climatic (sea surface temperature anomalies)and anthropogenic conditions from the human-impacted reefs of the main Hawaiian Islands (MHI) to the pristine reefs ofthe northwestern Hawaiian Islands (NWHI). Coral disease surveys were conducted at 142 sites from across the Archipelagoand disease patterns examined. Twelve diseases were recorded from three coral genera (Porites, Montipora, Acropora) withPorites having the highest prevalence. Porites growth anomalies (PorGAs) were significantly more prevalent within andindicative of reefs in the MHI and Porites trematodiasis (PorTrm) was significantly more prevalent within and indicative ofreefs in the NWHI. Porites tissue loss syndrome (PorTLS) was also important in driving regional differences but thatrelationship was less clear. These results highlight the importance of understanding disease ecology when interpretingpatterns of disease occurrence. PorTrm is caused by a parasitic flatworm that utilizes multiple hosts during its life cycle (fish,mollusk and coral). All three hosts must be present for the disease to occur and higher host abundance leads to higherdisease prevalence. Thus, a high prevalence of PorTrm on Hawaiian reefs would be an indicator of a healthy coral reefecosystem. In contrast, the high occurrence of PorGAs within the MHI suggests that PorGAs are related, directly or indirectly,to some environmental co-factor associated with increased human population sizes. Focusing on the three indicatordiseases (PorGAs, PorTrm, PorTLS) we used statistical modeling to examine the underlying associations between diseaseprevalence and 14 different predictor variables (biotic and abiotic). All three diseases showed positive associations with hostabundance and negative associations with thermal stress. The association with human population density differed amongdisease states with PorGAs showing a positive and PorTrm showing a negative association, but no significant explanatorypower was offered for PorTLS.
Citation: Aeby GS, Williams GJ, Franklin EC, Kenyon J, Cox EF, et al. (2011) Patterns of Coral Disease across the Hawaiian Archipelago: Relating Disease toEnvironment. PLoS ONE 6(5): e20370. doi:10.1371/journal.pone.0020370
Editor: Christian R. Voolstra, King Abdullah University of Science and Technology, Saudi Arabia
Received January 18, 2011; Accepted May 1, 2011; Published May 31, 2011
Copyright: � 2011 Aeby et al. This is an open-access article distributed under the terms of the Creative Commons Attribution License, which permitsunrestricted use, distribution, and reproduction in any medium, provided the original author and source are credited.
Funding: GW was supported by a Victoria University of Wellington (VUW) Vice-Chancellor’s Strategic Research Scholarship and a New Zealand InternationalDoctoral Research Scholarship. GA was supported by the Papahanaumokuakea Marine National Monument—Hawaii Institute of Marine Biology MOA. Funding forthis research came, in part, from the Hawaii Coral Reef Initiative and the Papahanaumokuakea Marine National Monument—Hawaii Institute of Marine BiologyMOA. The funders had no role in study design, data collection and analysis, decision to publish, or preparation of the manuscript.
Competing Interests: The authors have declared that no competing interests exist.
* E-mail: [email protected] (GSA); [email protected] (GJW)
Introduction
Coral disease has emerged as a serious threat to coral reefs
worldwide and a major cause of reef deterioration [1]. The numbers
of diseases, coral species affected, and the distribution of diseases
have all increased dramatically within the last decade [2,3,4,5].
Epizootics of coral disease have resulted in significant losses of coral
cover. An outbreak of white band disease in the 1980s killed
acroporid corals throughout the Caribbean [6,7], and a recent
outbreak of white pox disease in the Florida Keys reduced the cover
of Acropora palmata by up to 70% [8]. In the Caribbean, coral disease
has been implicated as a major factor contributing to the
catastrophic decline of coral reefs, resulting in an apparent
ecological phase shift from coral to algal-dominated ecosystems
[2,4,6,9]. Disease is now emerging as a problem in the Indo-Pacific.
The Australian Institute of Marine Science Long Term Monitoring
Program (AIMS LTMP) documented a 22- to 150-fold increase in
white syndrome between 1998 and 2003 on the Great Barrier Reef
[10]. Coral disease has also been reported from the Philippines
[11,12], Indonesia [13], the Marshall Islands and Palau [14],
American Samoa [15,16], and the US remote Pacific Island areas
[17,18,19].
Disease emerges from a complex interplay between host, agent
and environment [20,21,22,23]. Disease prevalence and distribu-
tion depends on host distribution, abundance and environmental
cofactors [20,21,22,24]. A basic premise of epidemiology is that
increased host abundance enhances introduction and maintenance
of infectious disease [25,26,27]. Coral disease is no exception with
numerous studies finding a relationship between disease preva-
lence and host abundance [28,29,30,31,32]. Increased anthropo-
PLoS ONE | www.plosone.org 1 May 2011 | Volume 6 | Issue 5 | e20370

genic stress on nearshore environments, overfishing, and environ-
mental conditions associated with global climate change have all
been implicated as contributing to increased coral disease
[20,21,24]. For example, increases in black-band disease were
observed by Antonius [33] in polluted waters near industrialized
areas and by Bruckner et al. [34] in areas where high
sedimentation and algal overgrowth prevailed. Raymundo et al.
[35] found that marine protected areas had higher fish diversity
and lower disease prevalence than overfished reefs. Bruno et al.
[28] reported that outbreaks of white syndrome in scleractinian
corals on the GBR were not only correlated with host abundance
but also with warm sea surface temperature anomalies. Increasing
local human pressures combined with environmental changes
associated with global climate change place coral reefs, worldwide,
at risk for collapse. If we are to maintain our coral reef resources
then a better understanding is needed of environmental cofactors
in occurrence of disease.
Hawaii, is in the unique position of having coral reefs which
occur across a wide gradient of biological (host abundance),
climatic (sea surface temperature anomalies) and anthropogenic
conditions from the heavily human-impacted reefs of the eight,
main Hawaiian Islands (MHI) to the relatively pristine reefs of the
northwestern Hawaiian Islands (NWHI). The MHI are severely
overfished compared to the NWHI [36] and suffer from chronic
problems such as coastal development and subsequent terrestrial
runoff, coastal pollution from injection wells and sewage spills and
human activities associated with tourism and marine recreation
[37]. Thus, the Hawaiian archipelago can serve as a ‘natural’
experiment to examine which factors may be important in
influencing patterns of coral disease in the field. Our objectives
were to: 1) document the types, frequency of occurrence and
prevalence of coral disease across the Hawaiian archipelago, 2)
determine whether there were any genus level differences in
disease susceptibility in Hawaii, 3) examine whether patterns of
disease occurrence differ between regions (MHI vs. NWHI) or
within regions (among islands), and 4) focusing on three indicator
diseases, use statistical modeling to explore underlying associations
between disease prevalence and 14 different predictor variables
(biotic and abiotic) that could affect disease processes or help
explain presence of disease.
Methods
Study areaThe Hawaiian archipelago is one of the most isolated
archipelagos in the world spanning over 2,500 km from the island
of Hawai’i in the southeast to Kure Atoll in the northwest
(Figure 1). It is composed of two regions: the populated eight main
Hawaiian Islands (MHI) and the mostly uninhabited islands, atolls
and banks of the Northwestern Hawaiian Islands (NWHI). The
MHI consists of high volcanic islands with non-structural reef
communities and fringing reefs abutting the shore. Approximately
1.2 million people live in the MHI with another nearly seven
million tourists visiting Hawaii each year [37]. This large
population of residents and visitors has affected the coral reefs of
Hawaii through urban development, land-based sources of
pollution, overfishing, and recreational overuse. In contrast, the
majority of the islands, shoals and atolls within the NWHI are
uninhabited, except for Midway, which has been continuously
occupied by a limited number of people since 1908, and Kure,
Laysan Island, French Frigate Shoals and recently Lisianski, which
have been intermittently occupied over the last century. The
remoteness and limited reef fishing activities in the NWHI have
resulted in significantly reduced anthropogenic impacts to this
region as compared to the MHI [37].
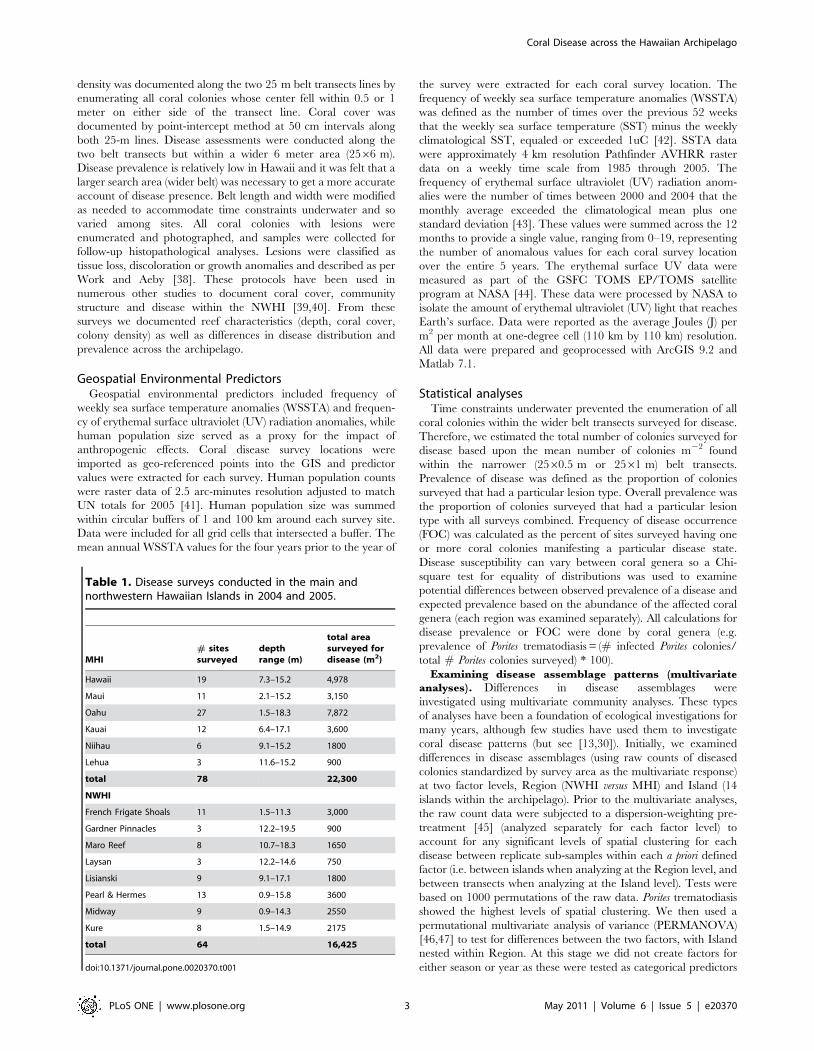
Disease surveysSurveys were conducted at 78 sites from six different islands
within the MHI in 2004 (May, June) and 2005 (February, June,
July) and 64 sites from eight different islands/atolls in the NWHI
in 2004 (September and October) (Table 1). These surveys were
conducted as part of larger multi-agency studies obtaining baseline
information on coral reefs throughout the Hawaiian archipelago
and so were constrained as to location and timing of the surveys.
At each site, two consecutive 25 m lines, separated by approxi-
mately 5 m, were deployed along depth contours. Coral colony
Figure 1. Map of the Hawaiian archipelago.doi:10.1371/journal.pone.0020370.g001
Coral Disease across the Hawaiian Archipelago
PLoS ONE | www.plosone.org 2 May 2011 | Volume 6 | Issue 5 | e20370
density was documented along the two 25 m belt transects lines by
enumerating all coral colonies whose center fell within 0.5 or 1
meter on either side of the transect line. Coral cover was
documented by point-intercept method at 50 cm intervals along
both 25-m lines. Disease assessments were conducted along the
two belt transects but within a wider 6 meter area (2566 m).
Disease prevalence is relatively low in Hawaii and it was felt that a
larger search area (wider belt) was necessary to get a more accurate
account of disease presence. Belt length and width were modified
as needed to accommodate time constraints underwater and so
varied among sites. All coral colonies with lesions were
enumerated and photographed, and samples were collected for
follow-up histopathological analyses. Lesions were classified as
tissue loss, discoloration or growth anomalies and described as per
Work and Aeby [38]. These protocols have been used in
numerous other studies to document coral cover, community
structure and disease within the NWHI [39,40]. From these
surveys we documented reef characteristics (depth, coral cover,
colony density) as well as differences in disease distribution and
prevalence across the archipelago.
Geospatial Environmental PredictorsGeospatial environmental predictors included frequency of
weekly sea surface temperature anomalies (WSSTA) and frequen-
cy of erythemal surface ultraviolet (UV) radiation anomalies, while
human population size served as a proxy for the impact of
anthropogenic effects. Coral disease survey locations were
imported as geo-referenced points into the GIS and predictor
values were extracted for each survey. Human population counts
were raster data of 2.5 arc-minutes resolution adjusted to match
UN totals for 2005 [41]. Human population size was summed
within circular buffers of 1 and 100 km around each survey site.
Data were included for all grid cells that intersected a buffer. The
mean annual WSSTA values for the four years prior to the year of
the survey were extracted for each coral survey location. The
frequency of weekly sea surface temperature anomalies (WSSTA)
was defined as the number of times over the previous 52 weeks
that the weekly sea surface temperature (SST) minus the weekly
climatological SST, equaled or exceeded 1uC [42]. SSTA data
were approximately 4 km resolution Pathfinder AVHRR raster
data on a weekly time scale from 1985 through 2005. The
frequency of erythemal surface ultraviolet (UV) radiation anom-
alies were the number of times between 2000 and 2004 that the
monthly average exceeded the climatological mean plus one
standard deviation [43]. These values were summed across the 12
months to provide a single value, ranging from 0–19, representing
the number of anomalous values for each coral survey location
over the entire 5 years. The erythemal surface UV data were
measured as part of the GSFC TOMS EP/TOMS satellite
program at NASA [44]. These data were processed by NASA to
isolate the amount of erythemal ultraviolet (UV) light that reaches
Earth’s surface. Data were reported as the average Joules (J) per
m2 per month at one-degree cell (110 km by 110 km) resolution.
All data were prepared and geoprocessed with ArcGIS 9.2 and
Matlab 7.1.
Statistical analysesTime constraints underwater prevented the enumeration of all
coral colonies within the wider belt transects surveyed for disease.
Therefore, we estimated the total number of colonies surveyed for
disease based upon the mean number of colonies m22 found
within the narrower (2560.5 m or 2561 m) belt transects.
Prevalence of disease was defined as the proportion of colonies
surveyed that had a particular lesion type. Overall prevalence was
the proportion of colonies surveyed that had a particular lesion
type with all surveys combined. Frequency of disease occurrence
(FOC) was calculated as the percent of sites surveyed having one
or more coral colonies manifesting a particular disease state.
Disease susceptibility can vary between coral genera so a Chi-
square test for equality of distributions was used to examine
potential differences between observed prevalence of a disease and
expected prevalence based on the abundance of the affected coral
genera (each region was examined separately). All calculations for
disease prevalence or FOC were done by coral genera (e.g.
prevalence of Porites trematodiasis = (# infected Porites colonies/
total # Porites colonies surveyed) * 100).
Examining disease assemblage patterns (multivariate
analyses). Differences in disease assemblages were
investigated using multivariate community analyses. These types
of analyses have been a foundation of ecological investigations for
many years, although few studies have used them to investigate
coral disease patterns (but see [13,30]). Initially, we examined
differences in disease assemblages (using raw counts of diseased
colonies standardized by survey area as the multivariate response)
at two factor levels, Region (NWHI versus MHI) and Island (14
islands within the archipelago). Prior to the multivariate analyses,
the raw count data were subjected to a dispersion-weighting pre-
treatment [45] (analyzed separately for each factor level) to
account for any significant levels of spatial clustering for each
disease between replicate sub-samples within each a priori defined
factor (i.e. between islands when analyzing at the Region level, and
between transects when analyzing at the Island level). Tests were
based on 1000 permutations of the raw data. Porites trematodiasis
showed the highest levels of spatial clustering. We then used a
permutational multivariate analysis of variance (PERMANOVA)
[46,47] to test for differences between the two factors, with Island
nested within Region. At this stage we did not create factors for
either season or year as these were tested as categorical predictors
Table 1. Disease surveys conducted in the main andnorthwestern Hawaiian Islands in 2004 and 2005.
MHI# sitessurveyed
depthrange (m)
total areasurveyed fordisease (m2)
Hawaii 19 7.3–15.2 4,978
Maui 11 2.1–15.2 3,150
Oahu 27 1.5–18.3 7,872
Kauai 12 6.4–17.1 3,600
Niihau 6 9.1–15.2 1800
Lehua 3 11.6–15.2 900
total 78 22,300
NWHI
French Frigate Shoals 11 1.5–11.3 3,000
Gardner Pinnacles 3 12.2–19.5 900
Maro Reef 8 10.7–18.3 1650
Laysan 3 12.2–14.6 750
Lisianski 9 9.1–17.1 1800
Pearl & Hermes 13 0.9–15.8 3600
Midway 9 0.9–14.3 2550
Kure 8 1.5–14.9 2175
total 64 16,425
doi:10.1371/journal.pone.0020370.t001
Coral Disease across the Hawaiian Archipelago
PLoS ONE | www.plosone.org 3 May 2011 | Volume 6 | Issue 5 | e20370

during the modeling stages of the analyses (see below). The
PERMANOVA analysis was based on a zero-adjusted Bray-Curtis
similarity matrix [48], type III partial sums of squares, and 9999
random permutations of the residuals under the reduced model.
PERMANOVA pair-wise interactions were used to identify
significant differences in disease assemblages between islands
within each region.
To identify indicator diseases between the two regions (those
contributing most to the patterns in multivariate space), we used a
constrained canonical analysis of principal coordinates (CAP)
[49,50]. We calculated Spearman rank correlations of the
canonical ordination axes with the original disease variables.
Diseases with strong correlations (defined as $0.7 in this study)
were then overlaid as a bi-plot. A similarity percentages (SIMPER)
analysis [51] was used to identify indicator diseases between
islands within each region. SIMPER is not a statistical test, but is
useful for initial data exploration.
Modeling disease-environment associations. Three
regional indicator diseases were identified in the multivariate
analyses, which were then modeled against 14 predictor variables
(Table 2). Predictor variables included biotic and abiotic variables
that could affect disease processes or help explain presence of
disease and included coral host abundance, measures of overall
coral reef state (coral cover, macroalga cover), potential stressors
(weekly sea surface temperature anomalies (WSSTA)), ultraviolet
radiation input, local (within 1 km of the site) and regional (within
100 km) human population sizes and variables involved with
sampling design, such as month or year of surveys and survey
effort. To investigate the association of the abundance of each
disease with the predictor variables, we used a permutational
distance-based multiple regression technique (DISTLM) [47]. The
technique is robust to zero-inflated data sets, such as ours, and
makes no assumptions about the distribution of the response
variable (normality does not have to be satisfied). No two
predictors exceeded an inter-correlation value of 0.75. Predictors
were normalized and fitted conditionally in a step-wise manner,
with tests based on 9999 permutations of the residuals under the
reduced model [47]. Model selection was based on Akaike’s
Information Criterion [52] with a second-order bias correction
applied (AICc) [53,54]. To interpret the relationship between
disease prevalence and the optimal predictor(s), we used distance-
based redundancy analysis plots (dbRDA) [47]. We modeled two
response variables for each disease: prevalence (proportion of hosts
found to be diseased) and diseased colony raw counts. This was to
examine for differences between the two model responses but also
to allow disease abundance to be standardized against area
surveyed (survey effort) in the case of the raw counts. Modeling
analyses were based on zero-adjusted Bray-Curtis similarity
matrices [48] and conducted in PRIMER v6 [51] and
PERMANOVA+ [55]. All models, raw counts/prevalence, were
created for each coral disease separately, as recommended by
Williams et al. [32].
Results
Lesion descriptions and overall disease occurrence acrossthe Hawaiian archipelago
Twelve types of lesions were identified from the 3 coral genera,
Porites, Montipora, and Acropora, from across the archipelago (Fig. 2).
Eight diseases were documented from reefs within the MHI and
10 diseases from the NWHI with overlap in types of diseases (6 of
12) between regions. Signs of coral disease were widespread
occurring at 87.2% of the sites surveyed within the MHI and 80%
within the NWHI. Frequency of occurrence varied between
diseases with some diseases, such as Porites trematodiasis (PorTrm),
found archipelago-wide whereas other diseases, such as growth
anomalies, found predominantly within one region (MHI)
(Table 3). Average prevalence of all diseases, except PorTrm,
was low (,1%) (Table 4). The average prevalence of PorTrm
across the archipelago was 5.3% (range 0–87%).
Differences in disease among coral taxaCoral taxa differed in manifestation of lesions with seven
diseases described from Porites (PorTrem, PorGA, PorMFTL,
PorTL, Por bl w/TL, Por BND, Por DTTD), three from Montipora
(MontWS, MontMFTL, MontGA) and two from Acropora
Table 2. Predictor variables used in the modeling analyses with their codes and units.
Variable Code Description and units Min Max
Porites cover PorCov % cover , 1 91
Porites density PorDen # colonies/m2 , 1 10.4
Overall coral cover OverallCov % cover , 1 91
Overall coral density OverallDen # colonies/m2 , 1 21
Macroalgae cover Algae % cover
Depth Depth m 1 18
WSSTA frequency for survey year WSSTAyr number of events 0 22
WSSTA frequency during prior 4 yearsprior to survey year
WSSTAfour mean number 2 19
Human numbers within 1 km HumPop1 number of people 0 32,406
Human numbers within 100 km HumPop100 number of people 0 954,480
UV input UV rating scale 0 10
Month Month month of survey – –
Year Year year of survey – –
Survey effort Area m2 of reef 150 300
Min/Max, minimum and maximum predictor values between sites.doi:10.1371/journal.pone.0020370.t002
Coral Disease across the Hawaiian Archipelago
PLoS ONE | www.plosone.org 4 May 2011 | Volume 6 | Issue 5 | e20370

Coral Disease across the Hawaiian Archipelago
PLoS ONE | www.plosone.org 5 May 2011 | Volume 6 | Issue 5 | e20370

(AcroWS, AcroGA) (Fig. 2). No disease signs were found on
Pocillopora during these surveys. Prevalence of disease also varied
among coral taxa with Porites having the highest prevalence and
Pocillopora the lowest (Fig. 3) and these differences were consistent
across regions (MHI: X2 = 1184.8, df = 2, p,0.001; NWHI:
X2 = 928.4, df = 3, p,0.001).
Disease assemblage patterns between regionsDisease assemblages differed significantly between regions
(Pseudo-F = 9.905, P = 0.0001), with three diseases, Porites tremato-
diasis (PorTrem), Porites growth anomalies (PorGA), and Porites
tissue loss syndrome (PorTL) contributing most strongly to driving
this separation (Fig. 4). Increased levels of PorTrem were
associated with the Northwestern Hawaiian Islands (French
Frigate Shoals, Kure, Maro, Laysan and Lisianski) and average
prevalence of PorTrem was significantly higher in the NWHI
(10.762.2%) compared to the MHI (1.160.3%) (Wilcoxon two
sample test, W = 4756, p,0.001; Table 4). PorGAs were positively
associated with the main Hawaiian Islands (Maui, Hawaii, Oahu,
and Kauai) and the average prevalence of PorGAs was
significantly higher in the MHI (0.6460.15%) as compared to
the NWHI (0.3260.3%) (Wilcoxon two sample test, W = 3177,
p,0.001; Table 4). The patterns of PorTLS prevalence were more
difficult to interpret but seemed to be positively associated with
some islands within the Northwestern Hawaiian Islands (Pearl and
Hermes, and to a lesser extent French Frigate Shoals, Kure,
Lisianski, Laysan and Maro), but negatively associated with other
islands (Midway and Gardner) and the islands of Niihau and
Lehua within the MHI (Fig. 4). Average prevalence of PorTLS did
not differ between regions (Wilcoxon two sample test, W = 4990,
p = 0.08; Table 4).
Disease assemblage patterns within regionsDisease assemblages differed significantly between islands within
each region (Pseudo-F = 3.208, P = 0.0001; Table 5). Within the
main Hawaiian Islands, differences in disease assemblages between
islands were predominantly driven by PorGAs, with the disease
particularly characteristic of Oahu and Maui (Table 6 & Fig. S1).
PorTrem was also an influential disease, particularly characteristic
of Hawaii (Table 6 & Fig. S1). Within the northwestern Hawaiian
Islands, PorTrem was consistently an important indicator disease
separating islands (Table 6 & Fig. S2). The disease was particularly
characteristic of Laysan and Maro. Montipora white syndrome
Table 3. Frequency of occurrence (FOC) of different coraldiseases within the main and northwestern Hawaiian Islands.
MHI NWHI
Por Trem 67.5 75.4
Por GA 59.7 4.9
Por TLS 22.1 32.8
Por bl TL 9.1 0
Por MFTL 6.5 0
Por DTTS 0 19.7
Por BND 0 3.3
Mont GA 26.9 4.5
Mont WS 14.1 27.3
Mont MFTL 14.1 11.4
Acro WS - 33.3
Acro GA - 22.2
FOC represents the proportion of total surveys (%), which contained corals(presence/absence) affected by each particular disease. 78 sites were surveyedwithin the main Hawaiian Islands and 64 sites surveyed in the northwesternHawaiian Islands.Por = Porites, Mont = Montipora, Acro = Acropora, Trem = trematodiasis,GA = growth anomaly, TLS = tissue loss syndrome, MFTL = multi-focal tissue loss,bl = bleaching, DTTS = discolored tissue thinning syndrome, BND = brownnecrotizing disease, WS = white syndrome. ‘-‘ indicates that particular coralgenera was not present in transects.doi:10.1371/journal.pone.0020370.t003
Table 4. Average prevalence of diseases found on the reefswithin the main and northwestern Hawaiian Islands.
MHI NWHI
Por Trem* 1.1 (0.3) 10.7 (2.2)
Por GA * 0.64 (0.15) 0.32 (0.3)
Por TLS 0.11 (0.03) 0.82 (0.28)
Por bl TL 0.04 (0.03) 0
Por MFTL 0.006 (0.003) 0
Por DTTS 0 0.31 (0.12)
Por BND 0 0.02 (0.02)
Mont GA 0.06 (0.02) 0.009 (0.009)
Mont WS 0.06 (0.02) 0.17 (0.06)
Mont MFTL 0.0007 (0.0007) 0.35 (0.2)
Acro WS - 0.76 (0.4)
Acro GA - 0
78 sites were surveyed within the main Hawaiian Islands and 64 sites surveyedin the northwestern Hawaiian Islands. Standard error in parentheses. * indicatesa significant difference between regions based upon the Wilcoxon two sampletest. Por = Porites, Mont = Montipora, Acro = Acropora, Trm = trematodiasis,GA = growth anomaly, TLS = tissue loss syndrome, MFTL = multi-focal tissue loss,bl = bleaching, DTTS = discolored tissue thinning syndrome, BND = brownnecrotizing disease, WS = white syndrome. ‘-‘ indicates that particular coralgenera was not present in transects.doi:10.1371/journal.pone.0020370.t004
Figure 2. Photos and description of coral diseases observed during surveys across the Hawaiian archipelago. All lesions have beencharacterized histologically and those results will be presented elsewhere. A) Acropora white syndrome (AcroWS): diffuse areas of acute to subacutetissue loss, B) Acropora growth anomalies (AcroGA): protuberant growths of skeleton accompanied by aberrant calyx formation overlaid by normallypigmented to colorless tissues, C) Montipora multifocal tissue loss (MontMFTL): multiple (.5) variably sized areas of acute to subacute tissue loss, D)Montipora white syndrome (MontWS): one to 5 areas of acute to subacute tissue loss, E) Montipora growth anomalies (MontGA): protuberant growthsof skeleton accompanied by aberrant calyx formation overlaid by normally pigmented to colorless tissues, F) Porites trematodiasis (PorTrem): multiplesmall (,5 mm) swollen pink to white nodules, G) Porites tissue loss syndrome (PorTLS): one to 5 areas of acute to subacute tissue loss, H) Poritesmulti-focal tissue loss (PorMFTL): multiple (.5) variably sized areas of acute to subacute tissue loss, I) Porites growth anomalies (PorGA): protuberantgrowths of skeleton accompanied by aberrant calyx formation overlaid by normally pigmented to colorless tissues, J) Porites brown necrotizingdisease (PorBND): diffuse areas of unidentified brown homogenous matrix (not algae) obliterating underlying area of tissue loss and well delineatedfrom surrounding normal tissue, K) Porites bleaching with tissue loss (Por bl w/TL): focal areas of bleaching with diffuse areas of acute to subacutetissue loss, L) Porites discolored tissue thinning syndrome (PorDTTS): distinct areas of tissue thinning and pallor. Arrows indicate lesions.doi:10.1371/journal.pone.0020370.g002
Coral Disease across the Hawaiian Archipelago
PLoS ONE | www.plosone.org 6 May 2011 | Volume 6 | Issue 5 | e20370

(MontWS) was also an important indicator disease, separating
Maro out from the other islands (Table 6 & Fig. S2).
Disease-environment associationsPorites trematodiasis. PorTrem prevalence was optimally
predicted by survey area (explaining 19.4% of the variation in
prevalence), with prevalence decreasing as survey area increased
(Table 7). However, when the number of cases of PorTrem, were
standardized against survey area, Porites cover was the optimal
predictor (explaining 15.9% of variation in prevalence); with cases
of PorTrem positively associated with increases in Porites cover.
PorTrem prevalence also increased as human population numbers
within a 100 km radius decreased and where Porites colony
densities were reduced (i.e. relatively few, but large colonies
present) (Table 7).
Porites growth anomalies. PorGA abundance (both
prevalence and number of cases) was optimally predicted by the
average number of WSSTAs in the four years prior to year of
surveying, explaining 14.9% and 16.6% of the variation in the two
model responses, respectively (Table 7). PorGA abundance
decreased as the mean frequency of WSSTAs increased. PorGA
abundance was also higher in shallower depths and was positively
associated with overall coral cover, frequency of UV radiation
anomalies and human population sizes within a 100 km radius
(Table 7).
Porites tissue loss syndrome. PorTLS prevalence was
optimally predicted by survey area (explaining 16.1% of
variation in prevalence), and prevalence decreased as survey
area increased (Table 7). When standardized for differences in
survey area, the number of cases of PorTLS was positively
associated with overall coral cover and negatively associated with
the number of WSSTAs during the year of survey, although the
predictors explained little of the overall variation (Table 7).
Model performanceModel performance varied among diseases. When averaging
across models for both disease prevalence and number of cases,
PorGA was most effectively modeled (36.9% overall variation
explained) and PorTLS least effectively modeled (11.9%). Across
all three diseases and averaging across the two model responses,
mean overall explained variability in disease abundance was
26.7% with unexplained variability equaled to 73.3%.
Discussion
We surveyed 142 sites from across the Hawaiian archipelago,
which spanned a wide range of biotic and abiotic conditions.
Figure 3. Differences among coral taxa in disease prevalence across the Hawaiian archipelago.doi:10.1371/journal.pone.0020370.g003
Figure 4. Constrained CAP ordination of coral disease assem-blages for 136 sites at 14 islands across the Hawaiianarchipelago. Group centroids are displayed for each island (MHI –black, NWHI – red). Ordination is based on a zero-adjusted Bray-Curtiscoefficient. Bi-plot indicates the disease variables (vectors) exerting thestrongest influence on the patterns in multivariate space (in grey). Thelength and direction of each vector indicates the strength and sign,respectively, of the relationship between that disease variable and theCAP axes. Note that Acropora diseases are not included in the analysis.FFS, French Frigate Shoals; P&H, Pearl and Hermes. PorTrem, Poritestrematodiasis; PorTL, Porites tissue loss; PorGA, Porites growthanomalies.doi:10.1371/journal.pone.0020370.g004
Coral Disease across the Hawaiian Archipelago
PLoS ONE | www.plosone.org 7 May 2011 | Volume 6 | Issue 5 | e20370

Twelve different coral diseases were found in three coral genera
(Porites, Montipora, Acropora). Reports of diseases with similar field
signs have been reported from numerous regions across the Indo-
Pacific and include the tissue loss diseases (PorTLS, Por bl w/TL,
PorMFTL, MontWS, MontMFTL and AcropWS) and the growth
anomalies (PorGA, MontGA, AcropGA) [10,11,13,16,18,29,30,
56,57]. Unfortunately, regional comparisons of coral disease are
difficult due to differences in nomenclature of coral diseases and
the paucity of information on ecology and etiology of coral
diseases [23,38]. For example, several studies report all tissue loss
diseases as ‘‘white syndrome’’ regardless of whether the pattern of
tissue loss is diffuse, focal, or multi-focal [10,13,18,29,30]. The
other difference in manner of reporting diseases is indicating
whether or not field signs suggest transmissibility between coral
genera (i.e. whether or not there is evidence of disease progression
between two adjacent coral colonies from different coral genera).
Table 5. Average similarity (%) in coral disease assemblages among islands within (a) the Main Hawaiian Islands and (b) theNorthwestern Hawaiian Islands.
(a) Maui 32.0
Oahu 32.0 32.5
Niihau 32.5* 19.4* 28.5*
Kauai 37.6 31.9* 35.3 48.9*
Lehua 34.3 21.8* 30.1* 80.6 50.3
Hawaii Maui Oahu Niihau Kauai
(b) Gardner 44.1
Maro 24.8* 7.6*
Laysan 24.7 10.9 52.4
Lisianski 27.9* 12.0* 56.4 48.7
P&H 36.6 43.4 29.2* 26.1 28.5*
Midway 43.4 63.7 11.3* 15.6* 16.8* 41.4
Kure 30.0 34.7 37.2* 32.7 32.4 32.1 31.6*
FFS Gardner Maro Laysan Lisianski P&H Midway
*indicates significantly different from each other (P#0.01) using permutational analysis of variance pairwise comparisons. Analyses based on 9999 randompermutations. P&H, Pearl and Hermes.doi:10.1371/journal.pone.0020370.t005
Table 6. Indicator diseases important in explaining differences in disease assemblages among islands within the main andnorthwestern Hawaiian Islands.
Region Significant pairwise interaction Indicator diseases (in order of importance) Characteristic of
MHI Niihau - Hawaii PorTrem, PorGA, MontGA, PorMFTL Hawaii
Niihau - Maui PorGA, MontGA, PorTrem, MWS Maui
Niihau - Oahu PorGA, PorTrem, MWS, PorTLS Oahu
Kauai - Maui PorGA, MontGA, PorTrem, MWS Maui
Kauai - Niihau PorTrem, PorGA Kauai
Lehua - Maui PorGA, MontGA, PorTrem, MWS Maui
Lehua - Oahu PorGA, PorTrem, MWS, PorTLS Oahu
NWHI Maro - French Frigate Shoals PorTrem, MWS Maro
Maro - Gardner PorTrem, MWS Maro
Lisianski - French Frigate Shoals PorTrem Lisianski
Lisianski - Gardner PorTrem Lisianski
Pearl & Hermes - Maro PorTrem, MWS Maro
Pearl & Hermes - Lisianski PorTrem Lisianski
Midway - Maro PorTrem, MWS Maro
Midway - Laysan PorTrem Laysan
Midway - Lisianski PorTrem Lisianski
Kure - Maro PorTrem, MWS Maro
Kure - Midway PorTrem Kure
doi:10.1371/journal.pone.0020370.t006
Coral Disease across the Hawaiian Archipelago
PLoS ONE | www.plosone.org 8 May 2011 | Volume 6 | Issue 5 | e20370

In some field studies, disease can be found progressing from one
colony to others regardless of coral genera and so those could be
considered non-host specific ‘‘white syndromes’’ (Dalton and
Smith 2006, pers. obs.). In contrast, in Hawaii diseased colonies
have been observed adjacent and touching healthy colonies of a
different genus with no disease transmission ever apparent. Given
these field signs, it is be more informative to include the host genus
in the disease name (e.g. Acropora white syndrome) [38].
Surveys also only offer a snapshot in the progression of diseases
and so limit accurate disease diagnosis. For example, we found
Porites multi-focal tissue loss, which has disease signs similar to
Porites ulcerative white spot disease (PUWS) described from reefs in
the Philippines [58]. However, we did not follow disease
progression to determine whether it was consistent with PUWS
or conduct follow-up laboratory analyses, which would be
required to properly identify PUWS.
In general, the average prevalence of diseases on reefs within the
Indo-Pacific are low [10,11,13,17,18,19,40], which is consistent
with our findings for disease, excluding PorTrm, on corals within
the Hawaiian archipelago. However, some coral diseases, such as
PorTrm, can be quite prevalent in the Indo-Pacific at the local
level. We found PorTrm, the most common and prevalent disease
in Hawaii, averaged 5.3% (range = 0 to 87%). Within the
Philippines, Kaczmarsky [12] reported PUWS in up to 53.7% of
the Porites colonies surveyed. In Guam, Myers and Raymundo [29]
reported the average prevalence of white syndrome to be 8.9%
(range = 0–26.3%) and PUWS averaged 2.8% prevalence (range
= 0–17.4%).
Similar to several studies across the Indo-Pacific differential
disease susceptibilities were found among coral taxa. Porites is the
dominant coral on the reefs of the Hawaiian archipelago
comprising 63.5% of the overall coral community within transects
(data not shown). Accordingly, in both regions Porites had the
highest number, widest distribution, and highest prevalence of
diseases as compared to other coral taxa. Kaczmarsky [12] found
high levels of disease in Porites in the Philippines where Porites is
also the dominant coral. Acropora, although a small component of
the Hawaiian coral reef community, had the second highest
prevalence of disease among coral taxa. This is consistent with
other studies, which have found Acropora to be especially vulnerable
to disease in many regions of the Indo-Pacific [10,13,40,59] as well
as the Western Atlantic [7,8,60,61]. In contrast, no signs of disease
were found in Pocillopora in either region, MHI or NWHI. The
Australian GBR is a region where pocilloporids are a small
component of the coral community, yet have high disease
prevalence [10]. Interestingly, skeletal eroding band is the most
prevalent disease on Pocillopora on the GBR and while this disease
was reported once from Hawaii based on presence of ciliates on
bare coral skeleton [62] it has not been verified using observational
data (evidence of disease progression) or histological techniques.
The effect of environmental stress on the dynamics of infectious
disease can vary depending on the underlying host-pathogen-stress
Table 7. Summary results of a distance-based permutational multiple regression analysis for the association of three coral diseaseswith 14 predictor variables across 134 sites throughout the Hawaiian archipelago.
Response Disease Predictor AICc Pseudo-F P value % variability % total Relationship
Prevalence PorTrem Area 959.90 32.057 0.0001 19.4 negative
PorCov 951.11 11.088 0.0002 6.2 positive
HumPop100 937.44 5.5827 0.0002 5.4 negative
PorDen 935.66 2.228 0.0043 2.8 33.8 negative
Counts PorTrem Porites cover 761.40 25.163 0.0001 15.9 positive
WSSTA 4 yr 750.11 13.754 0.0001 7.9 unclear
WSSTA 742.03 10.283 0.0010 5.5 29.3 negative
Prevalence PorGA WSSTA 4 yr 750.68 23.17 0.0001 14.9 negative
Depth 745.11 10.775 0.0005 5.7 negative
UV 728.91 7.7012 0.0038 4.7 unclear
OverallCov 739.68 7.5454 0.0042 4.4 positive
WSSTAyr 737.55 4.1955 0.0310 2.4 negative
HumPop100 722.75 4.6514 0.0229 2.3 34.4 positive
Counts PorGA WSSTA 4 yr 480.93 26.301 0.0001 16.6 negative
UV 470.99 12.305 0.0006 7.2 positive
Overall coral cover 464.43 8.7022 0.0035 4.8 positive
Depth 452.5 9.7621 0.0012 4.8 negative
WSSTAyr 460.15 6.349 0.0113 3.4 unclear
Humans 100 km 445.5 5.3499 0.0210 2.5 39.3 positive
Prevalence PorTL Area 754.58 25.344 0.0001 16.1 16.1 negative
Counts PorTL Overall coral cover 379.28 6.6851 0.0107 4.5 positive
WSSTAyr 376.68 4.6629 0.0311 3.1 7.6 negative
Two response variables are modeled for each disease; prevalence and the number of disease cases. The optimal predictors of each response and the proportion ofvariability in the data set they explained (% variability) are shown. Where possible, the relationship between the response and predictor is displayed. Modeldevelopment was based on step-wise selection and Akaike’s Information Criterion with a second-order bias correction applied (AICc), with the total variation explained(r2) by each model shown (% total). Analyses based on 9999 permutations of the residuals under a reduced model.doi:10.1371/journal.pone.0020370.t007
Coral Disease across the Hawaiian Archipelago
PLoS ONE | www.plosone.org 9 May 2011 | Volume 6 | Issue 5 | e20370

dynamics [22]. For example, if an environmental stress reduces
host abundance below a threshold level then disease prevalence
may decline. Conversely, if the stress compromises the host
increasing its susceptibility to disease, then prevalence might
increase. Accordingly, we found distinct regional differences when
the disease assemblage patterns were examined across the
archipelago. PorGAs were significantly more prevalent within
and indicative of the human-impacted reefs of the MHI but
PorTrm was reduced within the MHI. Instead, PorTrm was
significantly more prevalent within and indicative of the pristine
reefs of the NWHI. PorTLS was also found to be important in
driving the regional differences, although that relationship was less
clear. These results, although surprising and unexpected, highlight
the importance of understanding disease ecology when interpret-
ing patterns of disease occurrence.
PorTrm is caused by the digenetic trematode, Podocotyloides
stenometra Pritchard [63,64,65]. P. stenometra has a complex life cycle
involving a first intermediate host thought to be a mollusk, Porites
as the second intermediate host, and coral-feeding fish as the final
host [64]. Completion of the parasite’s life cycle occurs when
coral-feeding fish ingest the infected polyp, with the adult worm
subsequently residing in the guts of fish [64]. Multiple species of
coral-feeding reef fish can serve as host to the parasite [64,66]. As
such, occurrence of this disease on the reefs requires the presence
of all three of its hosts (mollusk, coral and fish) and so presumably,
a healthier ecosystem supporting a greater diversity of vertebrate
and invertebrate hosts would, in turn, support a greater
abundance of their parasites [67]. Using statistical modeling, we
found PorTrm, when survey area was controlled for, showed
strong positive associations with host abundance (% cover),
consistent with other studies [32,68] and a negative association
with human population size. The NWHI is a healthier ecosystem
than the MHI [69] and has a higher abundance and diversity of
reef fish. Friedlander and DeMartini [36] found the mean fish
standing stock to be 260% higher in the NWHI as compared to
the MHI, and butterflyfish are thought to be the main vector
transmitting PorTrm across the reefs [68]. We suggest that
environmental conditions within the MHI, which also affect host
abundances, are not conducive to widespread transmission of this
parasite, a phenomenon similar to that noted by others where
environmental degradation is associated with reduced parasite
diversity [67]. The pattern of increased PorTrm in healthier
ecosystems was also documented in Kaneohe Bay where southern
reefs, heavily impacted by runoff [70], had significantly lower
levels of PorTrm than relatively cleaner northern reefs [68].
Whereas for many coral diseases, stressors clearly play a role in
increasing disease levels, this does not hold true for PorTrm. In
fact, a high prevalence of PorTrm on Hawaiian reefs appears to be
indicative of a comparatively healthier coral reef ecosystem.
Fortunately, PorTrm is a chronic disease that, although it reduces
coral growth [71,72], does not usually result in colony mortality.
Interestingly, the model also showed a negative association
between PorTrm prevalence and size of area surveyed (e.g. the
larger the area surveyed the lower the overall prevalence of
PorTrm) and this is probably due to the spatially clumped nature
of PorTrm infections [68].
In contrast, PorGAs were strikingly more common and
prevalent within the MHI suggesting that this disease could be
affected by environmental conditions associated with human
presence. Kaczmarsky [12] reported a high prevalence of PorGAs
(up to 39.1%) in the Philippines, a region that contains some of the
most impacted reefs in the world [73]. The etiology of GAs is
unknown, however Kaczmarsky and Richardson [74], through
controlled experiments, found that growth anomalies in Porites
might be transmissible. Little else is known about the ecology of
PorGAs making interpretation of these patterns challenging.
However, we found PorGAs prevalence showed positive associa-
tions with overall coral cover, the frequency of UV anomalies and
human population size. Aeby et al. [75] examined PorGAs from
13 regions across the Indo-Pacific and found that prevalence of
PorGAs was strongly host density-dependent and also showed
strong positive associations with human population size. Our study
adds to the growing body of evidence that suggests that PorGAs
are related, directly or indirectly, to some environmental co-factor
associated with increased human population size at local and
regional spatial scales. The underlying mechanism influencing the
association between PorGAs and human density is unclear and
warrants further investigation.
Other hypotheses have been proposed to explain the distribu-
tion of coral growth anomalies. Damage to cells from ultraviolet
radiation was suggested as a potential mechanism contributing to
formation of GAs in Acropora [76]. However, Stimson [77] found
no effect of UV exposure on the development of GAs on Porites
compressa in Hawaii. We found a negative association between
PorGAs and depth, which is consistent with other studies [32,78],
and a positive association with UV. However, other environmental
variables can also vary with depth or in areas with higher UV
exposure. For example, corals on a shallow reef as compared to a
deeper reef usually experience higher water motion, UV exposure,
ambient light and greater temperature fluctuations. The ecological
mechanisms behind these disease-environment patterns are likely
to be complex and could be the result of direct or indirect
associations. A better understanding of disease etiology should help
in the interpretation of these patterns and should be the focus of
future studies. Regardless of the underlying drivers, the high
prevalence of PorGAs within the MHI is a concern. Growth
anomalies have been linked to reduced growth in affected corals
[79], a reduction in the amount of lipids [80], reduced
reproduction [57,80] and an impaired ability to withstand
bleaching stress [81]. As such, more research is needed to
understand the effects of growth anomalies on coral populations in
Hawaii. Understanding disease processes becomes especially
important in light of predictions of increased severity and
frequency of coral bleaching associated with global climate change
[28] and continual increases in local stressors on the reefs of
Hawaii.
PorGAs and PorTrem were also found to be important in
explaining differences among disease assemblages between islands
within regions. Within the MHI, Oahu and Maui stand out as the
most affected by disease with PorGAs especially prevalent. Not
surprisingly, Oahu and Maui also contain the highest human
population densities (567/km2 and 62/km2, respectively) as
compared to the other islands (Kauai: 41/km2, Hawaii: 14/km2,
Niihau: 1/km2, Lehua: 0/km2) (http://geonames.usgs.gov).
PorTrm was more characteristic of Kauai and Hawaii, which
have lower human densities and host abundance adequate to
maintain disease in the population. Niihau and Lehua have few
human influences but also low (,1%) coral cover (host abundance)
and accordingly low disease prevalence. Within the NWHI where
human influences are minimal, PorTrem was the main disease
underlying differences in disease assemblages among islands and
was especially prevalent on Maro, Lisianski, Laysan and Kure.
This study, as well as others, have found host abundance to be an
important factor affecting PorTrem prevalence and this may help
explain disease differences among islands as Maro and Lisianski
have the highest coral cover among islands (avg. 40.7% and
38.3%, respectively) (Fig. S3). However, neither Laysan (avg.
16.4%) nor Kure (avg. 12.8%) had high abundance of coral cover,
Coral Disease across the Hawaiian Archipelago
PLoS ONE | www.plosone.org 10 May 2011 | Volume 6 | Issue 5 | e20370

suggesting other factors not considered in this model may also be
important. Coral-feeding reef fish have been suggested as a vector
for PorTrem [68] and therefore abundance of coral-feeding reef
fish could also affect disease prevalence and should considered in
future studies.
Maro and Midway had the highest prevalence of Montipora white
syndrome (MontWS) within the archipelago. MontWS was found to
be host density dependent in Kaneohe Bay, Oahu [31] and the sites
we surveyed at Maro and Midway contained some of the highest
cover of Montipora within the NWHI (Fig. S3). However, Williams et
al. [32] also found MontWS was positively associated with
chlorophyll-a concentrations, which would be indicative of poor
water quality. Water clarity is reduced at Maro as the structure of
Maro is complex (combination of linear and patch reefs) which
allows wave energy to penetrate lagoonal water, which keeps fine
sediments suspended in the water column [39], another stressor that
may explain the higher occurrence of MontWS on Maro’s reefs. At
Midway, montiporids are found almost exclusively in the backreefs
[82], which suffered severe bleaching in 2002 [83] and again in
2004 [84]. For MontWS, host abundance and coral stress may both
be contributing to disease prevalence.
Coral diseases, like most diseases, display complex association
with their environment because of the intricate nature of the host-
environment-agent triad and the inherent multi-collinearity
present between biotic and abiotic variables in any ecological
system [20,32,38,85]. Not surprisingly, using statistical modeling
we found similarities and differences among the three indicator
diseases with respect to potential underlying drivers. All three
diseases showed positive associations with measures of host
abundance (Porites cover and overall coral cover) which is
consistent with infectious disease ecology theory [85]. Many
examples of relationships between host abundance and disease
prevalence exist throughout a wide range of ecosystems including
coral disease [28,29,31,32,75]. All three diseases were also
consistent in showing a negative association with WSSTA, which
contrasts with other coral disease studies that have found a positive
association between coral disease and thermal stress [28,86,87,88].
It may be that chronic diseases, such as GAs or Trematodiasis are
less influenced by temperature when compared to the tissue loss
diseases, many of which are caused by pathogenic bacteria with
virulence factors that may be enhanced at higher temperatures
[8,14,89,90]. Aeby et al. [75] also found no association between
WSSTAs and prevalence of Acropora and Porites growth anomalies
across the Indo-Pacific. However, we also found a negative
association between WSSTAs and PorTLS. Nothing is known
about the etiology or pathogenesis of PorTLS making interpre-
tation of these associations difficult but not all tissue loss diseases
necessarily respond to temperature stress. Aeby et al. [31] found
no evidence of seasonality in the tissue loss disease, MontWS, in
Hawaii. However, they hypothesized that evidence of seasonality
could have been obscured by different stresses in each respective
season (e.g. temperature stress in summer months and heavy
rainfall and the associated stress of terrestrial run-off in winter
months). Differences in underlying associations among the three
indicator diseases also occurred with human population size, with
a positive association with PorGA and a negative association with
PorTrm but no significant explanatory power for PorTLS. Clearly
disease processes are complex and our results are consistent with
the idea that different coral diseases can show distinct associations
with multiple environmental factors [32,75]. We also found that
the overall unexplained variability in disease abundance among
the three indicator diseases was high (a mean of 73.3% across all
three diseases) suggesting that much more research is needed in
understanding the pathogenesis of these diseases.
Regardless of the underlying drivers, this study did find strong
patterns of disease occurrence with PorGAs common in the MHI
whereas PorTrm was more prevalent in the NWHI. This finding
demonstrates the value of examining prevalence of individual
diseases rather than combining diseases together. For example, if
this study had combined all diseases together, then the average
disease prevalence would be higher on the near-pristine reefs of
the NWHI as compared to the impacted reefs of the MHI.
However, this pattern is skewed by the high prevalence of a single
disease, PorTrm, which has a lower prevalence in human
impacted regions.
Supporting Information
Figure S1 Frequency of occurrence (FOC) and preva-lence of different coral diseases among islands withinthe main Hawaiian Islands. Standard error in parentheses.
Por = Porites, Mont = Montipora, Trm = trematodiasis, GA = growth
anomaly, TLS = tissue loss syndrome, MFTL = multi-focal tissue
loss, Bl = bleaching, WS = white syndrome = tissue loss.
(DOC)
Figure S2 Frequency of occurrence (FOC) and preva-lence of different coral diseases among islands withinthe northwestern Hawaiian Islands. Standard error in
parentheses. Por = Porites, Mont = Montipora, Acro = Acropora,
Trm = trematodiasis, GA = growth anomaly, TLS = tissue loss
syndrome, MFTL = multi-focal tissue loss, WS = white syndro-
me = tissue loss, DTTS = discolored tissue thinning syndrome,
BND = brown necrotizing disease, FFS = French Frigate Shoals,
GAR = Gardner Pinnacles, PHR = Pearl and Hermes Atoll. ‘-‘
indicated that particular coral genera was not present within the
transects.
(DOC)
Figure S3 Average coral cover of dominant coral generafrom surveys in the main and northwestern HawaiianIslands. Standard error in parentheses. FFS = French Frigate
Shoals, GAR = Gardner Pinnacles, PHR = Pearl and Hermes
Atoll. Coral cover determined by point-intercept method.
‘*’ indicates that coral was present within the belt transect but
did not occur underneath the transect line so was not recorded by
the point-intercept method.
(DOC)
Acknowledgments
We thank the officers and crew of the NOAA ships Oscar Elton Sette and
Hi’ialakai, for logistic support and field assistance. The Coral Reef
Temperature Anomaly Database (CoRTAD) was developed by the NOAA
National Oceanographic Data Center and the University of North
Carolina, Chapel Hill. It was provided by the NOAA National
Oceanographic Data Center at http://www.nodc.noaa.gov/Satellite-
Data/Cortad/. Human population data was provided by the Center for
International Earth Science Information Network (CIESIN), Columbia
University; United Nations Food and Agriculture Programme (FAO); and
Centro Internacional de Agricultura Tropical (CIAT) with funding from
the National Aeronautics and Space Administration under Contract
NAS5-03117 for the Continued Operation of the Socioeconomic Data and
Applications Center (SEDAC). This manuscript was greatly improved by
input from two anonymous reviewers.
Author Contributions
Conceived and designed the experiments: GA. Performed the experiments:
GA TW SC EC JK. Analyzed the data: GW EF GA. Contributed
reagents/materials/analysis tools: GA TW SC EC JK GW EF. Wrote the
paper: GA TW SC EC JK GW EF.
Coral Disease across the Hawaiian Archipelago
PLoS ONE | www.plosone.org 11 May 2011 | Volume 6 | Issue 5 | e20370

References
1. Weil E, Smith G, Gil-Agudelo DL (2006) Status and progress in coral reef
disease research. Diseases of Aquatic Organisms 69: 1–7.
2. Porter JW, Dustan P, Jaap WC, Patterson KL, Kosmynin V, et al. (2001)Patterns of spread of coral disease in the Florida Keys. Hydrobiologia 460: 1–24.
3. Green EP, Bruckner AW (2000) The significance of coral disease epizootiology
for coral reef conservation. Biological Conservation 96: 347–361.
4. Sutherland KP, Porter JW, Torres C (2004) Disease and immunity in Caribbeanand Indo-Pacific zooxanthellate corals. Marine Ecology-Progress Series 266:
273–302.
5. Weil E (2004) Coral disease in the wider Caribbean. In: Rosenberg E, Loya Y,eds. Coral health and disease: Springer-Verlag. pp 35–68.
6. Aronson RB, Precht WF (2001) White-band disease and the changing face of
Caribbean coral reefs. Hydrobiologia 460: 25–38.
7. Gladfelter WB (1982) White-band disease in Acropora palmata: implications for thestructure and growth of shallow reefs. Bulletin of Marine Science 32: 639–643.
8. Patterson KL, Porter JW, Ritchie KE, Polson SW, Mueller E, et al. (2002) The
etiology of white pox, a lethal disease of the Caribbean elkhorn coral, Acropora
palmata. Proceedings of the National Academy of Sciences of the United States of
America 99: 8725–8730.
9. Hughes TP (1994) Catastrophes, phase-shifts, and large-scale degredation of aCaribbean coral reef. Science 265: 1547–1551.
10. Willis BL, Page CA, Dinsdale EA (2004) Coral disease on the Great Barrier
Reef. In: Rosenberg E, Loya Y, eds. Coral Health and Disease. Berlin: Springer-Verlag. pp 69–104.
11. Raymundo LJ, Rosell KB, Reboton CT, Kaczmarsky L (2005) Coral diseases on
Philippine reefs: genus Porites is a dominant host. Diseases of Aquatic Organisms64: 181–191.
12. Kaczmarsky LT (2006) Coral disease dynamics in the central Philippines.
Diseases of Aquatic Organisms 69: 9–21.
13. Haapkyla J, Seymour AS, Trebilco J, Smith D (2007) Coral disease prevalenceand coral health in the Wakatobi Marine Park, south-east Sulawesi, Indonesia.
Journal of the Marine Biological Association of the United Kingdom 87:403–414.
14. Sussman M, Willis BL, Victor S, Bourne DG (2008) Coral pathogens identified
for white syndrome (WS) epizootics in the Indo-Pacific. PLoS ONE 3: e2393.
15. Work TM, Rameyer RA (2005) Characterizing lesions in corals from AmericanSamoa. Coral Reefs 24: 384–390.
16. Aeby GS, Work TM, Fenner D, Didonato E (2009) Coral and crustose coralline
algae disease on the reefs of American Samoa. Ft. LauderdaleFlorida:Proceedings of the 11th International Coral Reef Symposium. pp 197–201.
17. Williams GJ, Aeby GS, Davy SK (2008) Coral disease at Palmyra Atoll, a remote
reef system in the Central Pacific. Coral Reefs 27: 207–207.
18. Vargas-Angel B (2009) Coral health and disease assessment in the US PacificRemote Island Areas. Bulletin of Marine Science 84: 211–227.
19. Williams GJ, Knapp IS, Aeby GS, Davy SK (2011) Spatial and temporal
patterns of scleractinian coral, soft coral, and zoanthid disease on a remote, near-pristine coral reef (Palmyra Atoll, central Pacific). Diseases of Aquatic Organisms
94: 89–100.
20. Harvell CD, Mitchell CE, Ward JR, Altizer S, Dobson AP, et al. (2002) Ecology
- Climate warming and disease risks for terrestrial and marine biota. Science296: 2158–2162.
21. Harvell D, Jordan-Dahlgren E, Merkel S, Rosenberg E, Raymundo L, et al.
(2007) Coral disease, environmental drivers, and the balance between coralmicrobial associates. Oceanography 20: 172–195.
22. Lafferty KD, Holt RD (2003) How should environmental stress affect the
population dynamics of disease? Ecology Letters 6: 654–664.
23. Work TM, Richardson LL, Reynolds TL, Willis BL (2008) Biomedical and
veterinary science can increase our understanding of coral disease. Journal of
Experimental Marine Biology and Ecology 362: 63–70.
24. Harvell CD, Kim K, Burkholder JM, Colwell RR, Epstein PR, et al. (1999)Review: Marine ecology - Emerging marine diseases - Climate links and
anthropogenic factors. Science 285: 1505–1510.
25. Anderson R, May R (1979) Population biology of infectious diseases: Part 1.Nature 280: 361–367.
26. Antonovics J, Iwasa Y, Hassell M (1995) A generalized model of parasitoid,
venereal, and vector-based transmission processes American Naturalist 145:661–665.
27. Mitchell C, Tilman D, Groth J (2002) Effects of grassland plant species diversity,
abundance, and composition on foliar fungal disease. Ecology 83: 1713–1726.
28. Bruno JF, Selig ER, Casey KS, Page CA, Willis BL, et al. (2007) Thermal stressand coral cover as drivers of coral disease outbreaks. PloS Biology 5: 1220–1227.
29. Myers RL, Raymundo LJ (2009) Coral disease in Micronesian reefs: a link
between disease prevalence and host abundance. Diseases of Aquatic Organisms87: 97–104.
30. Haapkyla J, Unsworth RKF, Seymour AS, Melbourne-Thomas J, Flavell M, et
al. (2009) Spatio-temporal coral disease dynamics in the Wakatobi MarineNational Park, South-East Sulawesi, Indonesia. Diseases of Aquatic Organisms
87: 105–115.
31. Aeby GS, Ross M, Williams GJ, Lewis TD, Work TM (2010) Disease dynamicsof Montipora white syndrome within Kaneohe Bay, Oahu, Hawaii: distribution,
seasonality, virulence, and transmissibility. Diseases of Aquatic Organisms 91:
1–8.
32. Williams GJ, Aeby GS, Cowie ROM, Davy SK (2010) Predictive Modeling ofCoral Disease Distribution within a Reef System. PLoS ONE 5: e9264.
33. Antonius A (1988) Black Band disease behavior on Red Sea reef corals.Townsville, Australia: Proceedings of the 6th International Coral Reef
Symposium. pp 145–150.
34. Bruckner AW, Bruckner RJ, Williams EH (1997) Spread of a black-band diseaseepizootic through the coral reef system in St Ann’s Bay, Jamaica. Bulletin of
Marine Science 61: 919–928.
35. Raymundo LJ, Halford AR, Maypa AP, Kerr AM (2009) Functionally diversereef-fish communities ameliorate coral disease. Proceedings of the National
Academy of Sciences of the United States of America 106: 17067–17070.
36. Friedlander AM, DeMartini EE (2002) Contrasts in density, size, and biomass ofreef fishes between the northwestern and the main Hawaiian islands: the effects
of fishing down apex predators. Marine Ecology-Progress Series 230: 253–264.
37. Friedlander AM, Aeby G, Brainard R, Brown E, Chaston K, et al. (2008) The
state of coral reef ecosystems of the Main Hawaiian Islands. In: Waddell J, ed.
The State of Coral Reef Ecosystems of the United States and Pacific FreelyAssociated States: NOAA Technical Memorandum NOS NCCOS 11 NOAA/
NCCOS Center for coastal monitoring and assessment’s biogeography team. pp
219–261.
38. Work TM, Aeby GS (2006) Systematically describing gross lesions in corals.
Diseases of Aquatic Organisms 70: 155–160.
39. Kenyon JC, Vroom PS, Page KN, Dunlap MJ, Wilkinson CB, et al. (2006)Community structure of hermatypic corals at French Frigate Shoals,
Northwestern Hawaiian Islands: Capacity for resistance and resilience to
selective stressors. Pacific Science 60: 153–175.
40. Aeby GS (2006) Baseline levels of coral disease in the Northwestern Hawaiian
Islands. Atoll Research Bulletin 543: 471–488.
41. CIESIN (2005) Center for International Earth Science Information Network
Gridded Population of the World Version 3 (GPWv3): Population Grids http://
sedac.ciesin.columbia.edu/gpw.
42. Selig ER, Casey KS, Bruno JF (2010) New insights into global patterns of ocean
temperature anomalies: implications for coral reef health and management.
Global Ecology and Biogeography 19: 397–411.
43. Halpern BS, Walbridge S, Selkoe KA, Kappel CV, Micheli F, et al. (2008) A
global map of human impact on marine ecosystems. Science 319: 948–952.
44. McPeters R, Barthia PA, Krueger AJ, Herman JR, Wellemeyer CG, et al. (1998)
Earth Probe Total Ozone Mapping Spectrometer (TOMS) Data Products User’s
Guide, NASA/TP-1998-206895 .
45. Clarke KR, Chapman MG, Somerfield PJ, Needham HR (2006) Dispersion-
based weighting of species counts in assemblage analyses. Marine Ecology-
Progress Series 320: 11–27.
46. Anderson MJ (2001) A new method for non-parametric multivariate analysis of
variance. Austral Ecology 26: 32–46.
47. McArdle BH, Anderson MJ (2001) Fitting multivariate models to communitydata: A comment on distance-based redundancy analysis. Ecology 82: 290–297.
48. Clarke KR, Somerfield PJ, Chapman MG (2006) On resemblance measures forecological studies, including taxonomic dissimilarities and a zero-adjusted Bray-
Curtis coefficient for denuded assemblages. Journal of Experimental Marine
Biology and Ecology 330: 55–80.
49. Anderson MJ, Robinson J (2003) Generalised discriminant analysis based on
distances. Australian and New Zealand Journal of Statistics 45: 301–318.
50. Anderson MJ, Willis TJ (2003) Canonical analysis of principal coordinates: Auseful method of constrained ordination for ecology. Ecology 84: 511–525.
51. Clarke KR, Gorley RN (2006) PRIMER v6: User manual/Tutorial. PRIMER-
E. , UK: Plymouth.
52. Akaike H (1973) Information theory as an extension of the maximum likelihood
principal, 261-281. in Petrov BN, Caski F, eds. Akademiai KiadoBudapest:
Proceedings, 2nd International Symposium on Information Theory.
53. Hurvich CM, Tsai CL (1989) Regression and time-series model selection in
small samples. Biometrika 76: 297–307.
54. Burnham KP, Anderson DR (2004) Multimodel inference - understanding AIC
and BIC in model selection. Sociological Methods & Research 33: 261–304.
55. Anderson MJ, Gorley RN, Clarke KR (2008) PERMANOVA+ for PRIMER:Guide to software and statistical methods. PRIMER-E. , UK: Plymouth.
56. Williams GJ, Work TM, Aeby GS, Knapp IS, Davy SK (2011) Gross and
microscopic morphology of lesions in Cnidaria from Palmyra Atoll, CentralPacific. Journal of Invertebrate Pathology 106: 165–173.
57. Work TM, Aeby GS, Coles SL (2008) Distribution and morphology of growthanomalies in Acropora from the Indo-Pacific. Diseases of Aquatic Organisms 78:
255–264.
58. Raymundo LJH, Harvell CD, Reynolds TL (2003) Porites ulcerative white spotdisease: description, prevalence, and host range of a new coral disease affecting
Indo-Pacific reefs. Diseases of Aquatic Organisms 56: 95–104.
59. Vargas-Angel B, Wheeler B (2009) Coral health and disease assessment in theUS Pacific territories and affiliated states. Ft. LauderdaleFlorida: Proceedings of
the 11th Interantional Coral Reef Symposium. pp 175–179.
60. Bythell JC, Sheppard C (1993) Mass mortality of Caribbean shallow corals.Marine Pollution Bulletin 26: 296–297.
61. Aronson R, Precht WF (1997) Stasis, biological disturbance, and communitystructure of a Holocene coral reef. Paleobiology 23: 326–346.
Coral Disease across the Hawaiian Archipelago
PLoS ONE | www.plosone.org 12 May 2011 | Volume 6 | Issue 5 | e20370

62. Palmer CV, Gates RD (2010) Skeletal eroding band in Hawaiian corals. Coral
Reefs 29: 469–469.
63. Aeby GS (1992) Interaction between coral parasites and coral-feeding
Butterflyfish. Bulletin of the Ecological Society of America 73: 95.
64. Aeby GS (1998) A digenean metacercaria from the reef coral, Porites compressa,
experimentally identified as Podocotyloides stenometra. Journal of Parasitology 84:
1259–1261.
65. Cheng TC, Wong AK (1974) Chemical, histochemical and histopathological
studies on corals, Porites spp., parasitized by trematode metacercariae. Journal of
Invertebrate Pathology 23: 303–317.
66. Bray R, Cribb T (1989) Digeneans of the family Opecoelidae Ozaki, 1925 from
the southern Great Barrier Reef, including a new genus and three new species.
Journal of Natural History 23: 249–473.
67. Lafferty KD (1997) Environmental parasitology: what can parasites tell us about
human impacts on the environment. Parasitology Today 13: 251–255.
68. Aeby GS (2007) Spatial and temporal patterns of Porites trematodiasis on the
reefs of Kaneohe Bay, Oahu, Hawaii. Bulletin of Marine Science 80: 209–218.
69. Jokiel PL, Rodgers KS (2007) Ranking coral ecosystem ‘‘health and value’’ for
the islands of the Hawaiian Archipelago. Pacific Conservation Biology 13:
60–68.
70. Hunter C, Evans C (1995) Coral reefs in Kaneohe Bay, Hawaii: two centuries of
western influence and two decades of data. Bulletin of Marine Science 57:
501–515.
71. Aeby GS (1991) Behavioral and ecological relationships between a parasite and
its hosts. Pacific Science 45: 263–269.
72. Aeby GS (1993) The potential effect the ability of a coral intermediate host to
regenerate may have had on the evolution of its association with a marine
parasite. Guam: Proceedings of the 7th International Coral Reef Symposium. pp
809–815.
73. Burke L, Selig ER, Spalding M (2002) Reefs at risk in Southeast Asia.
Washington DC: World Resources Institute. 72 p.
74. Kaczmarsky L, Richardson LL (2007) Transmission of growth anomalies
between Indo-Pacific Porites corals. Journal of Invertebrate Pathology 94:
218–221.
75. Aeby GS, Williams GJ, Franklin E, Haapkyla J, Harvell CD, et al. (2011)
Growth anomalies on the coral genera Acropora and Porites are strongly associated
with host density and human population size across the Indo-Pacific. PLoS ONE
6(2): e16887.
76. Coles SL, Seapy DG (1998) Ultraviolet absorbing compounds and tumorous
growths on acroporid corals from Bandar Khayran, Gulf of Oman, IndianOcean. Coral Reefs 17: 195–198.
77. Stimson J (2011) Ecological characterization of coral growth anomalies on Porites
compressa in Hawai’i. Coral Reefs 30(1): 133–142.78. Domart-Coulon IJ, Traylor-Knowles N, Peters E, Elbert D, Downs CA, et al.
(2006) Comprehensive characterization of skeletal tissue growth anomalies of thefinger coral Porites compressa. Coral Reefs 25: 531–543.
79. Bak RPM (1983) Neoplasia, regeneration and growth in the reef-building coral
Acropora palmata. Marine Biology 77: 221–227.80. Yamashiro H, Oku H, Onaga K, Iwasaki H, Takara K (2001) Coral tumors
store reduced levels of lipids. Journal of Experimental Marine Biology andEcology 265: 171–179.
81. Yamashiro H, Yamamoto M, van Woesik R (2000) Tumor formation on thecoral Montipora informis. Diseases of Aquatic Organisms 41: 211–217.
82. Kenyon J, Wilkinson C, Aeby GS (2010) Community structure of hermatypic
corals at Midway Atoll in the Northwestern Hawaiian Islands: A legacy ofhuman disturbance. Atoll Research Bulletin 581: 1–24.
83. Kenyon J, Aeby GS, Brainard R, Chojnacki J, Dunlap M, et al. (2006) Masscoral bleaching on high-latitude reefs in the Hawaiian Archipelago. Proceedings
of the 10th Interantional Coral Reef Symposium. pp 631–643.
84. Kenyon J, Brainard R (2006) Second recorded episode of mass coral bleachingin the Northwestern Hawaiian Islands. Atoll Research Bulletin 543: 505–523.
85. Lloyd-Smith JO, Cross PC, Briggs CJ, Daugherty M, Getz WM, et al. (2005)Should we expect population thresholds for wildlife disease? Trends in Ecology
& Evolution 20: 511–519.86. Brandt ME, McManus JW (2009) Disease incidence is related to bleaching
extent in reef-building corals. Ecology 90: 2859–2867.
87. Muller EM, Rogers CS, Spitzack AS, van Woesik R (2008) Bleaching increaseslikelihood of disease on Acropora palmata (Lamarck) in Hawksnest Bay, St John,
US Virgin Islands. Coral Reefs 27: 191–195.88. Dalton S, Godwin S, Smith SDA, Pereg A (2010) Australian subtropical white
syndrome: a transmissible, temperature-dependent coral disease. Marine and
Freshwater Research 61: 342–350.89. Denner EBM, Smith GW, Busse HJ, Schumann P, Narzt T, et al. (2003)
Aurantimonas coralicida gen. nov., sp nov., the causative agent of white plague typeII on Caribbean scleractinian corals. International Journal of Systematic and
Evolutionary Microbiology 53: 1115–1122.90. Richardson LL (2004) Black band disease. In: Rosenberg E, Loya Y, eds. Coral
Health and Disease. Berlin: Springer-Verlag. pp 325–336.
Coral Disease across the Hawaiian Archipelago
PLoS ONE | www.plosone.org 13 May 2011 | Volume 6 | Issue 5 | e20370


