
PENETRATION AND UPTAKE OF INSURANCE IN KENYA: A
CASE OF SHOPPING MALLS IN NAIROBI COUNTY, KENYA
BY
MBURU, JOHN MURIGI
UNITED STATES INTERNATIONAL UNIVERSITY
SPRING 2017

ii
PENETRATION AND UPTAKE OF INSURANCE IN KENYA: A
CASE OF SHOPPING MALLS IN NAIROBI COUNTY, KENYA
BY
MBURU, JOHN MURIGI
A Project Report Submitted to the School of Business in Partial
Fulfillment of the Requirement for the Degree of Global Executive
Masters in Business Administration (GeMBA)
UNITED STATES INTERNATIONAL UNIVERSITY AFRICA
SPRING 2017

iii
COPYRIGHT
© Copyright by @Mburu John Murigi, 2017
All rights reserved. No part of this project may be produced or transmitted in any form or by any
means, electronic, mechanical, including photocopying, recording or any information storage
without prior written permission from the author.

iv
STUDENT’S DECLARATION
I, the undersigned, declare that this is my original work and has not been submitted to any other
college, institution or university other than the United States International University in Nairobi,
Kenya for academic credit.
Signed: ________________________ Date: _____________________
Mburu John Murigi
This project has been presented for examination with my approval as the appointed supervisor.
Signed: ________________________ Date: _____________________
Prof. Francis W. Wambalaba, Professor of Economics
Supervisor
Signed: __________________________ Date: ______________________
Dr. George Achoki, Associate Professor of Accounting
Dean, Chandaria School of Business

v
ACKNOWLEDGEMENT
My sincere gratitude and heartfelt appreciation goes to my supervisors Professor Francis W.
Wambalaba, PhD, AICP Professor of Economics and Dr. Peter Kiriri. Associate Professor of
Marketing United States International University Africa School of Business for their guidance,
advice and effective timely response at each stage in the preparation and execution of this
research paper for examination.
Thank you for your support and inspiration.
I would also like to thank my family, friends and colleagues in GeMBA for their support,
resource input, and encouragement throughout the Research Project from the execution stage to
the end.
I wish all God’s blessings and prosperity.
vi
ABSTRACT
The general objective of this study was to establish the factors that contribute to the low
penetration and uptake of insurance in Kenya. The specific objectives were to examine how
social aspects contribute to low insurance uptake and penetration in Kenya; to determine how
low literacy levels contribute to the low insurance uptake and penetration in Kenya and to
establish how lack of technological innovations contribute to low penetration and uptake of
insurance in Kenya.
The study adopted the explanatory research design and the population of study was 30 shopping
malls in Nairobi County, Kenya. Three malls were selected for the purpose of this study. The
data collection instrument was in the form of a questionnaire with both open and close ended
questions. Once the questionnaires were completed and returned, they were analyzed using SPSS
(v.21) after which the data was presented in table formats, charts, graphs towards addressing the
three research objectives highlighted above.
The study found out that there was a general lack of trust of insurance companies by the general
public and poor agents integrity had led to low penetration of life insurance; poor claims
management in the industry had been adversely affected by fraud arising from unprofessional
conduct of players; customers had been misguided on the type of policies they should take and
that insurance companies acted very slowly in processing claims. The study also found out that
individuals depend on their extended families and that it was easier for them to access personal
savings in case of an emergency as opposed to insurance.
The study established that customers read the policies but misinterpret certain clauses; insurance
products were complex legal contracts poorly understood by consumers. The study also
established that there was low level of awareness and lack of knowledge of insurance products.
There was a general lack of awareness, formal education helped in making financial decisions.
The study found out that educated people were more likely to purchase insurance policies and
goes further to highlight that insurance companies in Kenya face the challenge of limited
expertise and skills amongst their workers.

vii
The study revealed that social media has been underutilized by the insurance sector in Kenya;
there is lack of digitization by insurance companies which has negatively affected customer
interaction in the course of a policy period; there is lack of digitization which has denied
insurance companies important feedback from customers and that there was a lot of paperwork
involved in processing claims by insurance companies which discouraged customers.
Based on the findings the study concluded that there is general lack of trust of insurance by the
general public attributed to poor agent’s integrity where agents misguide customers on policies.
It was also established that lack of trust could also be due to poor claims management where
customers feel that their claims are not handled well. The study also concluded that language
barrier made it difficult to understand what the insurance agents were trying to explain and that
the legal language used in the insurance documentation application forms was very technical and
difficult to understand by the general public. People rarely heard about insurance unless it is
about buying insurance or a new insurance product launch. The study further concluded that
there was underutilization of social media and lack of digitization by the insurance sector in
Kenya which had negatively affected customer interaction in the course of a policy period.
The study recommended that insurance companies ought to invest in building customer trust by
hiring well trained professionals to represent the company well and also to have a clear
understanding of insurance in order to communicate well to existing and potential customers.
Other recommendations are that insurance companies should work at simplifying the language
used in their policies to make it easier for customers to understand; insurance companies should
take it upon themselves to educate the public on insurance by initiating programs that help
members of the public to have a general knowledge of insurance; insurance companies should
make use of the social media to increase customer interaction in the course of a policy period and
also to target potential customers. Finally, there is need for insurance companies to invest in
digitization in order to reduce the manual processes that cause unnecessary delays in customer
claims settlements.

viii
TABLE OF CONTENTS
COPYRIGHT ............................................................................................................................... iii
STUDENT’S DECLARATION .................................................................................................. iv
ACKNOWLEDGEMENT ............................................................................................................ v
ABSTRACT .................................................................................................................................. vi
TABLE OF CONTENTS .......................................................................................................... viii
LIST OF TABLES ........................................................................................................................ x
LIST OF FIGURES ..................................................................................................................... xi
ABBREVIATIONS AND ACRONYMS ................................................................................... xii
CHAPTER ONE ........................................................................................................................... 1
1.0 INTRODUCTION................................................................................................................... 1
1.1 Background of the Study: ..................................................................................................... 1
1.2 Problem Statement ................................................................................................................ 5
1.3 General Objective of the Study ............................................................................................. 5
1.4 Specific Objectives ............................................................................................................. 5
1.5 Significance of the Study ...................................................................................................... 6
1.6 Scope of the Study ................................................................................................................ 6
1.7 Definition of Terms............................................................................................................... 6
1.8 Chapter Summary ................................................................................................................. 7
CHAPTER TWO .......................................................................................................................... 9
2.0 LITERATURE REVIEW ...................................................................................................... 9
2.1 Introduction ........................................................................................................................... 9
2.2 Social Aspects ....................................................................................................................... 9
2.3 Low Literacy Levels ........................................................................................................... 14
2.4 Technological Innovations .................................................................................................. 18
2.5 Chapter Summary ............................................................................................................... 23
CHAPTER THREE .................................................................................................................... 24
3.0 RESEARCH METHODOLOGY ........................................................................................ 24
3.1 Introduction ......................................................................................................................... 24
3.2 Research Design.................................................................................................................. 24
3.3 Population and Sampling Design ........................................................................................ 24
3.5 Research Procedures ........................................................................................................... 26
3.6 Data Analysis Methods ....................................................................................................... 27
3.7 Chapter Summary ............................................................................................................... 28
CHAPTER FOUR ....................................................................................................................... 29
4.0 RESULTS AND FINDINGS ........................................................................................... 29
4.1 Introduction ......................................................................................................................... 29
4.2 Demographic Information ................................................................................................... 29

ix
4.3 Social Aspects on Insurance Uptake and Penetration ......................................................... 33
4.4 Effects of Literacy Levels on Insurance Uptake and Penetration ....................................... 38
4.5 Effects of Technological Innovation on Insurance Uptake and Penetration ....................... 41
4.6 Rate of Insurance Uptake and Penetration in Kenya .......................................................... 43
4.7 Regression Analysis ............................................................................................................ 44
4.8 Chapter Summary ............................................................................................................... 46
CHAPTER FIVE ........................................................................................................................ 47
5.0 DISCUSSION, CONCLUSIONS AND RECOMMENDATIONS ................................... 47
5.1 Introduction ......................................................................................................................... 47
5.2 Summary of the Study .................................................................................................... 47
5.3 Discussions ....................................................................................................................... 48
5.4 Conclusion .......................................................................................................................... 52
5.5 Recommendation ................................................................................................................ 53
5.6 Areas for Further Research ................................................................................................. 54
REFERENCES ............................................................................................................................ 55
APPENDICES ............................................................................................................................. 60
Appendix I: Questionnaire Cover Letter................................................................................... 60
Appendix II: Questionnaire....................................................................................................... 61
Appendix III: Insurance Penetration in Africa (2012) .............................................................. 66
Appendix IV: Insurance Penetration in Africa (2014) .............................................................. 67
Appendix V: List of Shopping Malls in Kenya ........................................................................ 68

x
LIST OF TABLES
Table 1. 1: Global Insurance Penetration ........................................................................................ 1
Table 3. 1: Sampling Frame and Size ........................................................................................... 26
Table 4.1: Lack of Trust................................................................................................................ 33
Table 4.2: Family Networks ......................................................................................................... 34
Table 4.3: Own Savings ................................................................................................................ 34
Table 4.4: Religious and Cultural Beliefs ..................................................................................... 35
Table 4.5: Religion: * I rely on my religious association to offer support in case of an emergency
Cross tabulation ............................................................................................................................ 36
Table 4.6: Religion: * Funeral insurance is a taboo in my culture Cross tabulation .................... 36
Table 4.7: Religion: * Relying on insurance is a sign of distrust in God Cross tabulation .......... 37
Table 4.8: Religion: * My religious beliefs do not support taking insurance policies Cross
tabulation....................................................................................................................................... 37
Table 4.9: Extent to which Social Aspects Affect Decision towards taking up Insurance ........... 38
Table 4.10: Policy Interpretation .................................................................................................. 39
Table 4.11: Awareness .................................................................................................................. 39
Table 4.12: Financial Literacy ...................................................................................................... 40
Table 4.13: Extent to which Literacy Levels Affected Decision to taking up Insurance ............. 40
Table 4.14: Product Innovation..................................................................................................... 41
Table 4.15: Distribution Channels ................................................................................................ 42
Table 4.16: Manual Processes....................................................................................................... 43
Table 4.17: Extent to which Technological Innovation Affects Decision towards taking an
Insurance Policy ............................................................................................................................ 43
Table 4.18: Rate of Insurance Uptake and Penetration in Kenya ................................................. 44
Table 4.19: Model Summary ........................................................................................................ 44
Table 4.20: ANOVA ..................................................................................................................... 45
Table 4.21: Coefficients ................................................................................................................ 45

xi
LIST OF FIGURES
Figure 4.1: Response Rate ............................................................................................................ 29
Figure 4.2: Gender of the Respondents......................................................................................... 30
Figure 4.3: Age Distribution ......................................................................................................... 30
Figure 4.4: Religion ...................................................................................................................... 31
Figure 4.5: Employment Status .................................................................................................... 32
Figure 4.6: Income Level (Kes) .................................................................................................... 32
xii
ABBREVIATIONS AND ACRONYMS
EY : Ernst and Young
FSD : Financial Sector Deepening
GDP : Gross Domestic Product
ICT : Information and Communication Technology
IRA : Insurance Regulatory Authority
IT : Information Technology
KHHEUS: Kenya Household Health Expenditure and Utilization Survey
KPMG: Klynveld Peat Marwick Goerdeler
LIMRA: Life Insurance Marketing and Research Association
NAIC : National Association of Insurance Commissioners
SPSS : Statistical Package for Social Sciences

1
CHAPTER ONE
1.0 INTRODUCTION
1.1 Background of the Study:
Insurance provides financial security by facilitating investments by reducing the amount of
capital that businesses and individuals need in order to protect themselves from unforeseen
events. At an agreed fee referred to as premium, the risk is transferred to a third party, the
insurer/underwriter (The Chartered Insurance Institute, 2014). Universally, insurance is
associated with risk be it fire, accident, health or life. Subsequently, insurance is made up of two
divisions, life and non-life insurance. Life investment involves both protection and investments
while non-life insurance is comprised of motor, health and accident (Capgemini, 2008).
The insurance penetration ratio is used to measure how deep a country’s insurance market is. It is
a measure of gross value of insurance premiums as a percentage of the Gross Domestic Product
(GDP) (Swiss Re, 2012). The world’s insurance industry is dominated by wealthy developed
countries. The Group of Seven countries (G7) account for almost 65% of the world’s insurance
premiums though the seven countries only constitute 10% of the world’s population. In the year
2012, in the same seven countries, an average of US$3,910 was spent on insurance premiums per
capita in comparison to the emerging markets where only an average of US$ 120 was spent
(Swiss Re, 2012). The global insurance penetration is 6.5%. Total insurance premiums in Africa
in 2012 were US$ 71.9Billion translating into a penetration rate of 3.65% (Swiss Re, 2012).
Table1.1: Global Insurance Penetration
Region Total Premium
US$ Billion
Premium per capita
(US$)
Penetration Rate
(%)
Advanced Asia 936.0 4,387.50 11.80
North America 1,393.4 3,996.30 8.03
Western Europe 1,462.7 2,716.30 7.72
Oceania 97.1 2,660.2 5.60
South & Central America 168.7 281.9 3.00
Central & Eastern
Europe
72.5 223.4 2.01
Middle East 40.9 124.0 1.35
Emerging Asia 369.4 101.9 2.96
Africa 71.9 66.4 3.65
World 4,612.5 655.7 6.5
Source: Swiss Re, (2012)

2
As Table 1.1 shows, penetration is highest in Advanced Asia, North America and Western
Europe. Africa though performs better than some regions including Middle East, Central and
Eastern Europe, Emerging Asia, South and Central America. Of note also is that Africa’s
insurance density (ratio of premium per capita) is the lowest of any region in the world with each
African paying US$ 66.4 in insurance premiums in 2012 which works out to roughly one-tenth
of the global average. Of importance to note also from a global perspective is that insurance has
been shrinking compared to nominal GDP growth. While some classes of insurance such as
property insurances have gained some relative growth, the same cannot be said of other classes
such as life insurance. Life insurance has lost ground due to alternative saving vehicles in the last
few years, a trend that is predicted to continue (McKinsey, 2014).
In 2012, the global insurance industry grew by 4.4% continuing the pattern observed in recent
years of growth in insurance lagging slightly behind nominal GDP growth that globally stands at
4.6%. In 2013, the global industry growth was again behind the GDP growth posting a 3.4%
growth against a GDP growth of 4.3%. This trend is largely driven by poor performance in life
insurance in mature markets (McKinsey, 2014). The decline globally is driven by mature
markets where growth has been extremely volatile and weighed down by low interest-rate
environment and by regulatory challenges. Emerging markets though have been performing
better with life insurance gaining ground in Asia. Global growth is being driven by Brazil,
Russia, India and China (McKinsey, 2014).
Despite its importance for economic development, the majority of African countries lack access
to insurance products. With majority of Africans struggling to meet their basic needs, insurance
is largely considered a luxury (KPMG, 2014). Insurance has low levels of penetration in Africa
as shown in Appendix III and Appendix IV. In terms of insurance premiums paid per capita,
Sub-Saharan Africa significantly lags behind Asian economies of Thailand, India and Vietnam.
Collectively, the premiums are less than 3% of GDP (Ernst & Young, 2016). Reasons for the low
insurance penetration in Africa range from low awareness and understanding of insurance across
various population segments; people not trusting financial service providers; low income levels;
challenging business environment that does not provide enough incentives for multinational
companies to enter the African market; lack of reliable information making it difficult to access
and assess people’s risk; legal and judicial systems are poor; lack of human capital and expertise;
3
shallow financial markets making it difficult to raise enough money to capitalize insurance and
communities making informal forms of insurance rather than using the services of formal
insurers (KPMG, 2014).
A few African countries have sizeable middle income classes which has spurred the development
of insurance. Such countries include South Africa, Botswana, Namibia and Mauritius. Although
most North African countries have fairly high income levels, insurance uptake is low due to
religious reasons, challenging business environment and restrictive government policies. In
recent years, Morocco’s insurance sector has grown thanks to the combination of reasonably
high income levels by African standards, political and macroeconomic stability, low inflation
and a sophisticated financial services sector. Moroccan insurance companies are also among the
most aggressive investors in other African markets (KPMG, 2014).
One country in Africa can truly be considered to have a well-developed insurance market – both
in life and non-life insurance - this is South Africa. The country as at 2012 had an insurance
penetration rate of 14.28% ranking amongst the highest in the world. But despite the high
penetration rate, South Africa’s insurance industry still has a lot of room for further growth; its
premiums per capita ratio was US$1,047 in 2012 well behind the average for advanced
economies of US$3,677 (KPMG 2012). The key determinants of an insurance sector in any
particular country in Africa are income levels, political stability, the depth and sophistication of
the financial services sector, the level and volatility of inflation, religion and the capacity of
companies to innovate (KPMG, 2014).
East Africa for our discussion consists of Tanzania, Uganda, Kenya, Rwanda, Burundi, Ethiopia
and South Sudan. The insurance market is sizeable and remains untapped. The population in East
Africa is 270 Million people. Insurance penetration is between 0.2% - 4.0% and works out to a
small amount of the GDP (Davis, 2013). The reasons for the slow growth and insurance
penetration levels in East Africa are as a result of years of constant political turmoil, famines,
unpredictable inflations, economic inefficiencies and other problems similar to other African
countries as above highlighted. However, there is anticipated growth in the region even in
protective markets such as Ethiopia and Sudan. The growth is anticipated through global
investors eyeing the untapped market, capital injections, product innovations, staff development
and technology (Davis, 2013).
4
The potential is driven further by the relative political stability and economic growth. Millions of
dollars are being poured into Ethiopia’s agriculture and Tanzania’s gas industry. Kenya’s
technological advancement has drawn the attention of local and international investors. Oilfields
and infrastructure projects are thriving in South Sudan. The full benefits of these investments are
yet to be fully realized and the insurance industry will have to play a role in all of these sectors.
As the returns and incomes grow, the insurance industry will be expected to encounter a growing
consumer base (Davis, 2013).
The insurance industry in Kenya is in the financial services sector. From the Insurance
Regulatory Authority report, there were 49 insurance companies in Kenya, 198 insurance brokers
and 5,155 insurance agents. The total revenue generated by the 49 companies was Kes 132.1B
with an overall underwriting profit of Kes 15.5B representing about 11.7% of the total revenue.
(IRA, 2015). Many Kenyans lack the knowledge about insurance products, their value and
benefits. This is due to their complexity, how to acquire them, how they are paid in case of a
claim and what happens when once fails to pay premiums (Kiama, 2015). There exists a
psychological lack of trust in the industry and its agents by the people. There have been reported
cases where agents have given wrong policy interpretation and worse stolen clients’ premiums
(Mwiti, 2016)
Strong cultural systems exist amongst communities. Assistance is provided to a member in case
of a misfortune. In these scenarios, cost is transferred from an individual to the whole
community after a catastrophic event. Members gather together and raise funds towards
settlement of bills – medical, funeral etc. This system is inherently expensive, inefficient,
leaving behind those who were involved sometimes traumatized (Ngugi, 2015). The industry has
also been slow to respond to changing market dynamics in technology. The products distribution
and claims payment system is still paper based. The industry still relies on products that were
introduced over 80 years ago from Europe that have little or no relevance to Kenyans. There has
been failure to innovate new products that resonate with Kenyans.
This exists especially in motor and medical claims where there is collision between the insured,
the insurer, the intermediaries (insurance brokers and agents) and other stakeholders such as
unscrupulous lawyers, police officers and medical practitioners. The fraud is twofold: where we
have cases of nonexistent claims being presented for payment and cases where exaggerated

5
claims are presented for payment. For example, where a claim to be paid is Kes 0.5M, it is
presented as Kes 5M (KPMG, 2015)
1.2 Problem Statement
Low insurance penetration is one of the challenges facing insurance development in terms of
market share, product diversification among other measures. In Kenya, insurance penetration is
2.8% with a population of 41.8 million compared to South Africa whose penetration is 14.2%
with a population of 53.2 million (KPMG, 2014). The number of insurance companies in Kenya
is 49 equivalent to a ratio of 1:1 for every 1 million Kenyans which is similar to Kenya’s banking
sector. However penetration for the insurance sector remains significantly very low at 3.0
percent, which is lower than the average of 3.8 percent in Africa (Cytonn Investment, 2015)
As presented in Appendix IV, this problem does not affect Kenya only; it certainly exists within
the continent of Africa running within the continent with the average penetration in Africa at
2.9%. It is also evident that there are huge disparities across the continent. Insurance penetration
in South Africa is highest at 14.1% while Namibia is the second highest at 7.2%. Nigeria despite
having a population of 178 million people has a penetration of only 0.3%. Insurance penetration
in Africa excluding South Africa is only 0.9%. The study therefore sought to establish the factors
that contribute to the low penetration and uptake of insurance in Kenya.
1.3 General Objective of the Study
The general objective of this research was to establish the factors that contribute to the low
penetration and uptake of insurance in Kenya.
1.4 Specific Objectives
The research was guided by the following specific objectives:-
1.4.1. To identify how social aspects contribute to low insurance uptake and penetration in
Kenya.
1.4.2. To determine how low literacy levels contribute to the low insurance uptake and
penetration in Kenya.
1.4.3. To establish how lack of technological innovations contribute to low penetration and
uptake of insurance in Kenya.
6
1.5 Significance of the Study
This research would help identify the root causes of the low uptake and penetration of insurance
in Kenya and aim at finding lasting feasible solutions to the problem.
1.5.1. Insurance Companies
The study would help insurance companies and other stakeholders in the industry (insurance
brokers and agents) to find solutions that would help increase the uptake/penetration levels and
increase their market share.
1.5.2 Insurance Regulatory Authority
The research would help the insurance regulator identify areas that need to be addressed from the
national outlook and to map out a strategy plan on how to increase the uptake of insurance.
1.5.3. The General Public
The general public would be educated on matters concerning insurance and how they would
benefit from the same.
1.6 Scope of the Study
This study focused on 3 shopping malls selected from a population of 30 malls within Nairobi
County, Kenya and its environs. The study relied on insights drawn from the respondents on the
factors that contribute to the low uptake and penetration of insurance in Kenya. The research was
conducted between the months of August – October 2016.
1.7 Definition of Terms
1.7.1 Insurance: This is the contractual agreement between two parties, the insured and insurer.
At an agreed fee (premium), the insured transfers their risk to a third party, the
insurer/underwriter. The contract between the two parties is binding. Once the contract is bound,
the insured is covered (indemnified) in the event of a loss (Chartered Insurance Institute, 2014).
1.7.2 Insured: Person buying protection whose details are shown on an insurance certificate.
Insurance cannot be transferred to third parties (AON, 2014)
1.7.3 Insurer: The provider of protection; the risk carrier (National Association of Insurance
Commissioners, 2012)
7
1.7.4 Premium: This is the fee paid to the insurer by the insured to provide protection in case of
a loss (National Association of Insurance Commissioners, 2012)
1.7.5 Social Support Systems: These are systems that have been put in place within the society
that give the individual the perception and actuality that one is cared for; has assistance available
from other people and that one is part of a supportive social network (American Psychological
Association, 2015).
1.7.6 Financial Literacy: This refers to the achievement of skills necessary to make informed
and effective decisions regarding earning, spending, and the management of money (Servon &
Kaestner, 2008).
1.7.7 Innovation: A new or significantly improved product (good or service) introduced to the
(local) market or the introduction within the enterprise of a new or significantly improved
process (Eurostat, 2001)
1.7.8 Technology: Knowledge which is embodied in the three P’s: products, processes, practices
(Basant & Chandra, 2002)
1.8 Chapter Summary
This chapter has presented the background of the study which touches on the penetration and
uptake of insurance from a global perspective to the local situation. The problem statement has
been stated as the low penetration and uptake of insurance in Kenya. The chapter provides the
research objectives that will guide the research: how social support systems, low literacy levels
and lack of technological innovations contribute to low penetration and uptake of insurance. The
chapter further provides the significance of the study to various stakeholders in the insurance
industry. The scope of the study and the operational definition of terms used in the study have
also been presented.
The next chapter will present the literature review on studies that had been conducted in the past
in relation to the objectives of this study. Chapter three will present the research methodology
which will be used to achieve the objectives of the study. This includes the research design,
population, sampling procedure and sample size, data collection method and data analysis.
Chapter four will present results and findings in relation to the study objectives and lastly,

8
Chapter five will focus on discussions, conclusions and recommendations based on the findings
of the study.
9
CHAPTER TWO
2.0 LITERATURE REVIEW
2.1 Introduction
This chapter reviews the literature on low insurance uptake and penetration with particular focus
on the following areas; social aspects, literacy levels and technological innovation. Summary of
the reviewed literature will be presented at the end of the chapter.
2.2 Social Aspects
There exists market mistrust by the populace .The populace does not trust the insurance industry
mainly driven by perception that their claims will not be honored in case of a loss. Due to this
mistrust, the public has created own social support systems. Further, there are low levels of
professionalism with the insurance intermediaries giving wrong policy interpretations to the
insured.
2.2.1 Lack of Trust
There is a general lack of trust of insurance companies by the general public. The companies are
generally perceived negatively especially in regions where insurance companies have collapsed.
This has led to the insuring public suffering losses or having their claims not settled as planned.
In cases where clients have suffered such losses, it is difficult to convince them to take up new
policies even with very established insurance companies. This negative view is further reinforced
in cases where the public does not regard the cover as good security that is able to cover them
incase of any eventuality (Nduna, 2013). In a study done by IRA (2012), for the respondents
with a lapsed usage of insurance policies, loss of trust in insurance was the highest contributing
factor (33%) an indication that trust plays a key role in uptake of insurance prooducts. This was
followed by high cost at 28%, lack of funds at 22% while only 17% of lapsed usage being
attributed to maturity of the products.
The collapse of insurance companies has adversely affected the penetration of insurance in
Kenya. The trend has persisted for some time. In 1996 the Kenya National Assurance collapsed;
Stallion and Lakestar followed in 2002, United Insurance Company and Mediplus collapsed in
2005 while Blue Shield Insurance Company was put under statutory management in 2011. Gitau

10
(2013). This asserts that there have been complaints of poor claims management and the industry
has been adversely affected by fraud arising from unprofessional conduct of players.
Life insurance for instance is largely distributed through insurance agents such that agents are the
sole customer contact point. Owing to this structure of distribution, customer confidence has
greatly been eroded. There have been many instances where customers have been misguided on
the type of policies they should take and also in projecting the maturity dates of their policies
(Odemba, 2013). Some agents have at times received clients money and diverted this to their
personal use instead of paying for the premiums. Bull (2009) asserts that it is because of such
incidents that customers have become very skeptical in dealing with agents leading to loss in
business and low levels of penetration of life insurance.
Another concern has been the pace at which insurance companies process claims. Incase of an
occurance of an insured event it has been noted that insurance companies act very slowly in
processing claims. This pace may be attributed to the bureaucratic nature of the claims
management process. Usually, by the time claims are processed, the insured has already been
waiting for too long and has spent money on followup. Customers who have been kept for long
and even incurred monetary costs in the process of waiting are unlikely to refer other people to
the insurance. The delay sometimes may be interpreted as lack of willingness on the part of the
insurance company to settle the claim. Life Insurance Marketing and Research Association
(LIMRA, 2011) posit that referral value is lacking in most developing countries leading to low
penetration.
Insurance business thrives on trust considering that the services and products they offer are
intangible and the purchaser of such products only gets to make use of them after the occurrence
of the particular event against which they are insured. Ethical conduct on the part of the
insurance employees is critical in winning customer trust which in turn contributes positively to
companies’ profitability (McMurrian & Matulich, 2006). Similarly Ibrahim and Abubakar
(2011), stated attitude towards an organization can limit performance even if the share capital of
the company is increased in multiples.
Empirical evidence point to the importance of trust in the enrolment decisions. Qualitative
surveys by Dong et al (2009) and Baraza et al (2008) indicate that lack of trust in management

11
of a scheme was a reason for dropping out or not participating in the scheme. Previous research
has shown that building trust enhances the uptake of an insurance product (Cole et al., 2011;
Dercon et al., 2011). In a study of government sponsored insurance programme by Cai et al
(2009), they highlighted the potential trust-building role played by experience with the institution
delivering the product. They point that as trust grew in the authorities, the participants
willingness to participate in the scheme increased. Dong et al. (2009) identified trust in the
management of the community health scheme as an important factor influencing households’
probability of enrolling.
2.2.2 Family Networks
In countries like Kenya and other African countries, the notion of insurance comes within a
difficult context. First, there are numerous informal and social connections, specifically founded
upon the extended household systems that sometimes assist to meet some urgent needs. These
have the capacity to overshadow the individual‘s sense of vulnerability to financial shocks
(Owusu, 2007). In a study executed by Ackah & Owusu (2012) they discovered that the reason
for the poor uptake of insurance can be summed up under cultural related reasons. For instance,
although the funeral insurance package deal appeared to be one of the most patronized, from the
view of staff and agents, there was the feeling that in a wide variety of ways the social network
system caters for catastrophes, which makes it pointless to purchase insurance plans for such
things. When it comes to funeral ceremonies for example, people go and borrow money. At the
end, relatives and friends donate to cover the charges and what was borrowed is returned. Hence
people do not see the need to have funeral insurance plans for such occasions.
Thornton, Hatt, Field, Islam, Diaz, & Gonzalez (2010) investigated factors that determine
households participation in micro life insurance and discovered the following factors; credit
constraint, basis risk, risk aversion, household wealth, trust and endorsement from social
networks. This goes a long way in explaining the importance that people place on social
networks when it comes to emergencies.

12
2.2.3 Own Savings
The limited academic literature available suggests that linking savings and insurance does not
increase the demand for insurance. Stein and Tobacman (2011) found that people preferred a
pure insurance or pure savings product to a mixture of the two. Clarke et al. (2012) offered
people the opportunity to allocate money to different index and health insurance products. They
found that the introduction of savings did not significantly change the demand for index
insurance, suggesting that these complementarities are not very important. Nonetheless, people
do indicate that savings are a significant part of their risk management strategy since they
allocate a substantial share of their money to group savings.
Kenyans rely on their own personal savings and family support networks to pay for healthcare.
According to FSD (2016), the first place that most Kenyans turn to, to pay for their hospital and
other health related bills is cash that has been generated from their businesses, salaried
employement or from personal savings. Incases where the bills escalate beyond their incomes or
savings, they seek new sources which in most times will be help from relatives and friends. The
survey by FSD further revealed that while low-income Kenyans tend to save quite a lot, only a
small share of the typical family’s savings was held in purely liquid savings instruments.
Therefore, even when the family had money ‘saved’ for example in a chama (savings club), it
was not available for immediate use for things like healthcare.
The Kenya Household Health Expenditure and Utilization Survey (KHHEUS) that took place in
2013 revealed that both own financing and funds from social networks systems outrank
insurance in terms of health financing at the household level. While 17 per cent of Kenyans
reported having some form of insurance, coverage in the lowest wealth quintile was only three
per cent (Ministry of Health, 2014). The uptake of insurance in Kenya has been quite low
especially in the rural areas where the uptake stands at 11% of rural adults and 29% of the urban
(FinAccess survey, 2013) .
2.2.4 Religious and Cultural Practices
Low insurance penetration has also been attributed to religious and cultural beliefs which have
led to the slow growth of the industry especially within the African continent (Nduna, 2013).
Many people prefer to rely on traditional arrangements or religious practices that give them
13
support incase of any eventualities (Hardman 2012). Additionally, many life insurance policies
pay at death yet this is a topic that many people especially in the African traditional context do
not want to talk about. Though death is sure, Africans will live in denial. Many people are keen
to buy investment related products from insurance companies leaving out pure risk insurance
products because of fear of death. Because of this, it is difficult selling pure insurance risk
products in most African markets, hence low penetration (Wairegi, 2004).
The unique culture of a country may affect the demand for insurance in a way that even the
population's risk aversion is affected (Douglas and Wildavsky, 2012). Further Henderson and
Milhouse (2007) posited that an individual's religion can provide insight into the individual’s
behavior therefore understanding religion is an important component of understanding a nation’s
unique culture.Yaari (2009) notes that religion historically has provided a strong source of
cultural opposition. This is especially on life insurance where many religious people believe that
a reliance on life insurance results from distrust of God providing care. Until the nineteenth
century, European nations condemned and banned life insurance on religious grounds.
Yaari (2009) further states that religious antagonism to life insurance still remains in several
Islamic countries. Wasaw (2006) tested the effect of Islamic beliefs on life insurance
consumption using a data set from different countries. The study findings established that,
holding all other factors constant, consumers in Islamic nations buy less life insurance compared
to those in non-Islamic nations. Islamic nations included in the sample as a percentage of
population that is Muslim was as follows: Egypt 94%, Iran 98%, Morocco 99%, Pakistan 97%,
Tunisia 99.5%, Turkey 99% (Wasaw, 2006). Eck and Nizovtsev (2006) established that the
major reason for the lack of success in marketing life insurance in Latin America and the
Caribbean was cultural variables. They noted that most of the population was Catholic and their
religious beliefs affected their risk preferences. They also found out that another major factor
was the population’s attitude toward financial instruments in general.
In a study by Wairegi (2004) investigating how insurance companies in Kenya respond to their
environment, it was found out that insurance companies are affected by the cultural aspects. One
of the aspects was that there was no sharing of information among spouses and other close
family members especially on life insurance. Hence if the insured party passes on, the
dependants may never get to know of the policy. Such policies remain unclaimed and hence are

14
of no benefit to the family. Because of this cultural orientation, many people would rather remain
uninsured.
2.3 Low Literacy Levels
This occurs in various ways. First, is the failure by the insured to correctly interpret policy
wordings. Secondly, is in financial terms where the insured is not able to correctly interpret the
arrangement of insurance covers and financial compensation thereto. Third, is lack of awareness
where the insured does not understand their rights when it comes to compensation. Lastly, there
has been little emphasis in terms of educating the populace on insurance in general and also
specific product details by insurance companies and stakeholders.
2.3.1 Policy Interpretation
An insurance policy is a legal contract between the insurance company (the insurer) and the
person(s), business, or entity being insured (the insured). Reading the policy on the part of the
insured helps in verifying that the policy meets ones needs and that they understand their
responsibilities and those of the insurance company should a loss occur. Many insurance
customers purchase a policy without understanding what is covered in the policy, the conditions
that must be met in order for the cover to apply when a loss occurs and the exclusions that take
away coverage (National Association of Insurance Commissioners- NAIC, 2010). In other
instances, the customers read the policies but misinterprete certain clauses. Hence their
expectations differ with what is contained in the policy document as far as the insurance
company is concerned. This may pose challenges incase of any eventualities where the customer
seeks compensation and their expectations are not met.
The expectation of the insured is that when losses occur, there will be adequate compensation
provided. Sometimes, this expectation may however not be met owing to the various terms and
conditions and the complexity that characterizes the insurance contract. Describing the complex
nature of insurance, Csiszar and Heidrich (2006) observes that insurance products are complex
legal contracts that can be poorly understood by consumers, particularly personal insurance
consumers. The insurance contract being adhesive in nature where the insurer has all control in
drafting the contract, the insurer has inextricably created an asymmetry of power between the
parties involved. In such instances, the insurers have the power which they have been using to

15
protect themselves, sometimes to the detriment of the insured. Court intervention has tried to
address the imbalance that exists between the insurer and the insured by declaring that ambiguity
inherent in the contract will be construed against the insurer. This nonetheless leaves the insured
parties at an unfair position (Obalola, 2010).
2.3.2 Awareness
There is a low level of awareness and lack of knowledge of insurance products because most
people do not seek knowledge on insurance products. Most people rely on speculation about
insurance products hence the low level of financial literacy amongst the populace. In some
cases, there is lack of information about the market. Consequently, there is a low uptake of
insurance cover at individual and sometimes at corporate levels (Nduna, 2013). Studies have
revealed general lack of awareness of the insurance benefits. Infact a lot of people only come to
know about Insurance when they buy their first car and have to insure it before they can start
driving (Gitau, 2013). Jain and Goyal (2012) noted that despite the insurance industry having
been in existence for long, the level of awareness towards the rights and duties regarding
insurance are negligible.
There is a low level of financial literacy amongst the populace in Africa. In some cases, there is
lack of information about the insurance market for both the insurer and the insured. The insurer
has very little information about the potential customers and on the other had the insured does
not have much information on the dynamics of insurance. Consequently, there is a low uptake of
insurance cover at individual and sometimes even at corporate levels. Research has also shown
that there is a general poor attitude towards personal insurance cover in some African markets
(Nduna, 2013) .
Even with the introduction of microinsurance which is a promising tool to reduce the
vulnerability of low-income households in developing countries, the same have suffered low
uptake too (Ito & Kono, 2009). They further found out that low usage and retention in insurance
schemes reflect the lack of acceptance of the products among the insuring population. In part,
low demand can be attributed to a lack of understanding and a lack of familiarity with the
concept of insurance (Gine, Townsend & Vickery, 2008). Evidence from developed countries
files a strong relationship between financial literacy and financial decision making. Financial

16
education directly influences an individual’s literacy levels and ultimately improves the
capability to make informed financial decisions (Olopade & Frolich, 2012)
According to Olopade and Frolich (2012), one of the failures in getting the populace to
understand insurance is the approach that insurance companies use in educating the public. Most
campaigns are product centered and there is general lack of general information in insurance. In
literacy campaigns, one needs to differentiate between general and product specific education so
as to give the bigger picture and develop a better understanding among the target population.
General literacy education and awareness campaigns address the concept of insurance and
explain terminology, different insurance types and benefits in general terms. Such campaigns do
not promote specific insurers or their products and are mainly carried out by government or non
profit institutions. Most of the private insurance companies do not participate in the general
education as the intervention is normally viewed as social rather than commercial (Olopade &
Frolich, 2012).
On the other hand, product specific insurance education focuses on a particular product that
insurance companies wish to sell to their existing and potential customers. It is mostly conducted
by insurance sales staff and is closely related to traditional commercial marketing. The
campaigns might also touch on general insurances but their main aim is to explain and sell
specific products. This kind of education explains contractual features for the particular product
like premium payment or claim procedure and is important not only for increasing sales but also
to prevent customer dissatisfaction leading to low renewal rates. The commercial purpose of
such interventions is prevalent and likely to be obvious to the target population. Therefore, the
effectiveness of commercial insurance education might be subject to the target market trust or
mistrust because of the element of commissions motivated education (Olopade & Frolich, 2012).
Furthermore, inadequate knowledge about health insurance, available options and registration
processes may account for low enrolment. Among informal sector workers in Kenya, low
enrolment in the insurance fund is as a result of the above problem. The informal sector workers
expressed that they were unaware that they could also contribute and become members, and that
they thought the scheme was for the rich and formal sector workers (Mathauer et al. 2008).
Again they pointed out that they did not know where and when to enrol, and that they had not
been approached by anybody to enrol. These groups felt excluded. Likewise, in Tanzania, a

17
significant number of the uninsured revealed that they had not joined the Community Health
Fund because they were not educated by managers of the scheme before it was launched
(Kamuzora & Gilson 2006).
2.3.3 Financial Literacy
Limited interventions to promote financial literacy education have been conducted in developing
countries. According to Holzmann (2010), empirical evidence on these interventions is rare and
does not present a clear picture. Olopade and Frolich (2012) assert that one way to remedy low
familiarity, lack of understanding and acceptance of insurance products is insurance literacy
education. The relation between financial literacy and financial decision making is well
documented for industrialized countries (Lusardi and Mitchell, 2009; van Rooij et al., 2007). For
developing countries little evidence on the importance of financial literacy exists. Cole, Sampson
and Zia (2009) found strong correlation between financial literacy and the demand for financial
services using survey data for Indonesia and India.
Education has been associated with increased life insurance spending. Higher formal education
has been found to foster need awareness to the individual and also enable more objective
analysis for the life insurance purchase decisions (Hammond et al., 2007). According to Truett
and Truett (2004), higher educated individuals are hypothesized to have a stronger inclination to
protect their dependents by means of life insurance. Generally, education correlates with higher
demand for life insurance as evidenced by empirical investigations (Burnett & Palmer, 2004).
Higher educated spouses, for example, even though aware of life insurance’s benefits, are less
dependent on the income of their husbands (Gandolfi & Miners, 2006). Alternatively, higher
educated parents anticipate longer financial dependency of their offspring due to pursuit of
higher educational levels (Browne & Finkelstein, 2007).
Education has the potential to equip the individual with valuable skills and training which will
provide the source of livelihood for earning income. However, education also involves cost.
Therefore, it can be argued that the wealthy and their families are likely to have the ability to
secure more avenues for raising incomes in unequal societies, whereas for the poor, the reverse
might be true. In addition, education links positively with the acquisition of knowledge, in this
context, the understanding of the health insurance scheme rationale, risk-perception and health-

18
seeking behaviour. A person who is not educated about the rationale and the benefits of health
insurance is unlikely to enrol, unless influenced by others to do so. Knowledge about health
insurance rationale entails an understanding of the principles of solidarity, risk-sharing and
resource pooling. This implies that traditional societies with no formally educated members
might prefer informal solidarity groups to formal health insurance schemes either because they
are uninformed about the existing formal schemes, or because they do not understand or do not
accept the principle of risk-sharing and solidarity which are important tenets of such schemes
(Asomani, 2014)
Insurance companies in Africa also face the challenge of limited expertise and skills amongst
their workers. The problem has been exacerbated by the brain drain which has seen a significant
part of the skilled workforce seek greener pastures in the advanced economies and other
emerging markets. Advanced skills including Actuaries are needed to manage and understand
the complex and unfamiliar risks (Nduna 2013). This will help in exploring new areas for new
products and also recommend new products for existing markets.
2.4 Technological Innovations
This refers to new products that respond to market needs and the role that technology would have
in the distribution and roll out of the products. According to Cytonn Investments (2015), one of
the problems facing insurance companies is the existence of insurance products that are not
tailored to the common consumer and lacks innovation to appeal to customers with low
disposable income. The savings policies that are now common with most insurance companies in
Kenya such as education savings plans, are very suboptimal in their returns and are mostly
purchased by people who are not sophisticated in financial matters.
According to Bain & Company (2015), most established companies in the insurance industry
have been slow to adopt digital tools, relative to other industries, such as retail, media, travel and
retail banking. One of the reason for the slow adoption of digital technology is that general
insurance lacks continuous customer engagement through the insurance policy duration and
hence the inability to keep track of the changing customer needs and making timely provision for
those in need. Majority of the insurers would admit that they have not been proactive in leading
the way through digitization of their processes and hence trail behind when it comes to customer

19
engagement and effective adoption of mobile social media when compared to other financial
services providers. It is important to note that there could be many reasons why insurers take a
cautious approach. Some of them could be around market instability due to catastrophic losses
from natural phenomenon to ever changing needs of the end-customers. This notwithstanding, it
remains the responsibility of the insurance companies to work around these challenges and adopt
relevant technologies if they are to meet customer needs.
2.4.1 Product Innovation
A report by Cytonn investments (2015) stated that product innovation is the single biggest
disruptive opportunity in the insurance sector. It further stresses the need to address the bottom
of the pyramid consumer both in terms of packaging the product, pricing as well as creating
awareness and using a language that is understood by the potential consumers. Insurance
products in Kenya are in English language yet Kiswahili is the national language. The situation
becomes worse considering that Kenya has over 42 ethnic groups who speak different languages
and a big proportion only understand their mother tongue, yet there are no insurance products
translated into various languages.
According to Nduna (2013), the African insurance industry has not developed sufficient research
and development capacity and has over many years relied on expertise from the advanced
economies whose products may not necessarily be applicable to the local situations.
Consequently, the industry has lagged behind in terms of product innovation in meeting
customer needs. There has been a general reluctance by insurance companies to step out of the
comfort zones and invest in research and development. Even though there has been much
progress in the African continent in enhancing Information and Communication Technology
(ICT), more still needs to be done to use modern technology to enhance operational efficiencies
and improve service delivery especially in the insurance industry.
Many insurers lack customer profiling capabilities necessary to quickly match products with
high-potential customers. This is due to the manual processes adopted by most insurance
companies. Technology adoption in terms of user interactive applications will help both agents
and customers in reducing time wasted in face to face meetings. Some forms of insurance
products like for life insurers is highly reliant on their product development and policy
administration systems which in many occassions are unable to meet the demands of an

20
aggressive program of new product development, segmentation and at the same time maintaining
distribution channels that are robust. There is therefore a need for an integrated architecture that
covers policy administration, social media monitoring, claims and other functions within the
insurance process (KPMG, 2014).
2.4.2 Distribution Channels.
With the current technological advancement in the business world today, customers are more
informed and their expectations regarding service delivery are higher than ever before. There are
numerous opportunities presented by technology for insurers to collect and analyze customer
information that will help in improving the range and quality of products offered, refine pricing
strategies and to develop an effective array of distribution channels (Odemba, 2013).
Technologies including descriptive and predictive analytics can help life insurers improve both
their decisions regarding new products and their levels of customer service(Accenture, 2011).
The widespread use of social media provides another opportunity for life insurers to increase
their understanding of what customers want through online interactions. The social media has
been under utilised by the insurance sector, but if the sector is to grow then the insurance
companies must develop social media strategies that engage the clients in terms of brand
positioning and product offering (Odemba, 2013). Technological adoptions in other retail sectors
involve the use of loyalty programs such as the loyalty cards by supermarkets which have proved
to be successful in retaining and growing their customer base. The adoption of such innovations
is lower in insurance than other financial industry players.
Products that are designed to meet the new middle classes is now a strategic priority for those
financial institutions operating in (or considering entering) these emerging markets. To achieve
this, many insurers are starting to consider innovating their channels and products to differentiate
themselves and expand their reach. Alternative channels such as mobile and internet portals are
gaining traction. Experience in the Brazil, Russian, India and China (BRIC) markets suggest that
technology is also now being leveraged to fundamentally change insurance business models in
the emerging markets. Indeed, as customer expectations increase they begin to demand more
from their insurers. Insurance companies should look to technology to increase their operational

21
efficiency and improve their customer service by providing multi-channel servicing platforms.
(KPMG, 2014)
Insurers need to have proactive strategies to capitalize on the new technologies that can help
them become more efficient, agile and customer centric. They need to experiment with new
routes to market while preserving existing distribution networks. Many financial institutions
already have innovation labs. Identifying and implementing new technologies and systems can
enhance customer satisfaction while reducing response time. Identifying the right technology
partners will help both in product development and operational efficiency. Customer profiling
and analytic tools will also help and in this regard, there are lessons to be learnt from other
sectors such as retailers, telcos and online portals (KPMG, 2014).
Distribution channels in Kenya have remained traditional as noted by an AKI Agents forum at a
Nairobi Hotel in 2012 during which players in the insurance industry were urged to embrace
technology in order to reach the untapped market. According to (Kaguma, 2011), low
technological adoption has led to poor customer service. By nature of the products, life insurance
is a long term relationship between the insured and the life insurance company. This means that
there should exist a good working relationship between the company and the customer.
Regrettably, insurance companies have been slow in embracing the use of technologies like the
internet, mobile phone, contact centres and social media to improve service. This has led to
customer dissatisfaction leading to poor penetration of life insurance (KPMG, 2014). Lack of
proper infrastructure often affects the effective operation of insurance companies in Africa.
Communication is often difficult due to poor telecommunications and a bad road network. This
invariably means a high cost of doing business and also limits the products offering. It follows
then that some of the products become expensive and hence prohibitive for most of the potential
customers.
Researchers of the bottom of the pyramid markets stress that innovative and cost efficient
promotion methods are necessary to communicate with potential consumers. The usage of social
networks such as groups of women (Chikweche& Fletcher,2012) for direct marketing not only
build awareness among potential consumers but also enable a channel of getting feedback from
them

22
2.4.3 Manual Processes
In many insurance companies in developing countries, there is a lot of paperwork resulting to
inefficiencies that translate to inconveniencies on the part of the customers especially during
enrolment and claims processing. Most companies manually file their records making work slow
and cumbersome. In Kenya for instance, the increased growth in banking is largely due to
automation (Wairegi, 2003). A number of reports have identified insurance companies as
technology laggards. According to Forrester Research's Report Trends (2014), European
companies are falling behind other companies in other sectors. The report indicates that startups
and companies in the manufacturing, utility and telecoms markets could take business from
traditional insurers. Insurance companies should open digital labs and run software projects, tap
into internal and external talent and partner with digital firms to cope with the changing
technological trends.
Research by Accenture (2013) which surveyed 6,000 consumers in 11 countries, revealed that
almost a quarter of consumers would consider large internet companies, such as Google and
Amazon, as possible insurance providers. The study further established that 67% of 6,000
consumers surveyed in 11 countries would consider buying insurance from companies other than
insurers. Some 23% cited online service providers as options. A report by EY (2015) indicates
that a key challenge for insurers in 2015 is the need to develop more robust mobile digital
technologies, data analytics and social media strategies to address growing consumer
expectations of more refined product sales and distribution channels.
The embracing of new technologies in the business process has the capability of ensuring that
manual processes are automated and new functionalities created (Kasae, 2014). The elimination
of the manual processes through the use of technology enables quicker turnaround timeframes on
service issues and better accuracy on routine work (Kyengo, 2014). Among the functions that
can be automated include the clerical and filing functions within an organization. This enables
the filing of large amounts of information and the retrieving of the same when needed far much
quicker (Mutwa, 2014). The use of the technology also creates new functions that improve on the
workflow in an organization in the context new technologies are often developed to address
existing challenges in the industry (Ngatia, 2013). These new functions have the capability of
enabling work that was previously cumbersome and time consuming to be executed at a far
23
much faster pace. Rono (2013) therefore argues that the Information Technology (IT) enhances
service reliability, reduces transaction errors, increases consistence in performance and
customizes service.
2.5 Chapter Summary
Chapter two gives a review on the literature of factors that affect uptake and penetration of
insurance. The chapter has detailed factors like social aspects which include lack of trust, family
networks, own savings and also religious and cultural practices. Other factors are low literacy
levels and lack of technological innovations. Specifically, technological innovations have
affected both product innovation and distribution channels. Chapter three outlined the research
methodology that was deployed which included the research design, population and sampling
and how the data was analyzed.

24
CHAPTER THREE
3.0 RESEARCH METHODOLOGY
3.1 Introduction
This section presented the methodology that was deployed in carrying out the study. In this
section the research identified the procedures and techniques that were used in the collection,
processing and analysis of data. Specific subsections included: the research design, population
and sampling design, data collection procedure and finally data analysis.
3.2 Research Design
A research design is a plan, structure and a strategy of investigation so conceived so as to obtain
answers to research questions as validity, objectively, accurately and economically as possible
(Kumar, 2014). Research design constitutes conceptual structure within which research is
conducted. It also constitutes blueprint for the collection, measurement and analysis of data
(Kothari, 2011). There are several research designs that may be used: these include explanatory,
descriptive, causal, experiments, survey and case study (Bless, Smith, & Kagee, 2008).
The researcher adopted the explanatory research design which is deemed to more effective in
meeting the objectives of this study. This design is concerned with attempts to clarify why and
how there is a relationship between two or more aspects of a situation or phenomenon (Kumar,
2011). The research design and methodology entailed collecting useful data in analysis and
coming up with relevant recommendations and conclusions. Under this particular study, the
researcher sought to identify how social aspects, literacy levels and technological innovation
affect insurance uptake and penetration in Kenya.
3.3 Population and Sampling Design
3.3.1 Population
According to Trochim & Donnelly (2008), population comprises of the total number of subjects
that are being investigated in a study. Similarly, Ngechu (2004) defines population as the total
collection of elements with common observable characteristics about which some inferences can
be made. Target population is the group of elements for which the survey researcher wants to
make inferences by use of sample statistics (Couper, Fowler, Groves, Lepkowski, Singer, &
Tourangeau, 2013). They are finite in size in the sense that they can theoretically be counted and

25
they are observable; aspects which make target population desirable for achieving a clear
understanding of the meaning of the survey statistics. Thus, target population is the collection of
cases in which the researcher is ultimately interested, to which he or she wishes to make
generalization (Aparasu, 2010). The study targeted 30 shopping malls as indicated on Appendix
V all within the Nairobi County, Kenya and its environs. The shopping malls were considered as
appropriate sites for the study because people from different backgrounds visit these malls for
shopping and other services such as banking, recreation etc.
3.3.2 Sampling Design
3.3.2.1 Sampling Frame
According to Cooper & Schindler (2006), a sampling frame is a list of elements from which the
sample is actually drawn and closely related to the population. In this study, the sampling frame
was drawn from a list of shopping malls as compiled by Project Gutenberg (2015). This was
used to ensure that the sampling frame was current, complete and relevant for the attainment of
the study objectives.
3.3.2.2 Sampling Technique
Sampling can be defined as the procedure a researcher uses to gather people, places or things to
study (Kombo & Tromp, 2006). Sample design is a process that assists in the selection of
members of a sample (Singleton & Straits, 2005).Determining the sample size is a complex task
and involves much clarity with regard to the balance between the resources available and number
or accuracy of information obtained. Qualitative factors must be considered including nature of
the research, expected outcomes, importance of the findings and the number of variables to be
studied, nature of analysis and resource constraints.
In identifying which mall to carry out the research the researcher used purposive sampling which
is done to conform to a certain criteria e.g. income. The intention was to have a clear idea about
what the sample may reflect of the larger group (Berg, 2007). To ensure representativeness of the
high, middle and lower income class, the study was carried out at Taj Mall located in the Eastern
side of Nairobi (Eastlands) dominated by low income earners; T-Mall located at Nairobi West in
the Southern side dominated by middle income earners and Galleria Mall located in the affluent
Karen suburb dominated by high income earners according to the Nairobi County zoning guide.

26
3.3.2.3 Sample Size
Smith, Thorpe, Jackson and Lowe (2008) state that a sample refers to a subset of those entities
that decisions relate to. Borg and Gall, 2010 poised that the sample must be carefully selected to
be representative of the population and the researcher also needs to ensure that the subdivisions
entailed in the analysis are accurately catered for. According to Mugenda and Mugenda (2003) a
sample size ranges from 10% to 30% of the population. This study used 30% of the total
population translating to 3 shopping malls.
Table 3. 1: Sampling Frame and Size
Mall Sample Size
Taj Mall 60
T- Mall 40
Galleria 30
Total 130
3.4 Data Collection Methods
This research collected primary data using questionnaires. The questionnaires comprised of both
open and close ended questions in line with the objectives of the study. Chandran (2004)
explained that open-ended questions or unstructured questions are those for which alternatives
are provided while close-ended questions or structured questions do not provide alternatives for
the respondents to choose from. A five point Likert scale was used for close ended questions.
The questionnaire contained two sections: the first section sought to establish the respondents’
demographic data while the second section sought to establish the respondents’ opinions on the
three variables (social aspects, literacy levels and technological innovations) considered in this
study.
3.5 Research Procedures
After development of the draft questionnaire, a pilot test was carried out with ten respondents to
test for any inconsistencies, ambiguity and incomprehension. The pre-test participants did not
participate in the actual survey to avoid pre-emption of the study at the actual area. In the process
of piloting, the researcher ensured rectification of errors of ambiguity existing in the research
instrument. After the amendment of the final questionnaire, the researcher explained the purpose

27
of the research to the respondents and sought permission to carry out the research in the given
topic.
Each questionnaire was distributed directly to each of the 130 identified participants in the study
at the shopping malls. According to Creswell (2003), participants should not be inconvenienced
during the process. To ensure a high response rate, the researcher requested the immediate
completion and return of the questionnaires by the respondents.
3.6 Data Analysis Methods
Data analysis is the process of systematically applying statistical and/ or logical techniques to
describe and illustrate, condense and recap, and evaluate data(Devore, Olsen, & Peck, 2011).
Statistical techniques are employed to analyze survey research where the survey data was used to
evaluate whether one variable affect the other (Vaus, 2013). The Statistical Package for Social
Science (SPSS) version 21 was used to perform the analysis, which helped in generating
frequencies and percentages (Carver & Nash, 2011).
Before processing the responses, data preparation was done on the completed questionnaires by
editing, coding, entering and cleaning the data. Data collected was analyzed using descriptive
statistics. The descriptive statistical tools helped in describing the data and determining the
respondents’ degree of agreement with the various statements under each factor. Data analysis
was done using Statistical Package for Social Sciences (SPSS) to generate quantitative reports
which were then presented in the form of tabulations, percentages, mean and standard deviation.
In addition, the researcher conducted a multiple regression analysis to determine the extent to
which the three independent variables (social aspects, literacy levels and technological
innovations) influenced the uptake and penetration of insurance in Kenya. The following model
was used:
Y = β0 + β1X1 + β2X2 + β3X3 + ε
Whereby Y = uptake and penetration of insurance in Kenya
X1 = social aspects
X2 = low literacy levels
X3 = technological innovations
28
3.7 Chapter Summary
Chapter three enumerated the research methodology and design. It gave a detailed analysis of the
population and the sampling process that was used in collecting the research data. Primary data
was collected from the respondents through the application of a structured questionnaire. Data
analysis was done using the Statistical Package for Social Sciences (SPSS) version 21. The next
chapter (Chapter four) presents results and findings of the study.

29
CHAPTER FOUR
4.0 RESULTS AND FINDINGS
4.1 Introduction
This chapter presents the results and findings of the collected research data from the field. The
study sought to establish the factors affecting the uptake and penetration of insurance in Kenya.
The data was gathered exclusively from questionnaires as the research instrument. The
questionnaire was designed in line with the research questions of the study.
4.1.1 Response Rate
A total of 130 questionnaires were distributed out of which 97 questionnaires were returned
giving a response rate of 77%. This response was sufficient and representative of the population
and conforms to Mugenda and Mugenda (2003) stipulation that a response rate of 70% and
above is excellent. The findings are shown in Figure 4.1.
Response25%
Non-response75%
Figure 4.1: Response Rate
4.2 Demographic Information
4.2.1 Gender of the Respondents
The study sought to establish the gender of the respondents. The findings are shown in the Figure
4.2

30
Female47%
Male53%
Figure 4.2: Gender of the Respondents
The findings in Figure 4.2 show that 53% of the respondents were male while 47% were female.
Male respondents were the majority. This shows that all genders were involved thus giving a
good representation for the study.
4.2.2 Age Distribution
The respondents were asked to indicate their age and the findings were as shown in Figure 4.3.
0%
10%
20%
30%
40%
50%
60%
20-30years 31-40years 41-50years 51-60years 61 and
above years
23%
54%
18%
4% 2%
Per
cen
tag
e
Age
Figure 4.3: Age Distribution
As indicated in Table 4.3, 54% of the respondents were between 31-40 years; 23% were between
20-30 years; 18% were between 41-50 years; 4% were between 51-60 years and only 2% were
61 years and above. The majority of the respondents were between 31-40 years. These findings

31
reflect the age distribution of the Kenyan working population thereby providing relevant and
reliable information for the study.
4.2.3 Religion
The respondents were required to indicate their religion and the findings are as shown in Figure
4.4.
0%
10%
20%
30%
40%
50%
60%
70%
Christian Islam Hindu Buddhist Other
70%
22%
5% 2% 1%
Per
cen
tag
e
Religion
Figure 4.4: Religion
From the findings in Figure 4.4, 70% of the respondents were Christians, 22% Islam, 5% Hindu,
2% Buddhists while 1% represented other faiths. Those professing Christian faith were the
majority. These findings show that respondents from various religions were involved thereby
providing information on the different religious perspective on insurance penetration in Kenya.
4.2.4 Employment Status
The respondents were requested to indicate their employment status and the findings are as
shown in Figure 4.5.
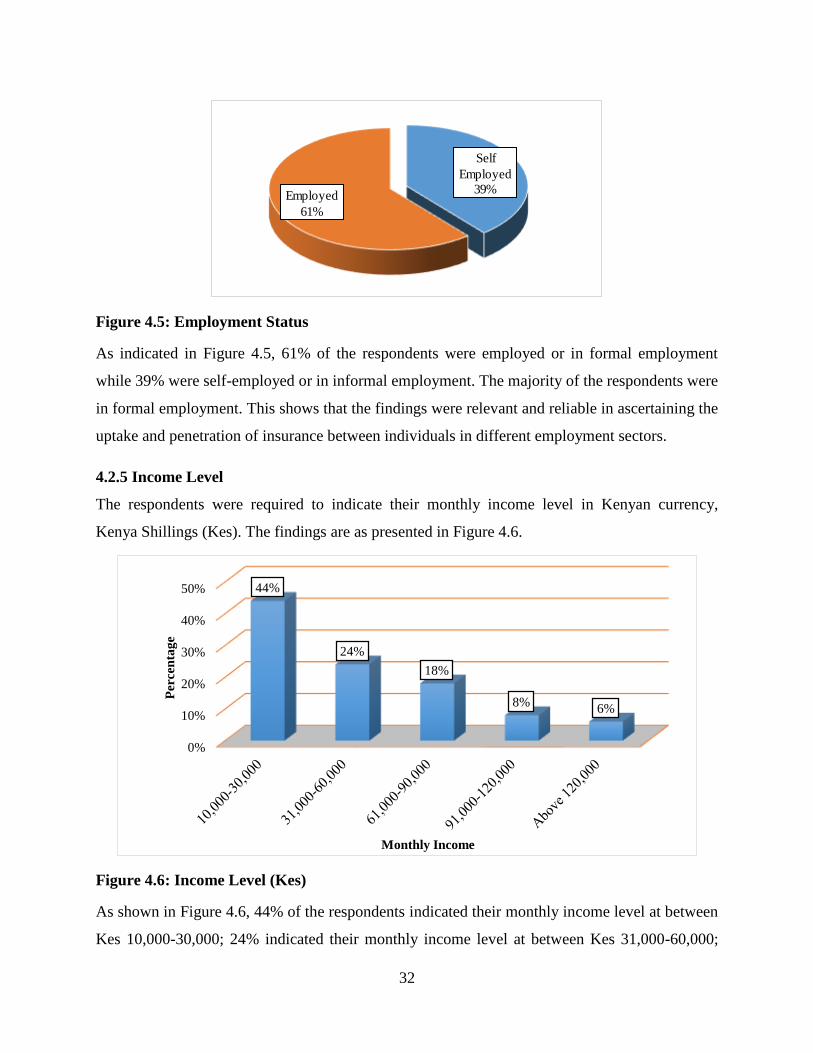
32
Self
Employed
39%Employed
61%
Figure 4.5: Employment Status
As indicated in Figure 4.5, 61% of the respondents were employed or in formal employment
while 39% were self-employed or in informal employment. The majority of the respondents were
in formal employment. This shows that the findings were relevant and reliable in ascertaining the
uptake and penetration of insurance between individuals in different employment sectors.
4.2.5 Income Level
The respondents were required to indicate their monthly income level in Kenyan currency,
Kenya Shillings (Kes). The findings are as presented in Figure 4.6.
0%
10%
20%
30%
40%
50% 44%
24%
18%
8%6%
Per
cen
tag
e
Monthly Income
Figure 4.6: Income Level (Kes)
As shown in Figure 4.6, 44% of the respondents indicated their monthly income level at between
Kes 10,000-30,000; 24% indicated their monthly income level at between Kes 31,000-60,000;

33
18% indicated their monthly income level at between Kes 61,000-90,000; 8% indicated their
monthly income level at between Kes 91,000-120,000 while 6% indicated their monthly income
level as above Kes 120,000. Majority of the respondents had an income level of between Kes
10,000 and Kes 30,000. This shows that the respondents were spread across different income
levels thereby providing information relevant and reliable for the study.
4.3 Social Aspects on Insurance Uptake and Penetration
Several statements on social aspects on insurance uptake and penetration were identified and the
respondents were required to give a rate in relation to the effects of social aspects on insurance
uptake and penetration in Kenya. A scale of 1-5 was provided as follows: 1= strongly disagree,
2=Disagree, 3= Agree, 4= Strongly Agree, 5= N/A (Not Applicable). From the responses, mean
and standard deviation were used for ease of interpretation and generalization of findings. The
findings are clearly illustrated in the subsequent sections.
4.3.1 Lack of Trust
The respondents were required to rate the effects of lack of trust on insurance uptake and
penetration in Kenya. The findings are illustrated on Table 4.1.
Table 4.1: Lack of Trust
Statement Mean Std. Dev
There is a general lack of trust of insurance companies by the general
public 2.81 .971
Poor agents integrity has led to low penetration of life insurance 2.88 .977
Poor claims management in the industry has been adversely affected by
fraud arising from unprofessional conduct of players 3.19 1.086
Customers have been misguided on the type of policies they should
take 2.84 .882
Insurance companies act very slowly in processing claims. 3.10 1.103
From the findings in Table 4.1, there was a general lack of trust of insurance companies by the
general public with mean of 2.81 and a standard deviation of 0.971; poor agents integrity
leading to low penetration of life insurance had a mean of 2.88 and a standard deviation of 0.977;
poor claims management in the industry adversely affected by fraud arising from unprofessional
conduct of players had a mean of 3.19 and a standard deviation of 1.086; customers misguided
on the type of policies they should take had a mean of 2.84 and a standard deviation of 0.882
while insurance companies acting very slowly in claims processing had a mean of 3.10 and a

34
standard deviation of 1.103. The mean values for the responses varied from 2.81-3.19 an
indication that the respondents were in agreement with the statement on Lack of Trust.
4.3.2 Family Networks
The respondents were asked to rate the effects of family networks on insurance uptake and
penetration in Kenya. The findings are as shown in Table 4.2.
Table 4.2: Family Networks
Statement Mean Std. Dev
I depend on informal and social connections for emergencies 2.53 1.267
My extended family assists to meet my urgent financial needs 2.32 1.087
I have a funeral welfare association that helps in incase of
bereavement of immediate family members 2.54 1.307
As shown in Table 4.2, the respondents depending on informal and social connections for
emergencies had a mean of 2.53 and a standard deviation 1.267.These findings concur with
Owusu (2007) who stated that that there were numerous informal and social support systems that
had the capacity to overshadow an individual’s sense of vulnerability to financial shocks. The
respondents using the extended family to meet their urgent financial needs had a mean of 2.32
and a standard deviation of 1.087. The mean values for the responses varied from 2.32-2.54
which showed that the respondents disagreed with the statement on effects of Family Networks
on insurance uptake and penetration in Kenya.
4.3.3 Own Savings
The respondents were asked to rate the effects of their own savings on insurance uptake and
penetration in Kenya. The findings are as shown in Table 4.3.
Table 4.3: Own Savings
Statement Mean Std. Dev
My personal savings are sufficient to meet my urgent financial needs 2.41 1.143
It is easier to access my personal savings in case of an emergency as
opposed to insurance and therefore I would rather depend on my
savings
2.75 1.099
Insurance premiums are expensive 2.78 1.268
As indicated in Table 4.3, the respondents indicating that their personal savings were sufficient
to meet their urgent financial needs had a mean of 2.41 and a standard deviation of 1.143; the
respondents indicating that it was easier to access personal savings in case of an emergency as
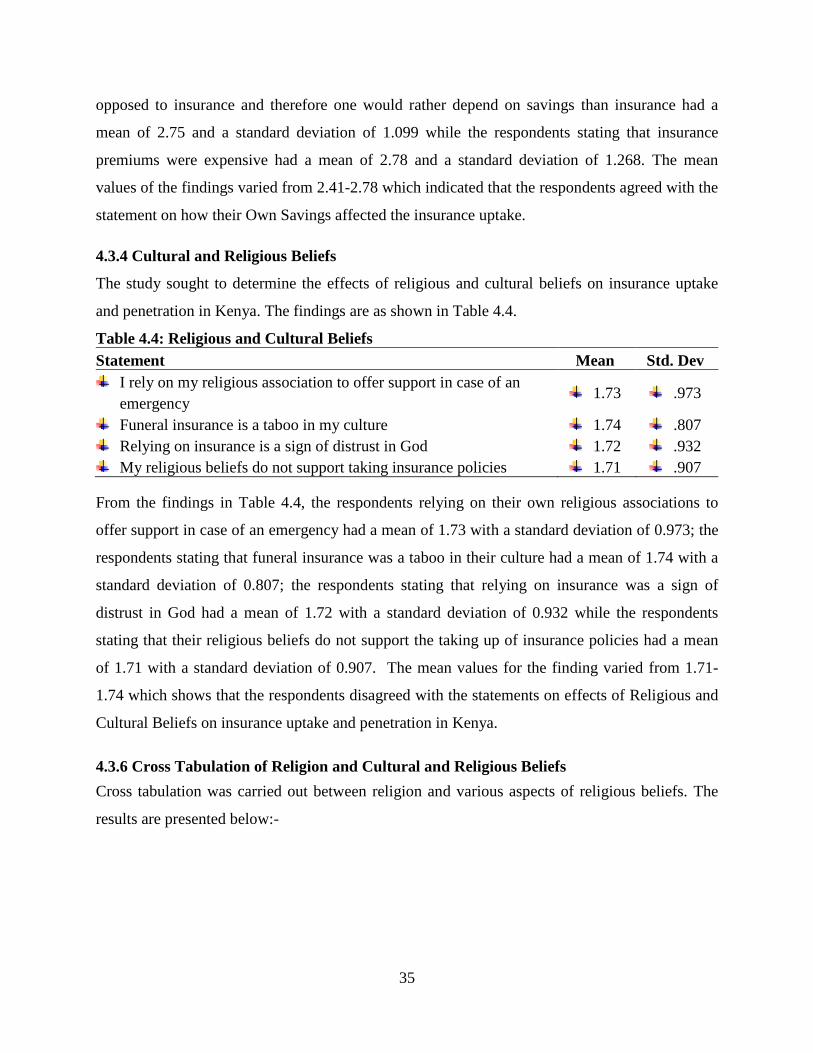
35
opposed to insurance and therefore one would rather depend on savings than insurance had a
mean of 2.75 and a standard deviation of 1.099 while the respondents stating that insurance
premiums were expensive had a mean of 2.78 and a standard deviation of 1.268. The mean
values of the findings varied from 2.41-2.78 which indicated that the respondents agreed with the
statement on how their Own Savings affected the insurance uptake.
4.3.4 Cultural and Religious Beliefs
The study sought to determine the effects of religious and cultural beliefs on insurance uptake
and penetration in Kenya. The findings are as shown in Table 4.4.
Table 4.4: Religious and Cultural Beliefs
Statement Mean Std. Dev
I rely on my religious association to offer support in case of an
emergency 1.73 .973
Funeral insurance is a taboo in my culture 1.74 .807
Relying on insurance is a sign of distrust in God 1.72 .932
My religious beliefs do not support taking insurance policies 1.71 .907
From the findings in Table 4.4, the respondents relying on their own religious associations to
offer support in case of an emergency had a mean of 1.73 with a standard deviation of 0.973; the
respondents stating that funeral insurance was a taboo in their culture had a mean of 1.74 with a
standard deviation of 0.807; the respondents stating that relying on insurance was a sign of
distrust in God had a mean of 1.72 with a standard deviation of 0.932 while the respondents
stating that their religious beliefs do not support the taking up of insurance policies had a mean
of 1.71 with a standard deviation of 0.907. The mean values for the finding varied from 1.71-
1.74 which shows that the respondents disagreed with the statements on effects of Religious and
Cultural Beliefs on insurance uptake and penetration in Kenya.
4.3.6 Cross Tabulation of Religion and Cultural and Religious Beliefs
Cross tabulation was carried out between religion and various aspects of religious beliefs. The
results are presented below:-

36
Table 4.5: Religion: * I rely on my religious association to offer support in case of an
emergency Cross tabulation
I rely on my religious association to offer support in case of an emergency
Total
Strongly
Disagree Disagree Agree
Strongly
Agree
Not
Applicable
Religion: Christian 34 26 2 3 3 68
Islam 13 3 5 0 0 21
Hindu 0 3 2 0 0 5
Buddhist 2 0 0 0 0 2
Other 1 0 0 0 0 1
Total 50 32 9 3 3 97
Findings on Table 4.5 revealed that 60 out of 68 (88%) of Christians surveyed did not depend on
religious inclination in case of an emergency while 16 out of 21(76%) of Muslims surveyed did
not depend on religious inclination in case of an emergency.
Table 4.6: Religion: * Funeral insurance is a taboo in my culture Cross tabulation
Funeral insurance is a taboo in my culture
Total
Strongly
Disagree Disagree Agree
Strongly
Agree
Not
Applicable
Religion: Christian 35 27 5 0 1 68
Islam 5 11 4 1 0 21
Hindu 0 4 1 0 0 5
Buddhist 2 0 0 0 0 2
Other 0 0 0 1 0 1
Total 42 42 10 2 1 97
Findings on Table 4.6 revealed that 62 out of 68 (91%) Christians surveyed indicated that funeral
insurance was not a taboo in their culture while 16 out of 21(76%) Muslims surveyed indicated
that funeral insurance was not a taboo in their culture.

37
Table 4.7: Religion: * Relying on insurance is a sign of distrust in God Cross tabulation
Relying on insurance is a sign of distrust in God
Total
Strongly
Disagree Disagree Agree
Strongly
Agree
Not
Applicable
Religion: Christian 39 19 7 2 1 68
Islam 11 6 2 2 0 21
Hindu 0 1 4 0 0 5
Buddhist 2 0 0 0 0 2
Other 0 0 1 0 0 1
Total 52 26 14 4 1 97
Findings on Table 4.7 revealed that 58 out of 68 (85%) Christians surveyed indicated that relying
on insurance was not a sign of distrust in God while 17 out of 21(80%) Muslims surveyed
indicated that relying on insurance was not a sign of distrust in God.
Table 4.8: Religion: * My religious beliefs do not support taking insurance policies Cross
tabulation
My religious beliefs do not support taking insurance policies
Total
Strongly
Disagree Disagree Agree
Strongly
Agree
Not
Applicable
Religion: Christian 38 22 4 3 1 68
Islam 7 11 0 3 0 21
Hindu 0 4 1 0 0 5
Buddhist 2 0 0 0 0 2
Other 0 0 1 0 0 1
Total 47 37 6 6 1 97
Findings on Table 4.8 revealed that 60 out of 68 (88%) Christians surveyed indicated that their
religious beliefs supported taking up insurance while 18 out of 21(86%) Muslims surveyed
indicated that their religious beliefs supported taking up of insurance.
In conclusion, the above findings on the cross tabulation between religion and religious/cultural
beliefs reveal that religion did not affect the uptake of insurance by the respondents.

38
4.3.5 Extent to which Social Aspects Affect Decision towards taking up Insurance
The study sought to determine the extent to which social aspects affected the decision to take up
insurance. The findings are presented in Table 4.9.
Table 4.9: Extent to which Social Aspects Affect Decision towards taking up Insurance
Statement Frequency Percent
To no extent 22 22.7
To a little extent 23 23.7
Moderate extent 24 24.7
Great extent 22 22.7
Very great extent 6 6.2
Total 97 100.0
From the findings, 22.7% of the respondents indicated that there was no extent to which social
aspects affected the decision to take up insurance; 23.7% indicated to a little extent; 24.7%
indicated to a moderate extent; another 22.7% indicated to a great extent while 6.2% indicated to
a very great extent.
4.4 Effects of Literacy Levels on Insurance Uptake and Penetration
Several statements on literacy levels on insurance uptake and penetration were identified and the
respondents were required to give a rate in relation to the effects of literacy levels on insurance
uptake and penetration in Kenya. A scale of 1-5 was provided as follows: 1= strongly disagree,
2=Disagree, 3= Agree, 4= Strongly Agree, 5= N/A (Not Applicable). From the responses, mean
and standard deviation were used for ease of interpretation and generalization of findings. The
findings are illustrated in the subsequent sections.
4.4.1 Policy Interpretation
The study sought to determine the effects of policy interpretation on insurance uptake and
penetration in Kenya. The findings are as shown in Table 4.10.

39
Table 4.10: Policy Interpretation
Statement Mean Std. Dev
Customers read the policies but misinterpret certain clauses and hence
their expectations differ with what is contained in the actual policy
document
2.84 1.083
Insurance products are complex legal contracts that can be poorly
understood by consumers 2.87 1.002
As indicated in Table 4.10, customers reading insurance policies but misinterpreting certain
clauses thereby having their expectations differing with what is contained in the actual policy
document had a mean of 2.84 with a standard deviation of 1.083; those stating that insurance
products were complex legal contracts poorly understood by consumers had a mean of 2.87 with
a standard deviation of 1.002. The respondents were in agreement with the statements on Policy
Interpretation as indicated by the mean values between 2.84-2.87
4.4.2 Awareness
The study sought to establish the effects of awareness on insurance uptake and penetration in
Kenya. The findings are as shown in Table 4.11.
Table 4.11: Awareness
Statement Mean Std. Dev
There is low level of awareness and lack of knowledge of insurance
products 2.75 1.020
There is general lack of awareness of the benefits of insurance 2.89 1.025
Awareness towards the rights and duties regarding insurance are
negligible. 2.72 1.106
Most insurance campaigns are product centered and there is general
lack of general information in insurance 2.97 0.999
From the results in Table 4.11, there was low level of awareness and knowledge of insurance
products with a mean of 2.75 and a standard deviation of 1.020; there was general lack of
awareness of the benefits of insurance with a mean of 2.89 and a standard deviation of 1.025;
awareness towards the rights and duties regarding insurance being negligible had a mean of 2.72
with a standard deviation of 1.106 while most insurance campaigns being product centered and
lack of general information about insurance had a mean of 2.97 with a standard deviation of

40
0.999. The respondents agreed with the statement on the effects of Awareness as shown by the
mean values ranging from 2.72-2.89.
4.4.3 Financial Literacy
The study sought to determine the effects of financial literacy on insurance uptake and
penetration in Kenya. The findings are as shown in Table 4.12.
Table 4.12: Financial Literacy
Statement Mean Std. Dev
I have basic financial management skills 3.17 1.030
The formal education that I have helps me in making financial decisions 2.92 0.915
Educated people are more likely to purchase insurance policies 3.08 0.986
Insurance companies in Kenya face the challenge of limited expertise
and skills amongst their workers. 3.17 1.020
As shown in Table 4.12, the respondents indicating that they had basic financial management
skills had a mean of 3.17 and a standard deviation of 1.030; that the formal education that they
had helped them in making financial decisions had a mean of 2.92 and a standard deviation of
0.915; that educated people are more likely to purchase insurance policies had a mean of 3.08
with a standard deviation of 0.986 and that insurance companies in Kenya face the challenge of
limited expertise and skills amongst their workers had a mean of 3.17 with a standard deviation
of 1.020. From the responses the respondents strongly agreed that Financial Literacy had an
effect on insurance uptake and penetration in Kenya.
4.4.4 Extent to which Literacy Level Affected Decision to taking up Insurance
The study sought to determine the extent to which literacy levels affected the decision to take up
insurance. The findings are presented in Table 4.13.
Table 4.13: Extent to which Literacy Levels Affected Decision to taking up Insurance
Frequency Percent
To no extent 25 25.8
To a little extent 12 12.4
Moderate extent 27 27.8
Great extent 19 19.6
Very great extent 14 14.4
Total 97 100.0
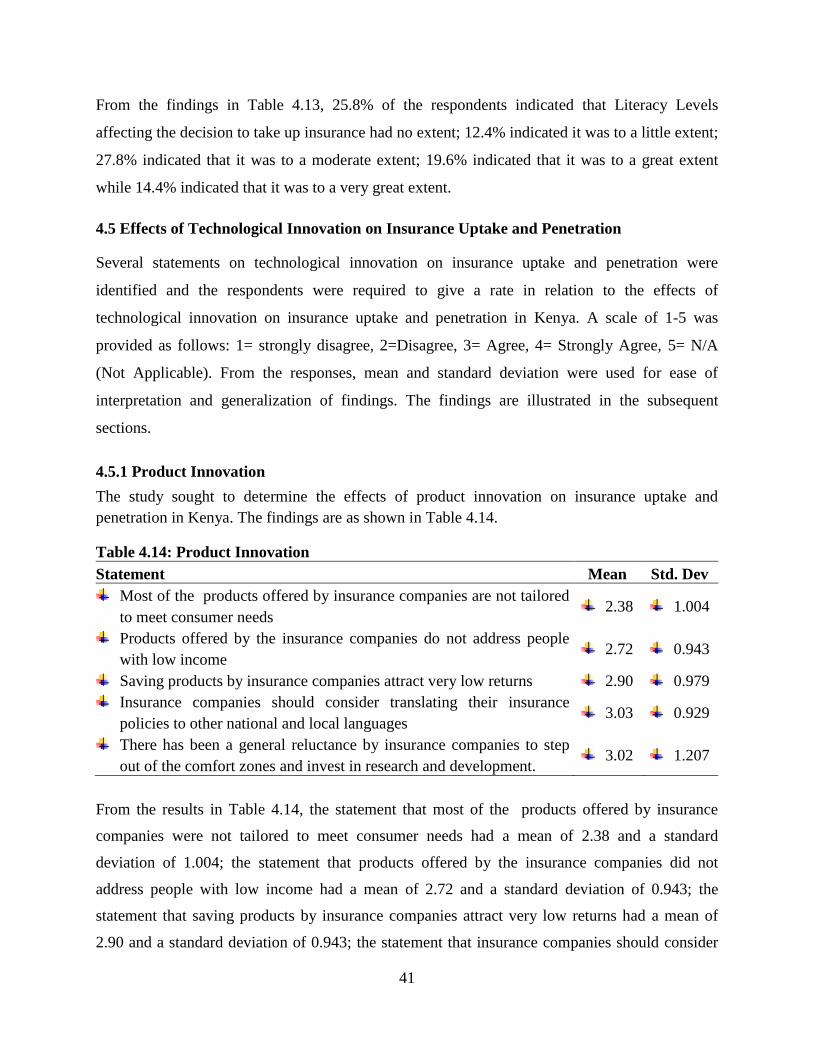
41
From the findings in Table 4.13, 25.8% of the respondents indicated that Literacy Levels
affecting the decision to take up insurance had no extent; 12.4% indicated it was to a little extent;
27.8% indicated that it was to a moderate extent; 19.6% indicated that it was to a great extent
while 14.4% indicated that it was to a very great extent.
4.5 Effects of Technological Innovation on Insurance Uptake and Penetration
Several statements on technological innovation on insurance uptake and penetration were
identified and the respondents were required to give a rate in relation to the effects of
technological innovation on insurance uptake and penetration in Kenya. A scale of 1-5 was
provided as follows: 1= strongly disagree, 2=Disagree, 3= Agree, 4= Strongly Agree, 5= N/A
(Not Applicable). From the responses, mean and standard deviation were used for ease of
interpretation and generalization of findings. The findings are illustrated in the subsequent
sections.
4.5.1 Product Innovation
The study sought to determine the effects of product innovation on insurance uptake and
penetration in Kenya. The findings are as shown in Table 4.14.
Table 4.14: Product Innovation
Statement Mean Std. Dev
Most of the products offered by insurance companies are not tailored
to meet consumer needs 2.38 1.004
Products offered by the insurance companies do not address people
with low income 2.72 0.943
Saving products by insurance companies attract very low returns 2.90 0.979
Insurance companies should consider translating their insurance
policies to other national and local languages 3.03 0.929
There has been a general reluctance by insurance companies to step
out of the comfort zones and invest in research and development. 3.02 1.207
From the results in Table 4.14, the statement that most of the products offered by insurance
companies were not tailored to meet consumer needs had a mean of 2.38 and a standard
deviation of 1.004; the statement that products offered by the insurance companies did not
address people with low income had a mean of 2.72 and a standard deviation of 0.943; the
statement that saving products by insurance companies attract very low returns had a mean of
2.90 and a standard deviation of 0.943; the statement that insurance companies should consider

42
translating their insurance policies to other national and local languages had a mean of 3.03 with
a standard deviation of 0.929 and the statement that there has been a general reluctance by
insurance companies to step out of the comfort zones and invest in research and development
had a mean of 3.02 and a standard deviation of 1.207.
4.5.2 Distribution Channels
The study sought to determine the effects of distribution channels on insurance uptake and
penetration in Kenya and the findings are shown on Table 4.15.
Table 4.15: Distribution Channels
Statement Mean Std. Dev
Social media has been underutilized by the insurance sector in Kenya 2.97 1.136
I would be willing to take up an insurance policy if there are loyalty
cards issued 3.08 1.213
Lack of digitization by insurance companies has negatively affected
customer interaction in the course of a policy period. 3.02 1.127
Lack of digitization has denied insurance companies important
feedback from customers 3.16 0.942
Insurance companies should exploit other distribution channels for the
penetration to increase 3.03 1.035
From the findings, the statement that social media has been underutilized by the insurance sector
in Kenya had a mean of 2.97 with a standard deviation of 1.136; the statement that an individual
would be willing to take up an insurance policy if loyalty cards are issued had a mean of 3.08
with a standard deviation of 1.213; the statement that lack of digitization by insurance companies
negatively affects customer interaction in the course of a policy period had a mean of 3.02 with a
standard deviation of 1.127; the statement that lack of digitization denies insurance companies
important feedback from customers had a mean of 3.16 with a standard deviation of 0.942 while
the statement that insurance companies should exploit other distribution channels for penetration
to increase had a mean of 3.03 with a standard deviation of 1.035.
4.5.3 Manual Processes
The study sought to establish the effects of manual processes on insurance uptake and
penetration in Kenya and the findings are shown on Table 4.16.
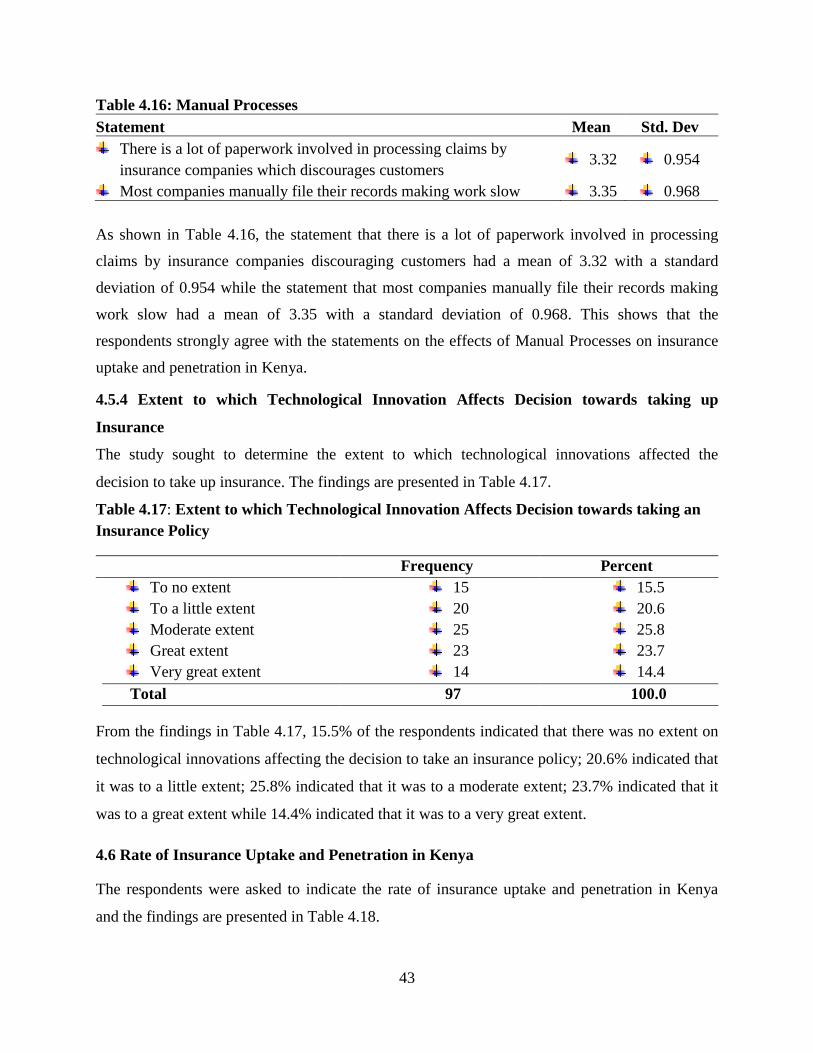
43
Table 4.16: Manual Processes
Statement Mean Std. Dev
There is a lot of paperwork involved in processing claims by
insurance companies which discourages customers 3.32 0.954
Most companies manually file their records making work slow 3.35 0.968
As shown in Table 4.16, the statement that there is a lot of paperwork involved in processing
claims by insurance companies discouraging customers had a mean of 3.32 with a standard
deviation of 0.954 while the statement that most companies manually file their records making
work slow had a mean of 3.35 with a standard deviation of 0.968. This shows that the
respondents strongly agree with the statements on the effects of Manual Processes on insurance
uptake and penetration in Kenya.
4.5.4 Extent to which Technological Innovation Affects Decision towards taking up
Insurance
The study sought to determine the extent to which technological innovations affected the
decision to take up insurance. The findings are presented in Table 4.17.
Table 4.17: Extent to which Technological Innovation Affects Decision towards taking an
Insurance Policy
Frequency Percent
To no extent 15 15.5
To a little extent 20 20.6
Moderate extent 25 25.8
Great extent 23 23.7
Very great extent 14 14.4
Total 97 100.0
From the findings in Table 4.17, 15.5% of the respondents indicated that there was no extent on
technological innovations affecting the decision to take an insurance policy; 20.6% indicated that
it was to a little extent; 25.8% indicated that it was to a moderate extent; 23.7% indicated that it
was to a great extent while 14.4% indicated that it was to a very great extent.
4.6 Rate of Insurance Uptake and Penetration in Kenya
The respondents were asked to indicate the rate of insurance uptake and penetration in Kenya
and the findings are presented in Table 4.18.

44
Table 4.18: Rate of Insurance Uptake and Penetration in Kenya
Frequency Percent
Very Bad 11 11.3
Bad 37 38.1
Moderate 25 25.8
Good 22 22.7
Very good 2 2.1
Total 97 100.0
From the findings in Table 4.18, a majority, 38.1% of the respondents indicated that insurance
uptake and penetration in Kenya was bad; 25.8% indicated that it was a moderate; 22.7%
indicated that it was good; 11.3% indicated that it was very bad while only 2.1% indicated that it
was very good.
4.7 Regression Analysis
The researcher conducted a multiple regression analysis to determine the extent to which the
three independent variables (social aspects, literacy levels and technological innovations)
influenced the uptake and penetration of insurance in Kenya. The following model was used:
Y = β0 + β1X1 + β2X2 + β3X3 + ε
Whereby Y = uptake and penetration of insurance in Kenya
X1 = social aspects
X2 = low literacy levels
X3 = technological innovations
The findings are shown in the subsequent sections.
Table 4.19: Model Summary
Model R R Square Adjusted R Square Std. Error of the Estimate
1 0.718 0.516 0.499 0.01743
From the findings in Table 4.19, R was 0.718 meaning that there was a positive relationship
between all the three factors that contribute to the low penetration and uptake of insurance. R2
was 0.516 implying that 51.6% of the dependent variable (low penetration and uptake of
insurance) could be explained by the independent variables (social aspects, literacy levels and
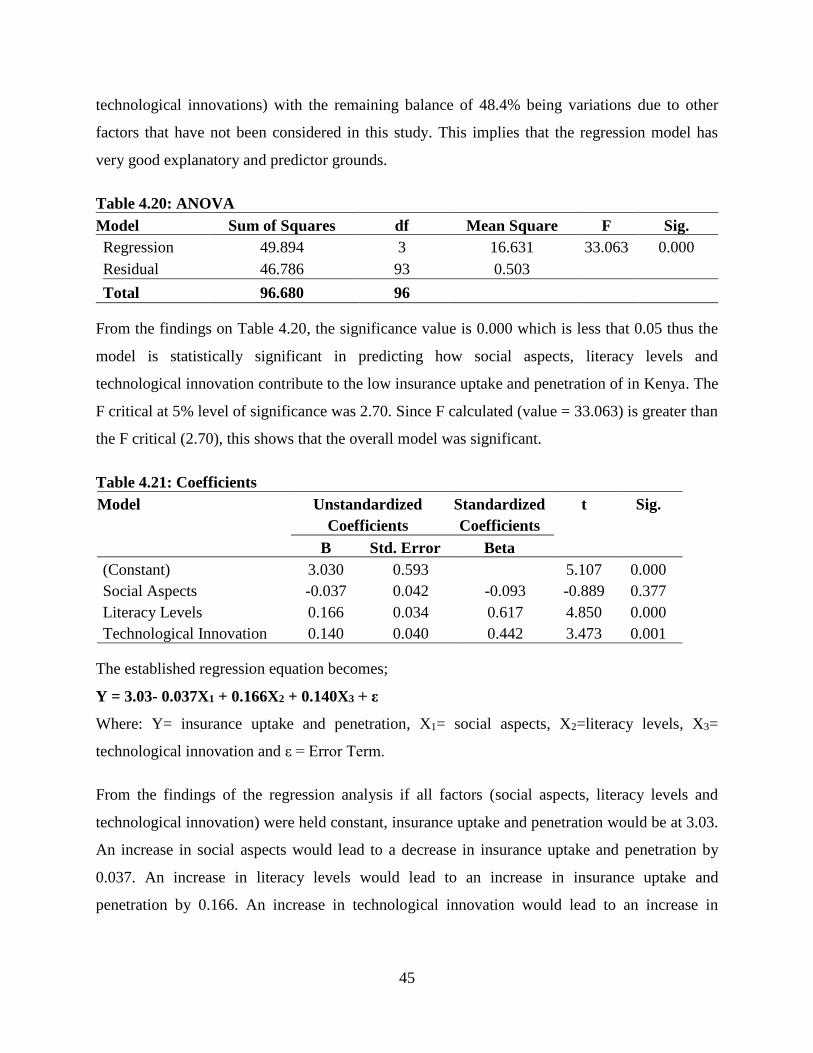
45
technological innovations) with the remaining balance of 48.4% being variations due to other
factors that have not been considered in this study. This implies that the regression model has
very good explanatory and predictor grounds.
Table 4.20: ANOVA
Model Sum of Squares df Mean Square F Sig.
Regression 49.894 3 16.631 33.063 0.000
Residual 46.786 93 0.503
Total 96.680 96
From the findings on Table 4.20, the significance value is 0.000 which is less that 0.05 thus the
model is statistically significant in predicting how social aspects, literacy levels and
technological innovation contribute to the low insurance uptake and penetration of in Kenya. The
F critical at 5% level of significance was 2.70. Since F calculated (value = 33.063) is greater than
the F critical (2.70), this shows that the overall model was significant.
Table 4.21: Coefficients
Model Unstandardized
Coefficients
Standardized
Coefficients
t Sig.
B Std. Error Beta
(Constant) 3.030 0.593 5.107 0.000
Social Aspects -0.037 0.042 -0.093 -0.889 0.377
Literacy Levels 0.166 0.034 0.617 4.850 0.000
Technological Innovation 0.140 0.040 0.442 3.473 0.001
The established regression equation becomes;
Y = 3.03- 0.037X1 + 0.166X2 + 0.140X3 + ε
Where: Y= insurance uptake and penetration, X1= social aspects, X2=literacy levels, X3=
technological innovation and ε = Error Term.
From the findings of the regression analysis if all factors (social aspects, literacy levels and
technological innovation) were held constant, insurance uptake and penetration would be at 3.03.
An increase in social aspects would lead to a decrease in insurance uptake and penetration by
0.037. An increase in literacy levels would lead to an increase in insurance uptake and
penetration by 0.166. An increase in technological innovation would lead to an increase in

46
insurance uptake and penetration by 0.140. Literacy levels and technological innovation had p-
values less than 0.05, an indication that they were significant in the study.
4.8 Chapter Summary
Chapter four gave a detailed account of the research findings. It showed the response rate and the
demographic information of the respondents. The chapter also highlighted social aspects, literacy
levels and technological innovation effects on insurance uptake and penetration in Kenya. The
next chapter, Chapter five presents discussions, conclusion and recommendations.

47
CHAPTER FIVE
5.0 DISCUSSION, CONCLUSIONS AND RECOMMENDATIONS
5.1 Introduction
The chapter provides the summary of the findings, discussion, conclusions and recommendations
of the study based on the research questions of the study. The general objective of this research
was to establish the factors that contribute to the low penetration and uptake of insurance in
Kenya.
5.2 Summary of the Study
The general objective of this study was to establish the factors that contribute to the low
penetration and uptake of insurance in Kenya. The specific objectives were to examine how
social aspects contribute to low insurance uptake and penetration in Kenya; to determine how
low literacy levels contribute to the low insurance uptake and penetration in Kenya and to
establish how lack of technological innovations contribute to low penetration and uptake of
insurance in Kenya.
The study adopted the explanatory research design which was deemed to be more effective in
meeting the objectives of this study. The study targeted 30 shopping malls within the Nairobi
County, Kenya and its environs. In identifying which mall to carry out the research, the
researcher used purposive sampling. The study was carried out at Taj Mall located in the Eastern
side of Nairobi (Eastlands) dominated by low income earners; T-Mall located at Nairobi West in
the Southern side dominated by middle income earners and Galleria Mall located in the affluent
Karen suburb dominated by high income earners. This research collected primary data using
questionnaires. Data collected was analyzed using descriptive statistics which were then
presented in the form of tabulations, percentages, mean and standard deviation.
The study found out that there was a general lack of trust of insurance companies by the general
public; poor agents integrity had led to low penetration of life insurance; poor claims
management in the industry had been adversely affected by fraud arising from unprofessional
conduct of players; customers had been misguided on the type of policies they should take and
that insurance companies acted very slowly in processing claims. The study also found out that

48
individuals depended on extended family, informal and social settings for assistance to meet
urgent financial needs. Additionally, they had funeral welfare associations that helped in incase
of bereavement of immediate family members. The study also revealed that personal savings
were sufficient to meet urgent financial needs; that it was easier to access personal savings in
case of an emergency as opposed to insurance and that insurance premiums were expensive.
The study established that customers read the policies but misinterpreted certain clauses. Hence
their expectations differed with what was contained in the actual policy document. The study
further established that insurance products are complex legal contracts that can be poorly
understood by consumers. The study also established that there were low levels of awareness and
lack of knowledge of insurance products; that there was a general lack of awareness of the
benefits of insurance; that the awareness towards the rights and duties regarding insurance were
negligible; that most insurance campaigns were product centered and that there was general lack
of general information in insurance. Additionally, the study established that formal education
helped in making financial decisions; educated people were more likely to purchase insurance
and the study went further to highlight that insurance companies in Kenya faced the challenge of
limited expertise and skills amongst their workers.
The study also revealed that social media had been underutilized by the insurance sector in
Kenya; that there was lack of digitization by insurance companies which had negatively affected
customer interaction in the course of a policy period; that there was lack of digitization which
had denied insurance companies important feedback from customers and that insurance
companies should exploit other distribution channels for penetration to increase. The study found
out that there was a lot of paperwork involved in processing claims by insurance companies
which discouraged customers and that most companies manually filed their records making work
slow.
5.3 Discussions
5.3.1 Effects of Social Aspect on Insurance Uptake and Penetration
On whether lack of trust affected insurance uptake and penetration the study found out that there
was a general lack of trust of insurance companies by the general public; there was poor agent’s
integrity; poor claims management arising from unprofessional conduct of players; customers
49
were misguided on the type of policies and that insurance companies acted very slowly in
processing claims. These findings concur with that of Dong et al (2009) and Baraza et al (2008)
who state that lack of trust in management of a policy was a reason for dropping out or not
participating in the policy. These findings were in line with those of IRA (2012) who established
that loss of trust was the highest contributing factor to lapsed usage of insurance policies. The
findings also concur with Odemba (2012) who found that customers were misguided on policies
that they should take. Bull (2009) stated that there were incidents where insurance agents
diverted clients’ money to their personal use and as such customers had become skeptical in
dealing with agents. The findings further concur with LIMRA (2011) who stated that the pace at
which insurance companies processed claims was slow causing customers to incur unnecessary
expenses in follow ups. The delay had been interpreted as lack of willingness to honor the claims
and as such customers did not trust insurance companies
On family networks, the study found out that individuals depended on informal and social
networks, extended family and funeral associations that offered support in incase of bereavement
of immediate family members. These findings are consistent with that of Ackah & Owusu (2012)
that the reason for the poor uptake of insurance can be summed up under cultural related reasons.
The findings correspond to FSD (2016) who state that the first place that most Kenyans turn to,
to pay for their hospital and other health related bills is cash that has been generated from their
businesses, salaried employment or from personal savings. Further the findings agree with
Clarke et al (2012) who state that savings are a significant part of peoples risk management
strategy since they allocate a substantial share of their money to group savings. It also
corresponds with the findings by KPMG (2014) who established that some of the insurance
products were expensive and hence prohibitive to most of the potential customers.
As for their own savings, the study revealed that personal savings are sufficient to meet urgent
financial needs in case of an emergency as opposed to insurance premiums which are expensive.
The findings are in agreement with that of FSD (2016) that the first place that most Kenyans turn
to, to pay for their hospital and other health related bills is cash that has been generated from
their businesses, salaried employment or from personal savings.
50
On whether cultural and religious beliefs affected insurance uptake and penetration the study
established that individuals did not rely on religious associations or inclinations and that funeral
insurance was not a cultural taboo as this was not a sign of distrust in God. These findings
contradict with the findings of Nduna (2013) who stated that low insurance penetration has been
attributed to cultural and religious beliefs which have led to the slow growth of the industry
especially within the African continent. These findings further contradict those of a number of
scholars like Hardman (2012) who stated that many people prefer to rely on traditional
arrangements or religious practices that give them support incase of any eventualities.
5.3.2 Effects of Literacy Levels on Insurance Uptake and Penetration
On policy interpretation, the study established that customers read the policies but misinterpreted
certain clauses and the study also established that insurance policies were complex legal
contracts. These findings are in agreement with those of Csiszar and Heidrich (2006) who
observe that insurance products are complex legal contracts that can be poorly understood by
consumers, particularly personal insurance consumers. These findings correspond to NAIC
(2010) who state that many insurance customers purchase a policy without understanding what is
covered in the policy, the conditions that must be met in order for the cover to apply when a loss
occurs and the exclusions that take away coverage. It further agrees with Csiszar and Heidrich
(2006) who observe that insurance products were complex legal contracts that could be poorly
understood by consumers, particularly personal insurance consumers.
On whether awareness influences insurance penetration and uptake, the study established that
there was low level of awareness and lack of knowledge of insurance products, the benefits, the
rights and duties regarding insurance and general information. These findings are in line with
those of Jain and Goyal (2012) who noted that despite the insurance industry having been in
existence for long, the level of awareness towards the rights and duties regarding insurance are
negligible. These findings are in agreement with Gitau (2013) who stated that there was general
lack of awareness of the insurance benefits and that a lot of people only came to know about
insurance when they bought their first car and had to insure it before they could start driving. It
also agrees with Jain and Goyal (2012) who noted that despite the insurance industry having
been in existence for long, the level of awareness towards the rights and duties regarding
insurance was negligible. The findings further agree with Olopade and Frolich (2012) who stated
51
that one of the failures in getting the populace to understand insurance was the approach that
insurance companies use in educating the public that are mostly product centered.
On financial literacy the study established that formal education helped in making financial
decisions and that educated people were more likely to purchase an insurance policy. The study
concurs with the findings of Olopade and Frolich (2012) who state that one way to remedy low
familiarity, lack of understanding and acceptance of insurance products is insurance literacy
education. These findings were in agreement with Hammond et al, (2007) who stated that higher
formal education had been found to foster need awareness to the individual and also enable more
objective analysis for the life insurance purchase decision. It also corresponds to Truett and
Truett (2004) who stated that higher educated individuals are hypothesized to have a stronger
inclination to protect their dependents through life insurance. These findings further agree with
Nduna (2013) who affirms that insurance companies in Africa face the challenge of limited
expertise and skills amongst their workers. The problem has been exacerbated by the brain drain
which has seen a significant part of the skilled workforce seek greener pastures in the advanced
economies and other emerging markets
5.3.3 Effects of Technological Innovation on Insurance Uptake and Penetration
On product innovation, the study established that most of the products offered were not tailored
to meet consumer needs; products did not address people with low income; savings products
attracted very low returns and that there had been general reluctance by insurance companies to
invest in research and development. These findings are in agreement with those of Cytonn
Investments (2015) who state that part of the problems facing insurance companies is the
existence of insurance products that are not tailored for the common consumer and the lack of
innovation to appeal to customers with low disposable income. The findings were also in line
with the recommendation by Cytonn investments (2015) who emphasized on the need to address
the bottom of the pyramid consumer both in terms of packaging the product, pricing, awareness
as well as using a language that could be understood by potential consumers. Nduna (2013)
noted that there was a general reluctance by insurance companies to step out of the comfort
zones and invest in research and development. It further agrees with KPMG (2014) who noted
that many insurers lacked customer profiling capabilities necessary to quickly match products
with high-potential customers hence the inability to provide tailor made solutions to their clients.

52
On the distribution channels used by the insurance companies the study revealed that social
media had been underutilized; lack of digitization by insurance companies had negatively
affected customer interaction and had denied insurance companies important feedback from
customers. These findings are in line with those of Accenture (2011) that technology including
descriptive and predictive analytics can help life insurers improve both their decisions regarding
new products and their levels of customer service. The findings further concur with KPMG
(2014) who state that insurance companies have been slow in embracing the use of technology
like the internet, mobile phone, contact centres and social media to improve on service and
product distibution. The study also agrees with the recommendation by Chikweche and Fletcher
(2012) who state that the usage of social networks for direct marketing not only builds awareness
among potential consumers but also enables a channel of getting feedback from them. Insurance
companies should exploit other distribution channels for the penetration to increase as
recommended by AKI (2012) who noted that the distribution channels had remained traditional
and urged the members to embrace technology in order to reach the untapped market.
The study further found out that that there was a lot of paperwork involved in processing claims
by insurance companies discouraging customers and that most companies manually filed their
records making work slow. The findings are in line with a survey carried out by Accenture
(2013) where they found out that customers were not happy with manual processes used by
insurance companies and that they would consider large internet companies such as Google and
Amazon as possible insurance providers. The findings further concur with recommendations by
Mutwa (2014) who suggested that some of the functions that can be automated included the
clerical and filing functions within an organization. This enables the filing of large amounts of
information and retrieving of the same when needed far much faster.
5.4 Conclusion
5.4.1 Effects of Social Aspect on Insurance Uptake and Penetration
Based on the findings the study concluded there is general lack of trust of the insurance by the
general public which can be attributed to poor agent’s integrity where agents misguide customers
on policies. Lack of trust could also be due to poor claims management where customers feel
that their claims are not handled well. There is high dependency on informal and social
connections for emergencies which have capacity to overshadow an individual’s sense of

53
vulnerability to financial shocks. The study further concludes that religion, cultural taboos and
beliefs do not affect the uptake of insurance in Kenya.
5.4.2 Effects of Literacy Levels on Insurance Uptake and Penetration
The study concludes that language barrier makes it difficult to understand what the insurance
agents are trying to explain and that the legal language used in the insurance documentation
forms is very technical and difficult to understand by the general public. The study also
concludes that people rarely hear about insurance unless it is about buying insurance or a new
insurance product launch. The uneducated members in the society view insurance as an
expensive venture. They believe that educated members in the society prefer to take insurance
cover since they understand its benefits.
5.4.3 Effects of Technological Innovation on Insurance Uptake and Penetration
The study concludes that there is underutilization of social media and lack of digitization by the
insurance sector in Kenya which has negatively affected customer interaction in the course of a
policy period. This could also have affected the uptake of insurance policies by potential
customers. There are limited distribution channels that are currently in use by insurance
companies. The paperwork involved in processing claims by insurance companies makes the
process slow and therefore discourages customers.
5.5 Recommendation
The study recommends that insurance companies should invest in building customer trust by
hiring well trained professionals who are able to represent the company well and also have a
clear understanding of insurance in order to communicate well to existing customers and
potential customers. Insurance companies should establish an efficient claims settlement system
that meets customer expectations.
The study revealed that awareness and access play a very important role in the uptake and
penetration of insurance. Therefore, effort to enhance awareness creation and to promote access
to insurance service providers will have a positive impact on the uptake of the insurance. The
study further found out that a higher percentage of the populace of the productive age is not

54
insured majority of who are in the informal sector. A strategy should be deployed by insurance
companies to target this lot of untapped potential market.
The study also recommends that insurance companies should work at simplifying the language
used in the policies to make it easy for the customers to understand. Insurance companies should
take it upon themselves to educate the public on insurance by initiating programs that help
members of the public have a general knowledge of insurance; they should turn away from
focusing too much on the launching of new insurance products. Additionally, insurance
companies should work at providing insurance solutions that are affordable to majority of the
population.
Insurance companies should make use of social media to increase customer interaction in the
course of a policy period. Social media will also assist them to target potential customers. There
is need to invest in digitization in order to reduce the manual processes that cause unnecessary
delays on customer claims. The study recommends that insurance companies should market
policies that provide for risk coverage and savings as that is what the customers prefer. Insurance
companies should also lower the cost of premiums; have product variety and have a country
wide presence to improve the penetration of insurance in Kenya.
5.6 Areas for Further Research
Related research and studies should be carried out in other parts of the country for comparison
purpose to ascertain if the findings in this study and those of the proposed related research and
studies will tally.

55
REFERENCES
Accenture (2013). Accenture’s Insurance industry practice. Retrieved from www.accenture.com.
Accenture, (2011). The Life Insurance Challenge: Battling Customer Indifference while
Increasing Customer Satisfaction. Retrieved from http://www.insurance-canada.ca
Ackah, C., & Owusu, A. (2012). Assessing the Knowledge of and attitude towards insurance in
Ghana, International Research Conference on Microinsurance, Twente.
American Psychological Association, (2014). Stress management: How to strengthen your social
support network. Retrieved from http://www.apa.org
Andersen, M., & Taylor, H. (2012). Sociology: The Essentials. New York: Cengage Learning
AON. (2014). Student insurance package international. Retrieved from
www.aonstudentinsurance.com
Asomani. F (2014). Understanding non-enrolment in Ghana's National Health Insurance
Scheme: a view from beneath. Master Thesis University of Oslo. Retrieved from
https://www.duo.uio.no
Awino, M. A. (2008). Responses of Kenya Reinsurance Corporation to the Challenges of
Globalization of the Reinsurance Industry, Unpublished MBA Awino Project, University
of Nairobi
Bain & Company (2015). Global Digital Insurance Benchmarking Report 2015. Retrieved from
www.bains.com
Basant, R. & Chandra, P. (2002). Building technological capabilities in a liberalizing developing
economy. Firm Strategies and Public Policy, 11 (4-5), 399-421.
Berger, J. T., & Halligan, M. R. (2011). Trademark Surveys: A Litigator's Guide. New York:
Oxford University Press
Bless, C., Smith, C. H., & Kagee, A. (2008). Fundamentals of social research methods. An
African perspective. Cape Town: Juta and Company
Carver, R., & Nash, J. (2011). Doing Data Analysis with SPSS: Version 18.0. New York:
Cengage Learning.
Chandran, E. (2004). Research methods: a quantitative approach with illustrations from
Christian ministries. Nairobi: Star Bright services Ltd
Chartered Insurance Institute (CII) (2014). Annual Report 2014: The Chartered Insurance
Institute. Retrieved from http://www.cii.co.uk

56
Chikweche T. & Fletcher. (2012). Undertaking qualitative research at the bottom of the Pyramid:
From theoretical considerations to practical realities. Qualitative Market research: An
international journal, 12(6), 86-91
Cole, S., Sampson, T., & Zia, B. (2009). Prices or knowledge? What drives demand for financial
services in emerging markets? Staff reports, Federal Reserve Bank of New York
Couper, M. P., Fowler, F. J., Groves, R. M., Lepkowski, J. M., Singer, E., & Tourangeau, R.
(2013). Survey Methodology. New York: John Wiley & Sons
Csiczar, E. & Heidrich, G. W. (2006). The Question of Reputational Risk: Perspective from
Industry, The Geneva Papers, 31: 382.
Cytonn Investments (2015). Kenya Listed Insurance Companies FY’2015 Report. Retrieved from
www.cytonn.com
Davis, K. (2013). East Africa’s Insurance Industry: Ready for Investment? Retrieved from
http://venturesafrica.com
Devore, J., Olsen, C., & Peck, R. (2011). Introduction to Statistics and Data Analysis. New
York: Cengage Learning
Eck J.R. & Nizovtsev D. (2006). The Impact of Culture on the Purchase of Life Insurance in
Latin America and the Caribbean, International Business & Economics Research
Journal, 5(1), 31-45.
Ernst & Young (2015). 2015 Global Insurance Outlook. Retrieved from www.ey.com
Ernst & Young (2016). Insurance Opportunities in Sub Saharan Africa. Retrieved from
www.ey.com
Eurostat. (2001) The third community innovation survey (CIS III). Retrieved from ec.europa.eu
FSD Kenya (2013). Fin Access National Survey 2013. Nairobi, Kenya: FSD Kenya.
Gine, X., Townsend, R., and Vickery, J. (2008). Patterns of rainfall insurance participation in
rural India. The World Bank Econoaccentmic Review Advance Access
Gitau, B.J. (2013). Strategies adopted by Kenyan insurance companies to alleviate low insurance
penetration. Unpublished MBA thesis. University of Nairobi.
Hardman, B. (2012). Micro-insurance & Climate Change. A4ID: Advocates for International
Development (Lawyers Eradicating Poverty). Retrieved from http://www.a4id.org.
Holzmann, R. (2010). Bringing financial literacy and education to low and middle income
countries: The need to review, adjust, and extend current wisdom. IZA Discussion Papers
5114, Institute for the Study of Labor (IZA).
57
Ibrahim, H. & Abubakar, S. (2011). Recapitalization and profitability of quoted Insurance
companies in Nigeria. Retrieved from www.businessafricaevents.com
Insurance Regulatory Authority (IRA), (2015). Annual report for 2014. IRA, Nairobi
IRA (2012). National survey on enterprises perception of insurance in Kenya. Retrieved from
http://www.ira.go.ke/
Ito, S. and Kono, H. (2009). Why is the take-up of microinsurance so low? Evidence from a
health insurance scheme in India? Technical report, Institute of Developing Economies
(IDE-JETRO).
Kamuzora, P. & L. Gilson. (2006). Factors influencing implementation of the Community Health
Fund in Tanzania. Health Policy and Planning, 22(2), 95-102.
Kasae, P. (2014). Energy Effeciency and Operational Performance of Manufacturing Firms in
Kenya. Journals in Business & Management, 2(3), 15–24.
Kiama N. (2015) Promoting insurance penetration in Kenya. Retrieved from
http://actuaries.or.ke
Kombo, K. D., & Tromp, A. L. D. (2006). Thesis writing: An introduction. Nairobi: Paulines
Publications.
Kothari, C. R. (2011). Research Methodology: Methods and Techniques. New York: New Age
International
KPMG (2014). The South African Insurance Industry Survey 2014. Retrieved from
www.kpmg.com
KPMG (2015). East Africa Insurance fraud risk survey 2015: Kenya Country Profile. Retrieved
from www.kpmg.com
KPMG report. (2012) Sector report; Insurance in Africa. Retrieved from www.kpmg.com
KPMG report. (2014) Sector report; Insurance in Africa. Retrieved from www.kpmg.com
Kumar, R. (2014). Research Methodology: A Step-by-Step Guide for Beginners. New York:
SAGE
Kyengo, M. F. (2014). The Relationship between manufacturing strategy and 0perational
performance within the metal and allied sector in Kenya. Journals in Business &
Management, 2(3), 36–40.
Landmann, A., Vollan, B., & Frolich, M. (2011). A behavioral experiment in the Philippines.
Technical report, University of Mannheim.
58
Lusardi, A. and Mitchell, O. S. (2009). How ordinary consumers make complex economic
decisions: Financial literacy and retirement readiness. CeRP Working Papers 90, Center
for Research on Pensions and Welfare Policies, Turin (Italy).
Marlow, C. (2010). Research Methods for Generalist Social Work. New York: Cengage
Learning.
Mathauer, I., Schmidt J.O. & Wenyaa M (2008). Extending social health insurance to the
informal sector in Kenya: An assessment of factors affecting demand. International
Journal of Health Planning and Management, 23. 51-68.
McKinsey (2014). Global Insurance Pools, fourth edition. Retrieved from www.mckinsey.com
McMurrian & Matulich, 2006. Building customer value and profitability with business ethics.
Journal of Business and Economics, 4(11): 11-18.
Ministry of Health, Government of Kenya (2014). 2013 Kenya Household Health Expenditure
and Utilization Survey. Nairobi, Kenya: Ministry of Health.
Mutwa, M. (2014). Employees Perceptions of the Effect of Business Process Re-Engineering on
Employee Performance at National Bank of Kenya. Journal of Business and
Management, 2(1), 17–19.
Mwiti L. (2016). How rogue insurance agents mislead clients in race for life cover commissions.
Retrieved from http://www.standardmedia.co.ke
National Association of Insurance Commissioners (2010). Understanding your insurance policy.
Retrieved from www.scc.virginia.gov
National Association of Insurance Commissioners (2012). Glossary of Insurance Terms.
Retrieved from http://www.naic.org.
Nduna A.J (2013). Low insurance penetration in emerging economies and way forward – the
African experience. Paper Presented at The 17th Insurance Congress of Developing
Countries (ICDC). Retrieved from http://airdc.org/
Ngatia, G. (2013). Maintenance Practices and Power Plants Operational Performance In Kenya.
International Journal of Business and Management Invention, 2(3), 14–25.
Ngugi, K (2015). Breaking the barriers to insurance penetration in Kenya
Retrieved from http://www.standardmedia.co.ke
Obalola, M.A (2010). Ethics and social responsibility in the nigerian insurance industry a Multi-
Methods Approach. Retrieved from www.dora.dmu.ac.uk
59
Odemba, J. (2013). Factors affecting uptake of life insurance in Kenya. Unpublished MBA,
University of Nairobi
Olopade, M & Frolich, M. (2012) The Impact of Insurance Literacy Education on Knowledge,
Attitude and Behavior - A Randomized Controlled Trial. University of Twente. Retrieved
from www.utwente.nl
Ong’ong’a, N.A. (2014) Effect of marketing strategies in gaining market share by insurance
companies in Kenya. Unpublished MBA thesis, University of Nairobi.
Owusu, G. A. (2007) Graying of the developing world: Emerging policy issues. Legon Journal
of International Affairs (Ghana), 4 (1olao), 1-25.
Reavis, M. W. (2012) Insurance concepts & coverage property, liability. Life, Health and Risk
Management (1st ed.). Canada: Friesen Press
Rono, A. (2013). Business Process Reengineering and Strategy Development in the Kenya
Commercial Bank Limited. Journal of Business and Management, 2(3), 60–65.
Servon, L J, & Kaestner, R. (Summer 2008). Consumer financial literacy and the impact of
online banking on the financial behavior of lower-income bank customers. Journal of
Consumer Affairs, 42(2), 271- 275
Singleton, R. A., & Straits, B. C. (2005). Approaches to social research (4thed.). New York:
Oxford University Press.
Swiss Reinsurance Company, (2012). Zurich: Sigma Publication, No. 5/2006.
Thornton, R. L., L. E. Hatt, E. M. Field, M. Islam, F. Solis Diaz, & Gonzalez M. A. (2010).
Social Security health insurance for the informal sector in Nicargua: A randomized
evaluation. Health Economics, 9(1), 181-206.
Van Rooij, M., Lusardi, A., & Alessi, R. (2007). Financial literacy and stock market
participation. DNB Working Papers 146, Netherlands Central Bank, Research
Department.
Vaus, D. d. (2013). Surveys in Social Research - Sixth Edition. London: Routledge.
Wairegi, B. I. (2004). The Strategic response by life insurance companies in Kenya to changes in
their environment. (MBA Research Project) University of Nairobi Library
Yaari, M. (2009). Uncertain Lifetime, Life Insurance, and the Theory of the Consumer. Review
of Economic Studies, 32, 137-150
60
APPENDICES
APPENDIX I: QUESTIONNAIRE COVER LETTER
RE: Survey Questionnaire
Dear Respondent,
I am a post graduate student of the Global Executive Master in Business Administration program
at the United States International University. The PURPOSE OF THE STUDY IS TO
ESTABLISH FACTORS INFLUENCING PENETRATION AND UPTAKE OF
INSURANCE IN KENYA.
You are part of the selected sample of respondents whose views I seek on the above mentioned
matter. Your honest answers will be completely anonymous, but your views in combination with
those of others are extremely important in this research. All the information you provide will be
treated with strict confidentiality and used for the purpose of completing this study only. Please
answer the questions as accurately as possible.
Please tick the appropriate answer for each question and answer ALL the questions.
I guarantee that all information will be handled with Strict Confidentiality.
Thank you for your cooperation

61
APPENDIX II: QUESTIONNAIRE
SECTION A: DEMOGRAPHICS
1. Gender:
a) Male [ ]
b) Female [ ]
2. Age: __________ Years
3. Religion:
a) Christian [ ]
b) Islam [ ]
c) Hindu [ ]
d) Buddhist [ ]
e) Other(specify)______________
4. Employment
a) Employed [ ]
b) Self Employed [ ]
5. Income level in Kenya Shillings _______________________________________

62
SECTION B: RESEARCH OBJECTIVES
EFFECTS OF SOCIAL ASPECTS ON INSURANCE UPTAKE AND PENETRATION
Please mark “(✓)” in the box that corresponds best to your answer.
Statement: On a scale of 1-5 where 1= strongly disagree, 2=Disagree, 3=
Agree, 4= Strongly Agree, 5= N/A (Not Applicable) please rate the following
statements in regards to effects of social aspects on insurance uptake and
penetration in Kenya
1 2 3 4 5
Lack of Trust
6. There is a general lack of trust of insurance companies by the general
public
7. Poor agents integrity has led to low penetration of life insurance
8. Poor claims management in the industry has been adversely affected by
fraud arising from unprofessional conduct of players
9. Customers have been misguided on the type of policies they should take
10. Insurance companies act very slowly in processing claims.
Family Networks: I do not need insurance because……..
11. I depend on informal and social connections for emergencies
12. My extended family assists to meet my urgent financial needs
13. I have a funeral welfare association that helps in incase of bereavement of
immediate family members
Own Savings: I do not need insurance because…..
14. My personal savings are sufficient to meet my urgent financial needs
15. It is easier to access my personal savings in case of an emergency as
opposed to insurance and therefore I would rather depend on my savings
16. Insurance premiums are expensive
Religious and Cultural Beliefs: I do not need insurance because…..
17. I rely on my religious association to offer support in case of an emergency
18. Funeral insurance is a taboo in my culture
19. Relying on insurance is a sign of distrust in God
20. My religious beliefs do not support taking insurance policies
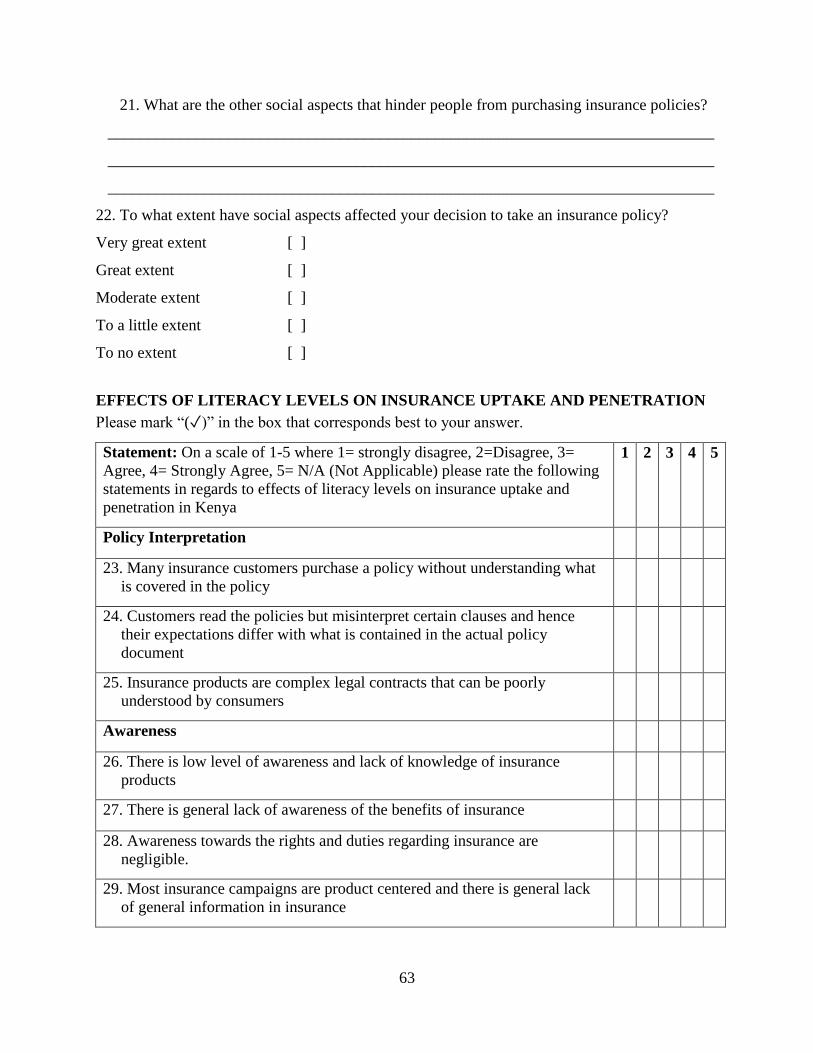
63
21. What are the other social aspects that hinder people from purchasing insurance policies?
____________________________________________________________________________
____________________________________________________________________________
____________________________________________________________________________
22. To what extent have social aspects affected your decision to take an insurance policy?
Very great extent [ ]
Great extent [ ]
Moderate extent [ ]
To a little extent [ ]
To no extent [ ]
EFFECTS OF LITERACY LEVELS ON INSURANCE UPTAKE AND PENETRATION
Please mark “(✓)” in the box that corresponds best to your answer.
Statement: On a scale of 1-5 where 1= strongly disagree, 2=Disagree, 3=
Agree, 4= Strongly Agree, 5= N/A (Not Applicable) please rate the following
statements in regards to effects of literacy levels on insurance uptake and
penetration in Kenya
1 2 3 4 5
Policy Interpretation
23. Many insurance customers purchase a policy without understanding what
is covered in the policy
24. Customers read the policies but misinterpret certain clauses and hence
their expectations differ with what is contained in the actual policy
document
25. Insurance products are complex legal contracts that can be poorly
understood by consumers
Awareness
26. There is low level of awareness and lack of knowledge of insurance
products
27. There is general lack of awareness of the benefits of insurance
28. Awareness towards the rights and duties regarding insurance are
negligible.
29. Most insurance campaigns are product centered and there is general lack
of general information in insurance

64
Financial Literacy
30. I have basic financial management skills
31. The formal education that I have helps me in making financial decisions
32. Educated people are more likely to purchase insurance policies
33. Insurance companies in Kenya face the challenge of limited expertise and
skills amongst their workers.
34. To what extent have literacy issues affected your decision to take an insurance policy?
Very great extent [ ]
Great extent [ ]
Moderate extent [ ]
To a little extent [ ]
To no extent [ ]
EFFECTS OF TECHNOLOGICAL INNOVATION ON INSURANCE UPTAKE AND
PENETRATION
Please mark “(✓)” in the box that corresponds best to your answer.
Statement: On a scale of 1-5 where 1= strongly disagree,
2=Disagree, 3= Agree, 4= Strongly Agree, 5= N/A (Not Applicable)
please rate the following statements in regards to effects of literacy
levels on insurance uptake and penetration in Kenya
1 2 3 4 5
Product Innovation
35. Most of the products offered by insurance companies are not
tailored to meet consumer needs
36. Products offered by the insurance companies do not address
people with low income
37. Saving products by insurance companies attract very low returns
38. Insurance companies should consider translating their insurance
policies to other national and local languages.
39. There has been a general reluctance by insurance companies to
step out of the comfort zones and invest in research and
development.
Distribution Channels
40. The social media has been underutilized by the insurance sector
in Kenya

65
41. I would be willing to take up an insurance policy if there are
loyalty cards issued
42. Lack of digitization by insurance companies has negatively
affected customer interaction in the course of a policy period.
43. Lack of digitization has denied insurance companies important
feedback from customers
44. Insurance companies should exploit other distribution channels
for the penetration to increase
Manual Processes
45. There is a lot of paperwork involved in processing claims by
insurance companies which discourages customers.
46. Most companies manually file their records making work slow.
47. To what extent have technological innovation aspects affected your decision to take an
insurance policy?
a) Very great extent [ ]
b) Great extent [ ]
c) Moderate extent [ ]
d) To a little extent [ ]
e) To no extent [ ]
48. How would you rate insurance uptake and penetration in Kenya
a) Very good
b) Good
c) Neutral
d) Bad
e) Very Bad

66
APPENDIX III: INSURANCE PENETRATION IN AFRICA (2012)
Country Premiums
(US$
Million)
Nominal
GDP
(US$ Billion)
Population
(Millions)
Density
(Prem per
Capita, US$)
Penetration
Rate (%)
South Africa 54,817.0 384.3 52.4 1,047.4 14.28
Morocco 2,857.0 961.1 32.5 87.9 2.97
Nigeria 1,828.0 270.2 168.8 10.8 0.68
Egypt 1,818.0 269.0 80.7 22.5 0.68
Kenya 1,290.0 40.7 43.2 29.9 3.17
Algeria 1,250.0 208.2 38.5 32.5 0.60
Angola 1,140.0 114.1 20.8 54.8 1.00
Namibia 980.0 13.1 2.3 433.7 7.50
Tunisia 816.0 45.2 10.9 75.0 1.81
Ghana 791.0 39.6 25.4 31.2 2.00
Mauritius 655.0 11.3 1.2 528.4 5.78
Botswana 459.9 14.5 2.0 229.5 3.17
Tanzania 254.2 28.2 47.8 5.3 0.90
Gabon 238.9 18.4 1.6 146.3 1.30
Senegal 202.5 14.5 13.7 14.7 1.40
Libya 173.6 82.7 6.2 28.2 0.21
Zimbabwe 166.6 9.8 13.7 12.1 1.70
Rwanda 164.0 7.1 11.5 14.3 2.30
Uganda 128.5 19.5 36.3 3.5 0.66
Togo 41.6 3.8 6.6 6.3 1.09
Others 1,765.1 331.7 465.7 3.8 0.53
Total 71,891.0 2,022.0 1,081.9 66.4 3.56
Source: Swiss Re, (2012)

67
APPENDIX IV: INSURANCE PENETRATION IN AFRICA (2014)
Country Insurance
Premiums
($bn)
Population
(Millions)
Density
(Premiums
Per Capita, $)
GDP
($bn)
Penetration
(Premiums as
%age of GDP)
South Africa 51.6 53.2 970.8 366.2 14.2
Morocco 3.2 32.9 96.8 103.8 3.1
Egypt 1.9 84.7 22.3 271.4 0.7
Nigeria 1.6 169.3 9.7 521.8 0.3
Kenya 1.5 41.8 36.4 55.2 2.8
Algeria 1.5 37.9 40.1 208.8 0.7
Angola 1.1 23.7 47.4 124.2 0.9
Namibia 1.0 2.2 437.2 13.1 7.2
Tunisia 0.8 10.9 77.3 47.0 1.8
Mauritius 0.7 1.3 570.3 11.9 6.0
Other Countries 4.9 628.7 7.9 652.0 0.8
Total 69.9 1,086.4 64.4 2,375.6 2.9
Rest of Africa
Excluding South
Africa
18.3 1,033.3 17.7 2,009.3 0.9
Source: KPMG, (2014)

68
APPENDIX V: LIST OF SHOPPING MALLS IN KENYA
1 Westgate Shopping Mall
2 Sarit Centre, Westlands
3 The Mall, Westlands
4 The Village Market, Gigiri
5 Diamond Plaza, Parklands
6 Yaya Centre, Kilimani
7 The Milele Mall, Ngong
8 Crossroads Mall, Karen
9 The Hub, Karen
10 The Junction, Ngong Road Nairobi
11 Maasai Mall, Rongai
12 Capital Centre, Mombasa Road, Nairobi
13 Nakumatt Mega, Nairobi
14 Prestige Plaza, Ngong Road Nairobi
15 Nakumatt Lifestyle, Nairobi
16 Mountain Mall, Kasarani Nairobi
17 Galleria Mall Shopping Mall, Karen-Langata Road, Nairobi
18 T-Mall, Nairobi West
19 Shujaa Mall, Nairobi
20 Taj Shopping Mall, Embakasi Nairobi
21 Thika Road Mall (T.R.M.), Roysambu Nairobi
22 The Gift Mall, Nairobi
23 Greenspan Mall, Doonholm, Nairobi
24 Ridgeways Mall, Nairobi
25 Garden City Shopping Complex, Kasarani Thika Road Nairobi
26 Gateway Mall, Mombasa Road
27 Two Rivers, Runda/Gigiri Nairobi
28 The Point, Buruburu Nairobi
29 Comesa Mall, Eastleigh Nairobi
30 Greenhouse, Ngong Road Nairobi
Source: Project Guternberg (2015)


