International Journal of Latest Engineering and Management Research (IJLEMR) ISSN: 2455-4847 www.ijlemr.com || Volume 02 - Issue 09 || September 2017 || PP. 01-10
www.ijlemr.com 1 | Page
Performance Analysis of an Omnidirectional Intake Duct
Wind turbine using CFD
BodaHadyaa, JaipalreddyPailla
b
aAssociate Professor, Department of Mechanical Engineering, UCE, OU, Hyd., India
bM.E(Turbomachinery), MED, UCE, Osmania University, Hyd., India
Abstract:At the beginning of 20th
century, conversion of wind energy to electrical power marked a turning
point for the wind power harnessing industry. Among the wind power harnessing systems, horizontal axis tower
mounted wind turbines are the most widely used to generate electrical power. These are large, mechanically
complex turbines and the huge towers used to hold them are the trend of currently existing wind power industry,
and they are also expensive, difficult to move, less efficient, and hazardous to people and environment. Efforts
to improve the performance of these wind turbines include introducing different varieties of ducts. Among the
ducted wind turbines, Omnidirectional intake duct have recently attracted research interest, partly due to
experimental data showing this technology performs much better than the traditional wind turbines. The
attractive features associated with this concept include, elimination of large, mechanically complex towers and
turbines, elimination of yaw and pitch control units. As this duct is able to capture the wind from any direction
(360o) effectively hence, it performs much better than currently existing wind turbine system of the same
diameter and aerodynamic characteristics under the same wind conditions and it delivers significantly higher
output, at reduced cost. In this work, Omnidirectional intake duct a new concept in wind power harnessing is
described, and it’s performance has also been investigated in terms of flow characteristics using computational
fluid dynamics methods.The objective of the present work is to understand the flow field inside the duct where
the actual wind turbine is located as well the external flow field using CFD technique by employing K-ε
turbulence model with Finite volume method in simulation by using ANSYS 15 FLUENT software code. The
present computations involves cases with different real time incoming wind velocities varying from 1.5 m/s to
6.7m/s. The results show that it is possible to increase the wind velocities by accelerating inside the venturi
section of the duct, thus the increased wind velocities results in significant improvement in the power output of
the wind turbines.
Keywords:Ducted Wind Turbines, Omnidirectional intake duct, Wind energy, Renewable energy
1. Introduction Since a very long time, people have been utilizing wind energy, initially for propelling boats, pumping
water and grinding grain,cooling, running machinery in farms, and even small production facilities. In late
1800s and early 1900s, conversion of wind energy to electrical power marked a turning point for the wind power
generation industry. Due to energy crises and changes in the political and social climates, wind turbines started
to rapidly spread across the globe in the last three decades. However, wind power is far from reaching its full
potential. Scientists have been consistently putting the efforts to improve the conventional wind turbines in the
last two decades but the maximum energy output gains have come from constructinglarger turbines. As the size
and height of turbine and tower increase, the cost of power generated from wind continues to exceed the cost of
power generated by hydropower and thermal power plants. The major problems associated with the current
wind power industry include, excessive downtime, failure and repair costs are high, high decibel-low frequency
sound waves, propeller noise, flickering of light, the visual nuisances of large wind farms, etc. are damaging
human health and environment.
Conversion of wind power to electrical energy depends on free stream wind speed, blade shape, blade
orientation and blade radius, etc. Because of these design parameters, the height of thetower and size of the
bladesare kept on increasing to excessive range in conventional wind turbines due to high energy demands. The
horizontal wind turbine theoretically converts maximum of 59.3% (Betz Limit) of available kinetic energy. In
practice, the conversion efficiency may be in the range of only 30 to 35%. Hence, there is an excellent
opportunity to increase the efficiency of wind turbine using a nozzle system. The concept of duct system is
introduced to increase the efficiency of wind turbine using funnel or conduit around the rotor. Rise in air
velocity at the inlet of turbine increases the efficiency of wind turbines, since power in the wind is directly
proportionate to the cube of air velocity at the inlet of rotor.
International Journal of Latest Engineering and Management Research (IJLEMR) ISSN: 2455-4847 www.ijlemr.com || Volume 02 - Issue 09 || September 2017 || PP. 01-10
www.ijlemr.com 2 | Page
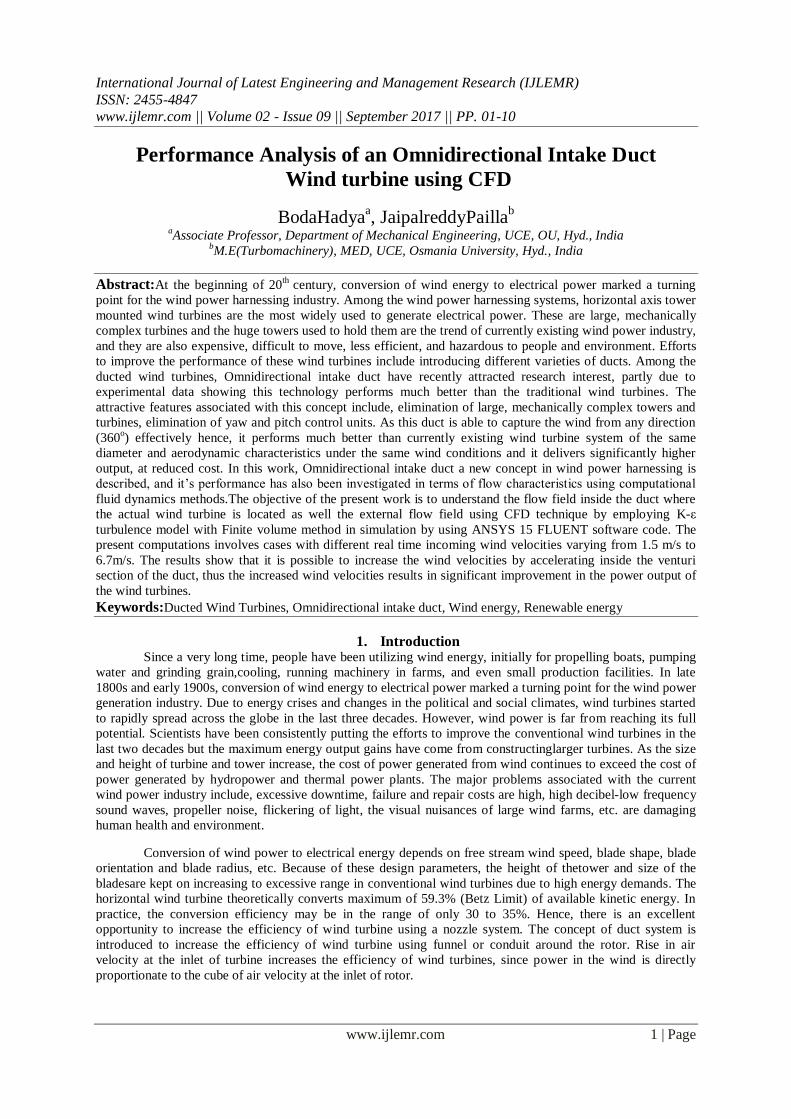
1.1 Omnidirectional Intake Duct Wind is collected at the top of the duct i.e. Omnidirectional intake area, which can collect wind from
any direction. Wind is then directed through the system, which concentrates and further accelerates in the
venturi section. The venturi effect is the phenomenon that occurs when a fluid is flowing through a pipe is
forced through a narrow section, resulting in decrease in pressure and increase in velocity.Then wind is
delivered to the turbine to convert the accelerated wind to electrical power. Diffuser then returns the wind to the
surrounding environment.The advanced features associated with this concept are, elimination of tower mounted
turbines, which are large, mechanically complex and also expensive, difficult to move, less efficient, and
hazardous to people and environment. And there is no need for a passive or active yaw control unit and it also
provides solutions to all the major problems that have so far faced in the present wind industry, such as low
turbine reliability, intermittency issues and adverse environmental and radar impact.The five key parts of
Omnidirectional intake duct wind turbine are shown in fig.1: 1) Intake;2) Pipe carrying and accelerating wind;3)
Boosting wind speed by a venturi; 4) Wind energy conversions system;5) Diffuser.
Control volume analysis for conservation of mass, axial and angular momentum balances, and energy
conservation for inviscid, incompressible axisymmetric flows yields[3]:
𝜌𝐕. 𝑑𝐀 = 0𝐴
; 𝑢𝑥𝜌𝐕. 𝑑𝐀 = 𝑇 − 𝑝 𝑑𝐀. 𝐞𝑥𝐴𝐴
𝑟𝑢𝜃𝜌𝐕. 𝑑𝐀 = 𝑄𝐴
; 𝑝
𝜌+
1
2 𝑉2 𝜌𝐕. 𝑑𝐀 = 𝑃
𝐴
Where,
V = (𝑢𝒙,𝑢𝒓,𝑢𝜽) is the velocity vector in the axial, radial, and azimuthal direction; r is the radius; ρ is the density
of air; A is outward pointing area vector of the control surface; ex is the unit vector in the X direction; p is the
pressure; T is the axial force on the rotor; Q is the torque; P is the power extracted from the rotor.
Fig.1: Omnidirectional duct with its key components and it’s working mechanism[3].
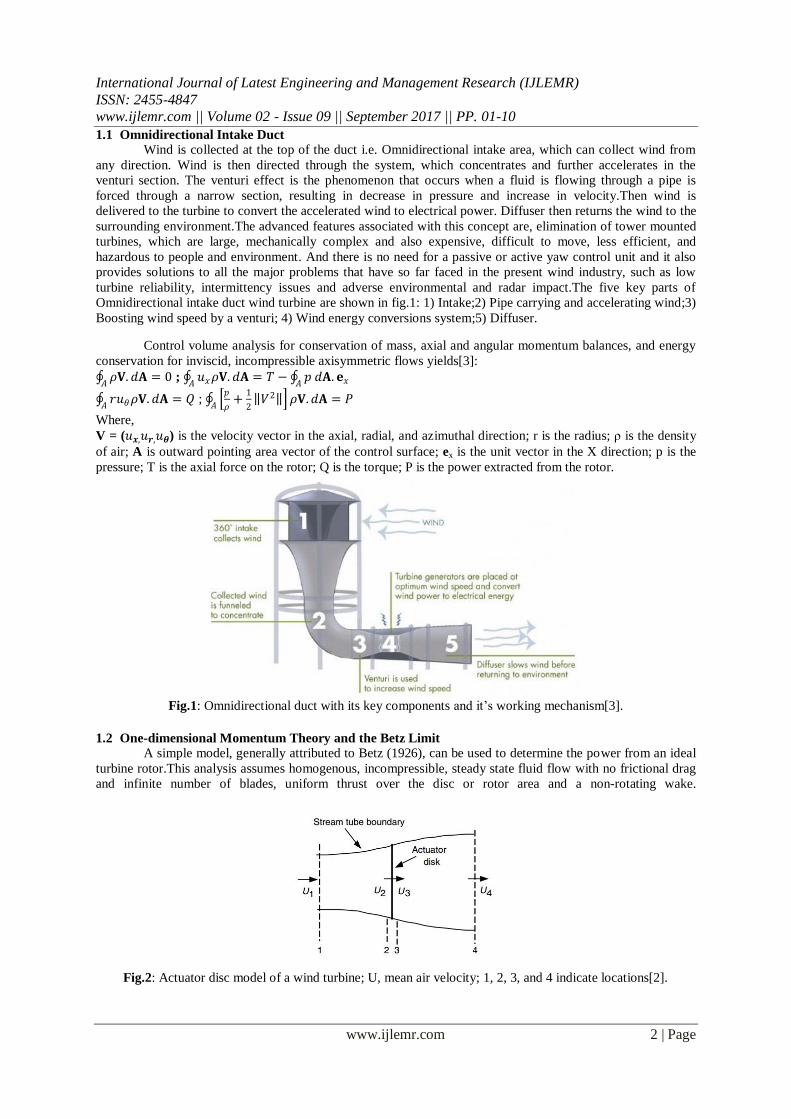
1.2 One-dimensional Momentum Theory and the Betz Limit
A simple model, generally attributed to Betz (1926), can be used to determine the power from an ideal
turbine rotor.This analysis assumes homogenous, incompressible, steady state fluid flow with no frictional drag
and infinite number of blades, uniform thrust over the disc or rotor area and a non-rotating wake.
Fig.2: Actuator disc model of a wind turbine; U, mean air velocity; 1, 2, 3, and 4 indicate locations[2].
International Journal of Latest Engineering and Management Research (IJLEMR) ISSN: 2455-4847 www.ijlemr.com || Volume 02 - Issue 09 || September 2017 || PP. 01-10
www.ijlemr.com 3 | Page
Applying the conservation of linear momentum to the control volume enclosing the whole system, one
can find the net force on the contents of the control volume. And then after differentiating it for obtaining
maximum power, we get optimum power coefficient as
𝐶𝑃𝑚𝑎𝑥 = 16
27≈ 0.59259
𝑃𝑚𝑎𝑥 = 1
2𝐶𝑃𝜌𝐴𝑉3 ; 𝑃𝑚𝑎𝑥 =
2
27𝜋𝜌𝐷2𝑉3
Where,D is the diameter of the swept area A and V is the free stream wind speed[2].
2. Solution methodology
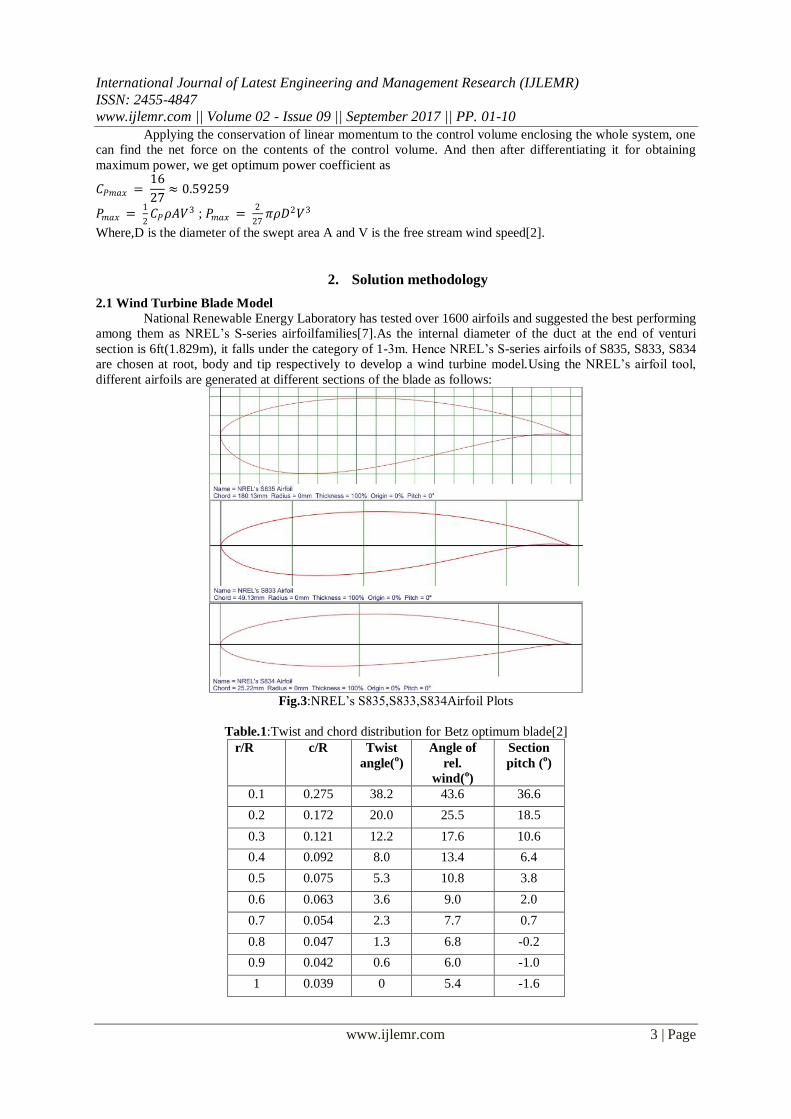
2.1 Wind Turbine Blade Model
National Renewable Energy Laboratory has tested over 1600 airfoils and suggested the best performing
among them as NREL’s S-series airfoilfamilies[7].As the internal diameter of the duct at the end of venturi
section is 6ft(1.829m), it falls under the category of 1-3m. Hence NREL’s S-series airfoils of S835, S833, S834
are chosen at root, body and tip respectively to develop a wind turbine model.Using the NREL’s airfoil tool,
different airfoils are generated at different sections of the blade as follows:
Fig.3:NREL’s S835,S833,S834Airfoil Plots
Table.1:Twist and chord distribution for Betz optimum blade[2]
r/R c/R Twist
angle(o)
Angle of
rel.
wind(o)
Section
pitch (o)
0.1 0.275 38.2 43.6 36.6
0.2 0.172 20.0 25.5 18.5
0.3 0.121 12.2 17.6 10.6
0.4 0.092 8.0 13.4 6.4
0.5 0.075 5.3 10.8 3.8
0.6 0.063 3.6 9.0 2.0
0.7 0.054 2.3 7.7 0.7
0.8 0.047 1.3 6.8 -0.2
0.9 0.042 0.6 6.0 -1.0
1 0.039 0 5.4 -1.6

International Journal of Latest Engineering and Management Research (IJLEMR) ISSN: 2455-4847 www.ijlemr.com || Volume 02 - Issue 09 || September 2017 || PP. 01-10
www.ijlemr.com 4 | Page
Using the Solidworks 2012 software the model of the wind turbine is developed in accordance with the
specifications mentioned in table.1 by using NREL’s S-series airfoils by employing Betz optimum blade
conditions.
Fig.4: Small wind turbine model (Solidworks 2012)
2.2 Omnidirectional Intake DuctModel
Fig.5: Geometry of omnidirectional intake duct[4].
Using the Solidworks 2012 software the model of the duct with blade model is developed in
accordance with the dimensions mentioned in Fig.5.
Fig.6: Omnidirectional duct with three bladed wind turbine model inside.
International Journal of Latest Engineering and Management Research (IJLEMR) ISSN: 2455-4847 www.ijlemr.com || Volume 02 - Issue 09 || September 2017 || PP. 01-10
www.ijlemr.com 5 | Page
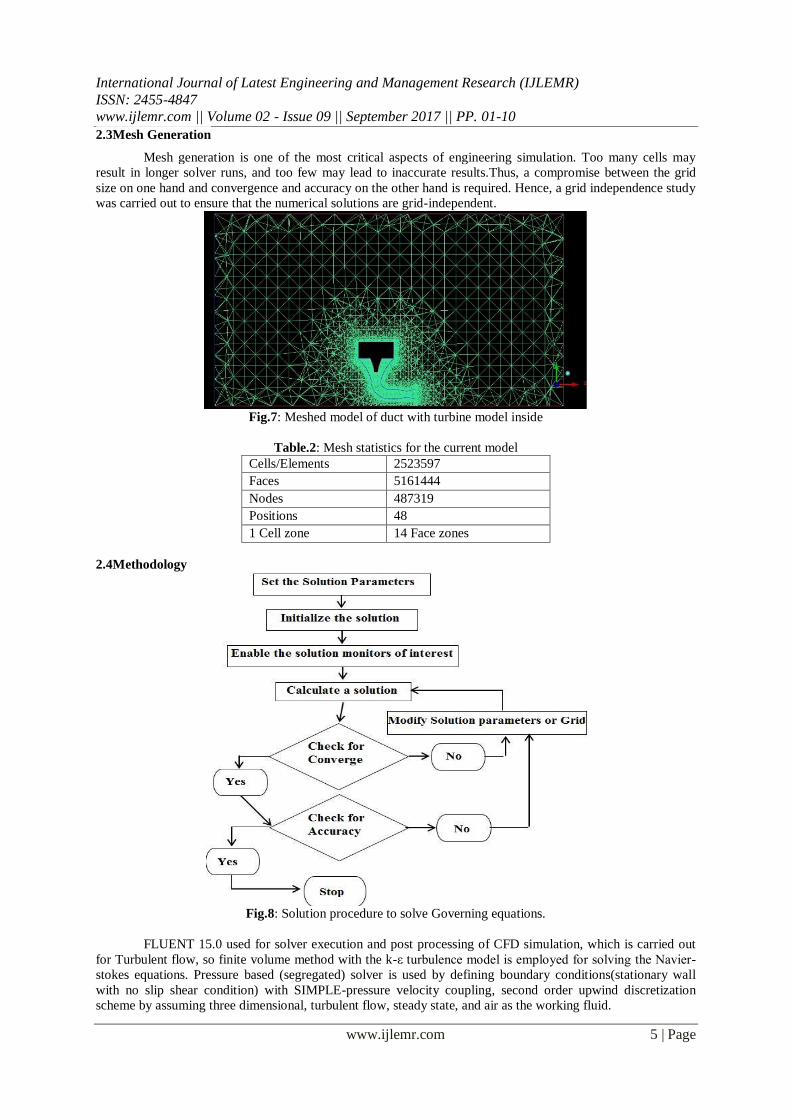
2.3Mesh Generation
Mesh generation is one of the most critical aspects of engineering simulation. Too many cells may
result in longer solver runs, and too few may lead to inaccurate results.Thus, a compromise between the grid
size on one hand and convergence and accuracy on the other hand is required. Hence, a grid independence study
was carried out to ensure that the numerical solutions are grid-independent.
Fig.7: Meshed model of duct with turbine model inside
Table.2: Mesh statistics for the current model
Cells/Elements 2523597
Faces 5161444
Nodes 487319
Positions 48
1 Cell zone 14 Face zones
2.4Methodology
Fig.8: Solution procedure to solve Governing equations.
FLUENT 15.0 used for solver execution and post processing of CFD simulation, which is carried out
for Turbulent flow, so finite volume method with the k-ε turbulence model is employed for solving the Navier-
stokes equations. Pressure based (segregated) solver is used by defining boundary conditions(stationary wall
with no slip shear condition) with SIMPLE-pressure velocity coupling, second order upwind discretization
scheme by assuming three dimensional, turbulent flow, steady state, and air as the working fluid.
International Journal of Latest Engineering and Management Research (IJLEMR) ISSN: 2455-4847 www.ijlemr.com || Volume 02 - Issue 09 || September 2017 || PP. 01-10
www.ijlemr.com 6 | Page
3. Results and Discussions The Numerical simulations are carried out for Omnidirectional intake duct with turbine model inside
with different inlet velocity conditions.
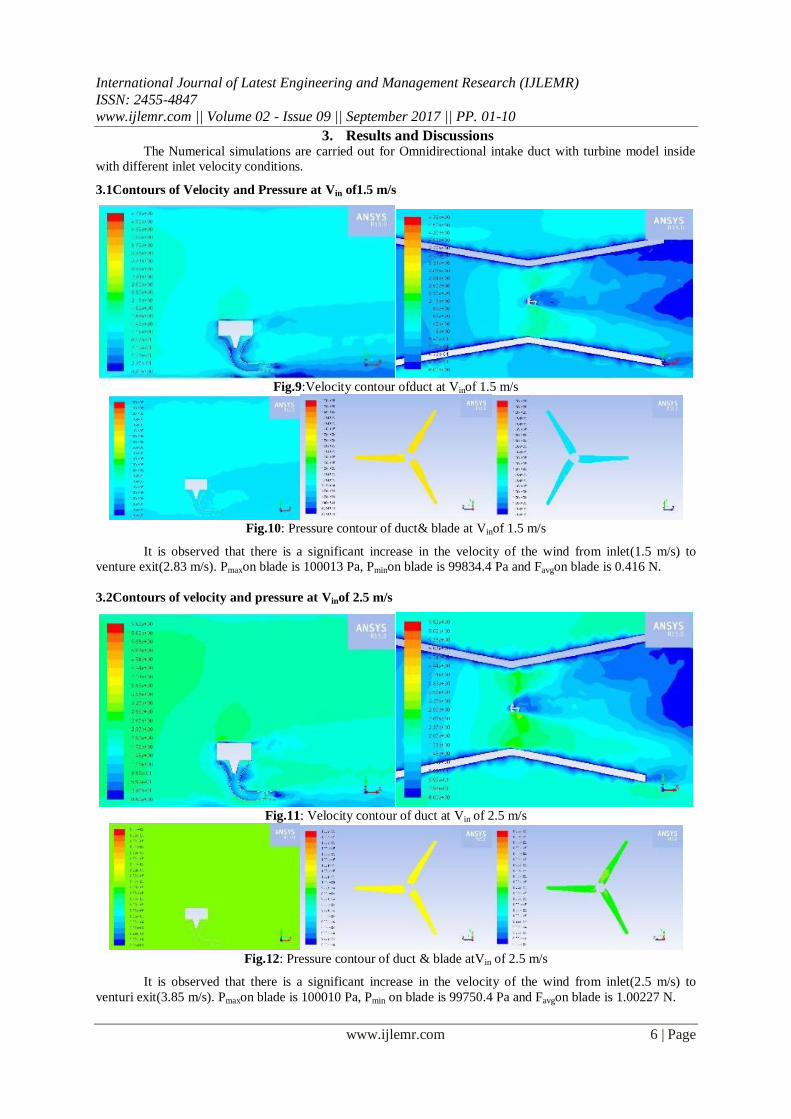
3.1Contours of Velocity and Pressure at Vin of1.5 m/s
Fig.9:Velocity contour ofduct at Vinof 1.5 m/s
Fig.10: Pressure contour of duct& blade at Vinof 1.5 m/s
It is observed that there is a significant increase in the velocity of the wind from inlet(1.5 m/s) to
venture exit(2.83 m/s). Pmaxon blade is 100013 Pa, Pminon blade is 99834.4 Pa and Favgon blade is 0.416 N.
3.2Contours of velocity and pressure at Vinof 2.5 m/s
Fig.11: Velocity contour of duct at Vin of 2.5 m/s
Fig.12: Pressure contour of duct & blade atVin of 2.5 m/s
It is observed that there is a significant increase in the velocity of the wind from inlet(2.5 m/s) to
venturi exit(3.85 m/s). Pmaxon blade is 100010 Pa, Pmin on blade is 99750.4 Pa and Favgon blade is 1.00227 N.
International Journal of Latest Engineering and Management Research (IJLEMR) ISSN: 2455-4847 www.ijlemr.com || Volume 02 - Issue 09 || September 2017 || PP. 01-10
www.ijlemr.com 7 | Page
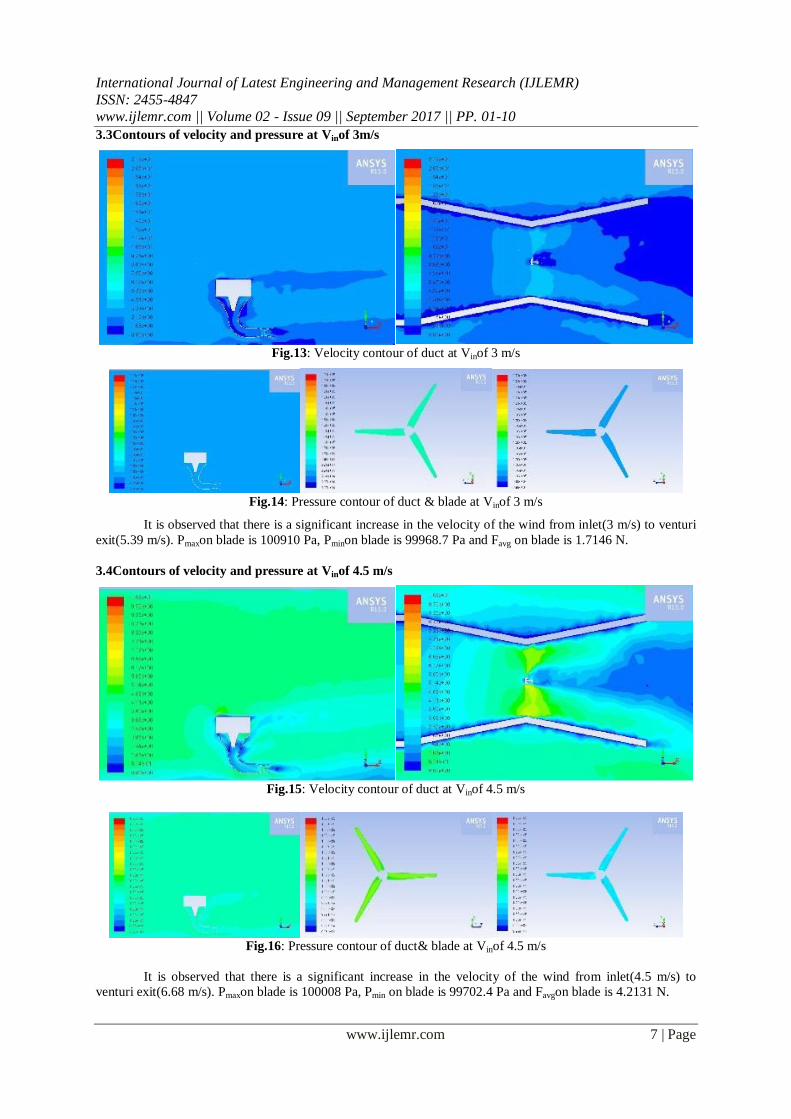
3.3Contours of velocity and pressure at Vinof 3m/s
Fig.13: Velocity contour of duct at Vinof 3 m/s
Fig.14: Pressure contour of duct & blade at Vinof 3 m/s
It is observed that there is a significant increase in the velocity of the wind from inlet(3 m/s) to venturi
exit(5.39 m/s). Pmaxon blade is 100910 Pa, Pminon blade is 99968.7 Pa and Favg on blade is 1.7146 N.
3.4Contours of velocity and pressure at Vinof 4.5 m/s
Fig.15: Velocity contour of duct at Vinof 4.5 m/s
Fig.16: Pressure contour of duct& blade at Vinof 4.5 m/s
It is observed that there is a significant increase in the velocity of the wind from inlet(4.5 m/s) to
venturi exit(6.68 m/s). Pmaxon blade is 100008 Pa, Pmin on blade is 99702.4 Pa and Favgon blade is 4.2131 N.
International Journal of Latest Engineering and Management Research (IJLEMR) ISSN: 2455-4847 www.ijlemr.com || Volume 02 - Issue 09 || September 2017 || PP. 01-10
www.ijlemr.com 8 | Page
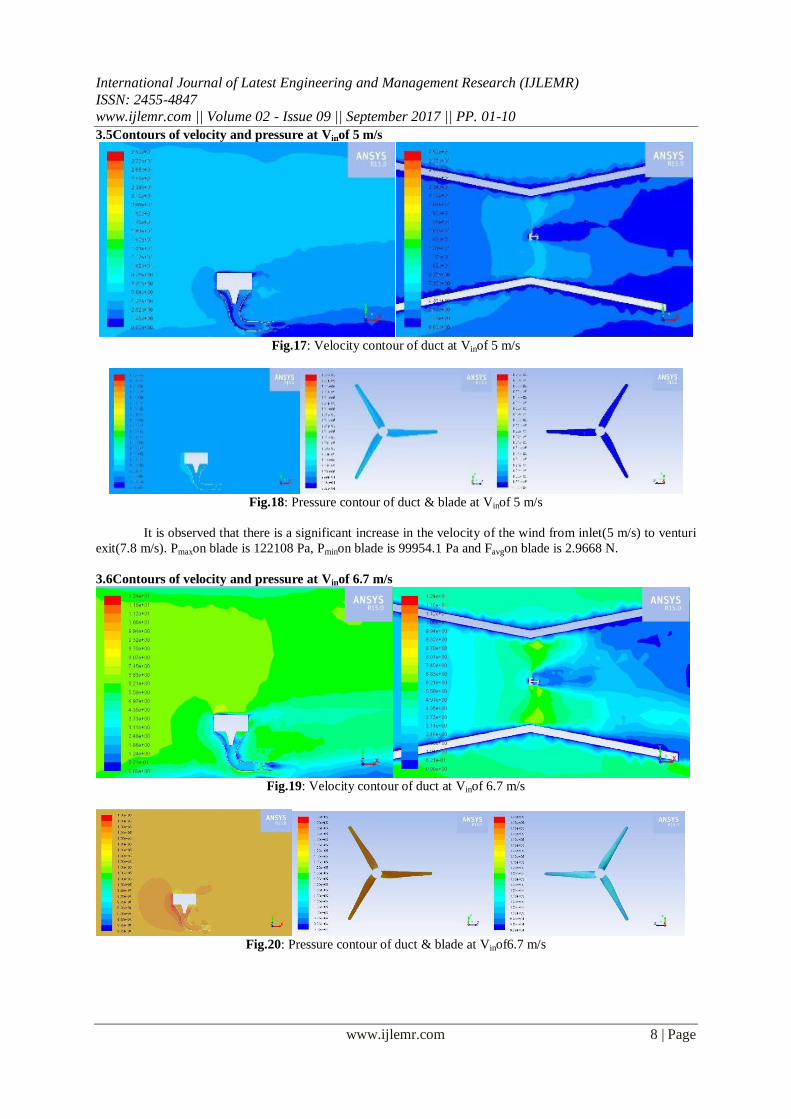
3.5Contours of velocity and pressure at Vinof 5 m/s
Fig.17: Velocity contour of duct at Vinof 5 m/s
Fig.18: Pressure contour of duct & blade at Vinof 5 m/s
It is observed that there is a significant increase in the velocity of the wind from inlet(5 m/s) to venturi
exit(7.8 m/s). Pmaxon blade is 122108 Pa, Pminon blade is 99954.1 Pa and Favgon blade is 2.9668 N.
3.6Contours of velocity and pressure at Vinof 6.7 m/s
Fig.19: Velocity contour of duct at Vinof 6.7 m/s
Fig.20: Pressure contour of duct & blade at Vinof6.7 m/s

International Journal of Latest Engineering and Management Research (IJLEMR) ISSN: 2455-4847 www.ijlemr.com || Volume 02 - Issue 09 || September 2017 || PP. 01-10
www.ijlemr.com 9 | Page
Table.3: TheoreticalPmaxfor different inlet velocities.
S No Inlet Velocity Theoretical𝑃𝑚𝑎𝑥 (W) Outlet Velocity Theoretical 𝑃𝑚𝑎𝑥 (W)
1 1.5 m/s 3.15 W 2.83 m/s 21.14 W
2 2.5 m/s 14.57 W 3.85 m/s 53.27 W
3 3 m/s 25.18 W 5.39 m/s 146.05 W
4 4.5 m/s 84.99 W 6.68 m/s 278.02 W
5 5 m/s 116.59 W 7.81 m/s 442.62 W
6 6.7 m/s 280.53 W 9.32 m/s 755.08 W
Fig.24: Variation of Venturiexit velocity w.r.t Vin (m/s)
Fig.25: Variation of TheoreticalPmax(W) w.r.t Vin (m/s)
From above graphs it is observed that with aninput wind velocities varying from 1.5 m/s to 6.7 m/s the
venturi exit velocities are obtained as 2.83 m/s to 9.32 m/s. It is observed that with the presence of
Omnidirectional intake duct the velocity at exit of venturi section i.e. at inlet to wind turbine is getting increased
by as high as 88% at an inlet velocity of 1.5 m/s and as low as 39% at an inlet velocity of 6.7 m/s, with an
average increase of 60%. With the use of Omnidirectional intake duct the theoretically maximum possible
power (obtained from Betz limit) for inlet velocities varying from 1.5 m/s to 6.7 m/s is 21.14 W to 755.08 W. It
is observed that with the use of Omnidirectional intake duct the theoretically maximum possible power for the
case of Vin 6.7 m/s is 170% more compared to the case of without using the duct. On an average with the use of
Omnidirectional intake duct the theoretically maximum possible power is more than 2.5times than that we
obtain from conventional wind turbine under similar conditions.
0
1
2
3
4
5
6
7
8
9
10
1 2 3 4 5 6
Velo
cit
y(m
/s)
Different Cases
Inlet Velocity (m/s) Venturi Exit Velocity (m/s)
0
100
200
300
400
500
600
700
800
1.5 2.5 3 4.5 5 6.7
Th
eoreti
cal 𝑃
_𝑚𝑎𝑥
(W)
Inlet Velocity (m/s)
Theoretical P_max (W) without Duct Theoretical P_max (W) with Duct
International Journal of Latest Engineering and Management Research (IJLEMR) ISSN: 2455-4847 www.ijlemr.com || Volume 02 - Issue 09 || September 2017 || PP. 01-10
www.ijlemr.com 10 | Page
4. Conclusions Based on this study, it is shown that the addition of Omnidirectional intake duct to horizontal axis wind
turbines results in significant improvement in the power outputs. Different cases of incoming wind velocities are
studies to observe the results. It is always difficult to predict accurately the amount of increase in outputs as the
study is conducted using many ideal case assumptions. In reality many other real time parameters comes in to
the picture and effects the results in many ways.From the Computational flow analysis of Omnidirectional
intake duct with three bladed wind turbine model inside, it is observed thatthere is a significant increase in the
wind velocities at the exit of the Venturi section i.e. at inlet to the three bladed wind turbine model and there is a
pressure drop is observed across the three bladed wind turbine model on pressure side and suction side.Thus the
increased wind velocities will result in significant improvement in the power outputs. Though in this study we
have assumed the ideal Betz case (CPmax=0.59) but in actual practice the power coefficient will be in the range of
0.3 to 0.35 then also we can observe that the power output will increase. But not as much as we have observed
in this case, even if we reduce the results to be in proportionate with the actual CPmax,then also there will be more
than 100% improvement in the power outputs. The processes of power generation from renewable sources of
energy seem to pervade all aspects of human life. So there is always scope for research and development in this
area.
References [1] SørensenB., J.N., 1979, “Aerodynamic aspects of wind Energy conversion”, Elsevier Science,
Amsterdam, Chap.1, 3.2, 4.3, pp.236, 412.
[2] Manwell J. F., McGowan J. G. and Rogers A. L.,2009, “WIND ENERGY EXPLAINED Theory,
Design and Application”, Wiley, United Kingdom, Chap.3, pp.93, 103, 123.
[3] Allaei D., and Andreopoulos Y., A., 2014, “INVELOX: Description of a new concept in wind power
and its performance evaluation”, Elsevier Science, New York USA, 0360-5442., pp.336-334.
[4] Allaei D., and Andreopoulos Y., A., 2013, “INVELOX: a new concept in wind energy harvesting”,
ASME, Minneapolis MN USA, 18311, pp.126-131.
[5] Grant A., Kelly N., A., 2003, “The Development of a Ducted Wind Turbine Simulation Model”,
IBPSA conference, Netherlands, 0407, pp.414.
[6] Al-Bahadly IH., Petersen AFT., 2011,“A ducted horizontal wind turbine for efficient generation”,
InTechOpen, ISBN 978-953-307-221-0, New Zealand, pp.87-106.
[7] TangIer J. L., Somers D. M., J.N., 1995, “NREL Airfoil families for HAWTs”, NREL, USA,
WE429180.
[8] Sunforce renewable energy products., 2012, “Sunforce 600W Landmanual”, Canada, pp.3.
[9] Lilley G.M, Rainbird W.J., A., 1956, “A preliminary report on the design and performance of ducted
windmills”, College of Aeronautics Report, England, pp.102.
[10] Riegler, G., 1983, “Principles of energy extraction from a free stream by means of wind turbines”,
Wind Engineering 7/2, ISSN:0309-524X.
[11] Yuan Hu, S., Ho Cheng, J., M., 2007, “Innovatory Designs for ducted wind turbines”, Elsevier Science,
Renewable energy-33, Taiwan, NSC 94-2212-E-002-044.
[12] Somers D. M., A., 2005, “The S833, S834 and S835 Airfoils”, NREL, Pennsylvania USA, SR-500-
36340.
[13] Watkins, Andreopoulous and Christopher R., S., 2012 “Wind turbine model for wind-tunnel testing”,
City college of New York, ME-473.
[14] Ronit. K. S., and RafiuddinM. A.,“Blade design and performance testing of a small wind turbine rotor
for low wind speed applications”, University of the South Pacific, Fiji.
[15] Gonzalez, A. M.,Sadegh, Y.,Andreopoulos, D.,Tarnowski,Allaei, J. E., M., 2013 “INVELOX-
Affordable Wind Power for Anyone Anywhere”, WindTech International.


