
22 May 2012
Any authors named on this report
are research analysts unless
otherwise indicated.
See Appendix A-1 for analyst
certification, important
disclosures and the status of
non-US analysts.
Performance and Asset Gathering Outlook for Quant Funds
Inigo Fraser Jenkins
Nomura International plc

1
• Upgrading outlook for quants
• Is the quant “problem” really a low tracking error “problem”
• What parts of quant are doing well, and suggestions for asset growth
• A comment on Greece – and what happens to factors
Upgrading Quant
2

3 Source: Bloomberg, Nomura Quantitative research
Relative performance of long-only
96
97
98
99
100
101
102
Ja
n-1
0
Apr-
10
Ju
l-10
Oct-
10
Ja
n-1
1
Apr-
11
Ju
l-11
Oct-
11
Ja
n-1
2
Apr-
12
Jan 2010 = 100 Index

β t-statistic
Correlation -7.57 -4.79
Growth 0.41 4.45
Value 2.42 5.76
Momentum -0.68 -5.49
Constant -5.40 -3.96
R2 0.52
Meta Model
tttttt MomentumGrowthValueCorrelr 4321:
Where Correl is the average pairwise correlation between stocks. Value, Growth and Momentum all refer
to the dispersion of these factors across the market.
Source: Nomura Equity Strategy
4

-3
-2
-1
0
1
2
3
4
De
c-0
1
De
c-0
2
De
c-0
3
De
c-0
4
De
c-0
5
De
c-0
6
De
c-0
7
De
c-0
8
De
c-0
9
De
c-1
0
De
c-1
1
Predicted Return
Predicted returns using current level of 25 day correlation
Predicted 12 month forward relative returns of global quants
Relative return %
Source: Bloomberg, Nomura Quantitative research
5
Predicted returns
using current level
of 25 day correlation

6
Global correlation is defined as the mean of all the pairwise correlations between stocks over the prior 75 days. Universe is the 500 largest stocks in the FTSE World index. US correlation is the median 63-
Day correlation of S&P 500 Stocks to the S&P 500 Index.
Source: Nomura Equity Strategy, Ned Davis
Average correlation of stocks Global and US
0
0.05
0.1
0.15
0.2
0.25
0.3
0.35
0.4
0.45
0
0.1
0.2
0.3
0.4
0.5
0.6
0.7
0.8
0.9
1
Ap
r-7
2
Ap
r-7
4
Ap
r-7
6
Ap
r-7
8
Ap
r-8
0
Ap
r-8
2
Ap
r-8
4
Ap
r-8
6
Ap
r-8
8
Ap
r-9
0
Ap
r-9
2
Ap
r-9
4
Ap
r-9
6
Ap
r-9
8
Ap
r-0
0
Ap
r-0
2
Ap
r-0
4
Ap
r-0
6
Ap
r-0
8
Ap
r-1
0
Ap
r-1
2
Correlation Correlation
US - Median 63-day correlation of S&P 500 stocks to the S&P 500 index (LHS)
Global - 75 day mean pair-wise correlation (RHS)
7
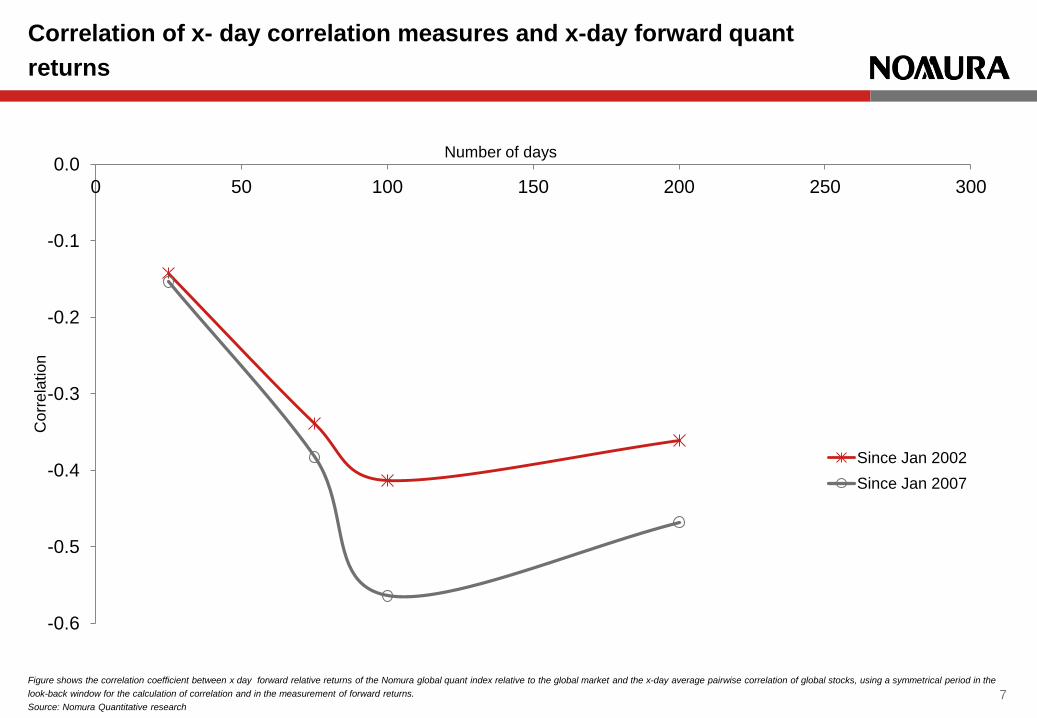
Figure shows the correlation coefficient between x day forward relative returns of the Nomura global quant index relative to the global market and the x-day average pairwise correlation of global stocks, using a symmetrical period in the
look-back window for the calculation of correlation and in the measurement of forward returns.
Source: Nomura Quantitative research
Correlation of x- day correlation measures and x-day forward quant
returns
-0.6
-0.5
-0.4
-0.3
-0.2
-0.1
0.0
0 50 100 150 200 250 300
Corr
ela
tion
Number of days
Since Jan 2002
Since Jan 2007

8 Source: Nomura Strategy research
Correlation of periphery equity markets
-0.2
0.0
0.2
0.4
0.6
0.8
1.0
Ma
r-07
Ju
n-0
7
Sep-0
7
De
c-0
7
Ma
r-08
Ju
n-0
8
Sep-0
8
De
c-0
8
Ma
r-09
Ju
n-0
9
Sep-0
9
De
c-0
9
Ma
r-10
Jun-1
0
Sep-1
0
De
c-1
0
Ma
r-11
Ju
n-1
1
Sep-1
1
De
c-1
1
Ma
r-12
Correlation coefficient Average 60 day correlation average pairwise ex Greece
Is the quant “problem” really a low tracking error “problem”
9

Quant fund AUM as a share of active equity (Global ex Asia)
Figure shows the total assets under management for quant funds that are present throughout our sample since 2007 as a percentage of the total amount of assets invested in active equity mandates that are either global or
have the US, Europe or Australia as their benchmark. Source: Bloomberg, EPFR, Nomura Equity Strategy research
0.40
0.50
0.60
0.70
0.80
0.90
1.00
1.10
1.20
Ja
n-0
7
Ap
r-0
7
Ju
l-0
7
Oct-
07
Ja
n-0
8
Ap
r-0
8
Ju
l-0
8
Oct-
08
Ja
n-0
9
Ap
r-0
9
Ju
l-0
9
Oct-
09
Ja
n-1
0
Ap
r-1
0
Ju
l-1
0
Oct-
10
Ja
n-1
1
Apr-
11
Ju
l-11
Oct-
11
Ja
n-1
2
%
10

11 Figure shows the percentage of funds in our quant and non-quant fund samples split by tracking error over the last year. Source: Nomura Quantitative research
Distribution of tracking errors: quant and non quant
0%
5%
10%
15%
20%
25%
30%
0 1 2 3 4 5 6 7 8 9 10 11 12 13 14 15 16 17 18 19 20 21
Fre
qu
en
cy
Tracking Error Bin
non quants
quants

AUM share of tracking error subsets of non-quant funds and AUM
of low tracking error non-quants compared to AUM of quants
Left hand panel shows the AUM share of different tracking error groups of non-quant funds, with tracking error being measured over the past year. Right hand panel shows the AUM share of all quant funds overlaid on the AUM share of
low tracking error non-quants. For a universe of European-benchmarked funds. Source: Bloomberg, Nomura Quantitative research 12
AUM share of the 3 groups of T-E subgroups for non quant AUM share of quant funds and low TE non-quant funds
0
5
10
15
20
25
Dec-0
6
Ma
r-0
7
Ju
n-0
7
Se
p-0
7
Dec-0
7
Ma
r-0
8
Ju
n-0
8
Se
p-0
8
Dec-0
8
Ma
r-0
9
Ju
n-0
9
Se
p-0
9
Dec-0
9
Ma
r-1
0
Ju
n-1
0
Se
p-1
0
Dec-1
0
Ma
r-11
Ju
n-1
1
Se
p-1
1
Dec-1
1
Ma
r-1
2
% 0-5 track error
5-11 track error
>11 track error
0.0
0.5
1.0
1.5
2.0
2.5
3.0
3.5
4.0
5
7
9
11
13
15
17
19
21
23
Dec-0
6
Ma
r-0
7
Ju
n-0
7
Se
p-0
7
Dec-0
7
Ma
r-0
8
Ju
n-0
8
Se
p-0
8
Dec-0
8
Ma
r-0
9
Ju
n-0
9
Se
p-0
9
Dec-0
9
Ma
r-1
0
Ju
n-1
0
Se
p-1
0
Dec-1
0
Ma
r-11
Ju
n-1
1
Se
p-1
1
Dec-1
1
Ma
r-1
2
% % Non quants (LHS)
Quants (RHS)
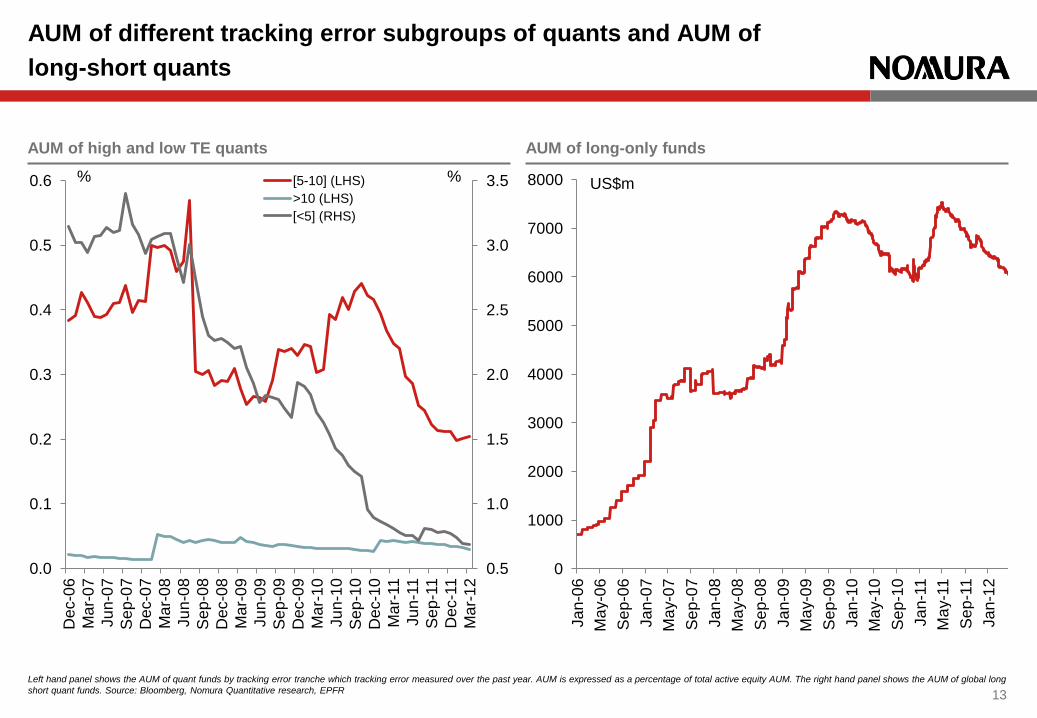
AUM of different tracking error subgroups of quants and AUM of
long-short quants
Left hand panel shows the AUM of quant funds by tracking error tranche which tracking error measured over the past year. AUM is expressed as a percentage of total active equity AUM. The right hand panel shows the AUM of global long
short quant funds. Source: Bloomberg, Nomura Quantitative research, EPFR 13
AUM of high and low TE quants AUM of long-only funds
0.5
1.0
1.5
2.0
2.5
3.0
3.5
0.0
0.1
0.2
0.3
0.4
0.5
0.6
Dec-0
6
Ma
r-0
7
Ju
n-0
7
Se
p-0
7
Dec-0
7
Ma
r-0
8
Ju
n-0
8
Se
p-0
8
Dec-0
8
Ma
r-0
9
Ju
n-0
9
Se
p-0
9
Dec-0
9
Ma
r-1
0
Ju
n-1
0
Se
p-1
0
Dec-1
0
Ma
r-11
Ju
n-1
1
Se
p-1
1
Dec-1
1
Ma
r-1
2
% % [5-10] (LHS)
>10 (LHS)
[<5] (RHS)
0
1000
2000
3000
4000
5000
6000
7000
8000
Ja
n-0
6
Ma
y-0
6
Se
p-0
6
Ja
n-0
7
Ma
y-0
7
Se
p-0
7
Ja
n-0
8
Ma
y-0
8
Se
p-0
8
Ja
n-0
9
Ma
y-0
9
Se
p-0
9
Ja
n-1
0
Ma
y-1
0
Se
p-1
0
Ja
n-1
1
Ma
y-1
1
Se
p-1
1
Ja
n-1
2
US$m

What parts of quant are doing well, and suggestions for asset growth
14

Share of AUM for dynamic and static quant funds
Percentage AUM as a share of active equity funds
Source: Nomura Quantitative Strategy research
0.03
0.08
0.13
0.18
0.23
0.28
Ja
n-0
6
Apr-
06
Ju
l-06
Oct-
06
Ja
n-0
7
Apr-
07
Ju
l-07
Oct-
07
Ja
n-0
8
Apr-
08
Ju
l-08
Oct-
08
Ja
n-0
9
Apr-
09
Ju
l-09
Oct-
09
Ja
n-1
0
Apr-
10
Ju
l-10
Oct-
10
Ja
n-1
1
Apr-
11
Ju
l-11
Oct-
11
Jan-1
2
%
Static
Dynamic
15

Performance of dynamic vs static quant funds
Chart shows the performance of quant funds that use a dynamic factor allocation strategy relative to those that use a static approach
Source: Nomura Quantitative Strategy research
95
97
99
101
103
105
107
109
111
113
Ja
n-0
6
Apr-
06
Ju
l-06
Oct-
06
Ja
n-0
7
Apr-
07
Ju
l-07
Oct-
07
Ja
n-0
8
Apr-
08
Ju
l-08
Oct-
08
Ja
n-0
9
Apr-
09
Ju
l-09
Oct-
09
Ja
n-1
0
Apr-
10
Ju
l-10
Oct-
10
Ja
n-1
1
Apr-
11
Ju
l-11
Oct-
11
Jan-1
2
Apr-
12
2nd Jan 2006 = 100
16
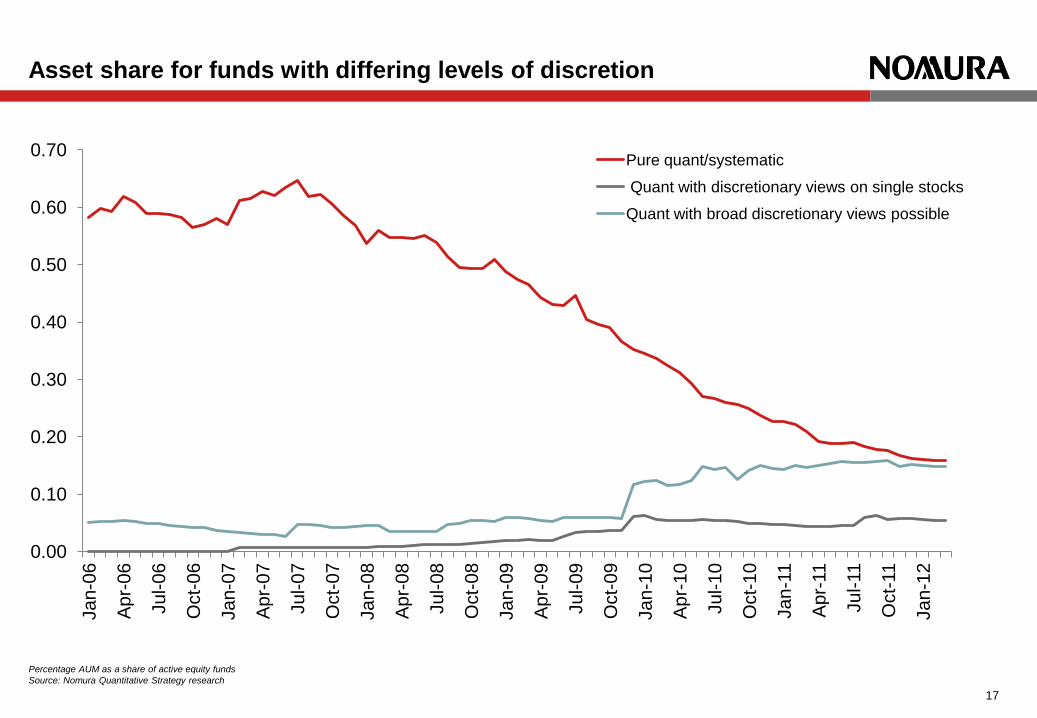
Asset share for funds with differing levels of discretion
Percentage AUM as a share of active equity funds
Source: Nomura Quantitative Strategy research
0.00
0.10
0.20
0.30
0.40
0.50
0.60
0.70
Jan-0
6
Apr-
06
Ju
l-06
Oct-
06
Ja
n-0
7
Apr-
07
Ju
l-07
Oct-
07
Ja
n-0
8
Apr-
08
Ju
l-08
Oct-
08
Ja
n-0
9
Apr-
09
Ju
l-09
Oct-
09
Ja
n-1
0
Apr-
10
Ju
l-10
Oct-
10
Ja
n-1
1
Apr-
11
Ju
l-11
Oct-
11
Ja
n-1
2
Pure quant/systematic
Quant with discretionary views on single stocks
Quant with broad discretionary views possible
17

Performance of funds with and without discretion
Performance of funds that employ different levels of discretion relative to pure quant funds with no discretion.
Source: Nomura Quantitative Strategy research
90
92
94
96
98
100
102
104
106
108
Jan-0
6
Apr-
06
Ju
l-06
Oct-
06
Ja
n-0
7
Apr-
07
Ju
l-07
Oct-
07
Ja
n-0
8
Apr-
08
Ju
l-08
Oct-
08
Ja
n-0
9
Apr-
09
Ju
l-09
Oct-
09
Ja
n-1
0
Apr-
10
Ju
l-10
Oct-
10
Ja
n-1
1
Apr-
11
Ju
l-11
Oct-
11
Ja
n-1
2
Apr-
12
1st Jan 2006 = 100 discretion on single stocks/pure quant
broad discretion/pure quant
18
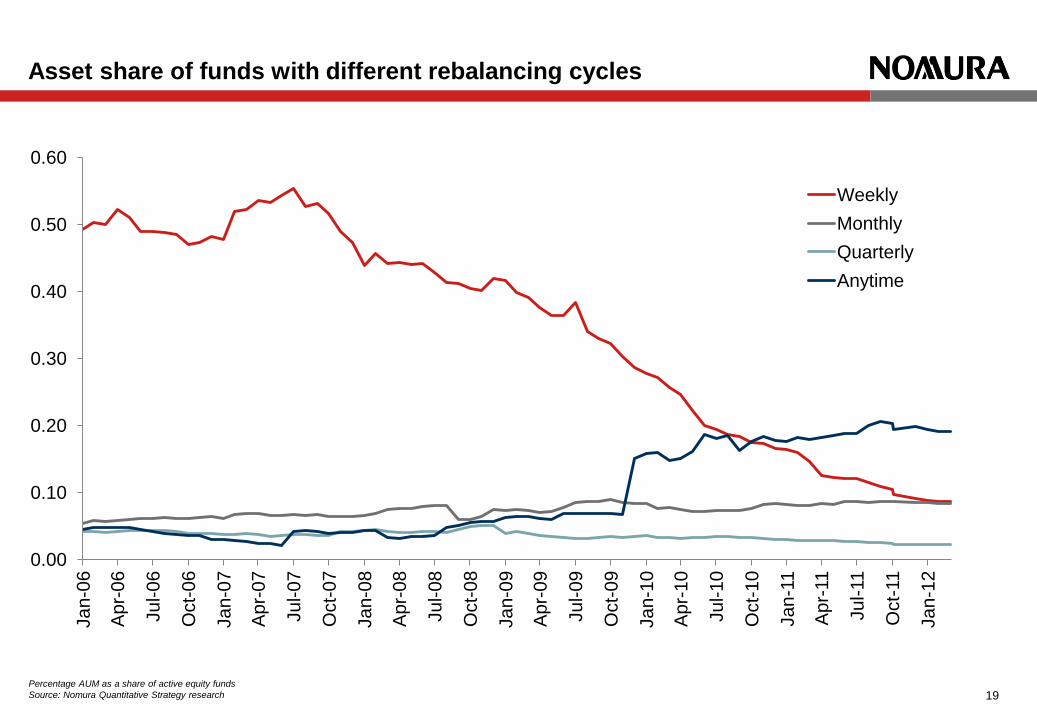
Asset share of funds with different rebalancing cycles
0.00
0.10
0.20
0.30
0.40
0.50
0.60
Jan-0
6
Apr-
06
Ju
l-06
Oct-
06
Jan-0
7
Apr-
07
Ju
l-07
Oct-
07
Ja
n-0
8
Apr-
08
Ju
l-08
Oct-
08
Ja
n-0
9
Apr-
09
Ju
l-09
Oct-
09
Ja
n-1
0
Apr-
10
Ju
l-10
Oct-
10
Ja
n-1
1
Apr-
11
Ju
l-11
Oct-
11
Ja
n-1
2
Weekly
Monthly
Quarterly
Anytime
Percentage AUM as a share of active equity funds
Source: Nomura Quantitative Strategy research 19

Performance of funds with different rebalancing cycles
85
90
95
100
105
110
115
Ja
n-0
8
Ap
r-0
8
Ju
l-0
8
Oct-
08
Ja
n-0
9
Ap
r-0
9
Ju
l-0
9
Oct-
09
Ja
n-1
0
Ap
r-1
0
Ju
l-1
0
Oct-
10
Ja
n-1
1
Apr-
11
Jul-11
Oct-
11
Ja
n-1
2
Ap
r-1
2
1st Jan 2008 = 100
Weekly Monthly
Quarterly Anytime
Source: Nomura Quantitative Strategy research
20
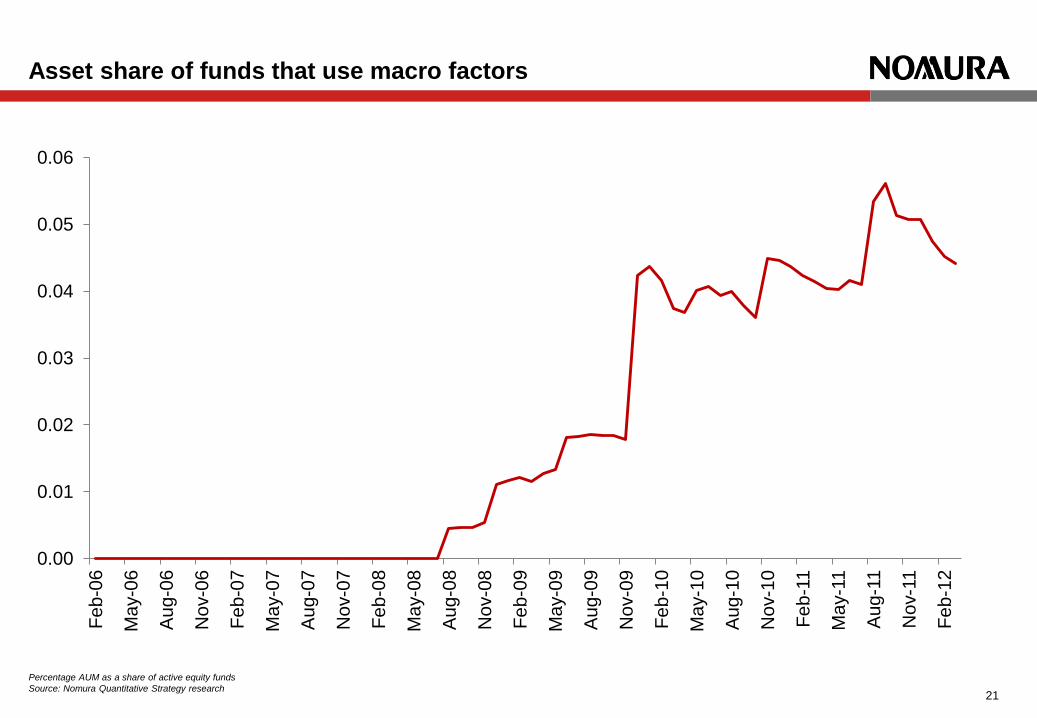
Asset share of funds that use macro factors
0.00
0.01
0.02
0.03
0.04
0.05
0.06
Feb-0
6
May-0
6
Aug-0
6
Nov-0
6
Feb-0
7
May-0
7
Aug-0
7
No
v-0
7
Fe
b-0
8
Ma
y-0
8
Aug-0
8
No
v-0
8
Fe
b-0
9
Ma
y-0
9
Aug-0
9
No
v-0
9
Fe
b-1
0
Ma
y-1
0
Aug-1
0
No
v-1
0
Fe
b-1
1
Ma
y-1
1
Aug
-11
No
v-1
1
Fe
b-1
2
Percentage AUM as a share of active equity funds
Source: Nomura Quantitative Strategy research 21
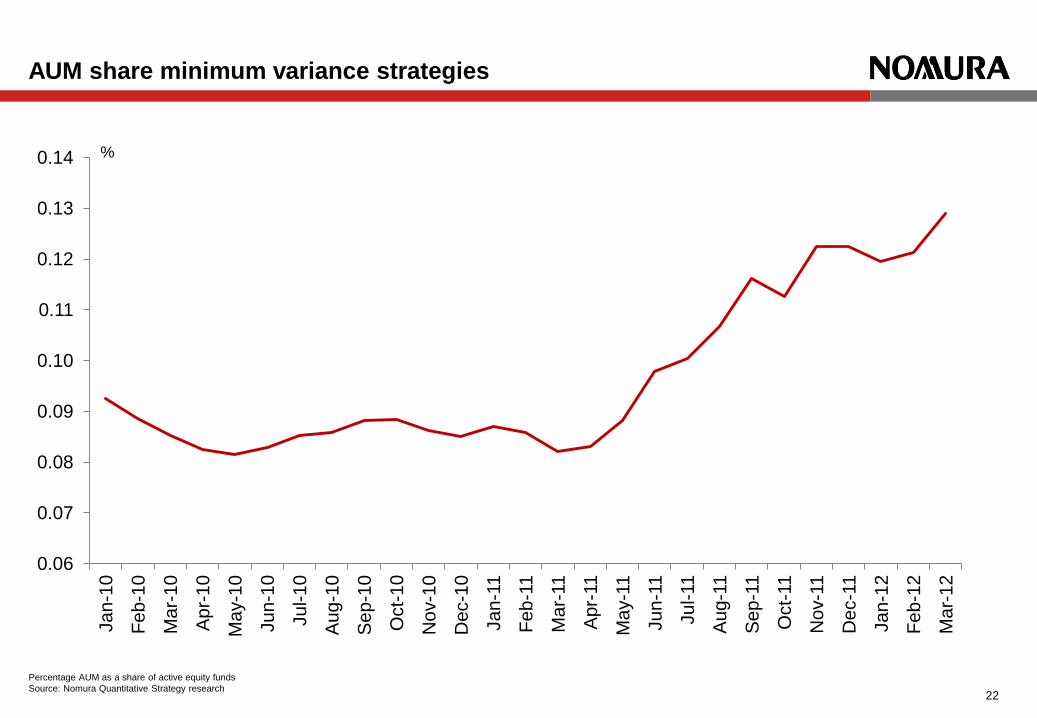
AUM share minimum variance strategies
0.06
0.07
0.08
0.09
0.10
0.11
0.12
0.13
0.14
Ja
n-1
0
Fe
b-1
0
Ma
r-10
Ap
r-1
0
Ma
y-1
0
Ju
n-1
0
Ju
l-1
0
Aug-1
0
Sep-1
0
Oct-
10
No
v-1
0
De
c-1
0
Ja
n-1
1
Fe
b-1
1
Ma
r-11
Apr-
11
Ma
y-1
1
Ju
n-1
1
Ju
l-11
Aug-1
1
Sep-1
1
Oct-
11
No
v-1
1
De
c-1
1
Ja
n-1
2
Fe
b-1
2
Ma
r-12
%
Percentage AUM as a share of active equity funds
Source: Nomura Quantitative Strategy research 22

Some suggestions on how to grow quant AUM
23
• Performance! Though easier said than done
• Discretionary and dynamic approaches have gained market share
• Flexible approach to rebalancing
• Macro inputs
• Long-short quants have held onto assets
• Higher tracking error? (but depends on one‟s strategy)
• Emerging and frontier markets
• Alternative Beta
• Cost savings… though beware what one wishes for

A comment on Greece – and what happens to factors
24

• 2nd election on 17th June probably unable to deliver
clear majority + hard for creditor nations to offer
more concessions to Greece
• But creditor nations have more patience with other
periphery countries
• Model as a two-stage binary tree with different
types of market move at each step
• Step 1: IF Greece exits sharp sentiment sell-off
• Step 2: What is the policy response? We think that
containment is possible. That could prompt
significant rally…
• …would be supported by record risk premium and
very low sentiment
Greece: What if?
25

Price/book of Composite Value (Global and Europe)
Figure shows the price/book ratio of cheap/expensive quartile of stocks screened on an equal weighted composite basis by trailing price to book, trailing dividend yield and 12 month forward mean consensus price earnings
ratio. The baskets are rebalanced quarterly. The benchmark universe is the top 300 stocks in the FTSE World Europe universe and the top 500 stocks in the FTSE World universe.
Source: IBES, FTSE, Exshare, Nomura Equity Strategy research
0.0
0.1
0.2
0.3
0.4
0.5
0.6
Ja
n-9
0
Ja
n-9
1
Ja
n-9
2
Ja
n-9
3
Ja
n-9
4
Jan-9
5
Ja
n-9
6
Ja
n-9
7
Ja
n-9
8
Ja
n-9
9
Ja
n-0
0
Ja
n-0
1
Ja
n-0
2
Ja
n-0
3
Ja
n-0
4
Ja
n-0
5
Ja
n-0
6
Ja
n-0
7
Ja
n-0
8
Ja
n-0
9
Ja
n-1
0
Ja
n-1
1
Ja
n-1
2
Global
Europe
Ratio
26

PE and PBK valuation of composite momentum (Europe)
0.0
1.0
2.0
3.0
4.0
5.0
6.0
Ja
n-9
0
Ja
n-9
1
Ja
n-9
2
Ja
n-9
3
Ja
n-9
4
Ja
n-9
5
Ja
n-9
6
Ja
n-9
7
Ja
n-9
8
Ja
n-9
9
Ja
n-0
0
Ja
n-0
1
Ja
n-0
2
Ja
n-0
3
Ja
n-0
4
Ja
n-0
5
Ja
n-0
6
Ja
n-0
7
Ja
n-0
8
Ja
n-0
9
Ja
n-1
0
Ja
n-1
1
Ja
n-1
2
12m Fwd PE
Price/Book
Ratio
Figure shows the 12m forward PE and price/book ratio of Composite Momentum Style defined as the high momentum quartile of stocks relative to the low momentum quartile of stocks screened on an equal weighted composite
basis by the percentage change in average consensus 12 month forward earnings over the past 2 quarters and a simple 12 month price momentum. The baskets are rebalanced quarterly. The benchmark universe is the top 300
stocks in the FTSE World Europe universe.
Source: IBES, FTSE, Exshare, Nomura Equity Strategy research 27

28
Any Authors named on this report are Research Analysts unless otherwise indicated
Analyst Certification
I, Inigo Fraser-Jenkins, hereby certify (1) that the views expressed in this Research report accurately reflect my personal views about any or all of the subject securities or issuers referred to in this Research
report, (2) no part of my compensation was, is or will be directly or indirectly related to the specific recommendations or views expressed in this Research report and (3) no part of my compensation is tied to any
specific investment banking transactions performed by Nomura Securities International, Inc., Nomura International plc or any other Nomura Group company.
Disclaimers
This document contains material that has been prepared by the Nomura entity identified at the top or bottom of page 1 herein, if any, and/or, with the sole or joint contributions of one or more Nomura entities
whose employees and their respective affiliations are specified on page 1 herein or identified elsewhere in the document. Affiliates and subsidiaries of Nomura Holdings, Inc. (collectively, the 'Nomura Group'),
include: Nomura Securities Co., Ltd. ('NSC') Tokyo, Japan; Nomura International plc ('NIplc'), UK; Nomura Securities International, Inc. ('NSI'), New York, US; Nomura International (Hong Kong) Ltd. („NIHK‟), Hong
Kong; Nomura Financial Investment (Korea) Co., Ltd. („NFIK‟), Korea (Information on Nomura analysts registered with the Korea Financial Investment Association ('KOFIA') can be found on the KOFIA Intranet at
http://dis.kofia.or.kr ); Nomura Singapore Ltd. („NSL‟), Singapore (Registration number 197201440E, regulated by the Monetary Authority of Singapore); Capital Nomura Securities Public Company Limited („CNS‟),
Thailand; Nomura Australia Ltd. („NAL‟), Australia (ABN 48 003 032 513), regulated by the Australian Securities and Investment Commission ('ASIC') and holder of an Australian financial services licence number
246412; P.T. Nomura Indonesia („PTNI‟), Indonesia; Nomura Securities Malaysia Sdn. Bhd. („NSM‟), Malaysia; Nomura International (Hong Kong) Ltd., Taipei Branch („NITB‟), Taiwan; Nomura Financial Advisory
and Securities (India) Private Limited („NFASL‟), Mumbai, India (Registered Address: Ceejay House, Level 11, Plot F, Shivsagar Estate, Dr. Annie Besant Road, Worli, Mumbai- 400 018, India; Tel: +91 22 4037
4037, Fax: +91 22 4037 4111; SEBI Registration No: BSE INB011299030, NSE INB231299034, INF231299034, INE 231299034, MCX: INE261299034); NIplc, Dubai Branch („NIplc, Dubai‟); NIplc, Madrid Branch
(„NIplc, Madrid‟) and NIplc, Italian Branch („NIplc, Italy‟).
THIS MATERIAL IS: (I) FOR YOUR PRIVATE INFORMATION, AND WE ARE NOT SOLICITING ANY ACTION BASED UPON IT; (II) NOT TO BE CONSTRUED AS AN OFFER TO SELL OR A SOLICITATION
OF AN OFFER TO BUY ANY SECURITY IN ANY JURISDICTION WHERE SUCH OFFER OR SOLICITATION WOULD BE ILLEGAL; AND (III) BASED UPON INFORMATION FROM SOURCES THAT WE
CONSIDER RELIABLE, BUT HAS NOT BEEN INDEPENDENTLY VERIFIED BY NOMURA GROUP.
Nomura Group does not warrant or represent that the document is accurate, complete, reliable, fit for any particular purpose or merchantable and does not accept liability for any act (or decision not to act)
resulting from use of this document and related data. To the maximum extent permissible all warranties and other assurances by Nomura group are hereby excluded and Nomura Group shall have no liability for
the use, misuse, or distribution of this information.
Opinions or estimates expressed are current opinions as of the original publication date appearing on this material and the information, including the opinions and estimates contained herein, are subject to change
without notice. Nomura Group is under no duty to update this document. Any comments or statements made herein are those of the author(s) and may differ from views held by other parties within Nomura Group.
Clients should consider whether any advice or recommendation in this report is suitable for their particular circumstances and, if appropriate, seek professional advice, including tax advice. Nomura Group does not
provide tax advice.
Nomura Group, and/or its officers, directors and employees, may, to the extent permitted by applicable law and/or regulation, deal as principal, agent, or otherwise, or have long or short positions in, or buy or sell,
the securities, commodities or instruments, or options or other derivative instruments based thereon, of issuers or securities mentioned herein. Nomura Group companies may also act as market maker or liquidity
provider (as defined within Financial Services Authority („FSA‟) rules in the UK) in the financial instruments of the issuer. Where the activity of market maker is carried out in accordance with the definition given to it
by specific laws and regulations of the US or other jurisdictions, this will be separately disclosed within the specific issuer disclosures.
This document may contain information obtained from third parties, including ratings from credit ratings agencies such as Standard & Poor‟s. Reproduction and distribution of third party content in any form is
prohibited except with the prior written permission of the related third party. Third party content providers do not guarantee the accuracy, completeness, timeliness or availability of any information, including
ratings, and are not responsible for any errors or omissions (negligent or otherwise), regardless of the cause, or for the results obtained from the use of such content. Third party content providers give no express
or implied warranties, including, but not limited to, any warranties of merchantability or fitness for a particular purpose or use. Third party content providers shall not be liable for any direct, indirect, incidental,
exemplary, compensatory, punitive, special or consequential damages, costs, expenses, legal fees, or losses (including lost income or profits and opportunity costs) in connection with any use of their content,
including ratings. Credit ratings are statements of opinions and are not statements of fact or recommendations to purchase hold or sell securities. They do not address the suitability of securities or the suitability of
securities for investment purposes, and should not be relied on as investment advice.
Appendix A-1

29
Any MSCI sourced information in this document is the exclusive property of MSCI Inc. („MSCI‟). Without prior written permission of MSCI, this information and any other MSCI intellectual property may not be
reproduced, re-disseminated or used to create any financial products, including any indices. This information is provided on an "as is" basis. The user assumes the entire risk of any use made of this
information. MSCI, its affiliates and any third party involved in, or related to, computing or compiling the information hereby expressly disclaim all warranties of originality, accuracy, completeness,
merchantability or fitness for a particular purpose with respect to any of this information. Without limiting any of the foregoing, in no event shall MSCI, any of its affiliates or any third party involved in, or
related to, computing or compiling the information have any liability for any damages of any kind. MSCI and the MSCI indexes are services marks of MSCI and its affiliates.
Investors should consider this document as only a single factor in making their investment decision and, as such, the report should not be viewed as identifying or suggesting all risks, direct or indirect, that
may be associated with any investment decision. Nomura Group produces a number of different types of research product including, among others, fundamental analysis, quantitative analysis and short term
trading ideas; recommendations contained in one type of research product may differ from recommendations contained in other types of research product, whether as a result of differing time horizons,
methodologies or otherwise. Nomura Group publishes research product in a number of different ways including the posting of product on Nomura Group portals and/or distribution directly to clients. Different
groups of clients may receive different products and services from the research department depending on their individual requirements.
Figures presented herein may refer to past performance or simulations based on past performance which are not reliable indicators of future performance. Where the information contains an indication of
future performance, such forecasts may not be a reliable indicator of future performance. Moreover, simulations are based on models and simplifying assumptions which may oversimplify and not reflect the
future distribution of returns.
Certain securities are subject to fluctuations in exchange rates that could have an adverse effect on the value or price of, or income derived from, the investment.
The securities described herein may not have been registered under the US Securities Act of 1933 (the „1933 Act‟), and, in such case, may not be offered or sold in the US or to US persons unless they have
been registered under the 1933 Act, or except in compliance with an exemption from the registration requirements of the 1933 Act. Unless governing law permits otherwise, any transaction should be
executed via a Nomura entity in your home jurisdiction.
This document has been approved for distribution in the UK and European Economic Area as investment research by NIplc, which is authorized and regulated by the FSA and is a member of the London
Stock Exchange. It does not constitute a personal recommendation, as defined by the FSA, or take into account the particular investment objectives, financial situations, or needs of individual investors. It is
intended only for investors who are 'eligible counterparties' or 'professional clients' as defined by the FSA, and may not, therefore, be redistributed to retail clients as defined by the FSA. This document has
been approved by NIHK, which is regulated by the Hong Kong Securities and Futures Commission, for distribution in Hong Kong by NIHK. This document has been approved for distribution in Australia by
NAL, which is authorized and regulated in Australia by the ASIC. This document has also been approved for distribution in Malaysia by NSM. In Singapore, this document has been distributed by NSL. NSL
accepts legal responsibility for the content of this document, where it concerns securities, futures and foreign exchange, issued by their foreign affiliates in respect of recipients who are not accredited, expert
or institutional investors as defined by the Securities and Futures Act (Chapter 289). Recipients of this document in Singapore should contact NSL in respect of matters arising from, or in connection with, this
document. Unless prohibited by the provisions of Regulation S of the 1933 Act, this material is distributed in the US, by NSI, a US-registered broker-dealer, which accepts responsibility for its contents in
accordance with the provisions of Rule 15a-6, under the US Securities Exchange Act of 1934.
This document has not been approved for distribution in the Kingdom of Saudi Arabia („Saudi Arabia‟) or to clients other than 'professional clients' in the United Arab Emirates („UAE‟) by Nomura Saudi
Arabia, NIplc or any other member of Nomura Group, as the case may be. Neither this document nor any copy thereof may be taken or transmitted or distributed, directly or indirectly, by any person other
than those authorised to do so into Saudi Arabia or in the UAE or to any person located in Saudi Arabia or to clients other than 'professional clients' in the UAE. By accepting to receive this document, you
represent that you are not located in Saudi Arabia or that you are a 'professional client' in the UAE and agree to comply with these restrictions. Any failure to comply with these restrictions may constitute a
violation of the laws of the UAE or Saudi Arabia.
NO PART OF THIS MATERIAL MAY BE (I) COPIED, PHOTOCOPIED, OR DUPLICATED IN ANY FORM, BY ANY MEANS; OR (II) REDISTRIBUTED WITHOUT THE PRIOR WRITTEN CONSENT OF A
MEMBER OF NOMURA GROUP. If this document has been distributed by electronic transmission, such as e-mail, then such transmission cannot be guaranteed to be secure or error-free as information
could be intercepted, corrupted, lost, destroyed, arrive late or incomplete, or contain viruses. The sender therefore does not accept liability for any errors or omissions in the contents of this document, which
may arise as a result of electronic transmission. If verification is required, please request a hard-copy version.
Nomura Group manages conflicts with respect to the production of research through its compliance policies and procedures (including, but not limited to, Conflicts of Interest, Chinese Wall and
Confidentiality policies) as well as through the maintenance of Chinese walls and employee training.
Additional information is available upon request and disclosure information is available at the Nomura Disclosure web page:
http://go.nomuranow.com/research/globalresearchportal/pages/disclosures/disclosures.aspx


