22http://jpst.ripi.irJournal of Petroleum Science and Technology 2019, 9(4), 22-38
© 2019 Research Institute of Petroleum Industry (RIPI)
ABSTRACTEnvironmental concerns and cost associated with drilling operations have made us promote the
application of biodegradable and renewable drilling fluid additives, particularly at high temperature. In
this study, sodium carboxymethyl cellulose (NaCMC) synthesized from cocoa pod husk (cocoa NaCMC)
was tested as a filtration agent at high temperature and differential pressure conditions. Moreover, eight
mud samples containing various fluid-loss additives were tested. The Filtration test was performed using
the permeability plugging tester at 248 °F temperature and 100 psi and 300 psi differential pressures
with ceramic discs 10 µm and 90 µm. In addition, the degree filtration agents affect the drilling mud’s
rheological parameters were estimated. Also, thermal degradability of the sample was also studied. The
results showed that filtration control performance at high temperature and low/high differential pressure
was improved by decreasing particle size and increasing concentration. Using the cocoa NaCMC was
proved to be a better filtration agent at high-temperature conditions with a high thermal degradability.
Finally, the obtained results indicated that the filtration control performance declined in higher permeable
formation. Moreover, the drilling fluid’s rheological properties were improved by the cocoa NaCMC, and it
was comparable to the industrial PAC.
Keywords: Cocoa Pod Husk, Cellulose, Sodium Carboxymethyl Cellulose, Filtration Characteristics, Drilling
Fluids
Wilberforce Nkrumah Aggrey1,2*, Nana Yaw Asiedu3, Bennet Nii Tackie-Otoo4, Stephen Adjei4, and Emmanuel Mensah-Bonsu2
1Department of Petroleum Engineering, Kwame Nkrumah University of Science and Technology, Kumasi, PMD, Ghana2Petroleum Research Laboratories-Drilling Fluids Engineering, Kwame Nkrumah University of Science and Technology, Kumasi, PMD, Ghana3Department of Chemical Engineering, Kwame Nkrumah University of Science and Technology, Kumasi, PMD, Ghana4Department of Petroleum Engineering, All Nations University College, Koforidua, Ghana
Performance of Carboxymethyl Cellulose Produced from Cocoa Pod Husk as Fluid Loss Control Agent at High Temperatures and Variable (Low and High) Differential Pressure Conditions-Part 1
*Corresponding author Wilberforce Nkrumah Aggrey Email: [email protected] Tel: +233 05 0804 7368 Fax: +233 05 0804 7368
Article history Received: November 29, 2018 Received in revised form: May 31, 2019 Accepted: June 9, 2019 Available online: December 20, 2019 DOI: 10.22078/jpst.2019.3550.1570
Journal of Petroleum Science and Technology

Performance of Carboxymethyl Cellulose Produced from Cocoa Pod Husk... Journal of Petroleum Science and Technology
http://jpst.ripi.ir23
Journal of Petroleum Science and Technology 2019, 9(4), 22-38© 2019 Research Institute of Petroleum Industry (RIPI)
INTRODUCTIONAn important part of drilling operations in the
oil and gas industry is the drilling mud or fluid. It
performs various functions including transporting
drill cuttings to the surface, lubricating, and
cooling the drill bit, sustaining the stability of
wellbore and regulating formation pressure [1].
Therefore, success in drilling operations requires
that drilling fluids possess desirable qualities which
depend on their rheological and fluid filtration
properties [2]. Among these qualities of drilling
fluid, satisfactory filtration control is required to
avoid drilling issues that include extreme drag and
torque, lost circulation, formation damage, and
wellbore instability which affects well productivity
[2–4]. In view of these challenges, several fluid loss
agents and additives have been formulated and
synthesized for various applications in invert, oil,
and water-based drilling fluids [5–11].
Various components are applied to water-
based drilling muds to improve the filtration
characteristics and rheological parameters [12].
Bentonite is the commonly used component in
drilling muds to increase viscosity and regulate
fluid loss because of its excellent colloidal
properties. Moreover, conventional drilling fluids
require a large amount of bentonite to achieve
desirable rheological and filtration properties [13].
Nonetheless, in higher concentrations, bentonite
possesses drilling problems as mentioned above
[2]. Therefore, drilling fluids are augmented
by various polymers as viscosity modifiers and
fluid loss control additives. Polymers commonly
used in drilling fluids are cellulose derivatives of
carboxymethyl cellulose (CMC) and polyanionic
cellulose (PAC), guar gum, and xanthan gum.
Moreover, cellulose derivatives are the most
preferred because they are biodegradable and
compatible with other components of drilling fluid.
Although it has been reported by Okorie and Julius
[9] in their review paper which explains “how some
agro-waste has been used for the synthesis and
design of lost control agents.” It is important to
note that differences in texture, thermal stability,
compressive strength, cost and their effects on the
pay zone are factors that influence how and where
the LCMs are deployed. In addition, finding a fluid
loss control agent that is cheap, stable, and strong
and has a low effect on the pay zones is desirable,
and several studies must be conducted and tested
for such fluid loss agents.
Another challenge in drilling fluid technology is
drilling in high permeability reservoirs particularly
sandstone formations with high permeability
zones and high temperatures which are to be
plugged during drilling and completion activities
without degradation of the polymer material. Such
formations require a mat-like bridge on the wall of
the borehole to combat lost circulation [9].
Drilling and completions problems intensify in
deep drilling and completion because of the
rise in temperature and pressure which leads
to degradation of drilling and completion fluid
properties [14]. This degradation of fluid properties
is mainly because of the flocculation, degradation,
and instability of bentonite at HPHT conditions [13,
15]. In addition, polymers decompose, and they
are unstable at HPHT conditions [3, 16]. Oil-based
mud was the choice of drilling fluid in these hostile
environments for years because they are thermally
stable up to 500 oF. Nevertheless, environmental
legislation has increased restrictions on their
usage, and they are totally prohibited in some
countries [17]. This makes the use of polymers

W. N. Aggrey, et alJournal of PetroleumScience and Technology
Journal of Petroleum Science and Technology 2019, 9(4), 22-38© 2019 Research Institute of Petroleum Industry (RIPI) 24
http://jpst.ripi.ir
in water-based drilling fluids indispensable (or
essential). There are alternative synthetic polymers
that are stable at high-temperature conditions, but
these polymers are expensive and have associated
environmental concerns too [16].
There are several works in literature where plant
wastes have been valorized to reduce the cost of
drilling operations yet they are unable to meet
other fluid loss criteria such as stability, mat-like
plugging nature for high sandstone permeability
formations, thermal stability, and compressive
strength. Converting plant wastes into needful
products presents a lot of socio-economic issues
[18]. In these studies, plant wastes are either
used in their raw state, or cellulose derivatives are
extracted from them. Various plant wastes have
been used in this regard: agarwood waste [19],
rice husk [4], corn starch [20], peanut hull [21],
sugarcane [22], corn cobs, coconut shell [23], and
wood wastes [24].
In this paper, the results of laboratory and
experimental work which have been carried out
are reported; in addition, this study reports the
first part of the results at considerably low and high
differential pressure and high-temperature regime
of sodium carboxymethyl cellulose synthesized
from cocoa pod husk and used as a filtration agent
in water-based mud to answer the challenges
raised in this literature. The focus of this work is to
analyze the workability of this NaCMC synthesized
from cocoa pod husk as a filtration agent at high
temperatures without thermal degradability
and its effect on the pay zones (permeability) as
well as using the morphological sequence of the
synthesized fluid loss agent comparing it with the
industrial premium; polyanionic cellulose (PAC).
EXPERIMENTAL PROCEDUREMaterialsWyoming sodium bentonite was supplied by
Kenon Drilling Services (Takoradi, Ghana), and
industrial polyanionic cellulose (PAC) was supplied
by Baker Hughes (Takoradi, Ghana). Moreover,
sodium hydroxide (≥99% acidimetric), isopropanol
(99% purity), methanol (99% purity), and ethanol
(≥95% purity) were supplied by Research – Lab Fine
Chemicals Industries. Sodium mono chloroacetate
(≥98% acidimetric), glacial acetic acid (99%
purity), and phenolphthalein were purchased
from LabChem. The necessary chemicals were at
analytical levels and used as obtained.
Cellulose Extraction from Cocoa HuskFresh cocoa pods were obtained from Jinijini in
the Brong Ahafo region of Ghana. The pods were
dried for 2 weeks, crushed into smaller sizes, and
blended into powder form. The powder was then
sieved using the Retsch sieve analysis machine
for 15 minutes. The various particle sizes were
collected and weighed. The machine has five sieves
with sizes 500 µm, 250 µm, 125 µm, 63 µm, and
25 µm.
100 grams of cocoa husk powder were dissolved
in 2% w/v sodium hydroxide (NaOH) in a beaker.
The resulting mixture was heated in a water bath at
80 °C for 3 hours, and it thoroughly washed under
distilled water until the pH was approximately
neutral. It was then bleached with 500 ml Mirazone
bleach containing 7% of sodium hypochlorite at
80 °C under mechanical stirring for 15 minutes. The
mixture was later treated with 1L 12% w/v NaOH
solution and heated at 80 °C for an hour. Final
bleaching was done to remove the remaining lignin
and hemicellulose and also to purify the cellulose.

Performance of Carboxymethyl Cellulose Produced from Cocoa Pod Husk... Journal of Petroleum Science and Technology
http://jpst.ripi.ir25
Journal of Petroleum Science and Technology 2019, 9(4), 22-38© 2019 Research Institute of Petroleum Industry (RIPI)
The extracted cellulose was washed thoroughly with
distilled water and dried in an oven at 60 °C for 24
hours. In Appendix 1, a photo gallery of the conversion
of cellulose from the crushed cocoa husk is shown.
Synthesis of Cocoa Sodium Carboxymethyl CelluloseExtraction of crude cellulose from cocoa pod husk
was done similar to the procedure used by Hutomo
et al [25]. The extracted cellulose was insoluble
in the drilling fluid formulated; therefore, it was
converted into a soluble cellulose derivative, sodium
carboxymethyl cellulose (NaCMC), by attaching a
carboxymethyl (-CH2-COOH) side chain unto the
cellulose backbone. Moreover, NaCMC synthesis
involves reacting cellulose with chloroacetic acid in
the presence of a base [26]. Synthesis of NaCMC
was done according to the method of Hutomo et
al [25]. The followed procedure is fully described
below.
30 ml of NaOH and 270 ml of isopropanol were
added to 45 grams of the extracted cellulose in a
beaker. The mixture was mechanically stirred and
allowed to stand for 30 min at room temperature.
Afterwards, 10.8 grams of sodium monochloroacetic
acid was added to the pre-treated cellulose with
continuous stirring for 90 min. The mixture was
covered with aluminum foil and kept in an oven at
55 °C for 180 min. The slurry was neutralized with
glacial acetic acid and then filtered. The sodium
carboxymethyl cellulose produced was washed
with 300 ml of ethanol to remove undesirable salts,
followed by a methanol wash to remove remaining
impurities and dried in an oven at 55 °C for an hour.
Appendix 2 shows a photo gallery of the conversion
of extracted cocoa cellulose into cocoa sodium
carboxymethyl cellulose.
FT-IR Spectroscopy of Extracted Cellulose and Sodium Carboxymethyl CelluloseFTIR study into the composition of the extracted
cellulose and the synthesized NaCMC was
conducted using a Perkin Elmer UATR Spectrum Two
FTIR spectrometer to record the infrared spectra
of the dried extracted cellulose and NaCMC. The
transition was measured at the wavenumber region
of 4000-400 cm-1 having a resolution of 4 cm-1.
Drilling Fluid FormulationWater-based drilling fluids consisting of 20 g of
bentonite (main component for viscosity and
filtration control in drilling fluids), 350 ml of
water and 0.4 gram NaOH, 0.5 gram KCl, and
5 gram barite were prepared according to API
Specification 13A [27]. In addition, different drilling
fluid samples were prepared as shown in Table
1. This was to investigate the performance of the
extracted cellulose and the synthesized NaCMC at
different particle sizes and mass concentrations.
The performances of the samples were compared
to that of a drilling mud formulation having no
additive to control loss of fluid and a formulation
with industrial polyanionic cellulose as a fluid loss
control additive.Table 1: Drilling formulation samples and their
components.Sample Water Bentonite Additive
A 350 ml 20 g No fluid loss control additive
B 350 ml 20 g <25 µm of Industrial PACC 350 ml 20 g <63 µm of cocoa NaCMCD 350 ml 20 g <125 µm of cocoa NaCMCE 350 ml 20 g <250 µm of cocoa NaCMC
G 350 ml 20 g <63 µm of extracted cellulose
H 350 ml 20 g <25 µm of cocoa NaCMC
I 350 ml 20 g <25 µm of extracted cellulose

W. N. Aggrey, et alJournal of PetroleumScience and Technology
Journal of Petroleum Science and Technology 2019, 9(4), 22-38© 2019 Research Institute of Petroleum Industry (RIPI) 26
http://jpst.ripi.ir
High Pressure and Low and High Differential Pressure Filtration TestThe test was done at a temperature of 120 oC and
differential pressures of 100 and 300 psi deploying
Fan permeability plugging tester. The test was
done with a ceramic disc of 10 µm and 90 µm
mean pore throat diameters thus simulating low
and high permeability formations respectively.
The equipment is made to mimic downhole fluid
loss at the dynamic condition, and the ceramic
disc closely replicates the structure of formation.
This, therefore, gives a better depiction of filtration
process downhole.
The filtration characteristics can be derived from
the volume of filtrate collected at 7.5 and 30
minute intervals according to Equations 1 to 3 [28]:
Permeability plugging tester value (PPTV)
30 min( ) 2= ×PPTV Vol (1)
( )7.5 min 30 min 7.5 min( ) 2= × − − SL Vol Vol Vol (2)
( ) ( )30 min 7.5 min
22.739−
= ×Vol Vol
SFR (3)
where Vol7.5 min and Vol30 min are the total filtrates
obtained in 7.5 min and 30 min respectively.
After the 30 min, the filter cake’s thickness on the
ceramic disc was measured. The dried filter cake’s
thickness formed at 30 min was then taken. The
samples tested were samples A, B, C, D, E, G, H,
and I. Samples G and I were insoluble in the drilling
mud. This brought the need for CMC conversion.
Rheological TestingThe effects of the filtration agents on the rheology
of the mud formulation were evaluated by using
the Fann rheometer model 286. Drilling muds are
commonly Non-Newtonian and exhibit pseudo-
plastic behavior [29]. They exhibit rheological
behavior between the Bingham Plastic and
the Power Law models [1]. Therefore, their
pseudoplastic behavior is most described by using
these two rheological models. The rheological
parameters were obtained above a shear rate region
of 10.2–1022 s-1 using these models. Only samples
A, B, C, and I were used in this test. According to the
Bingham Plastic Model [29], the following equations
(Equations 4, 5, and 6) are governed:600Apparent viscosity ( )2αµ =θ (4)
( )p 600 300Plastic viscosity = θ −θµ (5)
( )y 300 pYield point = θ −µτ (6)
where θ300 and θ600 are 300 and 600 rpm dial
readings respectively. The gel strengths of the
drilling muds were also obtained as GS10 sec and
GS10 min by recording the maximal dial deflection
at a 3 rpm when the drilling fluids have remained
still for 10 sec and 10 min respectively.
According to the Power Law Model [1], Equation 7
is governed:nK τ = γ (7)
where,
τ = shear stress,
γ = shear rate,
n = flow index, and
K = consistency index.
Moreover, n and K are derived from Equations 8
and 9:600
300
3.32 log =
n θθ
(8)
600
1022= nK θ (9)
SEM and Thermal Degradation StudiesSEM images of the cocoa cellulose and PAC were
obtained by Hitachi SU8010 ultra-high resolution
equipment.
Figure 1 (a and b) represents the SEM images of
the cocoa CMC and industrial PAC respectively.

Performance of Carboxymethyl Cellulose Produced from Cocoa Pod Husk... Journal of Petroleum Science and Technology
http://jpst.ripi.ir27
Journal of Petroleum Science and Technology 2019, 9(4), 22-38© 2019 Research Institute of Petroleum Industry (RIPI)
Figure 1 (a): SEM image of Cocoa CMC.
Figure 1 (b): SEM image of industrial PAC.
Both images were taken at 30 μm resolution.
TGA pyrolysis (under argon) was set to operate
from room temperature (20 °C) to 800 °C at a low
heating rate (10 °C/min). The thermogravimetric
(TG) and the derivative thermogravimetric (DTG)
plots of the cocoa pod husks are shown in Figure 2
(a and b) respectively.
Figure 2: (a) DTG plot for the cocoa NaCMC (b) TGA plot for cocoa NaCMC.
B
RESULTS AND DISCUSSION
Extracted Cellulose and Sodium Carboxymethyl Cellulose Characterization Figures 3 and 4 present results of the IR spectra of
the extracted cellulose and NaCMC respectively.
Broad adsorption band at 3327 cm-1 is because of
an H-bonded and OH stretch which is peculiar to
the hydroxyl group [30].
Figure 3: FTIR spectrum graph of extracted cellulose.
A

W. N. Aggrey, et alJournal of PetroleumScience and Technology
Journal of Petroleum Science and Technology 2019, 9(4), 22-38© 2019 Research Institute of Petroleum Industry (RIPI) 28
http://jpst.ripi.ir
Figure 4: FTIR Spectrum Graph of NaCMC.
The presence of the hydroxyl group the primary
functional group of cellulose is indicative of the
presence of cellulose in the extract. Also, in Figures
3 and 4, peaks at wavenumber 2887.63 cm-1 and
2878.51 cm-1 are respectively seen. This is due to
the C-H stretch bond, which is characteristically
present in alkanes. The alkane group is related to
cellulose [31].
The peaks at wavenumber 1412.25 cm-1, 1596.25 cm-1
and 1590.06 cm-1 in Figures 3 and 4 with C=C-C stretch,
represent an aromatic compound, which gives an
indication of the lignin in both the extracted cellulose
and the NaCMC. In addition, by the analysis of the
spectrum of the extracted cellulose, peaks of
wave number 1314.57 cm-1 and 1157.10 cm-1 were
observed, and this is indicative of the alcohols
(cellulose, hemicellulose, and lignin), esters, carboxylic
acids, and ether’s.
However, by making a comparison between the two
spectral graphs, it is observed that there are peaks
that fall within the range of 1000 cm-1 and 1320 cm-1.
This indicates that cellulose, hemicellulose, and lignin
are present in both samples. This is because this range
in question is attributed to the alcohol and carboxylic
acid because of their characteristic C-O stretch bond
type.
The peak corresponding to the wave number
894.42 cm-1 in Figure 3 shows that there is an aromatic
functional group present with a characteristic C-H
bond type and indicates the presence of lignin in
the extracted sample. This is confirmed with the
presence of an alkene group, which is also indicative
of the presence of lignin in the sample. From FTIR,
it’s clear that the cellulose extracted is not a pure
form and still needs some further purification.
Impact of Particle Size of Cocoa NaCMC on Filtration ParametersThe variation of the filtration parameters with
the particle size of the cocoa NaCMC at high
temperature and differential pressure (low and
high) condition in a permeable formation is
presented in Figures 5 to 7.
Figure 5: PPT value versus particle sizes of different masses of cocoa NaCMC.
Figure 6: Spurt loss versus particle sizes of different masses of cocoa NaCMC.

Performance of Carboxymethyl Cellulose Produced from Cocoa Pod Husk... Journal of Petroleum Science and Technology
http://jpst.ripi.ir29
Journal of Petroleum Science and Technology 2019, 9(4), 22-38© 2019 Research Institute of Petroleum Industry (RIPI)
Figure 7: Static filtration versus particle sizes of different masses of cocoa NaCMC.
Filtration parameters from the results presented
were improved as the particle size of cocoa NaCMC
decreased. From Tables 2 and 3 as well as Tables 4-7
the samples A, B, G, and I exhibited the same trend.
Table 2: High-temperature and low-pressure differential Filtration results of extracted
cellulose at 100 psi.
Sample Mass (g)
Vol 7.5 min (ml)
Vol 30 min (ml)
PPTV (ml) SL (ml) SFR (ml/
min1/2)
At 100 psi with 10µm ceramic discA 0 40 53 106 54 9.49
B 5 34 44 88 48 7.30
G
5
8
12
49
47
45
67
64
61
134
128
122
62
60
58
13.14
12.41
11.68
I
5
8
12
45
42
40
61
57
54
122
114
108
58
54
52
11.68
10.95
10.22
At 100 psi with 90µm ceramic discA 0 50 62 124 76 8.76
B 5 41 50 100 64 6.57
G
5
8
12
57
55
52
75
72
69
150
144
138
78
76
70
13.14
12.41
12.41
I
5
8
12
52
49
47
70
66
64
140
132
128
68
64
60
13.14
12.41
1241
PPTV – Permeability Plugging Tester Value SL- Spurt loss SF- Static Filtration Rate
Table 3: High-temperature and high-pressure differential filtration results of extracted cellulose
at 300psi with different ceramic discs.
Sample Mass (g)
Vol 7.5 min (ml)
Vol 30 min (ml)
PPTV (ml) SL (ml) SFR (ml/
min1/2)
At 300 psi with 10µm ceramic disc
A 0 48 63 126 66 10.95
B 5 42 54 108 60 8.76
G
5
8
12
57
55
53
77
74
71
154
148
122
74
72
70
14.60
13.87
13.14
I
5
8
12
57
54
52
75
71
68
150
142
136
78
74
72
13.14
12.41
11.68
At 300 psi with 90µm ceramic disc
A 0 57 74 148 80 12.41
B 5 51 65 130 74 10.22
G
5
8
12
66
64
62
88
85
82
176
170
164
88
86
84
16.06
15.33
14.60
I
5
8
12
66
63
61
86
82
79
172
164
158
92
88
86
14.60
13.87
13.14
PPTV – Permeability Plugging Tester Value SL- Spurt loss SF- Static Filtration Rate
Moreover, the same observation is seen in the
other formulation samples A, B, C, D, E, and H as
shown in Tables 4 to 7.

W. N. Aggrey, et alJournal of PetroleumScience and Technology
Journal of Petroleum Science and Technology 2019, 9(4), 22-38© 2019 Research Institute of Petroleum Industry (RIPI) 30
http://jpst.ripi.ir
Table 4: High-temperature and low-pressure differential filtration results of cocoa NaCMC at 100 psi using 10 µm ceramic disc.
Sample Mass of NaCMC(g) Vol 7.5 min (ml) Vol 30 min (ml) PPTV (ml) SL (ml) SFR (ml/min1/2)
A 0 40 53 106 54 9.49B 5 34 44 88 48 7.30
H
5
8
12
20
18
15
24
21
18
48
42
36
32
30
24
2.92
2.19
2.19
C
5
8
12
25
23
20
31
28
24
62
56
48
38
36
32
4.38
3.65
2.92
D
5
8
12
30
28
26
38
35
32
76
70
64
44
42
40
5.84
5.11
4.38
E
5
8
12
38
35
33
47
45
41
94
90
82
58
50
50
6.57
7.30
5.84
PPTV: Permeability Plugging Tester Value, SL: Spurt Loss, and SF: Static Filtration Rate.
Table 5: High-temperature and low-pressure differential filtration results of cocoa NaCMC at 100 psi using 90 µm ceramic disc.
Sample Weight of NaC-MC (g) Vol 7.5 min (ml) Vol 30 min (ml) PPTV (ml) SL (ml) SLR (ml/min1/2)
A 0 50 62 124 76 8.76B 5 41 50 100 64 6.57
H
5
8
12
26
25
22
30
28
25
60
56
50
44
44
38
2.92
2.19
2.19
C
5
8
12
32
30
27
39
35
31
78
70
62
50
50
48
5.11
3.65
2.92
D
5
8
12
37
36
33
45
43
40
90
86
80
58
58
52
5.84
5.11
5.11
E
5
8
12
45
43
42
53
52
51
106
104
102
74
68
66
5.84
6.57
6.57
PPTV: Permeability Plugging Tester Value, SL: Spurt Loss, and SF: Static Filtration Rate.

Performance of Carboxymethyl Cellulose Produced from Cocoa Pod Husk... Journal of Petroleum Science and Technology
http://jpst.ripi.ir31
Journal of Petroleum Science and Technology 2019, 9(4), 22-38© 2019 Research Institute of Petroleum Industry (RIPI)
Table 6: High-temperature and high-pressure differential filtration results cocoa NaCMC at 300 psi using 10 µm ceramic disc.
Sample Weight of NaCMC (g) Vol 7.5 min (ml) Vol 30 min (ml) PPTV (ml) SL (ml) SFR (ml/min1/2)
A 0 48 63 126 66 10.95B 5 42 54 108 60 8.76
H
5
8
12
28
26
23
34
31
28
68
62
56
44
42
36
4.38
3.65
3.65
C
5
8
12
33
31
28
41
38
34
82
76
68
50
48
44
5.84
5.11
4.38
D
5
8
12
40
38
36
50
47
44
100
94
88
60
58
56
7.30
6.57
5.84
E
5
8
12
53
50
48
65
62
58
130
124
116
82
76
76
8.76
8.76
7.30PPTV: Permeability Plugging Tester Value, SL: Spurt Loss, and SF: Static Filtration Rate.
Table 7: High Temperature High pressure differential filtration results of cocoa NaCMC at 300 psi using 90 µm ceramic disc.
Sample Weight of NaCMC (g) Vol 7.5 min (ml) Vol 30 min (ml) PPTV (ml) SL (ml) SFR (ml/min1/2)
A 0 57 74 148 88 12.41B 5 51 65 130 74 10.22
H
5
8
12
37
35
32
45
42
39
90
84
78
58
56
50
5.84
5.11
5.11
C
5
8
12
42
40
37
52
49
45
104
98
90
64
62
58
7.30
6.57
5.84
D
5
8
12
49
47
45
61
58
55
122
116
110
74
72
70
8.76
8.03
7.30
E
5
8
12
62
59
57
76
73
69
152
146
138
96
90
90
10.22
10.22
8.76PPTV: Permeability Plugging Tester Value, SL: Spurt Loss, and SF: Static Filtration Rate.
W. N. Aggrey, et alJournal of PetroleumScience and Technology
Journal of Petroleum Science and Technology 2019, 9(4), 22-38© 2019 Research Institute of Petroleum Industry (RIPI) 32
http://jpst.ripi.ir
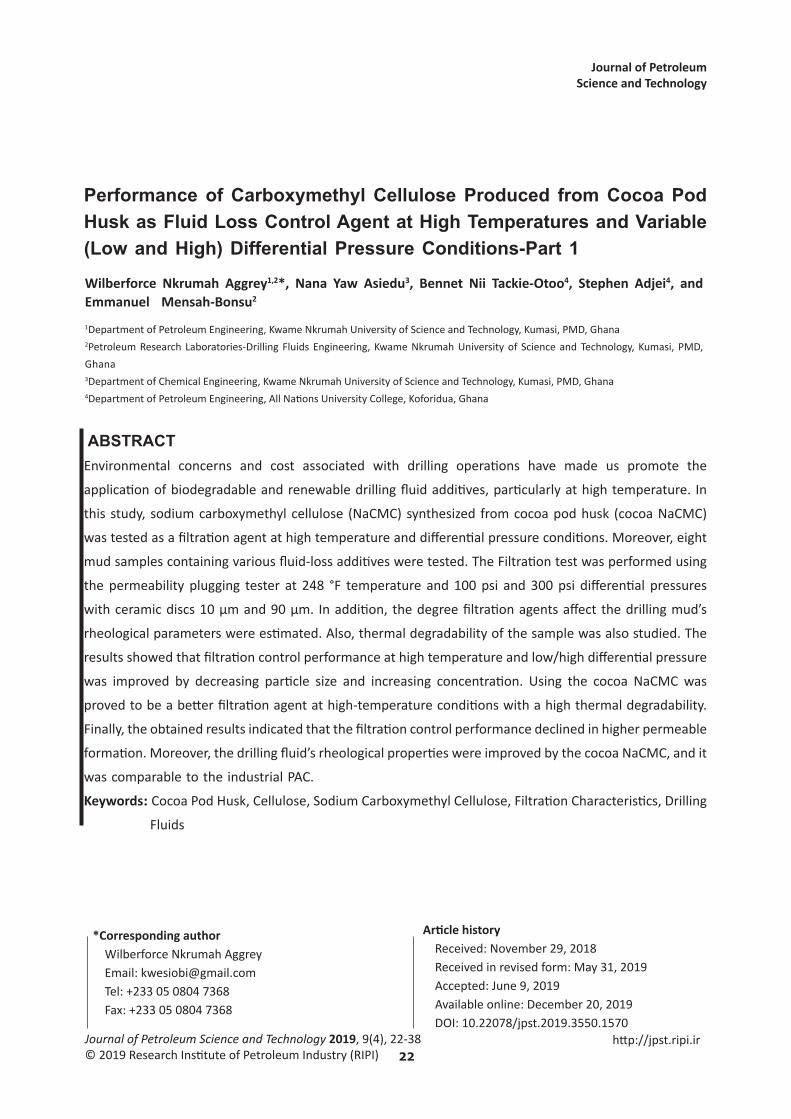
The main reason for the advent of this trend
is improvement of small sized particles by the
efficiency of the impermeable filter cake formation.
It can be observed from Figure 8 that particle size
reduction also results in thinner filter cakes.
Figure 8: Mud cake size variation with particle size.
This is due to the fact that as filter cake easily
becomes impermeable, fewer particles are
deposited to increase filter cake size. Small sized
particles also have a larger surface area; therefore,
they tend to be more resistant to pressure [21].
It is worth noting from Tables 4 to 7 that the cocoa
NaCMC have had better filtration parameters in
comparison with the industrial PAC even at larger
particle sizes. It is only the sample E with NaCMC of
particle sizes <250 µm that performed worse than
sample B with industrial PAC of particle sizes <25
µm. This can be attributed to the results from SEM
test which have shown the strand-like nature of the
CMC particles in comparison with the cylindrical
nature of the PAC particles.
Impact of the Mass of Cocoa NaCMC on Filtration ParametersIt is evident from Tables 4 to 7 that there is a general
decreasing trend in all filtration parameters with
an increase in the quantity of cocoa NaCMC in the
drilling mud formulation regardless of the size of
the particle of the filtration agent used. This trend
is also evident from Figures 5 to 7 as the 12-gram
curve is always below the 5-gram and 8-gram
curves.
This trend and behavior is attributable to the
increase in viscosity with increasing quantity of the
cocoa NaCMC. Viscosity increase is one of the basic
mechanisms which affects filtration; in addition,
the more viscous fluid is forced through the filter
cake, the lower the filtration rate will be.
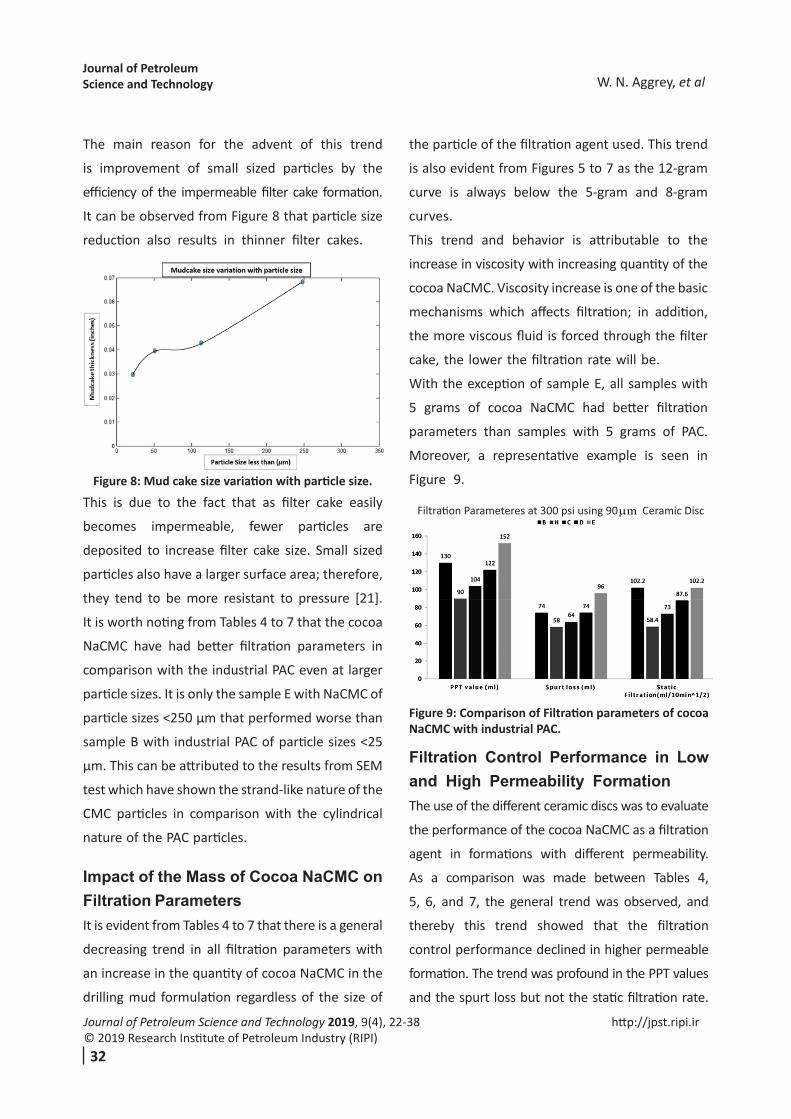
With the exception of sample E, all samples with
5 grams of cocoa NaCMC had better filtration
parameters than samples with 5 grams of PAC.
Moreover, a representative example is seen in
Figure 9.
Figure 9: Comparison of Filtration parameters of cocoa NaCMC with industrial PAC.
Filtration Control Performance in Low and High Permeability FormationThe use of the different ceramic discs was to evaluate
the performance of the cocoa NaCMC as a filtration
agent in formations with different permeability.
As a comparison was made between Tables 4,
5, 6, and 7, the general trend was observed, and
thereby this trend showed that the filtration
control performance declined in higher permeable
formation. The trend was profound in the PPT values
and the spurt loss but not the static filtration rate.
Filtration Parameteres at 300 psi using 90 mµ Ceramic Disc

Performance of Carboxymethyl Cellulose Produced from Cocoa Pod Husk... Journal of Petroleum Science and Technology
http://jpst.ripi.ir33
Journal of Petroleum Science and Technology 2019, 9(4), 22-38© 2019 Research Institute of Petroleum Industry (RIPI)
This trend can be explained in terms of particle
bridging which is another basic mechanism that
affects filtration. Moreover, particle bridging is
more efficient in smaller pores than in larger
pores. Also, smaller particles tend to bridge smaller
pores while larger particles bridge larger pores.
As explained in particles size effect on mud cake
formation, smaller particles form more efficient
mud cake.
Filtration Control Performance at Different Differential PressuresEvaluation of filtration characteristics of cocoa
NaCMC at different differential pressures is done
by comparing Table 4 to Table 6 and Table 5 to Table
7. It was observed that filtration characteristics of
the cocoa NaCMC were better at low differential
pressures than under high differential pressures.
The Differential pressure factor influences particle
bridging hence the efficiency of mud cake formation
in the wellbore. Mud cake compressibility is
another factor that controls filtrate loss. At high
differential pressures, larger particles may aid in
limiting the solids that plug into pores and reduce
the effect of mud cake compaction [32].
Impact of Filtration Agents on the Rheological Properties of Drilling MudPseudoplastic behavior of drilling muds is very
essential because a higher viscosity at a low shear
rate is required to suspend and move cuttings up
to the surface. Moreover, low viscosity is required
at higher shear rates for drilling fluids to flow
with little counteraction [2]. This behavior is best
described with the power law model. The results
achieved using Equations 4 to 9 are shown in Table
8.
Table 8: Drilling mud rheological parameters with various filtration agents.
Sample Parameters of Bingham plastic fluids
Parameters of power law fluids
µa (cP) / µp (cP)
τy (lb/100
ft2)
GS10s
/ GS10min
(lb/100 ft2)
n (-) K
(lb.sn/100 ft2)
A 9.5/6 7 3/9 0.547 0.43B 27/8 38 3/11 0.231 10.88H 20/12 16 3/9 0.514 1.13I 24/57 35 15/25 0.222 10.50
It can be observed that the cocoa NaCMC caused a
significant rise in the yield point and viscosity, but
the drilling fluid’s gel strength was not altered. It
is worth noting that the extracted cellulose which
didn’t possess better filtration characteristics due
to its insoluble nature has a better effect on the
rheology of the mud.
The plot of shear rate against stress for different
samples is presented in Figure 10.
Figure 10: Shear rate against stress for drilling mud samples.
It shows a non-linear relationship which depicts
that the drilling fluid samples are pseudoplastic.
The values of the flow index (n) as presented in
Table 8 for all the samples were less than one (n<1)
which also substantiated the fact that the samples
were pseudoplastic. The raw drilling fluid without
filtration agent had the least consistency index (K)

W. N. Aggrey, et alJournal of PetroleumScience and Technology
Journal of Petroleum Science and Technology 2019, 9(4), 22-38© 2019 Research Institute of Petroleum Industry (RIPI) 34
http://jpst.ripi.ir
value and the highest flow index (n) value, which
having these indexes means that the samples with
the filtration agents are more viscous and more
shear thinning.
Morphological and Thermal Degradation StudiesAccording to Figure 1, it could be said that the
working mechanisms for the cocoa CMC would be
different from the industrial PAC.
Moreover, according to Figure 1, the cocoa CMCs
were strained together in a long continuous path in
comparison with the circular spherical path of the
industrial PAC. This morphological feature would
dictate the cocoa CMC’s critical concentration path
and agglomeration in a drilling fluid formulation.
By the stranding nature, it would take a shorter
time for sealing to be achieved especially if the
reservoir permeability path is far bigger than the
cocoa CMC particle range. The morphology of the
synthesized cocoa cellulose also would suggest that
in high permeability reservoirs, it should perform
as an excellent fluid loss agent in comparison with
the PAC due to their continuous dense strand-like
nature. This was confirmed with test analysis when
the ceramic disk of 90 was utilized with lower fluid
loss been for the synthesized cocoa NaCMC than
the industrial PAC.
Thermogravimetric analysis (TGA) on the cocoa
NaCMC showed that the thermal decomposition
behavior of the cocoa NaCMC degraded after 175
°C, but more specifically it occurred within the range
of 175 and 375 °C. This result was consistent with
works also carried out by Asuquo et al and Titiloye
et al [33, 34]. Using the conservative figure of 175
°C for analysis, it is noted that the performance
of the synthesized product at 175 °C is extremely
good since most bio-based synthesized products do
not achieve such temperature degradation curve.
Figure 2 (a and b) shows 3 differential quantities
indicating signatures of the components’ regions
removed by the thermal degradation process.
Based on the signatures, they can be related to
the different compositions of the cocoa pod husks
thereby allowing for component analysis.
The first stage loss in weight which is the moisture
evolution stage has been estimated to be 6%.
During the evolution of the volatile component
which was about 63% could be attributed to the
decomposition of hemicelluloses and cellulose
between 175 and 375 °C. It should be stated that
FTIR showed that the synthesized CMC was not
fully pure and did contain a significant amount of
hemicellulose. Thus TGA and DSC confirmed the
FTIR results and the need to purify the synthesized
material.
CONCLUSIONS1. The NaCMC prepared from cocoa pod husk
was proved to be a better filtration agent at high-
temperature conditions and in low and high permeable
formations in comparison with the industrial PAC.
2. Thermal stability of the synthesized agro material-
cocoa CMC at high temperatures was governed.
3. Increased filtration control was a function of the
particle size and mass of the cocoa NaCMC.
4. The cocoa NaCMC also improved the rheology
of the drilling mud and proved to make the drilling
fluid more pseudoplastic.
5. Finally, FTIR and TGA showed that the CMC
from cocoa husk still was not pure cellulose and
needed some more purification. Moreover, further
purification of cellulose should improve the current
rheological results.
Performance of Carboxymethyl Cellulose Produced from Cocoa Pod Husk... Journal of Petroleum Science and Technology
http://jpst.ripi.ir35
Journal of Petroleum Science and Technology 2019, 9(4), 22-38© 2019 Research Institute of Petroleum Industry (RIPI)
NOMENCLATURESCMC : Carboxymethyl CelluloseNaCMC : Sodium Carboxymethyl CellulosePPTV : Permeability Plugging Tester Value SL : Spurt Loss SF : Static Filtration RateSFR : Static filtration RatePPTV : Permeability plugging tester valueμα : Apparent viscosityμp : Plastic viscosityτy : Yield point
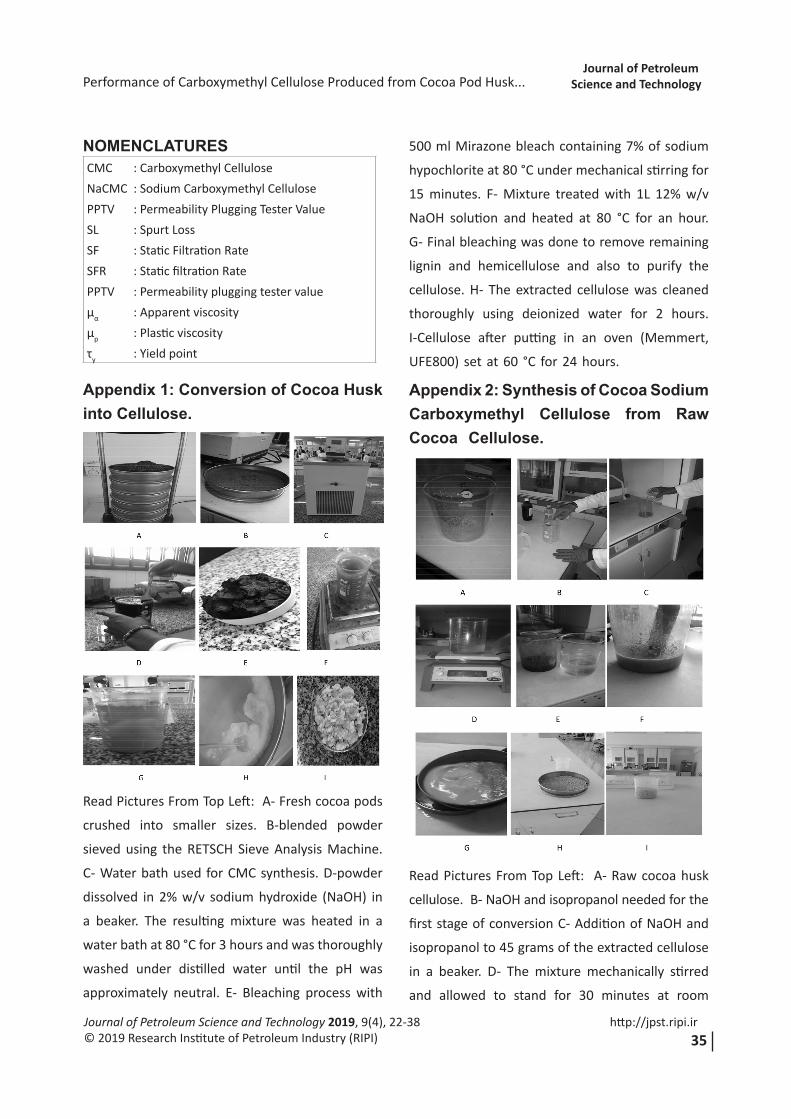
Appendix 1: Conversion of Cocoa Husk into Cellulose.
Read Pictures From Top Left: A- Fresh cocoa pods
crushed into smaller sizes. B-blended powder
sieved using the RETSCH Sieve Analysis Machine.
C- Water bath used for CMC synthesis. D-powder
dissolved in 2% w/v sodium hydroxide (NaOH) in
a beaker. The resulting mixture was heated in a
water bath at 80 °C for 3 hours and was thoroughly
washed under distilled water until the pH was
approximately neutral. E- Bleaching process with
500 ml Mirazone bleach containing 7% of sodium
hypochlorite at 80 °C under mechanical stirring for
15 minutes. F- Mixture treated with 1L 12% w/v
NaOH solution and heated at 80 °C for an hour.
G- Final bleaching was done to remove remaining
lignin and hemicellulose and also to purify the
cellulose. H- The extracted cellulose was cleaned
thoroughly using deionized water for 2 hours.
I-Cellulose after putting in an oven (Memmert,
UFE800) set at 60 °C for 24 hours.
Appendix 2: Synthesis of Cocoa Sodium Carboxymethyl Cellulose from Raw Cocoa Cellulose.
Read Pictures From Top Left: A- Raw cocoa husk
cellulose. B- NaOH and isopropanol needed for the
first stage of conversion C- Addition of NaOH and
isopropanol to 45 grams of the extracted cellulose
in a beaker. D- The mixture mechanically stirred
and allowed to stand for 30 minutes at room

W. N. Aggrey, et alJournal of PetroleumScience and Technology
Journal of Petroleum Science and Technology 2019, 9(4), 22-38© 2019 Research Institute of Petroleum Industry (RIPI) 36
http://jpst.ripi.ir
temperature. E- 10.8g of sodium monochloroacetic
acid added to the pre-treated cellulose. F- Continuous
stirring before the mixture was covered with
aluminum foil and kept in a Memmert oven
UFE800 at 55 °C for 180 minutes. G- The slurry of
the mixture was neutralized with glacial acetic acid
and then filtered. H-The sodium carboxymethyl
cellulose produced was washed with 300 ml of
ethanol to remove undesirable salts, followed by
a methanol wash to remove remaining impurities
and the water was evaporated using a Memmert
oven UFE800 at 55 °C for an hour. I- Final converted
sodium carboxymethyl cellulose.
REFERENCES1. BAKER H., “Drilling Fluids Reference Manual,”
(2nd ed ), Texas, Baker Hughes, 2006, 1-775.
2. Maghrabi S., Smith D., Engel A., Henry J., and et
al., “Design and Development of a Novel Fluid
Loss Additive for Invert Emulsion Drilling Fluids
from a Renewable Raw Material,” Society of
Petroleum Engineers, 2019.
3. Rosato M. J. and Supriyono A., “Polymer Fluid-
Loss Agent Aids Well Cleanouts,” Society of
Petroleum Engineers, 2003,
4. Jouenne S., Chakibi H., and Levitt D., “Polymer
Stability after Successive Mechanical-Degradation
Events,” Society of Petroleum Engineers, 2018.
5. Jia H., Chen H., and Guo S., “Fluid Loss Control
Mechanism of Using Polymer Gel Pill Based on
Multi-crosslinking during Overbalanced Well
Workover and Completion,” Fuel Journal, 2017,
210, 207–216.
6. Davoodi S., Ramazani S. A., Jamshidi S., and
Fellah Jahromi A., “A Novel Field Applicable
Mud Formula with Enhanced Fluid Loss
Properties in High Pressure-High Temperature
Well Condition Containing Pistachio Shell
Powder,” Journal of Petroleum Science and
Engineering, 2018, 162, 378–385.
7. Agwu O. E. and Akpabio J. U., “Using Agro-
waste Materials as Possible Filter Loss Control
Agents in Drilling Muds: A Review,” Journal of
Petroleum Science and Engineering, 2018, 163,
185–198.
8. Ezeakacha C. P. and Salehi S., “Experimental
and Statistical Investigation of Drilling Fluid
Loss in Porous Media: Part 2 (Fractures),”
Journal of Natural Gas Science and Engineeing,
2019, 51, 257–266.
9. Caenn R. and Chillingar G. V., “Drilling Fluids
State of the Art,” Journal of Petroleum Science
and Engineering, 1996, 14, 221–230.
10. Song K., Wu Q., Li M., Wojtanowicz A.
K., and et al., “Performance of Low Solid
Bentonite Drilling Fluids Modified by Cellulose
Nanoparticles,” Journal of Natural Gas Science
and Engineering, 2016, 34, 1403-1411.
11. Abdo J. and Haneef M. D., “Clay nanoparticles
Modified Drilling Fluids for Drilling of Deep
Hydrocarbon Wells,” Applied Clay Science,
2013, 86, 76–82.
12. Abdo J., Zaier R., Hassan E., Al-sharji H., and
Al-shabibi A., “ZnO–clay Nanocomposites for
Enhance Drilling at HTHP Conditions,” 2014,
46, 970–974.
13. Heggset E. B., Chinga-carrasco G., and Syverud
K., “Temperature Stability of Nanocellulose
Dispersions. Carbohydr Polymer,” 2017, 157,
114–121.
14. Johann P. P., “Water-Based Muds Using Synthetic
Polymers Developed For High-Temperature

Performance of Carboxymethyl Cellulose Produced from Cocoa Pod Husk... Journal of Petroleum Science and Technology
http://jpst.ripi.ir37
Journal of Petroleum Science and Technology 2019, 9(4), 22-38© 2019 Research Institute of Petroleum Industry (RIPI)
Drilling,” Oil Gas Journal, 1992, 90, 40–45.
15. Pushpamalar V., Langford S. J., Ahmad M., and
Lim Y. Y., “Optimization of Reaction Conditions
for Preparing Carboxymethyl Cellulose from
Sago Waste,” 2006, 64, 312–318.
16. Azizi A., Shahrul M., Ibrahim N., and et
al., “Agarwood Waste as A New Fluid Loss
Control Agent in Water-based Drilling Fluid,”
International Journal of Science and Engineering,
2013, 5, 101–105.
17. Ghazali N. A., Alias N. H., Mohd T. A. T., and
Noorsuhana M. Y., “Potential of Corn Starch
as Fluid Loss Control Agent in Drilling Mud,”
Applied Mechanics and Materials, 2015, 754,
682-687.
18. Alsabagh A. M., Abdou M. I., Ahmed H. E. S.,
Khalil A. A. S., and et al., “Evaluation of Some
Natural Water-insoluble Cellulosic Material as
Lost Circulation Control Additives in Water-
Based Drilling Fluid,” Egyptian Journal of
Petroleum, 2015, 24, 461–468.
19. Kafashi S., Rasaei M., and Karimi G., “Effects
of Sugarcane and Polyanionic Cellulose on
Rheological Properties of Drilling Mud: An
Experimental Approach,” Egyptian Journal of
Petroleum, 2017, 26, 371–374.
20. Onuh C. Y., Igwilo K. C., Anawe P. A. L., Olakunle
D., and Omotoke O., “Environmentally Friendly
Fluid loss Control Agent in Water-Based Mud for
Oil and Gas Drilling Operations,” International
Journal of Applied Engineering Research, 2017,
12, 1520-1523.
21. Haider S., Zine M., Boureghda M., Aknouche H.,
Akkouche A., and Hammadi L., “An Ecological
Water-based Drilling Mud (WBM) with Low
Cost: Substitution of Polymers by Wood
Wastes,” Journal of Petroleum Exploration and
Production Technology, 2018, 9(1), 307-313.
22. Hutomo G. S., Marseno D. W., and Anggrahini
S., “Synthesis and Characterization of Sodium
Carboxymethylcellulose from Pod Husk of
Cacao (Theobroma cacao L .),” African Journal
of Food Science, 2012, 6(6), 180-185.
23. Thomas D. C., “Thermal Stability of Starch-
and Carboxymethyl Cellulose-Based Polymers
Used in Drilling Fluids,” Society of Petroleum
Engineers, 1982.
24. Drilling Fluids–Specifications and Testing (18th
ed.), American Petroleum Institute, API 13B-1,
2010, 1-22.
25. Dick M. A., Heinz T. J., Svoboda C. F., and Aston
M., “Optimizing the Selection of Bridging
Particles for Reservoir Drilling Fluids,” Society
of Petroleum Engineers, 2000.
26. Bourgoyne A. T., Millheim K. K., Chenevert
M. E., and et al., “Applied Drilling Engineering
Chapter 8 Solutions,” Society of Petroleum
Engineers, 1986.
27. Coates J., “Interpretation of Infrared Spectra, A
Practical Approach (Meyers ed.),” Encyclopedia
of Analytical Chemistry, John Wiley and Sons
Ltd., 2000, 10815–10837.
28. Bakri M. K. and Jayamani E., “Comparative
Study of Functional Groups In Natural Fibers:
Fourier Transform Infrared Analysis (FTIR),”
International Conference on Futuristic Trends in
Engineering, Science, Humanities, and Technology
(FTESHT-16), 2016.
29. Bourgoyne A. T., Millheim K. K., Chenevert M.
E., and Young F. S., “Applied Drilling Engineering
Chapter 8 Solutions,” Society of Petroleum
Engineers, 1986.

W. N. Aggrey, et alJournal of PetroleumScience and Technology
Journal of Petroleum Science and Technology 2019, 9(4), 22-38© 2019 Research Institute of Petroleum Industry (RIPI) 38
http://jpst.ripi.ir
30. Coates J., “Interpretation of Infrared Spectra, A
Practical Approach (Meyers ed.),” Encyclopedia
of Analytical Chemistry, John Wiley and Sons
Ltd., 2000, 10815–10837.
31. Bakri M. K. and Jayamani E., “Comparative
Study Of Functional Groups In Natural Fibers:
Fourier Transform Infrared Analysis (FTIR),”
International Conference on Futuristic Trends
in Engineering, Science, Humanities, and
Technology (FTESHT-16), 2016.
32. He W., and Stephens M. P., “Bridging Particle
Size Distribution in Drilling Fluid and Formation
Damage,” Society of Petroleum Engineers, 2011.
33. Asuquo E. D. and Martin A. D., “Sorption
of Cadmium (II) Ion from Aqueous Solution
onto Sweet Potato (Ipomoea batatas L.)
Peel Adsorbent: Characterisation, Kinetic and
Isotherm Studies,” Journal of Environmental
Chemistry and Engineering, 2016, 4, 4207–4228.
34. Titiloye J. O., Bakar M. S. A., and Odetoye
T. E., “Thermochemical Characterisation of
Agricultural Wastes from West Africa,” Industrial
Crops Production, 2013, 47, 199–203.


