Pernice, F., De Carvalho, N., & Hallett, S. (2017). Prediction of delaminationmigration at a 0°/ ply interface in composite tape laminates. In 31st AnnualTechnical Conference of the American Society for Composites 2016:Proceedings of a meeting held 19-22 September 2016, Williamsburg,Virginia, USA. Held with the Annual ASTM Committee D30 Meeting (Vol.1, pp. 352-367). [1704] DEStech Publications, Inc..
Peer reviewed version
Link to publication record in Explore Bristol ResearchPDF-document
This is the author accepted manuscript (AAM). The final published version (version of record) is available onlinevia American Society for Composites at http://dpi-proceedings.com/index.php/asc31/article/view/3094. Pleaserefer to any applicable terms of use of the publisher.
University of Bristol - Explore Bristol ResearchGeneral rights
This document is made available in accordance with publisher policies. Please cite only the publishedversion using the reference above. Full terms of use are available:http://www.bristol.ac.uk/pure/about/ebr-terms
COVER SHEET
Paper Number: 1704
Title: Prediction of delamination migration at a 0/ ply interface in composite
tape laminates
Authors: M. Francesca Pernice
Nelson V. De Carvalho
Stephen R. Hallett
ABSTRACT
Delamination in composite laminates can migrate through the thickness, from
one interface to another. The “Delamination Migration” test method allows a detailed
observation of migration, and the evaluation of the parameters affecting it.
Delamination migration tests conducted on specimens containing a 0/ interface
demonstrated that migration is governed by the sign of the component of interlaminar
shear stress perpendicular to the fiber direction, 23. At a 0/ interface, when the
shear stress sign is favorable for migration, delamination tends to propagate along the
fiber direction, before migrating through the -oriented ply. The conditions at the
0/ interface, which determine either delamination growth along the fiber direction
or migration, were evaluated using the Virtual Crack Closure Technique (VCCT). The
strain energy release rates in the direction of the fibers, Gf, and perpendicular to the
fibers, Gm, were calculated, along with the total strain energy release rate, GT. The
components Gf and Gm were then used with the shear stress sign, to account for the
effect of both parameters on delamination growth and migration. Correlation with
experimental results for 0/60 delamination migration specimens showed that if the
sign of 23 is favorable for migration but Gf/GT is greater than Gm/GT, delamination
tends to propagate along the fiber direction and migration will not occur.
Delamination can migrate only if Gf/GT is less than Gm/GT. This method improves the
prediction of migration in the delamination migration specimen, compared to the
analysis using the shear stress sign only.
_____________
M. Francesca Pernice, Advanced Composites Centre for Innovation and Science (ACCIS), University of Bristol, Queen’s Building, University Walk, BS8 1TR, Bristol, U. K. Nelson V. De Carvalho, National Institute of Aerospace, resident at: Durability, Damage Tolerance and Reliability Branch, NASA Langley Research Center, Hampton, VA 23681-2199, U.S.A. Stephen R. Hallett, Advanced Composites Centre for Innovation and Science (ACCIS), University of Bristol, Queen’s Building, University Walk, BS8 1TR, Bristol, U. K.

INTRODUCTION
Delamination in composite laminates often propagates at interfaces between
plies with dissimilar fiber orientation and can migrate through the thickness of the
laminate from one ply interface to another, by means of an intralaminar crack.
Delamination migration is commonly observed in laminates subject to low-velocity
impact damage [1, 2] or at structural singularities such as skin/stiffener joints [3] and
open holes [4]. Under both static and fatigue loading conditions, delamination
migration can cause the propagation of damage through the thickness of a laminate,
potentially leading to the global failure of a composite structure. A number of
experimental studies have focused on delamination migration, in order to gain a better
understanding of this damage mechanism [5-8].
Delamination migration is governed by the sign of the interlaminar shear stress
at the delamination front [5, 7]. Delamination growth and migration result from the
coalescence of microcracks at the delamination front. The microcracks are
perpendicular to the resolved tensile stress produced by shearing of adjacent plies, and
angled at 45º with respect to the interface [9, 10]. For a given delamination growth
direction, the microcracks are oriented towards one of the plies at the interface,
depending on the shear stress sign (Figure 1). The resulting delamination tends to
propagate close to or through the thickness of that ply. If the fiber direction in the ply
is aligned with the delamination growth direction (as in Figure 1a), then the
intralaminar fracture is prevented, since propagation of a crack through the ply
thickness would break the fibers. Delamination thus stays at the interface and
propagates along the fiber direction, as demonstrated experimentally in [6, 7, 11].
Conversely, if the fiber direction in the ply towards which delamination is driven is
angled with respect to the direction of shear, then the fibers do not prevent propagation
of delamination through the ply (Figure 1b), and migration becomes possible [5, 7].
This process was demonstrated experimentally at a 0º/90º interface using the
Delamination Migration test in [7]. The delamination migration test is designed on the
assumption that delamination propagation and migration are governed by the sign of
the interlaminar shear stress, as in [5]. The resulting experiment allows the isolation of
one single migration event at a 0/90 interface and the observation of the mechanism
by which delamination turns out (or “kinks out”) of the interface and migrates to the
next interface.
Figure 1. Effect of shear stress sign at the delamination front on the orientation of microcracks and the
subsequent delamination growth and migration.
(a) (b)
+
23
23
Resolvedtensile stress-
23
23
Resolvedtensile stress
Delamination growth direction Delamination growth direction
Microcrack Microcrack
23
[0°]
[0°]
[ 4]
interface[0°]
[0°]
[ 4]
interface
23
In [8], the delamination migration test was used to observe migration at a 0º/
interface (with = 60º, 75º). It was found that at a 0º/ interface, the component of
shear stress governing delamination migration is the component perpendicular to the
fiber direction, 23. When the sign of 23 at a 0º/ interface drives delamination
towards the upper ply, delamination propagates close to the ply and migration is
favored. Delamination tended to propagate along the fiber direction in the upper
bounding ply, or delamination kinked out of the interface into the ply and the kinked
cracks propagated along the fiber direction, before migration was completed. The
study concluded that the favorable shear stress sign is a condition necessary for
delamination migration at a 0º/ ply interface, but it is not sufficient [8].
The work presented here is based on the experimental results reported in [8]
and investigates the conditions at the delamination front at the 0º/ interface which
determine whether delamination propagates at the interface along the fiber direction
or migrates through the thickness of the -oriented ply. The Virtual Crack Closure
Technique (VCCT) [12, 13] was employed to calculate the strain energy release rates
at the delamination front in the 0º/60 specimens. Similar to the 23 component of
shear stress used in [8], strain energy release rates were then evaluated to determine
propensity for delamination to propagate at the interface or migrate, in terms of the
components of strain energy release rate aligned with the fiber coordinate system.
The propensity for delamination to either propagate at the initial interface along the
fiber direction or migrate was evaluated by a parameter which combines the effect of
the fiber-aligned strain energy release rates and the effect of the sign of the
interlaminar shear stress, 23.
SUMMARY OF EXPERIMENTAL RESULTS
This work uses experimental results obtained in [8], in which delamination
migration tests were performed on specimens containing a 0/ interface. The
Delamination Migration test [7] is briefly described here, followed by a summary of
the main results presented in [8], before the analytical method used here is explained.
The Delamination Migration Test
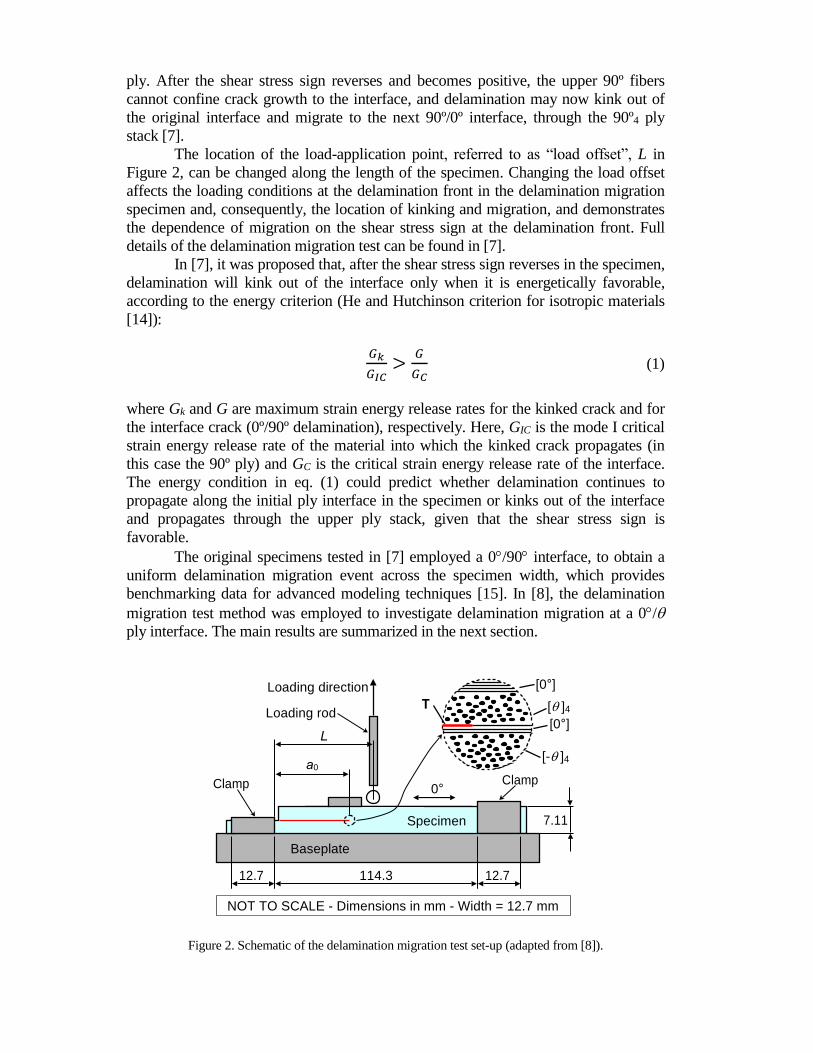
The Delamination Migration test [7] is designed to isolate and investigate in
detail delamination migration. A schematic representation of the delamination
migration specimen in the test fixture is displayed in Figure 2. The test employs a
beam-type specimen containing a 12.7-m-thick polytetrafluoroethylene (PTFE) film
insert (“T”) at one end in a 0º/T/90º4/0º sequence (ordered from the bottom to the top
surface of the specimen), to create an artificial delamination, a0, Figure 2. The test
configuration allows for a reversal in the interlaminar shear stress sign during the test,
starting from a “negative” sign, which drives delamination towards the lower 0º ply at
the 0º/90º interface (as in Figure 1a), to a “positive” sign, which drives delamination
towards the upper 90º ply at the 0º/90º interface (as in Figure 1b). This shear stress
sign reversal, together with the specific 0º/T/90º4/0º ply stack in the specimen, results
in delamination growth from the PTFE insert front at the beginning of the test
(negative shear stress sign), where the lower 0º fibers prevent migration through the
ply. After the shear stress sign reverses and becomes positive, the upper 90º fibers
cannot confine crack growth to the interface, and delamination may now kink out of
the original interface and migrate to the next 90º/0º interface, through the 90º4 ply
stack [7].
The location of the load-application point, referred to as “load offset”, L in
Figure 2, can be changed along the length of the specimen. Changing the load offset
affects the loading conditions at the delamination front in the delamination migration
specimen and, consequently, the location of kinking and migration, and demonstrates
the dependence of migration on the shear stress sign at the delamination front. Full
details of the delamination migration test can be found in [7].
In [7], it was proposed that, after the shear stress sign reverses in the specimen,
delamination will kink out of the interface only when it is energetically favorable,
according to the energy criterion (He and Hutchinson criterion for isotropic materials
[14]):
𝐺𝑘
𝐺𝐼𝐶>
𝐺
𝐺𝐶 (1)
where Gk and G are maximum strain energy release rates for the kinked crack and for
the interface crack (0º/90º delamination), respectively. Here, GIC is the mode I critical
strain energy release rate of the material into which the kinked crack propagates (in
this case the 90º ply) and GC is the critical strain energy release rate of the interface.
The energy condition in eq. (1) could predict whether delamination continues to
propagate along the initial ply interface in the specimen or kinks out of the interface
and propagates through the upper ply stack, given that the shear stress sign is
favorable.
The original specimens tested in [7] employed a 0/90 interface, to obtain a
uniform delamination migration event across the specimen width, which provides
benchmarking data for advanced modeling techniques [15]. In [8], the delamination
migration test method was employed to investigate delamination migration at a 0/
ply interface. The main results are summarized in the next section.
Figure 2. Schematic of the delamination migration test set-up (adapted from [8]).
ClampClamp
Specimen
Baseplate
114.3
a0
12.7
L
Loading direction
0°
12.7
7.11
NOT TO SCALE - Dimensions in mm - Width = 12.7 mm
Loading rod[ ]4
[0°]
[- ]4
[0°]
T

Delamination Migration at a 0/60 Ply Interface
In [8], delamination migration tests were performed on specimens containing a
0/ interface. The specimen stacking sequence was designed in order to contain the
0º/T/4/0º ply stack required for the test and minimize coupling effects. The 56-ply
stacking sequence for the 0º/ specimens was (from the bottom to the top surface of
the specimen): [/ 0º/ 3/ -4/ -/ -/ -/ 90º/ -/ / 90º/ / / / 4/-4/ 0º/ T/ 4/ 0º/
-4/ -/ -/ -/ 90º/ -/ / 90º/ / / / 4/ 0º/ -4], where = {60º, 75º}, = (90º - )
and “T” indicates the location of the PTFE film insert. Specimen dimensions are
shown in Figure 2. The initial artificial delamination length, a0, was 53 mm.
Specimens were made from IM7/8552 carbon fiber epoxy tape. Tests were run at
different values of load offset, L. Details of the experimental tests and evaluation of
the shear stress sign can be found in [8]. Results obtained for load offset L = a0 in
specimens containing a 0/60 ply interface are briefly summarized here.
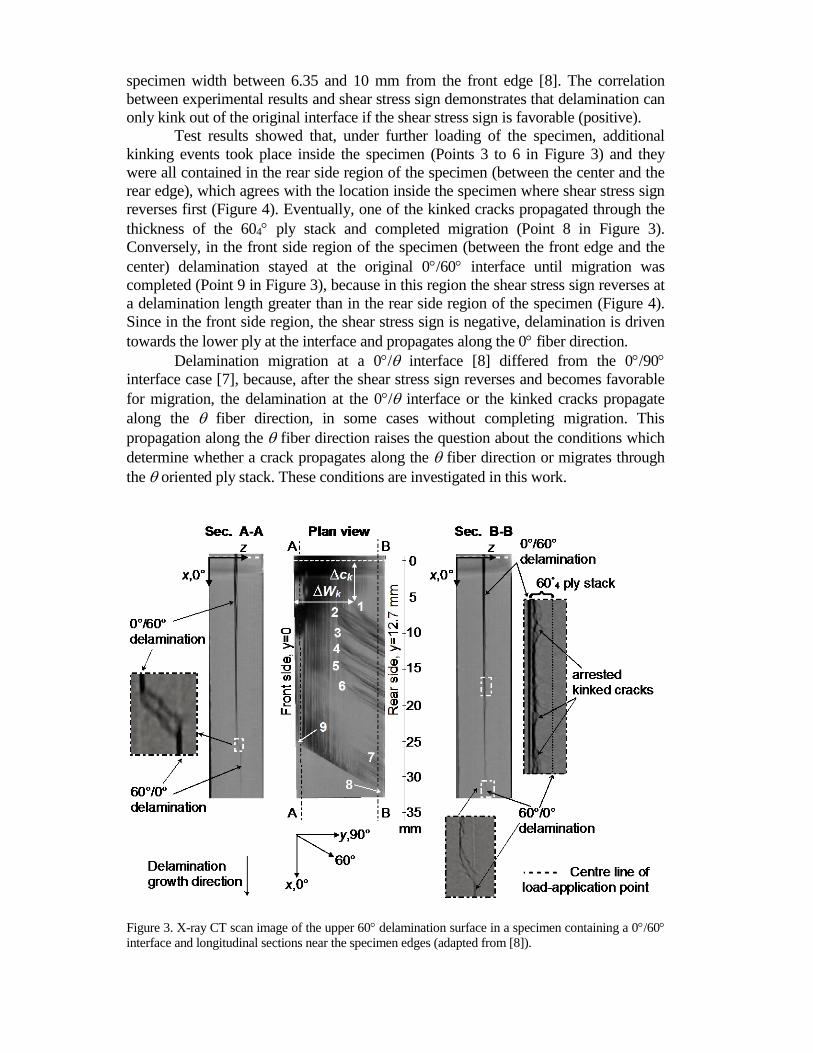
Figure 3 shows an X-ray Computed Tomography (CT scan) image of the
upper 60 delamination surface of a specimen after testing, together with two
longitudinal sections close to the specimen edges. The damage sequence was obtained
by incremental tests, performed by partially loading the specimen and then inspecting
it by X-ray CT scan before continuing the test. Specimen edges were denoted as
“front” and “rear” edge, as shown in Figure 3. Results showed that delamination
kinked out of the 0º/60 interface at several locations inside the specimen (Points 1
and 2 in Figure 3), although these kinking events were not visible on the specimen
edges. At these points, delamination propagated close to the upper 60 ply at the
interface and kinked through it, without completing migration, as displayed by the
detail of the arrested kinked cracks in Sec. B-B in Figure 3. Under further loading of
the specimen, the 0/60 delamination or the kinked cracks propagate along the 60
fiber direction, towards the rear edge of the specimen.
Using linear elastic finite element analysis, a correlation was found between
the location inside the specimen where kinking started (Points 1 and 2 in Figure 3) and
the location of reversal of the sign of the shear stress component, 23. Analyses at
increasing delamination lengths showed that the shear stress component, 23, varies
across the width of the specimen at a 0/60 interface and, consequently, the shear
stress sign reversal is not uniform across the specimen width. Figure 4 shows the
variation of 23 across the width of the specimen, from the front edge (y = 0) to the rear
edge (y = 12.7 mm), at different delamination lengths, c (values are normalized by
absolute value of the 23 obtained in the center of the specimen, 23,c, as shown in
the figure). At the beginning of the test, the shear stress sign is negative across the
entire width of the specimen (driving delamination towards the lower 0 ply), in
agreement with the experimental observation that delamination propagated at the
original 0/60 interface, starting from the PTFE insert front. The observed location of
initiation of kinking corresponded to the region across the specimen width and the
delamination length at which the shear stress sign reverses first. In particular, the
initiation of kinking (Points 1 and 2 in Figure 3) took place at a distance Wk from the
front edge of the specimen ranging between 7 and 11 mm and a delamination length
ck between 4 and 11 mm, in all the specimens tested [8]. Finite element analyses
showed that the shear stress sign reverses (and becomes positive and, therefore,
favorable for migration) at a delamination length of 5 mm and a location across the
specimen width between 6.35 and 10 mm from the front edge [8]. The correlation
between experimental results and shear stress sign demonstrates that delamination can
only kink out of the original interface if the shear stress sign is favorable (positive).
Test results showed that, under further loading of the specimen, additional
kinking events took place inside the specimen (Points 3 to 6 in Figure 3) and they
were all contained in the rear side region of the specimen (between the center and the
rear edge), which agrees with the location inside the specimen where shear stress sign
reverses first (Figure 4). Eventually, one of the kinked cracks propagated through the
thickness of the 604 ply stack and completed migration (Point 8 in Figure 3).
Conversely, in the front side region of the specimen (between the front edge and the
center) delamination stayed at the original 0/60 interface until migration was
completed (Point 9 in Figure 3), because in this region the shear stress sign reverses at
a delamination length greater than in the rear side region of the specimen (Figure 4).
Since in the front side region, the shear stress sign is negative, delamination is driven
towards the lower ply at the interface and propagates along the 0 fiber direction.
Delamination migration at a 0/ interface [8] differed from the 0/90
interface case [7], because, after the shear stress sign reverses and becomes favorable
for migration, the delamination at the 0/ interface or the kinked cracks propagate
along the fiber direction, in some cases without completing migration. This
propagation along the fiber direction raises the question about the conditions which
determine whether a crack propagates along the fiber direction or migrates through
the oriented ply stack. These conditions are investigated in this work.
Figure 3. X-ray CT scan image of the upper 60 delamination surface in a specimen containing a 0/60
interface and longitudinal sections near the specimen edges (adapted from [8]).
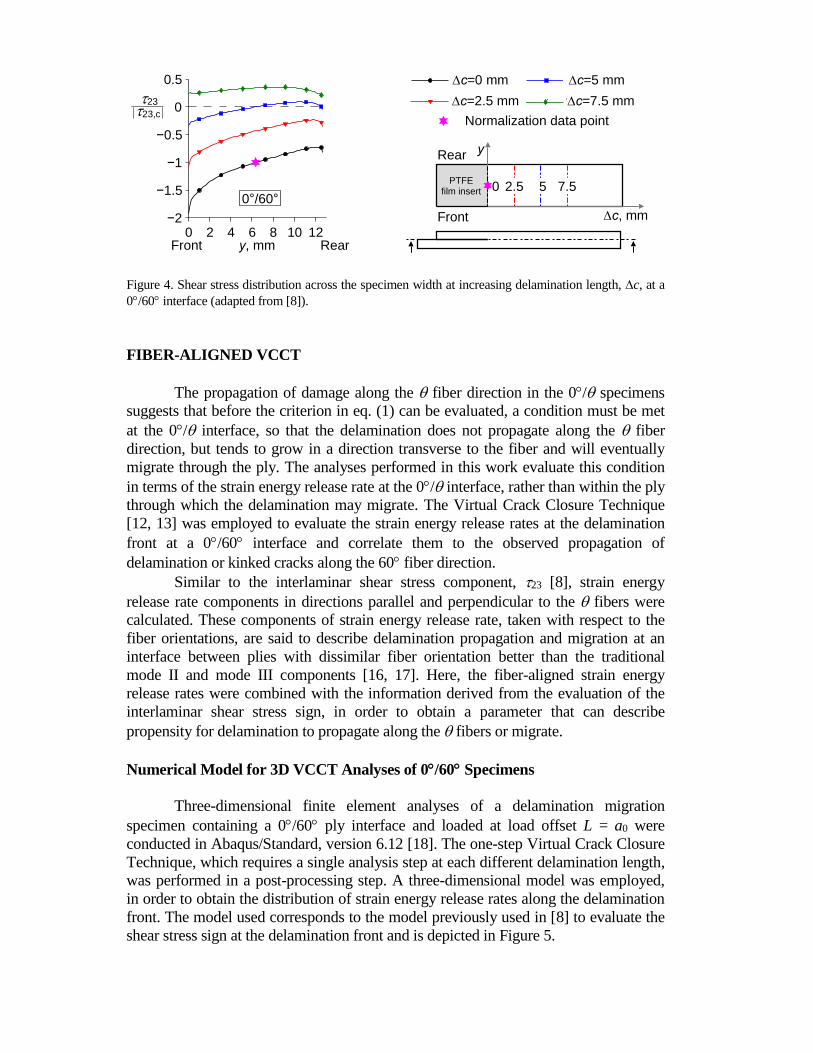
Figure 4. Shear stress distribution across the specimen width at increasing delamination length, c, at a
0/60 interface (adapted from [8]).
FIBER-ALIGNED VCCT
The propagation of damage along the fiber direction in the 0/ specimens
suggests that before the criterion in eq. (1) can be evaluated, a condition must be met
at the 0/ interface, so that the delamination does not propagate along the fiber
direction, but tends to grow in a direction transverse to the fiber and will eventually
migrate through the ply. The analyses performed in this work evaluate this condition
in terms of the strain energy release rate at the 0/ interface, rather than within the ply
through which the delamination may migrate. The Virtual Crack Closure Technique
[12, 13] was employed to evaluate the strain energy release rates at the delamination
front at a 0/60 interface and correlate them to the observed propagation of
delamination or kinked cracks along the 60 fiber direction.
Similar to the interlaminar shear stress component, 23 [8], strain energy
release rate components in directions parallel and perpendicular to the fibers were
calculated. These components of strain energy release rate, taken with respect to the
fiber orientations, are said to describe delamination propagation and migration at an
interface between plies with dissimilar fiber orientation better than the traditional
mode II and mode III components [16, 17]. Here, the fiber-aligned strain energy
release rates were combined with the information derived from the evaluation of the
interlaminar shear stress sign, in order to obtain a parameter that can describe
propensity for delamination to propagate along the fibers or migrate.
Numerical Model for 3D VCCT Analyses of 0/60 Specimens
Three-dimensional finite element analyses of a delamination migration
specimen containing a 0/60 ply interface and loaded at load offset L = a0 were
conducted in Abaqus/Standard, version 6.12 [18]. The one-step Virtual Crack Closure
Technique, which requires a single analysis step at each different delamination length,
was performed in a post-processing step. A three-dimensional model was employed,
in order to obtain the distribution of strain energy release rates along the delamination
front. The model used corresponds to the model previously used in [8] to evaluate the
shear stress sign at the delamination front and is depicted in Figure 5.
c, mm
PTFEfilm insert
Rear y
7.50 2.5 5
0 2 4 6 8 10 12−2
−1.5
−1
−0.5
0
0.5
Front0 2 4 6 8 10 12
−2
−1.5
−1
−0.5
0
0.5
data1
data2
data3
data4
0 2 4 6 8 10 12−2
−1.5
−1
−0.5
0
0.5
c=0 mm
0 2 4 6 8 10 12−2
−1.5
−1
−0.5
0
0.5
data1
data2
data3
data4
0 2 4 6 8 10 12−2
−1.5
−1
−0.5
0
0.5
c=5 mm
c=7.5 mm
0 2 4 6 8 10 12−2
−1.5
−1
−0.5
0
0.5
0 2 4 6 8 10 12−2
−1.5
−1
−0.5
0
0.5
data1
data2
data3
data4
024681012−2
−1.5
−1
−0.5
0
0.5
0 2 4 6 8 10 12−2
−1.5
−1
−0.5
0
0.5
data1
data2
data3
data4
0 2 4 6 8 10 12−2
−1.5
−1
−0.5
0
0.5
data1
data2
data3
data4
0 2 4 6 8 10 12−2
−1.5
−1
−0.5
0
0.5
c=2.5 mm
0 2 4 6 8 10 12−2
−1.5
−1
−0.5
0
0.5
Normalization data point
y, mmFront Rear
23
23,c
0°/60°

Figure 5. Finite element model of the 0/60 delamination migration specimen [8].
TABLE I. Material properties for IM7/8552 [19].
E11 E22 E33 12 13 23 G12 G13 G23
GPa GPa GPa GPa GPa GPa
161.0 11.38 11.38 0.32 0.32 0.436 5.17 5.17 3.98
The specimen model had a total length of 139.7 mm and width of 12.7 mm.
One layer of eight-node brick elements (Abaqus type C3D8) was used for each ply,
assuming a ply thickness of 0.127 mm. Element size was kept constant along the
specimen length but it was refined along the specimen width, to account for possible
edge effects. The orthotropic material properties of IM7/8552 carbon/epoxy tape
reported in Table I [19] were assigned in the model. The clamped boundary conditions
on the specimen in the delamination migration test fixture were idealized by clamping
a 12.7-mm-long portion of the specimen on both ends.
Load was applied as a fixed vertical displacement equal to 1 mm. A straight
delamination front was assumed, in agreement with the shape of the delamination
front observed during incremental tests in [8]. Increasing delamination lengths were
modeled, in order to evaluate the effect of strain energy release rate on delamination
growth and migration as delamination length increases during the test. Analyses were
performed at a delamination length equal to the initial artificial delamination, a0, and
then at fixed delamination lengths increased by c = {2.5, 5, 7.5, 10, 12.5, 15} mm
(Figure 5). The initial artificial delamination was modeled by coincident nodes in the
region of the specimen containing the PTFE film insert. The intact portion of the
specimen was modeled by applying multipoint constraints to the nodes at the 0/60
interface, in the region ahead of the delamination front. The multipoint constraints
were successively removed to increase the delamination length in a series of analyses,
as c increases.
NOT TO SCALE - Dimensions in mmDelamination frontPTFE insert front
Delaminationgrowth direction
Front side, y = 0
Rear side, y = 12.7 mm
23
xz
c
Constraints on surfacenodes: u=v=w=0
12
x,0°
y
z
7.11
12.7
12.712.7 114.3
Constraints on surfacenodes: u=v=w=0
a0
z,3
a
x
L=a0
Applied verticaldisplacement = 1 mm
y
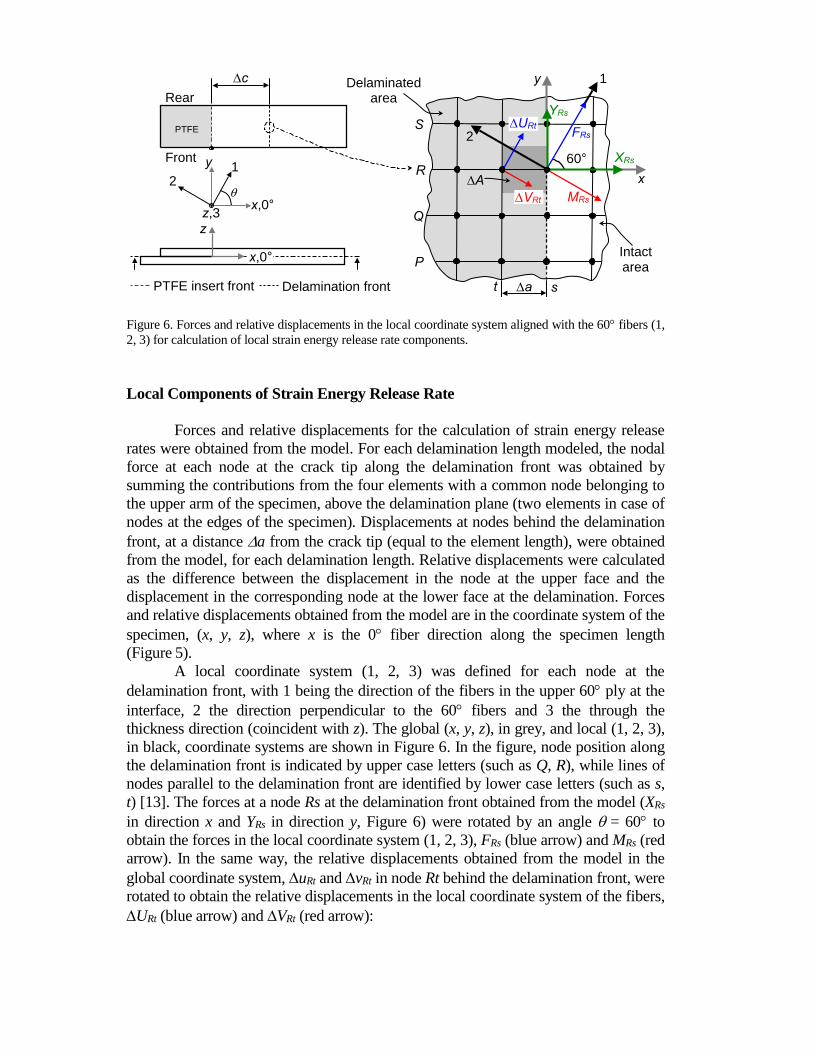
Figure 6. Forces and relative displacements in the local coordinate system aligned with the 60 fibers (1,
2, 3) for calculation of local strain energy release rate components.
Local Components of Strain Energy Release Rate
Forces and relative displacements for the calculation of strain energy release
rates were obtained from the model. For each delamination length modeled, the nodal
force at each node at the crack tip along the delamination front was obtained by
summing the contributions from the four elements with a common node belonging to
the upper arm of the specimen, above the delamination plane (two elements in case of
nodes at the edges of the specimen). Displacements at nodes behind the delamination
front, at a distance a from the crack tip (equal to the element length), were obtained
from the model, for each delamination length. Relative displacements were calculated
as the difference between the displacement in the node at the upper face and the
displacement in the corresponding node at the lower face at the delamination. Forces
and relative displacements obtained from the model are in the coordinate system of the
specimen, (x, y, z), where x is the 0 fiber direction along the specimen length
(Figure 5).
A local coordinate system (1, 2, 3) was defined for each node at the
delamination front, with 1 being the direction of the fibers in the upper 60 ply at the
interface, 2 the direction perpendicular to the 60 fibers and 3 the through the
thickness direction (coincident with z). The global (x, y, z), in grey, and local (1, 2, 3),
in black, coordinate systems are shown in Figure 6. In the figure, node position along
the delamination front is indicated by upper case letters (such as Q, R), while lines of
nodes parallel to the delamination front are identified by lower case letters (such as s,
t) [13]. The forces at a node Rs at the delamination front obtained from the model (XRs
in direction x and YRs in direction y, Figure 6) were rotated by an angle = 60 to
obtain the forces in the local coordinate system (1, 2, 3), FRs (blue arrow) and MRs (red
arrow). In the same way, the relative displacements obtained from the model in the
global coordinate system, uRt and vRt in node Rt behind the delamination front, were
rotated to obtain the relative displacements in the local coordinate system of the fibers,
URt (blue arrow) and VRt (red arrow):
Rx
y
st
Q
P
a
S URt
Delamination frontPTFE insert front
PTFE
Front
Rear
c 1
2
MRs
FRs
VRt
A1
2
x,0°
y
z,3
z
x,0°
XRs
YRs
Intactarea
Delaminatedarea
60°

(𝐹𝑅𝑠
𝑀𝑅𝑠) = [
cos 𝜃 sin 𝜃− sin 𝜃 cos 𝜃
] (𝑋𝑅𝑠
𝑌𝑅𝑠), (
∆𝑈𝑅𝑡
∆𝑉𝑅𝑡) = [
cos 𝜃 sin 𝜃− sin 𝜃 cos 𝜃
] (∆𝑢𝑅𝑡
∆𝑣𝑅𝑡) (2)
where is the fiber angle in the ply where strain energy release rates need to be
calculated.
The local forces and relative displacements obtained by eqs. (2) were used to
calculate the fiber-aligned component of strain energy release rate. Strain energy
release rates in the fiber direction, Gf, and perpendicular to the fiber direction (or
“matrix” direction in a ply), Gm, were calculated. The component Gf along the fiber
direction is related to delamination growth along the fibers, while the component Gm is
thought to be related to delamination migration, similar to the shear stress component,
23. The mode I component, GI, in the direction of the laminate thickness was also
calculated, to obtain the total strain energy release rate GT = GI + Gf + Gm. The local
component of strain energy release rate along the fiber direction, Gf, in a node Rs at
the delamination front is given by the component of force in fiber direction, FRs, in the
same node Rs, and the component of relative displacement in fiber direction, URt, in
node Rt behind the delamination front (as shown in Figure 6). Similarly, the local
component of strain energy release rate in the direction perpendicular to the fibers, Gm,
in a node Rs at the delamination front is given by the component of force in the
direction perpendicular to the fibers in node Rs, MRs, and the component of relative
displacement in the direction perpendicular to the fibers, VRt. The local strain energy
release rates were divided by the total strain energy release rate, GT, in order to
normalize the strain energy release rate, and allow comparison between strain energy
release rates at different delamination lengths. Using the notation in Figure 6, and
considering the force ZRs and relative displacement wRt in the opening direction, the
following quantities were calculated:
𝐺𝑓
𝐺𝑇=
𝐹𝑅𝑠∆𝑈𝑅𝑡
𝑍𝑅𝑠∆𝑤𝑅𝑡+𝐹𝑅𝑠∆𝑈𝑅𝑡+𝑀𝑅𝑠∆𝑉𝑅𝑡 (3)
𝐺𝑚
𝐺𝑇=
𝑀𝑅𝑠∆𝑉𝑅𝑡
𝑍𝑅𝑠∆𝑤𝑅𝑡+𝐹𝑅𝑠∆𝑈𝑅𝑡+𝑀𝑅𝑠∆𝑉𝑅𝑡 (4)
𝐺𝐼
𝐺𝑇=
𝑍𝑅𝑠∆𝑤𝑅𝑡
𝑍𝑅𝑠∆𝑤𝑅𝑡+𝐹𝑅𝑠∆𝑈𝑅𝑡+𝑀𝑅𝑠∆𝑉𝑅𝑡 (5)
Absolute values of forces and relative displacements were used for
calculations of the strain energy release rates. For each delamination length, c, strain
energy release rate components Gf and Gm were calculated with reference to the ply
towards which delamination is driven by the shear stress sign at that delamination
length (either 0 or ). A local coordinate system aligned to the fibers in the selected
ply was defined, and the local components of strain energy release rate, Gf and Gm,
were calculated. At the beginning of the test, for delamination lengths, c, such that
23 < 0, strain energy release rates were evaluated with reference to the lower 0
bounding ply at the interface. The 0 fiber direction coincides with the x-axis in the
finite element model of the delamination migration specimen and, consequently Gf is
equal to the mode II component. However, strain energy release rate components
aligned to the 0 fibers and perpendicular to the 0 fibers were calculated using eqs.
(3) and (4), respectively, assuming a fiber angle = 0 in eqs. (2), for consistency with
the strain energy release rates calculated with reference to the upper ply at the
interface. As delamination grows, the shear stress sign at the delamination front
reverses, and delamination is driven towards the upper ply at the interface. Therefore,
for delamination length, c, at which 23 > 0, strain energy release rates were
evaluated with reference to the upper bounding ply at the interface. Local strain energy
release rates were calculated for either the upper or the lower ply at the interface
(depending on the shear stress sign) in order to evaluate the effect of the local
components Gf and Gm on delamination growth and migration throughout the test,
from the onset at the PTFE insert front to migration.
Results obtained by the VCCT analyses (G/GT) were combined with the shear
stress sign to account for its effect on kinking and migration. A parameter, k, was
defined as follows:
𝑘𝑖 =𝐺𝑖
𝐺𝑇∗ sign(𝜏23) = {
−𝐺𝑖
𝐺𝑇, if 𝜏23 < 0
+𝐺𝑖
𝐺𝑇, if 𝜏23 ≥ 0
, i = (f, m) (6)
where the index i denotes the direction parallel or perpendicular to the fibers in the ply
towards which delamination is driven. The parameters kf and km account for the effect
of shear stress sign and strain energy release rates on delamination and are used in the
following section to evaluate propensity for delamination to propagate along the fiber
direction or to kink and migrate.
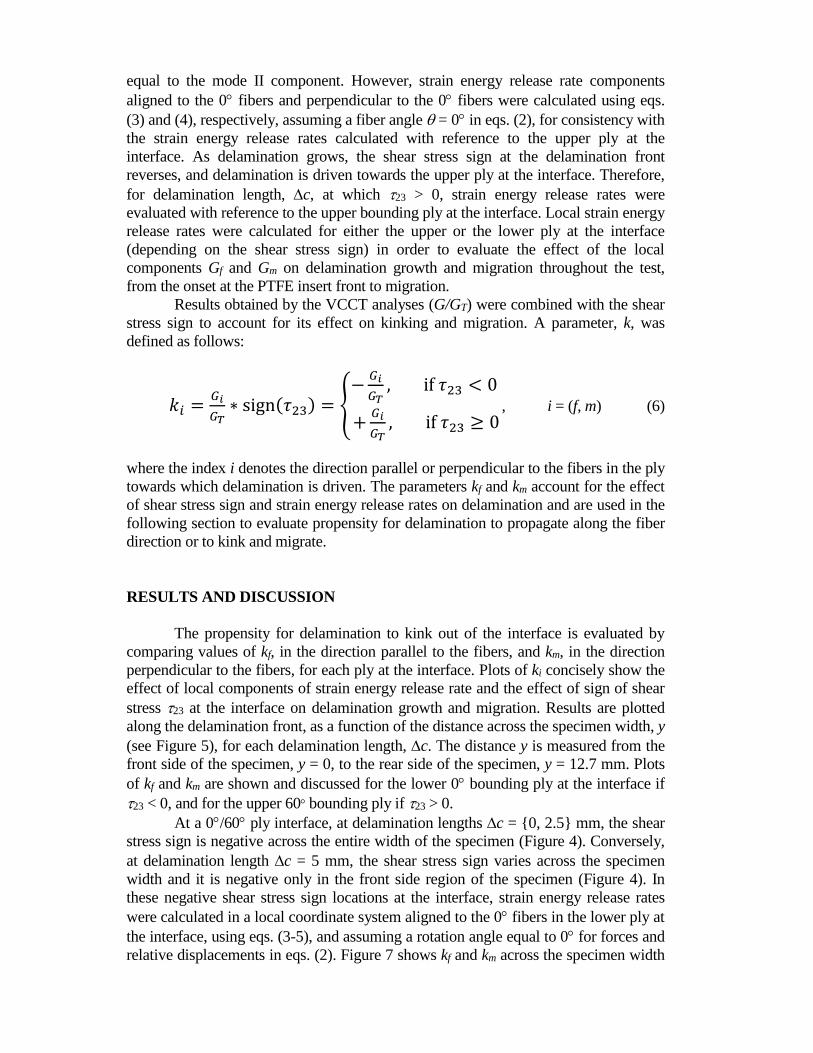
RESULTS AND DISCUSSION
The propensity for delamination to kink out of the interface is evaluated by
comparing values of kf, in the direction parallel to the fibers, and km, in the direction
perpendicular to the fibers, for each ply at the interface. Plots of ki concisely show the
effect of local components of strain energy release rate and the effect of sign of shear
stress 23 at the interface on delamination growth and migration. Results are plotted
along the delamination front, as a function of the distance across the specimen width, y
(see Figure 5), for each delamination length, c. The distance y is measured from the
front side of the specimen, y = 0, to the rear side of the specimen, y = 12.7 mm. Plots
of kf and km are shown and discussed for the lower 0 bounding ply at the interface if
23 < 0, and for the upper 60 bounding ply if 23 > 0.
At a 0/60 ply interface, at delamination lengths c = {0, 2.5} mm, the shear
stress sign is negative across the entire width of the specimen (Figure 4). Conversely,
at delamination length c = 5 mm, the shear stress sign varies across the specimen
width and it is negative only in the front side region of the specimen (Figure 4). In
these negative shear stress sign locations at the interface, strain energy release rates
were calculated in a local coordinate system aligned to the 0 fibers in the lower ply at
the interface, using eqs. (3-5), and assuming a rotation angle equal to 0 for forces and
relative displacements in eqs. (2). Figure 7 shows kf and km across the specimen width

for the lower 0 ply at a 0/60 interface, for delamination lengths c = {2.5, 5} mm.
At the onset from the PTFE insert front (c = 0 mm), results were similar to the case
c = 2.5 mm, and are omitted for brevity. Local directions of the strain energy release
rate components Gf and Gm in the 0 ply are illustrated in the sketch in the figure. For
delamination length c = 2.5 mm, the shear stress sign is negative across the entire
width of the specimen (Figure 4). Figure 7a shows that at c = 2.5 mm, the value of
the strain energy release rate component along the 0 fiber direction (given by the
magnitude of 𝑘𝑓,0°) is greater than the component perpendicular to the fibers:
|𝑘𝑓,0°| > |𝑘𝑚,0°| ⇔𝐺𝑓,0°
𝐺𝑇>
𝐺𝑚,0°
𝐺𝑇 (7)
indicating that delamination growth along the 0 fiber direction is favored. This result
is in agreement with the experimental observation that delamination onset from the
PTFE insert front propagates at the 0/60 interface, along the 0 fibers [8].
For delamination length c = 5 mm, in the front side region of the specimen
(at a distance from the front edge 0 ≤ 𝑦 ≤ 6.35 mm), the shear stress sign is negative
(Figure 4) and the strain energy release rate component perpendicular to the 0 fibers
direction (given by the magnitude of 𝑘𝑚,0°) is greater than the component along the 0
fiber direction (Figure 7b):
|𝑘𝑚,0°| > |𝑘𝑓,0°| ⇔𝐺𝑚,0°
𝐺𝑇>
𝐺𝑓,0°
𝐺𝑇 . (8)
This result indicates that propagation of delamination along the 0 fiber direction is no
longer favored, although the shear stress sign drives delamination towards the 0 ply.
For delamination length c = 5 mm, the shear stress sign is also negative on the
extreme rear edge of the specimen as shown in Figure 4. Figure 7b shows that the
strain energy release rate component along the 0 fiber direction at the rear edge is
greater than the component perpendicular to the fiber (eq. (7)), indicating that
delamination propagation along the 0 fiber direction is favored.
At a delamination length c = 5 mm, the shear stress sign changes from
negative to positive at slightly less than halfway from the front to the rear edge of the
specimen. For greater delamination lengths, it becomes positive across the entire width
of the specimen (Figure 4). In these cases, strain energy release rates were calculated
in a local coordinate system aligned to the 60 fiber direction in the upper ply at the
interface. Forces and relative displacements were calculated using eqs. (2) and
assuming a rotation angle equal to 60. The local directions of Gf and Gm in the 60
ply are illustrated in the sketch in Figure 8. In the figure, 𝑘𝑓,60° and 𝑘𝑚,60° are plotted
across the specimen width, at delamination lengths such that the shear stress sign is
positive.

Figure 7. Comparison between kf,0 and km,0 across the specimen width in the lower 0 ply at a 0/60
interface at different delamination lengths.
Figure 8. Comparison between kf,60 and km,60 across the specimen width in the upper 60 ply at a 0/60
interface at different delamination lengths.
0 2 4 6 8 10 12−0.04
−0.03
−0.02
−0.01
0
0 2 4 6 8 10 12−0.2
−0.15
−0.1
−0.05
0
PTFE
Front
Rear
c x,1
y,2
z,3
Gf,0°
z
y x
Gm,0°
y, mmFront Rear
kf
km
y, mmFront Rear
kf
km
c = 5 mmc = 2.5 mm (b)(a)
23<0, Lower bounding ply
km,0°
0 20 40 600
10
20
30
40
50
60
RII/|R
II,c|
RIII
/|RIII,c
|
kf,0°
0 20 40 600
10
20
30
40
50
60
RII/|R
II,c|
RIII
/|RIII,c
|Delamination front
PTFE insert front
PTFE
Front
Rear
c xz,3
z
y x
Gm,60°
Gf,60°
12
y
23>0, Upper bounding ply
km,60°
0 20 40 600
10
20
30
40
50
60
RII/|R
II,c|
RIII
/|RIII,c
| Delamination front
kf,60°
0 20 40 600
10
20
30
40
50
60
RII/|R
II,c|
RIII
/|RIII,c
|
PTFE insert front
0 2 4 6 8 10 120
0.05
0.1
0.15
0.2
0.25
y, mmFront Rear
kf
km
0 2 4 6 8 10 120
0.01
0.02
0.03
0.04
y, mmFront Rear
kf
km
0 2 4 6 8 10 120
0.005
0.01
0.015
y, mmFront Rear
kf
km
c = 7.5 mmc = 5 mm (b)(a)
c = 10 mm(c)

At delamination length c = 5 mm and at a distance from the front edge of the
specimen 6.35 ≤ 𝑦 ≤ 12.7 mm (rear side region of the specimen), the shear stress is
positive and tends to drive delamination towards the upper 60 ply at the interface
(Figure 4). This condition has been found to be necessary for migration [8]. However,
Figure 8a shows that the strain energy release rate component along the 60 fiber
direction (given by the magnitude of 𝑘𝑓,60°) is greater than the component
perpendicular to the fibers:
|𝑘𝑓,60°| > |𝑘𝑚,60°| ⇔𝐺𝑓,60°
𝐺𝑇>
𝐺𝑚,60°
𝐺𝑇 (9)
which indicates that it is energetically more favorable for delamination to propagate
along the 60 fiber direction in the upper ply at the interface, rather than kink into the
upper ply stack.
As delamination length increases, for c = 7.5 mm and greater, the strain
energy release rate component along the 60 fiber direction (given by the magnitude
of 𝑘𝑓,60°) becomes less than the component perpendicular to the fibers (given by the
magnitude of 𝑘𝑚,60°) (Figure 8b):
|𝑘𝑓,60°| < |𝑘𝑚,60°| ⇔𝐺𝑓,60°
𝐺𝑇<
𝐺𝑚,60°
𝐺𝑇 . (10)
In this condition, delamination growth along the 60 fiber direction is not energetically
favorable anymore, but delamination tends to propagate in the direction perpendicular
to the fibers and can kink into the upper ply stack, because of the greater value of Gm.
Figure 8c shows that, as delamination continues to grow, in a region close to
the rear edge of the specimens the strain energy release rate component along the 60
fiber direction becomes greater than the component perpendicular to the fibers, eq. (9).
This might explain why the kinked cracks were observed to turn back to the original
interface on the rear edge, without completing migration, although the propagation of
cracks through the specimen thickness is governed by conditions inside the upper ply
stack and not at the interface.
In summary, if the shear stress sign drives delamination towards the upper 60
ply at the 0/60 interface, and Gf is greater that Gm, delamination tends to propagate
along the 60 fiber direction and migration will not occur. The analysis of
delamination propagation and migration using both the sign of the shear stress
component, 23, and the local components of strain energy release rate, Gf and Gm, in
the fiber coordinate system, provides a better prediction of delamination growth and
migration at a 0/60 ply interface, compared to the evaluation of the shear stress sign
only. In Table II, the predictions of kinking obtained from the shear stress sign and
from the fiber-aligned strain energy release rates are compared to the measured
location of initiation of kinking in specimens tested in [8]. The fiber-aligned strain
energy release rates improve prediction, since they allow the distinction between
conditions at the interface which are favorable for kinking, and conditions favorable
for delamination growth along the fiber direction at a 0/60 interface.
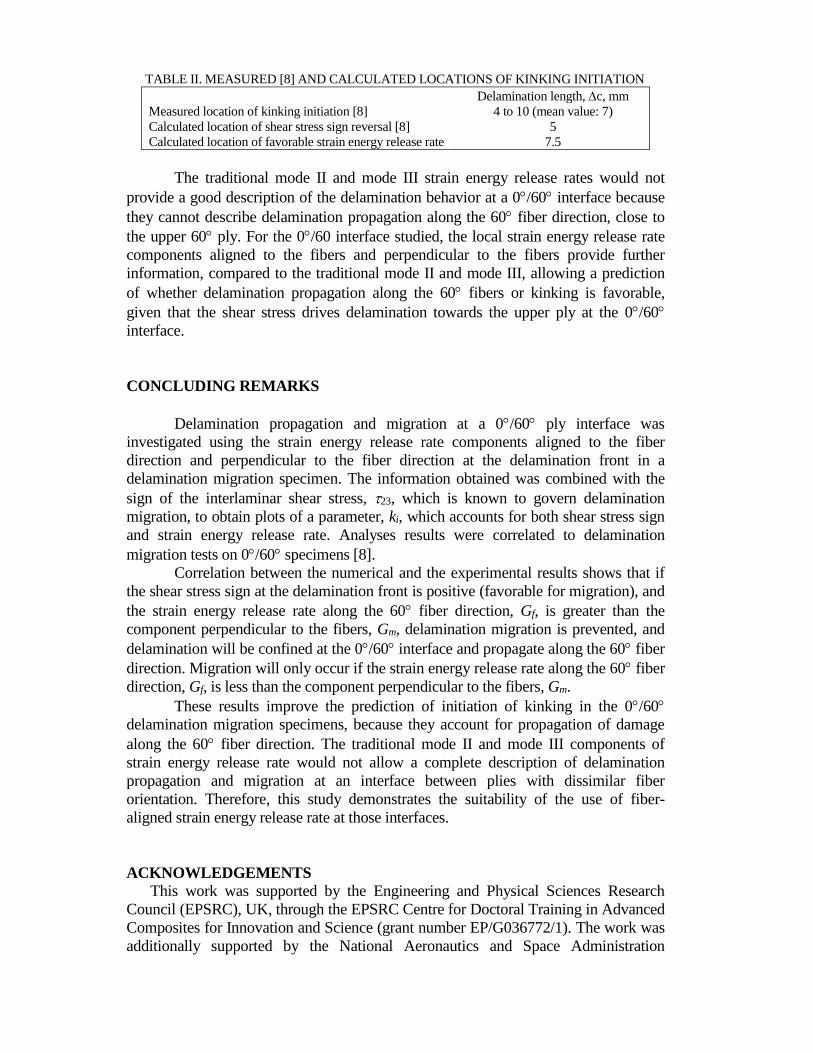
TABLE II. MEASURED [8] AND CALCULATED LOCATIONS OF KINKING INITIATION
Delamination length, c, mm
Measured location of kinking initiation [8] 4 to 10 (mean value: 7)
Calculated location of shear stress sign reversal [8] 5
Calculated location of favorable strain energy release rate 7.5
The traditional mode II and mode III strain energy release rates would not
provide a good description of the delamination behavior at a 0/60 interface because
they cannot describe delamination propagation along the 60 fiber direction, close to
the upper 60 ply. For the 0/60 interface studied, the local strain energy release rate
components aligned to the fibers and perpendicular to the fibers provide further
information, compared to the traditional mode II and mode III, allowing a prediction
of whether delamination propagation along the 60 fibers or kinking is favorable,
given that the shear stress drives delamination towards the upper ply at the 0/60
interface.
CONCLUDING REMARKS
Delamination propagation and migration at a 0/60 ply interface was
investigated using the strain energy release rate components aligned to the fiber
direction and perpendicular to the fiber direction at the delamination front in a
delamination migration specimen. The information obtained was combined with the
sign of the interlaminar shear stress, 23, which is known to govern delamination
migration, to obtain plots of a parameter, ki, which accounts for both shear stress sign
and strain energy release rate. Analyses results were correlated to delamination
migration tests on 0/60 specimens [8].
Correlation between the numerical and the experimental results shows that if
the shear stress sign at the delamination front is positive (favorable for migration), and
the strain energy release rate along the 60 fiber direction, Gf, is greater than the
component perpendicular to the fibers, Gm, delamination migration is prevented, and
delamination will be confined at the 0/60 interface and propagate along the 60 fiber
direction. Migration will only occur if the strain energy release rate along the 60 fiber
direction, Gf, is less than the component perpendicular to the fibers, Gm.
These results improve the prediction of initiation of kinking in the 0/60
delamination migration specimens, because they account for propagation of damage
along the 60 fiber direction. The traditional mode II and mode III components of
strain energy release rate would not allow a complete description of delamination
propagation and migration at an interface between plies with dissimilar fiber
orientation. Therefore, this study demonstrates the suitability of the use of fiber-
aligned strain energy release rate at those interfaces.
ACKNOWLEDGEMENTS
This work was supported by the Engineering and Physical Sciences Research
Council (EPSRC), UK, through the EPSRC Centre for Doctoral Training in Advanced
Composites for Innovation and Science (grant number EP/G036772/1). The work was
additionally supported by the National Aeronautics and Space Administration
(NASA), Langley Research Center, USA, under Research Cooperative Agreement
No. NNL09AA00A awarded to the National Institute of Aerospace. Special thanks to
Dr. James Ratcliffe of NASA for the invaluable technical discussions.
REFERENCES
1. Cantwell, W.J., and J. Morton. 1991. “The impact resistance of composite materials – A review,”
Composites, 22(5):347-362.
2. Hull, D., and Y.B. Shi. 1993. “Damage mechanism characterization in composite damage tolerance
investigations,” Compos. Struct., 23:99-120.
3. Krueger, R., M.K. Cvitkovich, T.K. O’Brien and P.J. Minguet. 2000. “Testing and analysis of
composite skin/stringer debonding under multi-axial loading,” J. Compos. Mater., 34(15):1263-
1300.
4. Hallett, S.R., B.G. Green, W.G. Jiang and M.R. Wisnom. 2009. “An experimental and numerical
investigation into the damage mechanisms in notched composites,” Compos. Part A, 40:613-624.
5. Greenhalgh, E.S., C. Rogers, and P. Robinson. 2009. “Fractographic observations on delamination
growth and the subsequent migration through the laminate,” Compos. Sci. Technol., 69:2345-2351.
6. Canturri, C., E.S. Greenhalgh, S.T. Pinho and J. Ankersen. 2013. “Delamination growth
directionality and the subsequent migration process – The key to damage tolerant design,” Compos.
Part A, 54:79-87.
7. Ratcliffe, J.G., M.W. Czabaj, and T.K. O’Brien. August 2013. “A test for characterizing
delamination migration in carbon/epoxy tape laminates,” National Aeronautics and Space
Administration Technical Memorandum NASA/TM-2013-218028.
8. Pernice M.F., N.V. De Carvalho, J.G. Ratcliffe, and S.R. Hallett. 2015. “Experimental study on
delamination migration in composite laminates,” Compos. Part A, 73:20-34.
9. O’Brien, T.K. 1998. “Composite interlaminar shear fracture toughness, GIIC: shear measurement or
shear myth?,” in Composite Materials: Fatigue and Fracture (Seventh Volume) ASTM-STP 1330,
R. B. Bucinell, ed. Philadelphia: American Society for Testing and Materials, pp. 3-18.
10. Purslow, D. 1986. “Matrix fractography of fiber-reinforced epoxy composites,” Composites, 17(4):
189-303.
11. Ratcliffe, J.G., and N.V. De Carvalho. July 2014. “Investigating delamination migration in
composite tape laminates,” National Aeronautics and Space Administration Technical
Memorandum NASA/TM-2014-218289.
12. Rybicki, E.F., and M.F. Kanninen. 1977. “A finite element calculation of stress intensity factors by
a modified crack closure integral,” Eng. Fract. Mech., 9(4): 931-938.
13. Krueger, R. 2004. “Virtual crack closure technique: History, approach, and applications,” Appl.
Mech. Rev., 57(2):109-143.
14. He, M.Y., and J.W. Hutchinson. 1989. “Kinking of a crack out of an interface,” J. Appl. Mech.,
56:270-278.
15. De Carvalho, N.V., B.Y. Chen, S.T. Pinho, J.G. Ratcliffe, P.M. Baiz and T.E. Tay. 2015.
“Modeling delamination migration in cross-ply tape laminates,” Compos. Part A, 71:192-203.
16. Suemasu, H., and Y. Tanikado. 2015. “Damage growth behavior and interlaminar fracture
resistance of CFRP laminates under shear fracture mode,” Adv. Compos. Mater, 24(5):451-466.
17. Canturri, C., E.S. Greenhalgh and S.T. Pinho. 2014. “The relationship between mixed-mode II/III
delamination and delamination migration in composite laminates,” Compos. Sci. Technol., 105:102-
109.
18. ABAQUS/Standard Version 6.12 User’s Manual, 2012.
19. O’Brien, T.K., and R. Krueger. 2003. “Analysis of flexure tests for transverse tensile strength
characterization of unidirectional composite,” J. Compos. Tech. Res., 25:50-68.


