
http://pps.sagepub.com/Science
Perspectives on Psychological
http://pps.sagepub.com/content/7/6/543The online version of this article can be found at:
DOI: 10.1177/1745691612459060
2012 7: 543Perspectives on Psychological ScienceMarjan Bakker, Annette van Dijk and Jelte M. Wicherts
The Rules of the Game Called Psychological Science
Published by:
http://www.sagepublications.com
On behalf of:
Association For Psychological Science
can be found at:Perspectives on Psychological ScienceAdditional services and information for
http://pps.sagepub.com/cgi/alertsEmail Alerts:
http://pps.sagepub.com/subscriptionsSubscriptions:
http://www.sagepub.com/journalsReprints.navReprints:
http://www.sagepub.com/journalsPermissions.navPermissions:
at Statsbiblioteket on November 12, 2012pps.sagepub.comDownloaded from

Perspectives on Psychological Science7(6) 543 –554© The Author(s) 2012Reprints and permission: sagepub.com/journalsPermissions.navDOI: 10.1177/1745691612459060http://pps.sagepub.com
In many ways, science resembles a game (Mahoney, 1976). It involves rules (not cheating), individual players (researchers), competing teams (paradigms), arbiters (reviewers and edi-tors), and the winning of points (publications) and trophies (professorships, grants, and awards). Just like many games, science also involves the laws of chance. This is so specifi-cally because many results are obtained by null hypothesis significance testing (NHST; Kline, 2004). Notwithstanding the criticism it has received (Cohen, 1990, 1994; Gigerenzer, 2004; Kruschke, 2011; Meehl, 1978; Nickerson, 2000; Roze-boom, 1960; Wagenmakers, 2007; Wetzels et al., 2011), NHST continues to be the main method of statistical inference in many fields. In NHST, the researcher defines a null hypothesis of no effect (H0) and then determines the chance of finding at least the observed effect given that this null hypothesis is true. If this collected chance (or p value) is lower than a predeter-mined threshold (typically .05), the result is called significant. A significant result will increase the possibility of publishing a result (Mahoney, 1977). If science were a game, winning would entail writing the most interesting publications by gath-ering many p values below .05.
In this article, we discuss the replication crisis in psychol-ogy in terms of the strategic behaviors of researchers in their quest for significant outcomes in NHST. In line with previous work (Ioannidis, 2005, 2008b; Simmons, Nelson, & Simon-shon, 2011), we present the results of simulations in the con-text of meta-analysis to highlight the potential biases thus
introduced. We assess these problems in 13 psychological meta-analyses and discuss solutions.
Authors Are Lucky!It has long been argued that the combined outcomes of NHST in the scientific literature are too good to be true (Fanelli, 2010; Fiedler, 2011; Ioannidis, 2008a; Sterling, 1959; Vul, Harris, Winkielman, & Pashler, 2009). Fanelli (2010) docu-mented that over 80% of scientific publications in various sci-ences report positive results and that the psychological literature shows the highest prevalence of positive outcomes. Sterling (1959) and Sterling, Rosenbaum, and Weinkam (1995) showed that in 97% (in 1958) and 96% (in 1986–1987) of psychological studies involving the use of NHST, H0 was rejected at α = .05. Although it should be noted that psycho-logical papers report a host of test results (Maxwell, 2004), the abundance of positive outcomes is striking because effect sizes (ESs) in psychology are typically not large enough to be detected by the relatively small samples used in most studies (i.e., studies are often underpowered; Cohen, 1990).
Corresponding Author:Marjan Bakker, Department of Psychology, Psychological Methods, University of Amsterdam, Weesperplein 4, 1018 XA Amsterdam, The Netherlands E-mail: [email protected]
The Rules of the Game Called Psychological Science
Marjan Bakker1, Annette van Dijk1, and Jelte M. Wicherts2
1University of Amsterdam, The Netherlands, and 2Tilburg University, The Netherlands
Abstract
If science were a game, a dominant rule would probably be to collect results that are statistically significant. Several reviews of the psychological literature have shown that around 96% of papers involving the use of null hypothesis significance testing report significant outcomes for their main results but that the typical studies are insufficiently powerful for such a track record. We explain this paradox by showing that the use of several small underpowered samples often represents a more efficient research strategy (in terms of finding p < .05) than does the use of one larger (more powerful) sample. Publication bias and the most efficient strategy lead to inflated effects and high rates of false positives, especially when researchers also resorted to questionable research practices, such as adding participants after intermediate testing. We provide simulations that highlight the severity of such biases in meta-analyses. We consider 13 meta-analyses covering 281 primary studies in various fields of psychology and find indications of biases and/or an excess of significant results in seven. These results highlight the need for sufficiently powerful replications and changes in journal policies.
Keywords
replication, sample size, power, publication bias, false positives
at Statsbiblioteket on November 12, 2012pps.sagepub.comDownloaded from

544 Bakker et al.
The power of statistical tests depends on the nominal sig-nificance level (typically .05), the sample size, and the under-lying ES, such as Cohen’s d for between-group mean comparisons. According to Marszalek, Barber, Kohlhart, and Holmes (2011), the median total sample size in four represen-tative psychological journals (Journal of Abnormal Psychol-ogy, Journal of Applied Psychology, Journal of Experimental Psychology: Human Perception and Performance, and Devel-opmental Psychology) was 40. This finding is corroborated by Wetzels et al. (2011), who found a median cell size of 24 in both between- and within-subjects designs in their large sam-ple of t tests from Psychonomic Bulletin & Review and Jour-nal of Experimental Psychology: Learning, Memory and Cognition. The average ES found in meta-analyses in psychol-ogy is around d = 0.50 (Anderson, Lindsay, & Bushman, 1999; Hall, 1998; Lipsey & Wilson, 1993; Meyer et al., 2001; Rich-ard, Bond, & Stokes-Zoota, 2003; Tett, Meyer, & Roese, 1994), which might be an overestimation of the typical ES given the biases we discuss below. Nevertheless, the typical power in our field will average around 0.35 in a two indepen-dent samples comparison, if we assume an ES of d = 0.50 and a total sample size of 40. This low power in common psycho-logical research raises the possibility of a file drawer (Rosen-thal, 1979) containing studies with negative or inconclusive results. Publication bias can have dire consequences, as illus-trated recently by clear failures to replicate medical findings (Begley & Ellis, 2012; Prinz, Schlange & Asadullah, 2011). On the basis of surveys of researchers and a study of the fate of studies approved by the institutional review board of a
major U.S. university, the percentage of unpublished studies in psychology is estimated to be at least 50% (Cooper, DeNeve, & Charlton, 1997; Coursol & Wagner, 1986; Shadish, Doherty, & Montgomery, 1989), but the problem goes beyond wide-spread failure to publish. Statistical textbooks advise the use of formal a priori power estimates, but in a recent sample of psychological papers with NHST (Bakker & Wicherts, 2011), only 11% referred to power as a rationale for the choice of sample size or design. Although power estimates can also be done informally, the typical study in psychology appears to be underpowered. If a study’s power equals 0.50, the chance to find a significant result equals that of correctly predicting “heads” in a coin flip. The number of “heads” presented in the psychological literature (and in other literatures) suggests a problem. Although one author has explained this by claiming that researchers are psychic (Bones, 2012), we think that they just act strategically.
A Dozen ReplicationsThe common lack of power is well illustrated by studies of the (positive) association between infants’ habituation to a given stimulus and their later cognitive ability (IQ). One often-cited meta-analysis (McCall & Carriger, 1993) collated 12 studies of the correlation between measures of habituation during children’s first year of life and IQ as measured between 1 and 8 years of age. In the funnel plot (Light & Pillemer, 1984) of Figure 1, these 12 Fisher-transformed (normalized) correla-tions are plotted against the inverse of the standard error (SE)
–1.0 –0.5 0.5 1.0
46
810
Fisher Transformed Correlations
Inve
rse
of S
tand
ard
Erro
r(S
quar
e Ro
ot o
f N–3
)
Impl
ied
Pow
er
p<.05 p<.05p>.05
0.0
0.9
0.8
0.7
0.6
0.4
0.5
0.3
0.2
Distribution Under H0
for N = 50Distribution Under HA
for N=50
Fig. 1. Funnel plot of 12 studies of the relation between infant habituation performance and later IQ from McCall and Carriger (1993). The white area represents the 95% confidence interval (or area) under H0 = 0, and so outcomes in the grey area are significant at α = .05. Power estimates on the right-hand side are based on the meta-analytic effect size estimate that is depicted as the dotted straight line (Zr = .41). Distributions under H0 and HA are given on the top to illustrate power computation at the level of N = 50 (power = .81).
at Statsbiblioteket on November 12, 2012pps.sagepub.comDownloaded from

The Rules of the Game 545
in each study. The SE depends on sample size and equals 1/N–3. The white area represents the 95% confidence inter-val (or area) under H0 = 0, and study outcomes that fall in the grey area are significant at α = .05 (two-tailed). The straight dotted line represents the estimated underlying ES from a fixed effect meta-analysis (Zr = .41, which corresponds to r = .39 and d = .85) and the curved dotted lines represent the 95% confidence interval around that estimate of the alternative hypothesis (HA; study outcomes invariably fell in this interval and so they appear to be homogeneous; Q = 6.74, DF = 11, p = .820). The upward narrowing of both 95% confidence intervals in the funnel reflects larger power to reject H0 in large samples. On the right hand side, we depicted the power to reject H0 given the sample size (SE level) as implied by the estimated underlying ES of .41. For instance, on the top of Figure 1, we depicted the distributions under H0 and HA for N = 50 (1/SE = 6.86), which corresponds to a power of .807. As we go down the funnel, SEs become larger and so out-comes should deviate more strongly from the estimate of HA. It is noteworthy that (a) all but three of the studies have a power below .80, (b) the correlation differed significantly from zero in all but one study, and (c) the study outcomes are clearly not evenly distributed in the right- and left-hand side of the funnel associated with HA. In fact, the two largest studies showed the weakest link between infant cognition and later IQ, whereas the smaller studies all lie on the right-hand side the funnel (i.e., in the grey area where p < .05). Such funnel plot asymmetry is awkward and can be tested (Sterne & Egger, 2005) by regressing outcomes on sample sizes (or SEs) across the 12 studies: Z = 2.24, p = .025. The median sample size of these studies was 25 and their typical (median) power equaled .488. Under the assumption that studies are independent, the expected number of significant findings on the basis of this power analysis (i.e., the sum of power values) is 6.71, and so a positive outcome in 11 out of such 12 underpowered studies is unlikely. Ioannidis and Trikalinos (2007) proposed a straight-forward χ2 test for such an excess of significant findings: χ2 (DF = 1) = 6.21, p = .013. So this meta-analysis shows the typical signs of publication bias and results that are too good to be true (Francis, 2012b). One possible explanation is that studies with nonsignificant or lower correlations were missing from the meta-analysis. In addition, research with infants is not easy and seldom are these analyses carved in stone. Statis-tical choices concerning exclusion of data points, outliers, and operationalization of dependent variables require choices that are often arbitrary and so provide researchers degrees of free-dom (Simmons et al., 2011) in their analyses.
Playing the Game StrategicallyThe excess of significant findings may partly be explained by researchers’ exploitation of these degrees of freedom in their pursuit of significant outcomes (Fiedler, 2011; Wicherts, Bak-ker, & Molenaar, 2011) and by the fact that it is easier to find a significant effect in multiple small studies rather than one
larger study. The use of multiple small studies rather than a larger one gives the researcher the opportunity to make small alterations to the research design and provides ample opportu-nity for capitalizing on chance.
Simmons et al. (2011) illustrated how easy it is to inflate Type I error rates when researchers employ hidden degrees of freedom in their analyses and design of studies (e.g., selecting the most desirable outcomes, letting the sample size depend on results of significance tests). John, Loewenstein, and Prelec (2012) surveyed over 2,000 psychological researchers and found a majority of them to admit to use at least some of these questionable research practices (QRPs). For instance, the majority admitted to having ever failed to report all of the dependent measures in a study. Forty-eight percent admitted to having only report studies that “worked” (which we take to imply p < .05), whereas 57% acknowledged to having used sequential testing (cf. Wagenmakers, 2007) in their work. Such practices lead to inflated ESs and increased false positive rates (Ioannidis, 2005, 2008b; Simmons et al., 2011).
Suppose psychology were a game in which players have to gather a significant result in a particular direction. Players have resources to gather data from N participants and can choose between these options:
Strategy 1. Perform one large study (with N as the sample size) with sufficient power and publish it.
Strategy 2. Perform one large study and use some of the QRPs most popular in psychology (John et al., 2012). These QRPs may be performed sequentially until a significant result is found:
a. Test a second dependent variable that is correlated with the primary dependent variable (for which John et al. found a 65% admittance rate)
b. Add 10 subjects (sequential testing; 57% admit-tance rate)
c. Remove outliers (|Z > 2|) and rerun analysis (41% admittance rate)
Strategy 3. Perform, at most, five small studies each with (N/5) as sample size. Players may stop data col-lection when they find a significant result in the expected direction and only publish the desired result (the other studies are denoted “failed”; 48% admit-tance rate).
Strategy 4. Perform, at most, five small studies and apply the QRPs described above in each of these small studies if the need arises. Players may report only the first study that “worked.”
Strategies 3 and 4 imply publication bias in the traditional sense, whereas Strategies 2 and 4 relate to the analysis of the data. So what is the winning strategy? We simulated data (see the online Appendix at http://pps.sagepub.com/supplemental
at Statsbiblioteket on November 12, 2012pps.sagepub.comDownloaded from

546 Bakker et al.
for details) on the basis of sample sizes and ESs that are typi-cal for psychology and found a clear answer. The left panel of Figure 2 gives the proportion of researchers who gather at
least one significant finding (p < .05) under these four strate-gies. Note that we simulated one-sided results (i.e., directional hypotheses) but employed two-sided tests, which should be
0.0 0.2 0.4 0.6 0.8 1.0
0.0
0.2
0.4
0.6
0.8
1.0
Chance of Getting at Least 1 Significant Result Small N = 10
ES
Prop
ortio
n
1 Large Study1 Large Study with QRPs5 Small Studies5 Small Studies with QRPs
0.0 0.2 0.4 0.6 0.8 1.0
0.0
0.2
0.4
0.6
0.8
1.0
Chance of Getting at Least 1 Significant Result Small N = 20
ES
Prop
ortio
n
1 Large Study1 Large Study with QRPs5 Small Studies5 Small Studies with QRPs
0.0 0.2 0.4 0.6 0.8 1.0
0.0
0.2
0.4
0.6
0.8
1.0
Chance of Getting at Least 1 Significant Result Small N = 40
ES
Prop
ortio
n
1 Large Study1 Large Study with QRPs5 Small Studies5 Small Studies with QRPs
0.0 0.2 0.4 0.6 0.8 1.0
0.0
0.2
0.4
0.6
0.8
1.0
1.2
ES Bias; Small N = 10
ESBi
as
1 Large Study1 Large Study with QRPs5 Small Studies5 Small Studies with QRPs
0.0 0.2 0.4 0.6 0.8 1.0
0.0
0.2
0.4
0.6
0.8
1.0
1.2
ES Bias; Small N = 20
ES
Bias
1 Large Study1 Large Study with QRPs5 Small Studies5 Small Studies with QRPs
0.0 0.2 0.4 0.6 0.8 1.0
0.0
0.2
0.4
0.6
0.8
1.0
1.2
ES Bias; Small N = 40
ES
Bias
1 Large Study1 Large Study with QRPs5 Small Studies5 Small Studies with QRPs
Fig. 2. Results of simulations showing the optimal strategy for players (in terms of probability of finding at least one significant result; left column) and the bias in estimated ESs (right column) under the four strategies described in the text under a range of genuine ESs (d = 0 to 1). N represents sample sizes for small studies, whereas the larger sample size equals 5*N within each row. Results are one-sided (i.e., directional hypotheses), but tests are two-sided and should be significant in the expected direction. at Statsbiblioteket on November 12, 2012pps.sagepub.comDownloaded from

The Rules of the Game 547
significant in the expected direction. So the (combined) Type I error rate (i.e., when ES = 0) is .025 for the large study and 1 − (1 − .025)^5 = .119 for the five small studies.
The upshot of the simulation results is that when the true ES is small executing multiple small and underpowered studies represents the optimal strategy for individual players to generate a p value of less than .05. Furthermore, the use of QRPs pays off, especially with small samples and ESs. Besides, many play-ers need not even perform all five studies—for example, with a cell size of 20 and an ES of 0.5 they need on average 2.58 stud-ies (expected total N = 103) without QRPs and 1.14 studies (expected total N = 66) with QRPs. Combined with the selection of significant results through publication decisions, these strate-gies may explain why so many psychological researchers con-tinue to run underpowered studies yet almost always report significant results.
Get Serious!Science is not a game. The optimal strategies described above lead to inflated Type I errors of up to 40% and inflate genuine effects. We calculated the bias in our simulation as the differ-ence between the average estimated ES and the true ES. Results are presented in the right panel of Figure 2. With large samples (Strategy 1), there is no systematic bias. For large samples with QRPs (Strategy 2), the bias goes to zero with a larger true ES, which is to be expected because of the larger power under this scenario (QRPs are not required for “win-ning”). The bias is large with multiple small studies (Strategies 3 and 4). In the typical psychological study (cell size 20 and true ES = .5), the biases with and without QRPs are 0.327 and 0.158, respectively. With smaller cell sizes and an ES of .5, the bias can be as large as 0.913. When multiple small studies are combined with QRPs (Strategy 4), the bias is large for small true ES, but decreases with larger true ES, possibly because of the adding of subjects (in Step b). Even those who ignore p values of individual studies will find inflated ESs in the psy-chological literature if a sufficient number of researchers play strategically, which indeed many psychological researchers appear to do (John et al., 2012).
Our field lacks clear codes of conduct considering the use of these analytic strategies (Sterba, 2006) and many reviewers tend not to accept p values above .05 (Mahoney, 1977), pos-sibly because this presents an easy heuristic (Hoekstra, Finch, Kiers, & Johnson, 2006; Nelson, Rosenthal, & Rosnow, 1986). Sole studies are seldom definitive but even knowledgeable researchers tend to underestimate the randomness associated with small samples (Tversky & Kahneman, 1971). At the end of the day it is all about replication.
Another 250+ ReplicationsA set of reasonably similar replications can be used to deter-mine robustness of findings and to study signs of the use of the strategies described above. In our simulations, we used fixed
effects and applied Sterne and Egger’s (2005) test of funnel plot asymmetry and Ioannidis and Trikalonis’ (2007) test for an excess of significant findings. Both methods are described above and functioned well in the simulation (see the online Appendix at http://pps.sagepub.com/supplemental and Fig. 4), although it is important to note that they are sensitive to actual heterogeneity of the underlying ESs (Ioannidis & Trikalinos, 2007; Sterne & Egger, 2005). For instance, funnel plot asym-metry may arise if smaller studies tap on stronger underlying effects because they are done in relatively more controlled set-tings. Therefore, these tests are best applied to relatively homogenous sets of studies as defined in the realm of meta-analysis.
To gather a representative sample of sets of psychological studies that concern the same phenomenon or at least highly similar phenomena, we retrieved from PsycARTICLES all 108 peer-reviewed articles published in 2011 that contained the strings “research synthesis,” “systematic review,” or “meta-anal*” in title and/or abstract. Subsequently, we ran-domly selected 11 useful meta-analyses (10% of the total). We only included meta-analyses that reported the ESs and stan-dard errors (or sample sizes) of primary studies. From each meta-analysis, we retrieved the subset (as selected by the authors of the meta-analyses) of at least 10 primary studies that was the most homogenous subset in terms of Higgins’ I2. We assumed that the meta-analysts employed rigorous inclu-sion and exclusion criteria and that they correctly determined ESs, and we feel confident that the primary studies in each of the fields are sufficiently comparable to be considered replications.
The selected (subsets from) meta-analyses are given in Table 1 together with tests for homogeneity, excess of signifi-cant findings, and funnel plot asymmetry. The average impact factor of the journals in which the meta-analyses appeared was 4 (see the online Appendix at http://pps.sagepub.com/supplemental for full references). Meta-analyses were from clinical, counseling, educational, evolutionary, developmen-tal, family, and industrial/organizational psychology. The medians of the sample sizes align with those found in the wider literature, although the median ES (d = .37) was slightly lower than d = .50, as described earlier.
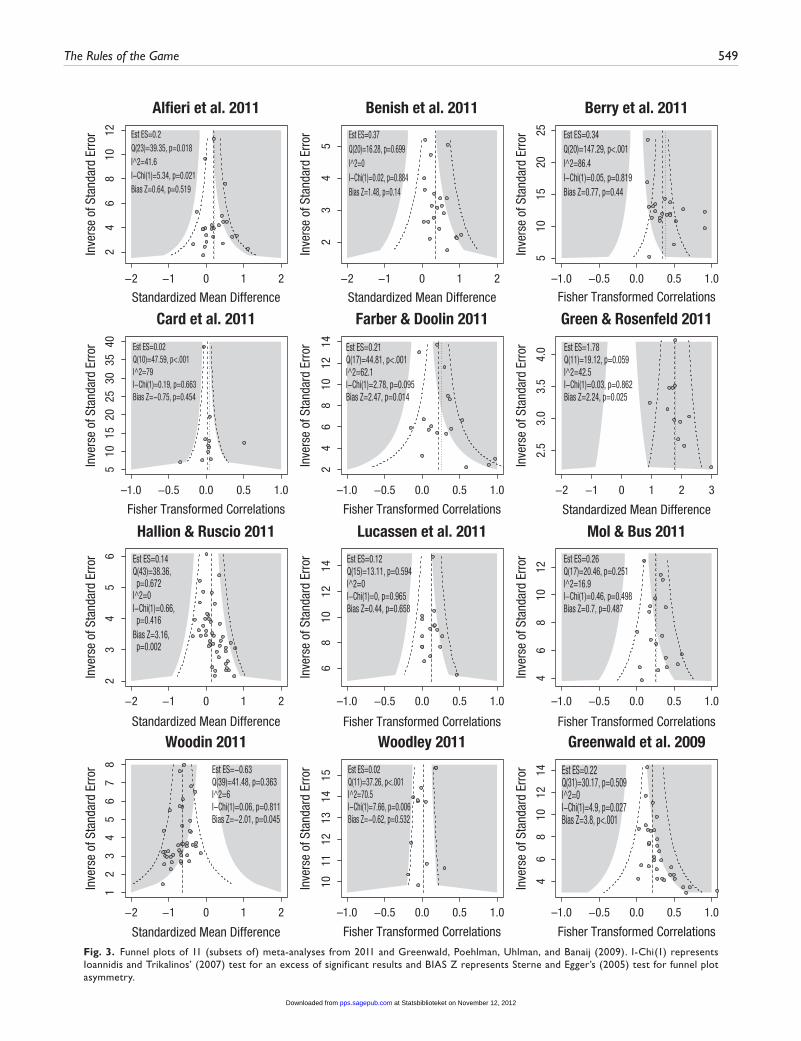
Figure 3 depicts the funnel plots of the 11 meta-analyses. Tests for funnel plot asymmetry (with an α of .10 as suggested by various authors; Ioannidis & Trikalinos, 2007) were signifi-cant in four instances (36%). In three instances, we found signs of an excess of significant results (27% at α = .10). These results replicate earlier indicators of the prevalence of funnel plot asymmetry in 99 psychological meta-analyses (Ferguson & Brannick, 2012; Levine, Asada, & Carpenter, 2009) and the finding of an excess of significant results in four areas of psy-chological research (Francis, 2012a, 2012b, in press).
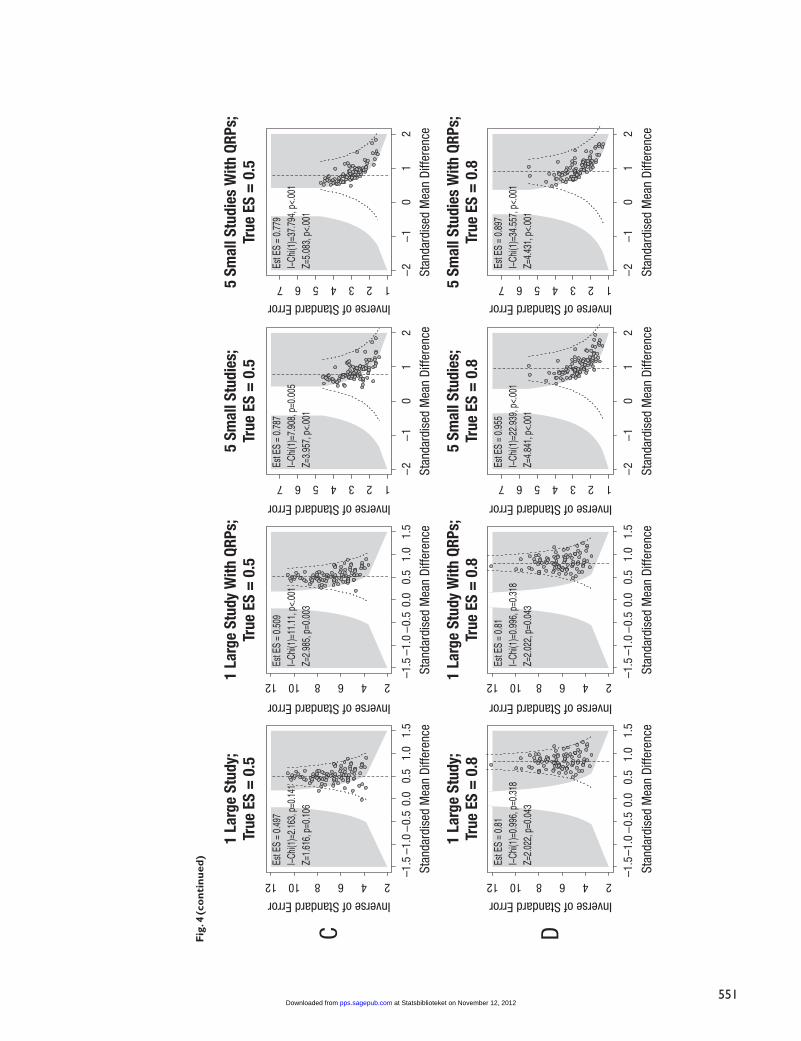
To get a feel for the likelihood of biases in the actual meta-analyses, we simulated results for 16 meta-analyses with 100 studies each. These meta-analyses are presented in Fig-ure 4 (see the online Appendix at http://pps.sagepub.com/
at Statsbiblioteket on November 12, 2012pps.sagepub.comDownloaded from

548
Tabl
e 1.
Ref
eren
ces,
Med
ian
Sam
ple
Size
s, M
ean
Estim
ates
, Hom
ogen
eity
Tes
ts, T
ests
of t
he E
xces
s of
Sig
nific
ant
Find
ings
, and
Fun
nel P
lot A
sym
met
ry o
f 13
Met
a-A
naly
ses.
Ref
eren
ceSu
bgro
upES
(d)
(SE)
kN
Med
. NQ
(p)
I2Ex
p.O
bs.
χ2 (p)
Reg
test
(p)
Alfi
eri e
t al
. (20
11)
Enha
nced
di
scov
ery:
Chi
ldre
n
0.20
(.042
)24
2350
6139
.35
(.018
)41
.63.
858
5.34
(.0
21)
0.64
(.5
19)
Beni
sh e
t al
. (20
11)
All
0.37
(.067
)21
933
3916
.28
(.699
)0
4.72
50.
02 (
.884
)1.
48 (
.140
)Be
rry
et a
l. (2
011)
Self-
othe
r0.
34 (
0.70
)(.0
17)
2135
0214
614
7.29
(<
.001
)86
.419
.75
200.
05 (
.819
)0.
77 (
.440
)C
ard
et a
l. (2
011)
Exte
rnal
izin
g0.
02 (
0.04
)(.0
19)
1129
2513
847
.59
(<.0
01)
79.0
0.66
10.
19 (
.663
)−0
.75
(.454
)Fa
rber
& D
oolin
(2
011)
All
0.21
(0.
43)
(.032
)18
1027
3844
.81
(<.0
01)
62.1
5.71
92.
78 (
.095
)2.
47 (
.014
)
Gre
en &
Ros
enfe
ld
(201
1)A
vera
ge S
IRS
sim
ulat
ors
ve
rsus
no
nclin
ical
1.78
(.091
)12
718
5319
.12
(.059
)42
.511
.97
120.
03 (
.862
)2.
24 (
.025
)
Hal
lion
& R
usci
o (2
011)
Post
test
0.14
(.042
)44
2311
4838
.36
(.672
)0
3.45
20.
66 (
.416
)3.
16 (
.002
)
Luca
ssen
et
al. (
2011
)A
ll0.
12 (
0.24
)(.0
28)
1613
5580
13.1
1 (.5
94)
03.
073
0.00
(.9
65)
0.44
(.6
58)
Mol
& B
us (
2011
)G
rade
s 1-
12
basi
cs0.
26 (
0.52
)(.0
30)
1811
6451
20.4
6 (.2
51)
16.9
8.56
100.
46 (
.498
)0.
70 (
.487
)
Woo
din
(201
1)Sa
tis.-H
osti.
−0.6
3(.0
37)
4030
0851
41.4
8 (.3
63)
6.0
25.2
726
0.06
(.8
11)
−2.0
1 (.0
45)
Woo
dley
(20
11)
All
0.02
(0.
05)
(.022
)12
2056
193
37.2
6 (<
.001
)70
.50.
723
7.66
(.0
06)
−0.6
2 (.5
32)
Gre
enw
ald,
Poe
hl-
man
, Uhl
man
, &
Bana
ij (2
009)
Rac
e IA
T0.
22 (
0.44
)(.0
25)
3216
9938
30.1
7 (.5
09)
010
.17
164.
90 (
.027
)3.
80 (
<.0
01)
McC
all &
Car
rige
r (1
993)
Hab
ituat
ion
0.41
(0.
85)
(.049
)12
447
256.
74 (
.820
)0
6.71
116.
21 (
.013
)2.
24 (
.025
)
Not
e. E
S =
Effe
ct s
ize
in C
ohen
’s d,
exc
ept
for
thos
e in
bol
d w
hich
are
Fis
her
corr
elat
ions
wit
h C
ohen
’s d
betw
een
the
brac
kets
; k =
num
ber
of s
tudi
es; N
= t
otal
sam
ple
size
; Med
. N =
med
ian
sam
ple
size
; Q =
tes
t fo
r ho
mog
enei
ty; I
2 = H
iggi
ns’ I
2 ; Exp
. = e
xpec
ted
num
ber
of r
ejec
tion
s of
H0
unde
r ES
; Obs
. = o
bser
ved
num
ber
of r
ejec
tion
s of
H0;
χ2 =
tes
t of
the
exc
ess
of s
igni
fican
t re
sult
s; R
egte
st =
Ste
rne
and
Egge
r’s
(200
5) t
est
for
funn
el p
lot
asym
met
ry.
at Statsbiblioteket on November 12, 2012pps.sagepub.comDownloaded from
The Rules of the Game 549
210
Inve
rse
of S
tand
ard
Erro
r8
46
12
−2 0 1 2−1
Standardized Mean Difference
Standardized Mean Difference
Alfieri et al. 2011
Card et al. 2011
40
Inve
rse
of S
tand
ard
Erro
r35
3025
2015
105
Hallion & Ruscio 2011Fisher Transformed Correlations
–1.0 0.0 0.5−0.5 1.0
0 1 2−2 −1
Standardized Mean Difference
0 1 2−2 −1
45
6
Inve
rse
of S
tand
ard
Erro
r3
24
32
15
67
8
Inve
rse
of S
tand
ard
Erro
r
Est ES=0.2Q(23)=39.35, p=0.018I^2=41.6I−Chi(1)=5.34, p=0.021Bias Z=0.64, p=0.519
Est ES=0.02Q(10)=47.59, p<.001I^2=79I−Chi(1)=0.19, p=0.663Bias Z=−0.75, p=0.454
Est ES=0.14Q(43)=38.36, p=0.672I^2=0I−Chi(1)=0.66, p=0.416Bias Z=3.16, p=0.002
Est ES=−0.63Q(39)=41.48, p=0.363I^2=6I−Chi(1)=0.06, p=0.811Bias Z=−2.01, p=0.045
Woodin 2011
45
32
Inve
rse
of S
tand
ard
Erro
r
0 1 2−2 −1
Standardized Mean Difference
Benish et al. 2011
Farber & Doolin 20112In
vers
e of
Sta
ndar
d Er
ror
108
46
1214
Lucassen et al. 2011Fisher Transformed Correlations
0.0 0.5−0.5 1.0–1.0
Fisher Transformed Correlations
–1.0 0.0 0.5−0.5 1.0
Fisher Transformed Correlations
–1.0 0.0 0.5−0.5 1.0
Inve
rse
of S
tand
ard
Erro
r
108
612
14
Inve
rse
of S
tand
ard
Erro
r
1514
1312
1110
Est ES=0.37Q(20)=16.28, p=0.699I^2=0I−Chi(1)=0.02, p=0.884Bias Z=1.48, p=0.14
Est ES=0.21Q(17)=44.81, p<.001I^2=62.1I−Chi(1)=2.78, p=0.095Bias Z=2.47, p=0.014
Est ES=0.12Q(15)=13.11, p=0.594I^2=0I−Chi(1)=0, p=0.965Bias Z=0.44, p=0.658
Est ES=0.02Q(11)=37.26, p<.001I^2=70.5I−Chi(1)=7.66, p=0.006Bias Z=−0.62, p=0.532
Woodley 2011
Inve
rse
of S
tand
ard
Erro
r 2520
1510
5
0.0 0.5−0.5 1.0–1.0
Standardized Mean Difference
Fisher Transformed Correlations
Berry et al. 2011
Green & Rosenfeld 2011
4.0
3.5
3.0
2.5
Inve
rse
of S
tand
ard
Erro
rMol & Bus 2011
0 31 2−2 −1
Fisher Transformed Correlations
–1.0 0.0 0.5−0.5 1.0
Fisher Transformed Correlations
–1.0 0.0 0.5−0.5 1.0
Inve
rse
of S
tand
ard
Erro
r
86
410
12
Inve
rse
of S
tand
ard
Erro
r 1412
108
64
Est ES=0.34Q(20)=147.29, p<.001I^2=86.4I−Chi(1)=0.05, p=0.819Bias Z=0.77, p=0.44
Est ES=1.78Q(11)=19.12, p=0.059I^2=42.5I−Chi(1)=0.03, p=0.862Bias Z=2.24, p=0.025
Est ES=0.26Q(17)=20.46, p=0.251I^2=16.9I−Chi(1)=0.46, p=0.498Bias Z=0.7, p=0.487
Est ES=0.22Q(31)=30.17, p=0.509I^2=0I−Chi(1)=4.9, p=0.027Bias Z=3.8, p<.001
Greenwald et al. 2009
Fig. 3. Funnel plots of 11 (subsets of) meta-analyses from 2011 and Greenwald, Poehlman, Uhlman, and Banaij (2009). I-Chi(1) represents Ioannidis and Trikalinos’ (2007) test for an excess of significant results and BIAS Z represents Sterne and Egger’s (2005) test for funnel plot asymmetry.
at Statsbiblioteket on November 12, 2012pps.sagepub.comDownloaded from

Fig
. 4.
Funn
el p
lots
of s
imul
atio
ns u
nder
tru
e ES
s of
0, .
2, .5
, and
.8 (
row
s A
thr
ough
D)
for
the
four
str
ateg
ies
(col
umns
1 t
hrou
gh 4
) w
ith
vary
ing
sam
ple
size
s. I-
Chi
(1)
repr
esen
ts
Ioan
nidi
s an
d Tr
ikal
inos
’ (20
07)
test
for
an e
xces
s of
sig
nific
ant
resu
lts
and
BIA
S Z
rep
rese
nt S
tern
e an
d Eg
ger’
s (2
005)
tes
t fo
r fu
nnel
plo
t as
ymm
etry
.
A
210
Inverse of Standard Error
8 46121
Larg
e St
udy;
True
ES
= 0
1
–1.0
–1.5
0.0
0.5
−0.
51.
01.
5
Stan
dard
ized
Mea
n Di
ffere
nce
Est E
S = −
0.039
I−Chi(
1)=2.6
9, p
=0.10
1Z=
−0.22
4, p
=0.82
2
Inverse of Standard Error
210 8 4612
21
Larg
e St
udy
With
QRP
s;Tr
ue E
S =
0
–1.0
–1.5
0.0
0.5
−0.
51.
01.
5
Stan
dard
ized
Mea
n Di
ffere
nce
Est E
S = 0.
054
I−Chi(
1)=1.2
12,
p=0
.271
Z=0.9
32,
p=0
.351
Inverse of Standard Error
4 3 2 1567
5 Sm
all S
tudi
es;
True
ES
= 0
3 01
2−
2−
1
Stan
dard
ized
Mea
n Di
ffere
nce
Est E
S = 0.
345
I−Chi(
1)=1.1
44, p
=0.28
5Z=
3.821
, p<.
001
Inverse of Standard Error
4 3 2 15675 Sm
all S
tudi
es W
ith Q
RPs;
True
ES
= 0
4 01
2−
2−
1
Stan
dard
ized
Mea
n Di
ffere
nce
Est E
S = 0.
479
I−Chi(
1)=0.0
01, p
=0.97
Z=6.0
74, p
<.00
1
B
210
Inverse of Standard Error8 4612
1 La
rge
Stud
y;Tr
ue E
S =
0.2
–1.0
–1.5
0.0
0.5
−0.
51.
01.
5
Stan
dard
ized
Mea
n Di
ffere
nce
Est E
S = 0.
198
I−Chi(
1)=0.0
21,
p=0
.886
Z=0.6
91, p
=0.48
9
Inverse of Standard Error
210 8 46121 La
rge
Stud
y W
ith Q
RPs;
True
ES
= 0
.2
–1.0
–1.5
0.0
0.5
−0.
51.
01.
5
Stan
dard
ized
Mea
n Di
ffere
nce
Est E
S = 0.
255
I−Chi(
1)=1.5
78,
p=0
.209
Z=2.7
7, p=
0.006
Inverse of Standard Error
4 3 2 1567
5 Sm
all S
tudi
es;
True
ES
= 0
.2
01
2−
2−
1
Stan
dard
ized
Mea
n Di
ffere
nce
Est E
S = 0.
514
I−Chi(
1)=0.0
03, p
=0.95
9Z=
4.502
, p<.
001
Inverse of Standard Error
4 3 2 15675 Sm
all S
tudi
es W
ith Q
RPs;
True
ES
= 0
.2
01
2−
2−
1
Stan
dard
ized
Mea
n Di
ffere
nce
Est E
S = 0.
587
I−Chi(
1)=14
.444,
p<.00
1Z=
5.708
, p<.
001
(con
tinue
d)
550 at Statsbiblioteket on November 12, 2012pps.sagepub.comDownloaded from
Est E
S =
0.49
7I−
Chi(1
)=2.1
63, p
=0.14
1Z=
1.61
6, p
=0.1
06
Est E
S =
0.50
9I−
Chi(1
)=11
.11,
p<.
001
Z=2.
985,
p=0
.003
Est E
S =
0.78
7I−
Chi(1
)=7.
908,
p=0
.005
Z=3.
957,
p<.
001
Est E
S =
0.77
9I−
Chi(1
)=37
.794
, p<.
001
Z=5.
083,
p<.
001
Est E
S =
0.81
I−Ch
i(1)=
0.99
6, p
=0.3
18Z=
2.02
2, p
=0.0
43
Est E
S =
0.81
I−Ch
i(1)=
0.99
6, p
=0.3
18Z=
2.02
2, p
=0.0
43
Est E
S =
0.95
5I−
Chi(1
)=22
.939
, p<.
001
Z=4.
841,
p<.
001
Est E
S =
0.89
7I−
Chi(1
)=34
.557
, p<.
001
Z=4.
431,
p<.
001
C D
210
Inverse of Standard Error8 4612
210
Inverse of Standard Error
8 4612 210
Inverse of Standard Error
8 4612
210
Inverse of Standard Error8 4612
Stan
dard
ised
Mea
n Di
ffere
nce
–1.0
–1.5
0.0
0.5
−0.
51.
01.
5
Stan
dard
ised
Mea
n Di
ffere
nce
–1.0
–1.5
0.0
0.5
−0.
51.
01.
5
Stan
dard
ised
Mea
n Di
ffere
nce
01
2−
2−
1
Stan
dard
ised
Mea
n Di
ffere
nce
01
2−
2−
1
Stan
dard
ised
Mea
n Di
ffere
nce
–1.0
–1.5
0.0
0.5
−0.
51.
01.
5
Stan
dard
ised
Mea
n Di
ffere
nce
–1.0
–1.5
0.0
0.5
−0.
51.
01.
5
Stan
dard
ised
Mea
n Di
ffere
nce
01
2−
2−
1
Stan
dard
ised
Mea
n Di
ffere
nce
01
2−
2−
1
Inverse of Standard Error
4 3 2 1567
Inverse of Standard Error
4 3 2 1567
Inverse of Standard Error4 3 2 1567
Inverse of Standard Error4 3 2 1567
1 La
rge
Stud
y;Tr
ue E
S =
0.8
1 La
rge
Stud
y W
ith Q
RPs;
True
ES
= 0
.85
Smal
l Stu
dies
;Tr
ue E
S =
0.8
5 Sm
all S
tudi
es W
ith Q
RPs;
True
ES
= 0
.8
1 La
rge
Stud
y;Tr
ue E
S =
0.5
1 La
rge
Stud
y W
ith Q
RPs;
True
ES
= 0
.55
Smal
l Stu
dies
;Tr
ue E
S =
0.5
5 Sm
all S
tudi
es W
ith Q
RPs;
True
ES
= 0
.5
Fig
. 4 (c
on
tin
ued
)
551 at Statsbiblioteket on November 12, 2012pps.sagepub.comDownloaded from

552 Bakker et al.
supplemental for details), based on the four strategies as described above (Column 1 through 4) and four levels of true ES (d = 0.0, 0.2, 0.5, or 0.8; Rows A through D). As can be seen, the pattern of results in the habituation–IQ studies (Fig. 1) looks highly similar to results simulated under Strat-egy 4 and an ES greater than 0 (Fig. 4; Panels B4 and C4). The funnel plot from Alfieri et al. (2011; educational psychology) resembles that from Strategy 2 under a small ES (Panel B2). In Woodley’s meta-analysis (2011; evolutionary psychology), the overall effect is close to zero and Strategy 2 appears to be at play (Panel A2). In Farber and Doodlin’s meta-analysis (2011; psychotherapy works better with positive regard), sam-ples sizes were small and there is an indication of the use of Strategy 3 (Panel B3). In Hallion and Ruscio’s meta-analysis (2011), the effects of cognitive bias modification on stress and anxiety appear small and based on too many underpowered studies (Panel A3 or B3). Correlations between relationship conflict and hostility of partners as studied by Woodin (2011) appear to be substantial but may also be inflated by publica-tion bias and the use of small samples (Panel C3). In these research lines, additional studies with larger sample sizes are clearly welcome.
We also included in Figure 3 and Table 1 a recent meta-analysis on the predictive validity of the Implicit Association Test (IAT). The subset of studies that concerned racial discrim-ination is another example of an excess of significant results and funnel plot asymmetry. The results from the 32 studies collated by Greenwald, Poehlman, Uhlman, and Banaij (2009) are based on small samples sizes, considerable freedom in the analysis, and a high degree of faddism, all of which may con-spire to bring about inflated effects (Ioannidis, 2005). Further studies with larger sample sizes should be added to the data-base to accurately determine IAT’s validity.
Improving the GameWithout any clear rules concerning the use (and documenta-tion) of multiple small studies and QRPs, strategic behaviors by researchers can lead literatures astray. The best way to sep-arate the wheat from the chaff in psychology is to (a) end the pretense that small studies are definitive, (b) improve report-ing standards, (c) start considering and publishing nonsignifi-cant results, and (d) introduce a distinction between exploratory and confirmatory studies into journal policies (Wagenmakers, Wetzels, Borsboom, & van der Maas, 2011). The prevalence of underpowered studies in psychological research hints at the common use of Strategies 3 and 4 in which researchers con-duct a series of small studies up to the point that one turns out to be significant. Sample sizes should be based on a priori power analyses that take into account the potential inflation of effects in earlier small studies. Later replications of published results and/or of statistical outcomes will be facilitated by including experimental material, raw data, and computer code (in the case of nonstandard analyses) as online supplements. In our view, researchers should be open about having not found
what they looked for in early phases of research, while in the confirmatory phases, they should conduct studies that are pos-sibly preregistered, sufficiently powerful, and analyzed in ways that are explicated in advance. The ideal paper then is not one with one or a few small studies with p values just below .05, but one in which all small pilot studies are reported in a meta-analytic summary and tested for homogeneity and/or moderation and in which one major study lends clear support. Small and underpowered studies may lead to biases of differ-ent kinds (Ledgerwood & Sherman, 2012) and some have even argued to simply exclude them from meta-analyses (Kraemer, Gardner, Brooks, & Yesavage, 1998).
We found indications of bias in nearly half of the psycho-logical research lines we scrutinized. The ambition of players in the game of science does not always sit well with the goal of the scientific enterprise. Optimal strategies for individual researchers introduce biases that we can only counter by improving the rules of the game. The arbiters in the game (peer reviewers and editors) are in an ideal position to do so.
Declaration of Conflicting Interests
The authors declared that they had no conflicts of interest with respect to their authorship or the publication of this article.
Funding
The preparation of this article was supported by Netherlands Organization for Scientific Research (NWO) Grants 400-08-214 and 016-125-385.
References
References marked with an asterisk indicate studies included in the study sample*Alfieri, L., Brooks, P. J., Aldrich, N. J., & Tenenbaum, H. R. (2011).
Does discovery-based instruction enhance learning? Journal of Educational Psychology, 103, 1–18. doi: 10.1037/a0021017
Anderson, C. A., Lindsay, J. J., & Bushman, B. J. (1999). Research in the psychological laboratory. Current Directions in Psychologi-cal Science, 8, 3–9. doi:10.1111/1467-8721.00002
Bakker, M., & Wicherts, J. M. (2011). The (mis)reporting of statisti-cal results in psychology journals. Behavior Research Methods, 43, 666–678. doi:10.3758/s13428-011-0089-5
Begley, C. G., & Ellis, L. M. (2012). Raise standards for preclinical cancer research. Nature, 483, 531–533. doi:10.1038/483531a
*Benish, S. G., Quintana, S., & Wampold, B. E. (2011). Culturally adapted psychotherapy and the legitimacy of myth: A direct-comparison meta-analysis. Journal of Counseling Psychology, 58, 279–289. doi: 10.1037/a0023626
*Berry, C. M., Carpenter, N. C., & Barratt, C. L. (2011). Do other-reports of counterproductive work behavior provide an incremental contribution over self-reports? A meta-analytic comparison. Jour-nal of Applied Psychology, 97, 613–636. doi: 10.1037/a0026739
Bones, A. K. (2012). We knew the future all along: Scientific a priori hypothesizing is much more accurate than other forms of pre-cognition. Perspectives on Psychological Science, 7, 307–309. doi:10.1177/1745691612441216
at Statsbiblioteket on November 12, 2012pps.sagepub.comDownloaded from
The Rules of the Game 553
*Card, N. A., Bosch, L., Casper, D. M., Wiggs, C. B., Hawkins, S., Schlomer, G. L., & Borden, L. M. (2011). A meta-analytic review of internalizing, externalizing, and academic adjustment among children of deployed military service members. Journal of Fam-ily Psychology, 25, 508–520. doi:10.1037/a0024395
Cohen, J. (1990). Things I have learned (thus far). American Psy-chologist, 45, 1304–1312.
Cohen, J. (1994). The earth is round (p < .05). American Psycholo-gist, 49, 997–1003.
Cooper, H., DeNeve, K., & Charlton, K. (1997). Finding the missing science: The fate of studies submitted for review by a human sub-jects committee. Psychological Methods, 2, 447–452.
Coursol, A., & Wagner, E. E. (1986). Effect of positive findings on submission and acceptance rates: A note on meta-analysis bias. Professional Psychology-Research and Practice, 17, 136–137.
Fanelli, D. (2010). “Positive” results increase down the hierar-chy of the sciences. PLoS One, 5, e10068. doi:10.1371/journal .pone.0010068
*Farber, B. A., & Doolin, E. M. (2011). Positive regard. Psychother-apy, 48, 58–64. doi: 10.1037/a0022141
Ferguson, C. J., & Brannick, M. T. (2012). Publication bias in psy-chological science: Prevalence, methods for identifying and controlling, and implications for the use of meta-analyses. Psy-chological Methods, 17, 120–128. doi:10.1037/a0024445
Fiedler, K. (2011). Voodoo correlations are everywhere—Not only in neuroscience. Perspectives on Psychological Science, 6, 163–171. doi:10.1177/1745691611400237
Francis, G. (2012a). The same old new look: Publication bias in a study of wishful seeing. i-Perception, 3, 176–178. doi:10.1068/i0519ic
Francis, G. (2012b). Too good to be true: Publication bias in two prom-inent studies from experimental psychology. Psychonomic Bulletin & Review, 19, 151–156. doi:10.3758/s13423-012-0227-9
Francis, G. (in press). Publication bias in “red, rank, and romance in women viewing men” by Elliot et al. (2010). Journal of Experi-mental Psychology: General.
Gigerenzer, G. (2004). Mindless statistics. The Journal of Socio-Eco-nomics, 33, 587–606.
*Green, D., & Rosenfeld, B. (2011). Evaluating the gold standard: A review and meta-analysis of the Structured Interview of Reported Symptoms. Psychological Assessment, 23, 95–107. doi: 10.1037/a0021149
Greenwald, A. G., Poehlman, T. A., Uhlman, E. L., & Banaij, M. R. (2009). Understanding and using the implicit association test III. Meta-analysis of predictive validity. Journal of Personality and Social Psychology, 97, 17–41. doi:10.1037/a0015575
Hall, J. A. (1998). How big are nonverbal sex differences? In D. J. Canary & K. Dindia (Eds.), Sex differences and similarities in communication (pp. 155–177). Mahwah, NJ: Erlbaum.
*Hallion, L. S., & Ruscio, A. M. (2011). A meta-analysis of the effect of cognitive bias modification on anxiety and depression. Psy-chological Bulletin, 137, 940–958. doi: 10.1037/a0024355
Hoekstra, R., Finch, S., Kiers, H. A. L., & Johnson, A. (2006). Prob-ability as certainty: Dichotomous thinking and the misuse of p values. Psychonomic Bulletin & Review, 13, 1033–1037.
Ioannidis, J. P. A. (2005). Why most published research find-ings are false. PLoS Medicine, 2, e124. doi:10.1371/journal.pmed.0020124
Ioannidis, J. P. A. (2008a). Effect of formal statistical significance on the credibility of observational associations. American Journal of Epidemiology, 168, 374–383. doi:10.1093/aje/kwn156
Ioannidis, J. P. A. (2008b). Why most discovered true associa-tions are inflated. Epidemiology, 19, 640–648. doi:10.1097/EDE.0b013e31818131e7
Ioannidis, J. P. A., & Trikalinos, T. A. (2007). An exploratory test for an excess of significant findings. Clinical Trials, 4, 245–253. doi:10.1177/1740774507079441
John, L. K., Loewenstein, G., & Prelec, D. (2012). Measuring the prevalence of questionable research practices with incentives for truth-telling. Psychological Science. Advance online publication. doi:10.1177/0956797611430953
Kline, R. B. (2004). Beyond significance testing: Reforming data analysis methods in behavioral research. Washington, DC: American Psychological Association.
Kraemer, H. C., Gardner, C., Brooks, J. O., & Yesavage, J. A. (1998). Advantages of excluding underpowered studies in meta-analysis: Inclusionist versus exclusionist viewpoints. Psychological Meth-ods, 3, 23–31.
Kruschke, J. K. (2011). Bayesian assessment of null values via parameter estimation and model comparison. Perspectives on Psychological Science, 6, 299–312.
Ledgerwood, A., & Sherman, J. W. (2012). Short, sweet, and problematic? The rise of the short report in psychological science. Perspectives on Psychological Science, 7, 60–66. doi:10.1177/1745691611427304
Levine, T. R., Asada, K. J., & Carpenter, C. (2009). Sample sizes and effect sizes are negatively correlated in meta-analyses: Evi-dence and implications of a publication bias against non-sig-nificant findings. Communication Monographs, 76, 286–302. doi:10.1080/03637750903074685
Light, R. J., & Pillemer, D. B. (1984). Summing up: The science of reviewing research. Cambridge, MA: Harvard University Press.
Lipsey, M. W., & Wilson, D. B. (1993). The efficacy of psychologi-cal, educational, and behavioral treatment: Confirmation from meta-analysis. American Psychologist, 48, 1181–1209.
*Lucassen, N., Tharner, A., Van IJzendoorn, M. H., Bakermans-Kranenburg, M. J., Volling, B. L., Verhulst, F. C., . . . Tiemeier, H. (2011). The association between paternal sensitivity and infant-father attachment security: A meta-analysis of three decades of research. Journal of Family Psychology, 25, 986–992. doi: 10.1037/a0025855
Mahoney, M. J. (1976). Scientist as subject: The psychological imperative. Cambridge, MA: Ballinger.
Mahoney, M. J. (1977). Publication prejudices: An experimental study of confirmatory bias in the peer review system. Cognitive Therapy and Research, 1, 161–175.
Marszalek, J. M., Barber, C., Kohlhart, J., & Holmes, C. B. (2011). Sample size in psychological research over the past 30 years. Perceptual & Motor Skills, 112, 331–348. doi:10.2466/03.11.pms .112.2.331-348
at Statsbiblioteket on November 12, 2012pps.sagepub.comDownloaded from
554 Bakker et al.
Maxwell, S. E. (2004). The persistence of underpowered studies in psychological research: Causes, consequences, and remedies. Psy-chological Methods, 9, 147–163. doi:10.1037/1082-989x.9.2.147
McCall, R. B., & Carriger, M. S. (1993). A meta-analysis of infant habituation and recognition memory performance as predictors of later IQ. Child Development, 64, 57–79.
Meehl, P. E. (1978). Theoretical risks and tabular asterisks: Sir Karl, Sir Ronald, and the slow progress of soft psychology. Journal of Consulting and Clinical Psychology, 46, 806–834.
Meyer, G. J., Finn, S. E., Eyde, L. D., Kay, G. G., Moreland, K. L., Dies, R. R., . . . Reed, G. M. (2001). Psychological test-ing and psychological assessment: A review of evidence and issues. American Psychologist, 56, 128–156. doi:10.1037/0003-066X.56.2.128
*Mol, S. E., & Bus, A. G. (2011). To read or not to read: A meta-analysis of print exposure from infancy to early adulthood. Psy-chological Bulletin, 137, 267–296. doi: 10.1037/a0021890
Nelson, N., Rosenthal, R., & Rosnow, R. L. (1986). Interpretation of significance levels and effect sizes by psychological researchers. American Psychologist, 41, 1299–1301.
Nickerson, R. S. (2000). Null hypothesis significance testing: A review of an old and continuing controversy. Psychological Methods, 5, 241–301.
Prinz, F., Schlange, T., & Asadullah, K. (2011). Believe it or not: How much can we rely on published data on potential drug tar-gets? Nature Reviews Drug Discovery, 10, 712–713. doi:10.1038/nrd3439-c1
Richard, F. D., Bond, C. F., & Stokes-Zoota, J. J. (2003). One hun-dred years of social psychology quantitatively described. Review of General Psychology, 7, 331–363.
Rosenthal, R. (1979). The file drawer problem and tolerance for null results. Psychological Bulletin, 86, 638–641.
Rozeboom, W. W. (1960). The fallacy of the null hypothesis signifi-cance test. Psychological Bulletin, 57, 416–428.
Shadish, W. R., Doherty, M., & Montgomery, L. M. (1989). How many studies are in the file drawer? An estimate from the family marital psychotherapy literature. Clinical Psychology Review, 9, 589–603.
Simmons, J. P., Nelson, L. D., & Simonshon, U. (2011). False-pos-itive psychology: Undisclosed flexibility in data collection and analysis allows presenting anything as significant. Psychological Science, 22, 1359–1366. doi:10.1177/0956797611417632
Sterba, S. K. (2006). Misconduct in the analysis and reporting of data: Bridging methodological and ethical agendas for change. Ethics & Behavior, 16, 305–318.
Sterling, T. D. (1959). Publication decisions and their possible effects on inferences drawn from tests of significance—Or vice versa. Journal of the American Statistical Association, 54, 30–34.
Sterling, T. D., Rosenbaum, W. L., & Weinkam, J. J. (1995). Pub-lication decisions revisited: The effect of the outcome of statis-tical tests on the decision to publish and vice versa. American Statistician, 49, 108–112. Retrieved from http://www.jstor.org/stable/2684823
Sterne, J. A. C., & Egger, M. (2005). Regression methods to detect publication and other bias in meta-analysis. In H. R. Rothstein, A. J. Sutton, & M. Borenstein (Eds.), Publication bias in meta-analysis: Prevention, assessment and adjustments (pp. 99–110). New York, NY: Wiley.
Tett, R. P., Meyer, J. P., & Roese, N. J. (1994). Applications of meta-analysis: 1987-1992. International Review of Industrial and Organizational Psychology, 9, 71–112.
Tversky, A., & Kahneman, D. (1971). Belief in the law of small numbers. Psychological Bulletin, 76, 105–110. doi: 10.1037/h0031322
Vul, E., Harris, C., Winkielman, P., & Pashler, H. (2009). Puzzlingly high correlations in fMRI studies of emotion, personality, and social cognition. Perspectives on Psychological Science, 4, 274–290. doi:10.1111/j.1745-6924.2009.01125.x
Wagenmakers, E. J. (2007). A practical solution to the pervasive problems of p values Psychonomic Bulletin & Review, 14, 779–804.
Wagenmakers, E. J., Wetzels, R., Borsboom, D., & van der Maas, H. L. J. (2011). Why psychologists must change the way they analyze their data: The case of psi: Comment on Bem (2011). Journal of Personality and Social Psychology, 100, 426–432.
Wetzels, R., Matzke, D., Lee, M. D., Rouder, J. N., Iverson, G. J., & Wagenmakers, E. J. (2011). Statistical evidence in experimental psychology: An empirical comparison using 855 t tests. Perspec-tives on Psychological Science, 6, 291–298.
Wicherts, J. M., Bakker, M., & Molenaar, D. (2011). Willingness to share research data is related to the strength of the evidence and the quality of reporting of statistical results. PLoS ONE, 6, e26828. doi:10.1371/journal.pone.0026828
*Woodin, E. M. (2011). A two-dimensional approach to relationship conflict: Meta-analytic findings. Journal of Family Psychology, 25, 325–335. doi: 10.1037/a0023791
*Woodley, M. A. (2011). The cognitive differentiation-integration effort hypothesis: A synthesis between the fitness indicator and life history models of human intelligence. Review of General Psychology, 15, 228–245. doi: 10.1037/a0024348
at Statsbiblioteket on November 12, 2012pps.sagepub.comDownloaded from


