
Undiscovered Resources Largest Undiscovered Field
MFS Prob. Oil (MMBO)
(0-1) F95 F50 F5 Mean F95 F50 F5 Mean F95 F50 F5 Mean F95 F50 F5 Mean
Oil Fields 10 0 0 0 0 0 0 0 0 0 0 0 0 NA NA NA NA
Gas Fields 60 2,284 7,671 16,498 8,328 93 328 770 367 542 1,343 3,375 1,560
Total 1.00 0 0 0 0 2,284 7,671 16,498 8,328 93 328 770 367
1.00
Petrel, Assessment Unit 39100201Assessment Results Summary
[MMBO, million barrels of oil. BCFG, billion cubic feet of gas. MMBNGL, million barrels of natural gas liquids. MFS, minimum field size assessed (MMBO or BCFG). Prob., probability (including both geologic and accessibility probabilities) of at least one field equal to or greater than the MFS. Results shown are fully risked estimates. For gas fields, all liquids are included under the NGL (natural gas liquids) category. F95 represents a 95 percent chance of at least the amount tabulated. Other fractiles are defined similarly. Fractiles are additive under the assumption of perfect
positive correlation. Shading indicates not applicable]
Field Type Gas (BCFG) NGL (MMBNGL) (MMBO or BCFG)

39100201Petrel
Monte Carlo Results
Forecast: Gas in Gas Fields
Summary:Display range is from 0.00 to 20,000.00 BCFGEntire range is from 208.26 to 28,912.65 BCFGAfter 50,000 trials, the standard error of the mean is 19.71
Statistics: ValueTrials 50000Mean 8,327.70Median 7,671.06Mode ---Standard Deviation 4,406.77Variance 19,419,663.76Skewness 0.63Kurtosis 2.94Coefficient of Variability 0.53Range Minimum 208.26Range Maximum 28,912.65Range Width 28,704.39Mean Standard Error 19.71
Frequency Chart
BCFG
.000
.005
.010
.015
.020
0
245.7
491.5
737.2
983
0.00 5,000.00 10,000.00 15,000.00 20,000.00
50,000 Trials 458 Outliers
Forecast: Gas in Gas Fields
Page 1

39100201Petrel
Monte Carlo Results
Forecast: Gas in Gas Fields (cont'd)
Percentiles:
Percentile BCFG100% 208.26
95% 2,283.9490% 3,082.9285% 3,741.0480% 4,331.6975% 4,891.0770% 5,416.8165% 5,966.0860% 6,526.1555% 7,080.0950% 7,671.0645% 8,295.8340% 8,949.8235% 9,625.6430% 10,379.5825% 11,213.3320% 12,163.4915% 13,230.9910% 14,541.10
5% 16,497.570% 28,912.65
End of Forecast
Page 2

39100201Petrel
Monte Carlo Results
Forecast: NGL in Gas Fields
Summary:Display range is from 0.00 to 1,000.00 MMBNGLEntire range is from 7.16 to 1,684.32 MMBNGLAfter 50,000 trials, the standard error of the mean is 0.95
Statistics: ValueTrials 50000Mean 366.55Median 328.30Mode ---Standard Deviation 211.96Variance 44,928.02Skewness 0.92Kurtosis 3.82Coefficient of Variability 0.58Range Minimum 7.16Range Maximum 1,684.32Range Width 1,677.16Mean Standard Error 0.95
Frequency Chart
MMBNGL
.000
.006
.011
.017
.022
0
275.2
550.5
825.7
1101
0.00 250.00 500.00 750.00 1,000.00
50,000 Trials 430 Outliers
Forecast: NGL in Gas Fields
Page 3

39100201Petrel
Monte Carlo Results
Forecast: NGL in Gas Fields (cont'd)
Percentiles:
Percentile MMBNGL100% 7.16
95% 93.3690% 127.5685% 153.6280% 179.8675% 203.9470% 228.2365% 252.6160% 276.8755% 302.1150% 328.3045% 355.9340% 384.9735% 416.3630% 450.8925% 491.3520% 535.5415% 589.6410% 660.94
5% 770.130% 1,684.32
End of Forecast
Page 4

39100201Petrel
Monte Carlo Results
Forecast: Largest Gas Field
Summary:Display range is from 0.00 to 4,000.00 BCFGEntire range is from 121.96 to 4,999.28 BCFGAfter 50,000 trials, the standard error of the mean is 3.92
Statistics: ValueTrials 50000Mean 1,559.83Median 1,343.06Mode ---Standard Deviation 876.91Variance 768,968.64Skewness 1.27Kurtosis 4.60Coefficient of Variability 0.56Range Minimum 121.96Range Maximum 4,999.28Range Width 4,877.33Mean Standard Error 3.92
Frequency Chart
BCFG
.000
.006
.013
.019
.025
0
318
636
954
1272
0.00 1,000.00 2,000.00 3,000.00 4,000.00
50,000 Trials 1,133 Outliers
Forecast: Largest Gas Field
Page 5
39100201Petrel
Monte Carlo Results
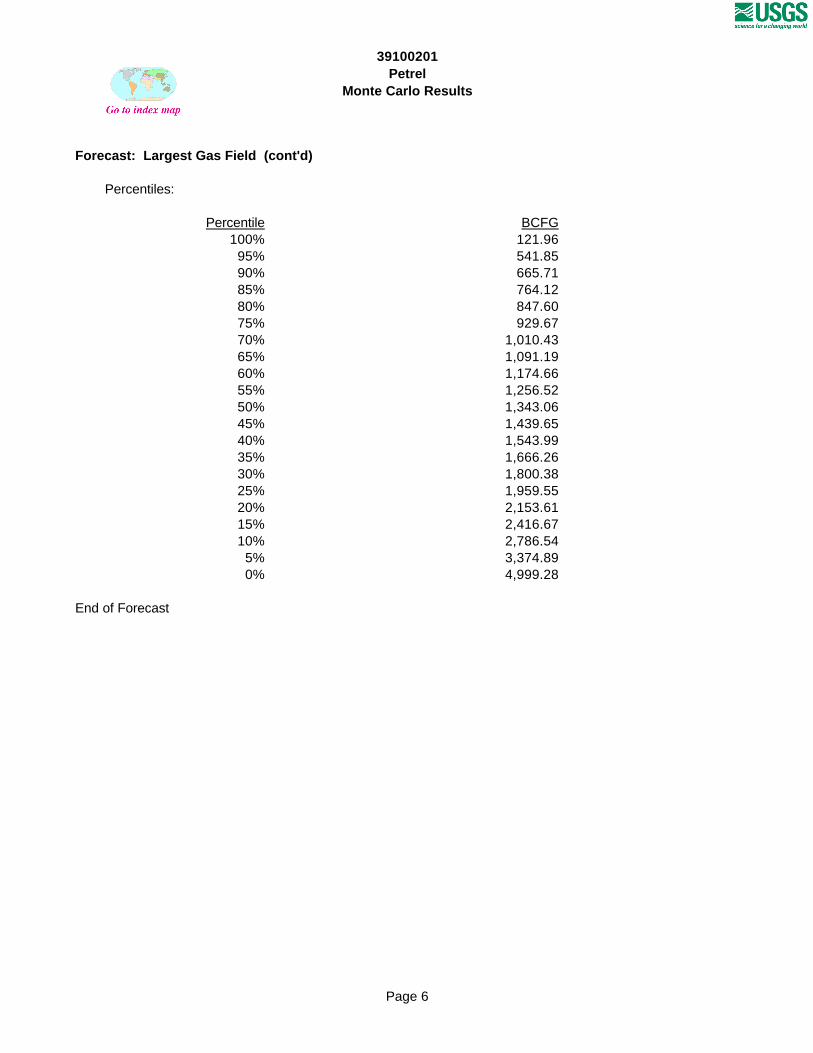
Forecast: Largest Gas Field (cont'd)
Percentiles:
Percentile BCFG100% 121.96
95% 541.8590% 665.7185% 764.1280% 847.6075% 929.6770% 1,010.4365% 1,091.1960% 1,174.6655% 1,256.5250% 1,343.0645% 1,439.6540% 1,543.9935% 1,666.2630% 1,800.3825% 1,959.5520% 2,153.6115% 2,416.6710% 2,786.54
5% 3,374.890% 4,999.28
End of Forecast
Page 6

39100201Petrel
Monte Carlo Results
Assumptions
Assumption: Number of Gas Fields
Triangular distribution with parameters:Minimum 2Likeliest 13Maximum 50
Selected range is from 2 to 50Mean value in simulation was 22
Assumption: Sizes of Gas Fields
Lognormal distribution with parameters: Shifted parametersMean 331.26 391.26Standard Deviation 473.10 473.1
Selected range is from 0.00 to 4,940.00 60.00 to 5,000.00Mean value in simulation was 324.09 384.09
2 14 26 38 50
Number of Gas Fields
Page 7

39100201Petrel
Monte Carlo Results
Assumption: Sizes of Gas Fields (cont'd)
Assumption: LGR in Gas Fields
Triangular distribution with parameters:Minimum 22.00Likeliest 44.00Maximum 66.00
Selected range is from 22.00 to 66.00Mean value in simulation was 44.00
End of Assumptions
Simulation started on 4/26/99 at 15:44:21Simulation stopped on 4/26/99 at 16:02:25
8.04 1,129.22 2,250.40 3,371.59 4,492.77
Sizes of Gas Fields
22.00 33.00 44.00 55.00 66.00
LGR in Gas Fields
Page 8


