Download - Petropavlovsk PLCPetropavlovsk PLC

Petropavlovsk PLCPetropavlovsk PLC
H1 2021 Financial Results
1 Sept 2021
Cautionary and Forward-looking Statements
− Some statements contained in this presentation or in documents referred to in it are or may be forward-looking statements, including references to guidance.
Such statements reflect the company’s current views with respect to future events and are subject to risks, assumptions, uncertainties and other factors
beyond the company’s control that could cause actual results to differ from those expressed in such statements. Although the company believes that such
forward-looking statements, which speak only as of the date of this presentation, are reasonable, no assurance can be given that they will prove to be correct.
Therefore, you should not place undue reliance on these statements
− There can be no assurance that the results and events contemplated by the forward-looking statements contained in this presentation will, in fact, occur. The
company will not undertake any obligation to release publicly any revisions to these forward-looking statements to reflect events, circumstances or
unanticipated events occurring after the date of this presentation, except as required by law or by any appropriate regulatory authority. Nothing in this
presentation or in documents referred to in it should be considered as a profit forecast.
− The past performance of the company and its securities is not, and should not be relied on as, a guide to the future performance of the company and its
securities
− This presentation does not constitute, or form part of or contain any invitation, recommendation or offer to any person to underwrite, subscribe for, buy, sell,
otherwise acquire, exchange or dispose of any shares or securities in the company or advise persons to do so in any jurisdiction, including, but not limited to,
the Russian Federation, nor shall it, or any part of it, form the basis of or be relied on in any connection with or act as an inducement to enter into any contract
or commitment therefore or engage in any other investment activity. In particular, this presentation and the information contained herein are not an offer of
securities for sale in the United States. This presentation does not constitute an advertisement of any securities in the Russian Federation
− No reliance may be placed for any purpose whatsoever on the information or opinions contained in this presentation or on its completeness and no liability
whatsoever is accepted for any loss howsoever arising from any use of this presentation or its contents or otherwise in connection therewith.
− The development and production plans and estimates set out herein represent the current views of the company's management. The company’s board reviews
the production estimates on an ongoing basis. All planning is subject, inter alia, to available funding and capital allocation decisions
− English law and English courts will have exclusive jurisdiction over any disputes arising from or connected with this presentation
2
3
Introduction and Overview

Company Overview
4
8.5Moz Gold produced to date
16 year
1 of only two POX plants in Russia
430 - 470koz2021e gold production guidance
(1) 31.1% equity interest, Hong Kong listed
A dual-listed Russian gold miner and processor with world-class technical capabilities
St Petersburg
- RDC Hydrometallurgy
Mining & Processing
Pioneer
Albyn
Malomir
Pokrovskiy
Moscow
- Executive Head Office
- Secondary listing on MoEx
Irkutsk
- Irgiredmet Institute
IRC Ltd. (non-core)(1)
London
- Petropavlovsk Plc
- UK Corporate Office
- LSE primary listing
Open-pit mine
Underground mine
POX Hub
Analytical labs
R&D
Offices
Average mine life
Blagoveshchensk
- Regional Competence Centre
- Regis Exploration
- Kapstroi Construction

H1 2021 Overview
5
Positive bottom line notwithstanding reduced H1 production volumes. Downward production trend to reverse in H2 due to the processing of increasing volumes of Pioneer refractory ore and stable production from Malomir and Albyn (Elginskoye)
Production
− Own gold output -26% vs. H1 2020 due to
shift in processing more complex
Elginskoye ore + shutdown of Pioneer
processing plant ahead of flotation launch
and related switch to mining / stockpiling
refractory material
− 3rd party gold volumes -66% vs. H1 2020
due to expected lower volumes / grades of
concentrate available for purchase
− Lower revenue + EBITDA due to reduced gold production / sales volumes
− H1 net profit of US$49m (vs. US$22m loss in H1 2020) including some non-cash items(1)
− Own TCC +13% higher due to lower grades / recoveries, inflation and effect of mining tax rates, but at lower end of FY guided range (US$870 – US$970/oz)
− c.US$136m of notes bought back using low
interest rate Gazprombank loan
− Interest-bearing gold prepays down to
US$37m vs. US$64m as at 31 Dec 2020 (to
be fully settled by year end)
− Outstanding debt principal of US$573m (31
Dec 2020: US$538m), increase due to use of
the RCF for day-to-day working capital needs
instead of gold prepays
− Pioneer flotation facility launched ahead of
schedule on 31 May 2021, with a target of
60Kt of flotation concentrate to be
produced in 2021
− Malomir flotation plant expansion
progressing as scheduled for Q3 2022
commissioning (will increase combined
group flotation capacity to 9.0Mtpa)
− Zero work-related fatal injuries
− LTIFR: 1.75 (H1 2020: 1.23) due to more
rigorous reporting methodology, with a
positive monthly trend as year progresses
− COVID-19: no material operational impact,
supply chains remain fully functional, 47%
of mine employees fully vaccinated(2)
− No major environmental incidents
Financials Balance Sheet & Liquidity
Development Work Health, Safety, Environment Outlook
− Stronger H2 expected with increased contribution from Pioneer (refractory ore processing) and stable production from Malomir and Albyn (Elginskoye)
− FY 2021 production and cost guidance remains unchanged
− Company to present new strategy and development plan at a capital markets day in Oct 2021
01 02 03
04 05 06
(1) US$31.6m fair-value non-cash loss in relation to the agreement to sell IRC stake, a US$32.0m fair value non-cash gain from re-measurement of the conversion option of the convertible and US$34.9m reversal of write-down in relation to IRC’s reclassification as an asset held for sale, following the board’s decision to approve the potential disposal of 29.9% of the group’s investment in IRC (2) As at 23 Aug 2021

H1 2021 Operational Performance
6
H1 2021 vs. H1 2020 production by operation
Lower own gold production due to switch to processing more challenging refractory ore at Elginskoye (Albyn) and preparations for the launch of flotation facility at Pioneer, including a temporary shutdown of plant in Apr and mining / stockpiling of refractory ore
Koz -39%
Total
0
50
100
150
200
250
300
350
H1 2020 H1 2021 H1 2020 H1 2021 H1 2020 H1 2021 H1 2020 H1 2021 H1 2020 H1 2021
106.9
71.8
36.7
60.3
81.6
46.0
Reduced availability of 3rd
party concentrate + lower
concentrate grades, in line with
budget
38Kt at 31g/t treated in H1
2021 vs. 55Kt at 60g/t in H1
2020
Refractory performance in-
line with expectations with
76Kt of concentrate treated
at 28.5g/t, similar to H1
2020. In terms of non-
refractory processing, 2021
is the last year of non-
refractory production at
Malomir
Following depletion of Albyn
deposit, Albyn RIP plant now
processing more challenging
Elginskoye ore
Recoveries are also lower:
H1 2021 87% vs. 94% H1
2020
Lower volumes of non-refractory ore milled, alongside lower recovery rates (80%), partially due to conversion of a section of the Pioneer processing plant to process flotation concentrate from June onwards
-66%-41%-14%
AlbynPioneer 3rd Party ConcentrateMalomir
320.6
195.0
70.1
42.3
-24%
POX RIP
Avg grade:
60g/tAvg grade:
31g/t

0
20
40
60
80
100
120
Q1 2020 Q2 2020 Q3 2020 Q4 2020 Q1 2021 Q2 2021 Q3 2021e Q4 2021e
Own Gold Recovered Q1 2020 – Q4 2021
7
H2 2021 should see a reversal of the downward trend in own gold output, ongoing since 2019 as non-refractory resources have been depleted, assisted by the launch of the Pioneer flotation plant at the end of May 2021
kozH1: lower grades / recoveries
at Pioneer (higher grade
refractory ore stockpiled in
advance of flotation launch) +
switch to Elginskoye following
depletion of Albyn main pit
Pioneer
flotation
impact
Refractory Non-Refractory

0
20
40
60
80
100
120
Q1 2020 Q2 2020 Q3 2020 Q4 2020 Q1 2021 Q2 2021 Q3 2021e Q4 2021e
Increasing POX Utilisation
8
Concentrates from our own flotation plants represent a growing proportion of supplies to the POX plant and are increasing POXcapacity utilisation
Kt
3rd Party Own Mined
c.50%
c.100%
52%
48%
66%
34%
60%
40%
59%
41%64%
36%
72%
28%88%
12%
87%
13%
Utilisation
Pioneer
flotation
impact

Pioneer Flotation Plant Launch
Commissioned on 31 May 2021, slightly ahead of mid-year target. New 3.6Mtpa flotation facility enables the group to process abundant refractory resources at Pioneer, where 5.3Moz (72%) of JORC Resources are refractory in nature
9
− 2 x 1.8Mtpa lines = 3.6Mtpa nominal processing capacity → transformation
of Pioneer into a predominantly refractory gold producing asset
− Fully operational from July 2021, with c.60Kt of refractory concentrate
expected to be produced in 2021
− Increasing flotation concentrate production capacity will enable
Petropavlovsk to process and monetise more of its own refractory material
through processing at the POX Hub, decreasing reliance on low-margin 3rd
party concentrate
100% 100%
64%
37%
16%
36%
63%
84%
2019 2020 2021e 2022e 2023e
Non-refractory Refractory
Pioneer production split evolution: refractory vs. non-refractory

10
Pre-feasibility studies are currently underway on adding flotation capacity to the Albyn cluster which, following the Pioneer flotation launch and Malomir expansion, could become the Company’s third source of refractory gold concentrate for POX.
(1) As at 31 Dec 2020, on a consolidated basis
Albyn: Potential Future Source of Flotation Concentrate
Including: Elginskoye JORC Resources (1)
Refractory Resources
Non-Refractory Resources
1.4Moz
33%
2.8Moz
67%
4.2 Moz
at 1.1g/t
0.9Moz
43%
1.3Moz
57%
2.2 Moz
at 1.0g/t
Albyn Cluster JORC Resources(1)
− Albyn, Elginskoye, Unglichikan,
− From 2021, Elginskoye replaced the depleted Albyn pit as the main source of ore for the Albyn processing plant
− Initial studies indicate that an increasing portion of Elginskoye ore body appears to respond better to gravity-flotation-POX vs. traditional processing
− In 2021, c.US$10m will be spent at Albyn on exploration, to convert resources to reserves, to complete technical mapping, and to better understand the nature of the Elginskoye ore body
− Material changes to be expected to current production plan at Albyn
− Options being studied include:
− Converting part of the existing plant at Albyn to concentrate refractory ores prior to transportation to POX for further processing / gold recovery
− Construction of a flotation plant at Elginskoye
Albyn
Unglichikan
Afanasevskoye
Elginskoye
10km

Own TCC Breakdown
Own gold TCC +13%, reflecting -26% decline in own gold sold, lower processed grades / recoveries, cost inflation and higher mining taxes due to higher realized gold prices and expiration of tax relief at Albyn, partially mitigated by RUB depreciation
US$/oz
11
800
4541
32 26 5 42
906
TCCH1 2020
Higher mining taxes Effect of change ingrades / recoveries
Higher costs COVID-19related costs
Other taxes FX TCCH1 2021
Note: figures may not sum up due to effect of rounding
Reflects higher realised
gold price + full mining tax
rate applied at Albyn vs.
1.2% in H1 2020
Inflation of certain RUB
denominated inputs +
increase in the proportion
of gold from refractory ore
in total own material
Avg. period-on-period
RUB:USD depreciation of
c.7%
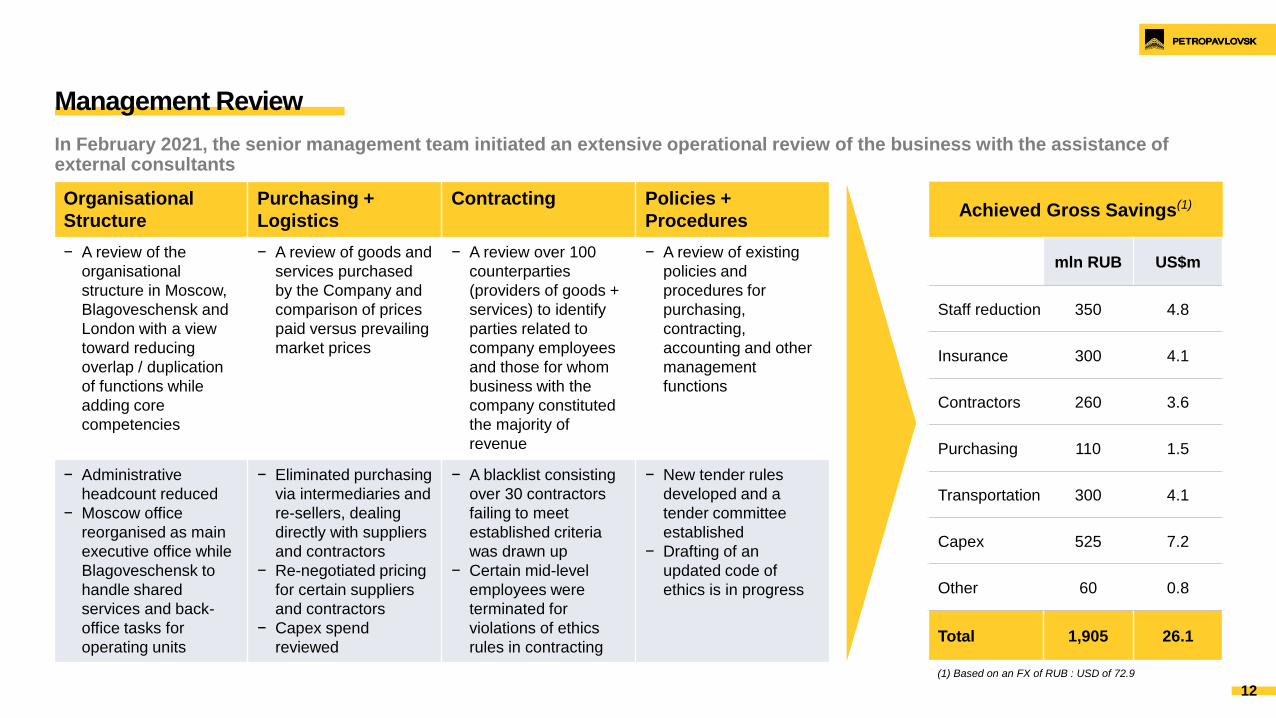
Management Review
12
Organisational
Structure
Purchasing +
Logistics
Contracting Policies +
Procedures
− A review of the
organisational
structure in Moscow,
Blagoveschensk and
London with a view
toward reducing
overlap / duplication
of functions while
adding core
competencies
− A review of goods and
services purchased
by the Company and
comparison of prices
paid versus prevailing
market prices
− A review over 100
counterparties
(providers of goods +
services) to identify
parties related to
company employees
and those for whom
business with the
company constituted
the majority of
revenue
− A review of existing
policies and
procedures for
purchasing,
contracting,
accounting and other
management
functions
− Administrative
headcount reduced
− Moscow office
reorganised as main
executive office while
Blagoveschensk to
handle shared
services and back-
office tasks for
operating units
− Eliminated purchasing
via intermediaries and
re-sellers, dealing
directly with suppliers
and contractors
− Re-negotiated pricing
for certain suppliers
and contractors
− Capex spend
reviewed
− A blacklist consisting
over 30 contractors
failing to meet
established criteria
was drawn up
− Certain mid-level
employees were
terminated for
violations of ethics
rules in contracting
− New tender rules
developed and a
tender committee
established
− Drafting of an
updated code of
ethics is in progress
Achieved Gross Savings(1)
mln RUB US$m
Staff reduction 350 4.8
Insurance 300 4.1
Contractors 260 3.6
Purchasing 110 1.5
Transportation 300 4.1
Capex 525 7.2
Other 60 0.8
Total 1,905 26.1
(1) Based on an FX of RUB : USD of 72.9
In February 2021, the senior management team initiated an extensive operational review of the business with the assistance of external consultants

Cost Saving Examples
13
Making purchases via competitive tender and / or directly from suppliers and manufacturers without the use of intermediaries will result in material future cost savings across the business
Transport: Road Fleet
‒ Transit LLC(1) previously leased its fleet of trucks,
tippers, trailers and trailer cisterns from a contractor
‒ By purchasing the necessary fleet instead of
leasing it via the intermediary, Transit will save
c.RUB 300m (US$4.1m) over the next 2 yrs
Transport: Rail Cars
− Transit LLC(1) previously leased rail cars from a
contractor who, in turn, leased them from a major
freight forwarding company.
− By leasing rail freight cars directly from the
supplier will save c.20% in costs and c.RUB 100m
(US$1.4m) annually
Fuel
− Purchasing diesel directly from the largest
suppliers (GazpromNeft, Rosneft), without
intermediaries is expected to yield annual savings
of c.RUB 160m (US$2.2m)
Chemicals
− Having solicited competitive quotes form various
suppliers, including overseas, the company entered
into a 2-year direct contract for the supply of
sodium cyanide at an annual savings of c.RUB
60m (US$820k)
Moving purchasing to a
dedicated online
procurement and tender
platform will save up to
c.RUB 500m
(US$6.8m) annually
in the future
(1) Transit LLC is a fully-owned Petropavlovsk subsidiary responsible for the delivery of flotation concentrate to the POX Hub and transportation of cargo around the group’s sites
Based on an FX of RUB : USD of 72.9

ESG

15
Diverse and experienced board, with the search for additional independent non-executive directors in progress
− Appointed as an INED in Oct 2018 and as Chairman in Aug 2020
− A US qualified lawyer, MrCameron has extensive international experience, providing expertise and consulting services for companies particularly in the natural resources sector within Russia and the former Soviet Union, since 1988
− Formerly Founder, CEO and Chairman of Occupational Urgent Care Systems Inc., a company traded on the NASDAQ until its sale in 1992
− Appointed as an INED in Nov 2019 and as Snr. independent NED in Aug 2020
− Ms Philipps is a qualified lawyer with extensive natural resources sector corporate finance and transactional experience across CIS / CMEA
− Member of the Strategy / Investment Committee at Inter RAO
− Member of the Advisory Board of CAPTIS Intelligence Inc.
− Previously held senior positions at EBRD and AIG Russia Century Fund
Independent Directors
Key:
Non-Executive Director
Board of Directors
− Appointed as an INED in Aug 2020
− Over 40 years of experience in a range of technical, commercial and managerial roles with leading companies in the mining and steel industries
− Currently lead independent NED at JSW Steel Ltd., a leading Indian steel company
− Prior to this, Mr Mukherjee held a variety of senior positions at Arcelor Mittal (Snr. Executive VP and alsoMember of the Group Management Board) and Essar Steel Global (CEO)
− Appointed as an INED in Apr 2021
− Over 25 years of commercial experience with significant expertise in internal controls, governance, corporate law and M&A transactions, including in resources sector and in Russia
− Joined the Board of Bank Trust in 2018 and served as Chairman of Audit Committee since 2019
− Prior to this, Mr Irzhevsky was VP for Legal Affairs at PJSC Rostelecom from 2013 to 2018 and in 2016 – 2017 served on its Board
Malay Mukherjee
Independent Non-Executive Director
Mikhail Irzhevsky
Independent Non-Executive Director
Charlotte Philipps
Senior Independent Non-Executive Director
‒ Petropavlovsk has engaged an external consultant to assist with the search and appointment of new board members. The intended final composition of the board will comprise of a minimum of seven Directors, the majority of whom will be independent
James W Cameron Jr
Non-Executive Chairman
− Appointed as NED in Jul 2021, nominated by UGC, Petropavlovsk’s largest shareholder
− Currently serves as vice president for development and strategy at Uzhuralzoloto, a role he has held since 2020
− Mr Potapov has held a series of senior executive positions in major natural resources companies, including coal producer Vostsibugol, steelmakers Evraz Group and Industrial Union of Donbass, Norilsk Nickel, fertilizer giant Uralkali and iron ore producer Metalloinvest
Evgeny Potapov
Non-Executive Director
INED = Independent Non-Executive Director
NED = Non-Executive Director
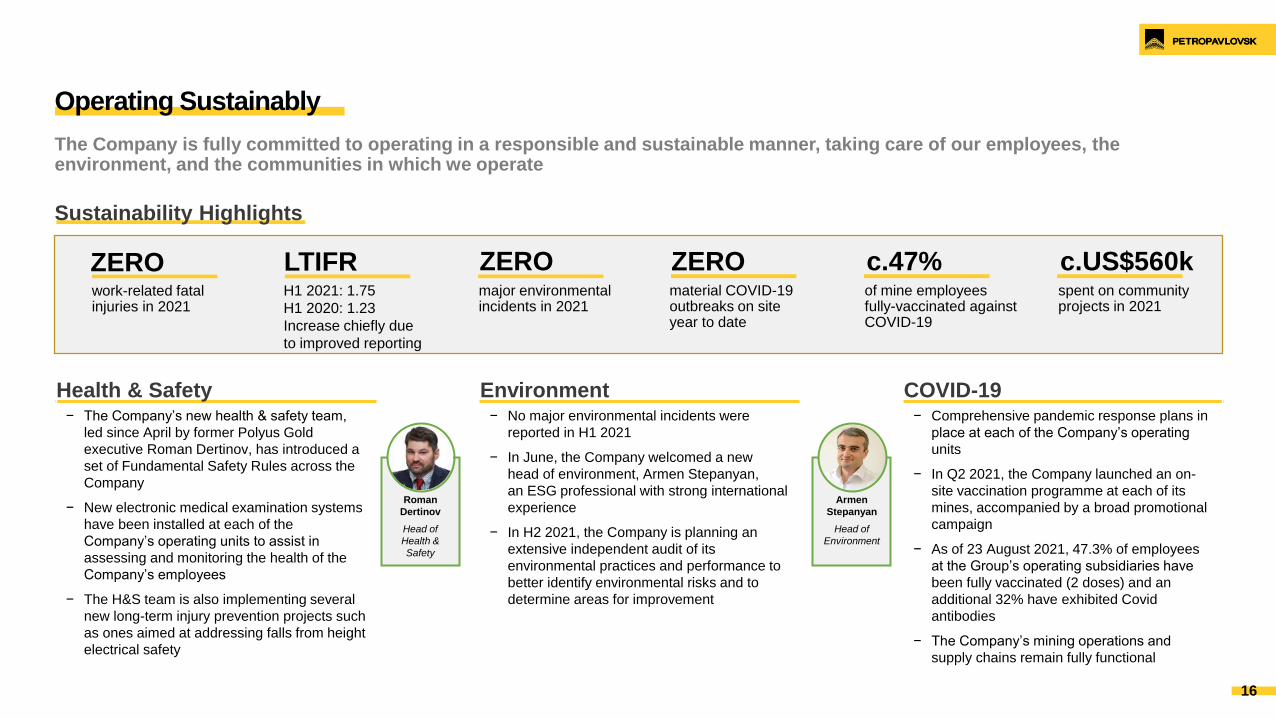
Health & Safety Environment COVID-19− The Company’s new health & safety team,
led since April by former Polyus Gold
executive Roman Dertinov, has introduced a
set of Fundamental Safety Rules across the
Company
− New electronic medical examination systems
have been installed at each of the
Company’s operating units to assist in
assessing and monitoring the health of the
Company’s employees
− The H&S team is also implementing several
new long-term injury prevention projects such
as ones aimed at addressing falls from height
electrical safety
− No major environmental incidents were
reported in H1 2021
− In June, the Company welcomed a new
head of environment, Armen Stepanyan,
an ESG professional with strong international
experience
− In H2 2021, the Company is planning an
extensive independent audit of its
environmental practices and performance to
better identify environmental risks and to
determine areas for improvement
− Comprehensive pandemic response plans in
place at each of the Company’s operating
units
− In Q2 2021, the Company launched an on-
site vaccination programme at each of its
mines, accompanied by a broad promotional
campaign
− As of 23 August 2021, 47.3% of employees
at the Group’s operating subsidiaries have
been fully vaccinated (2 doses) and an
additional 32% have exhibited Covid
antibodies
− The Company’s mining operations and
supply chains remain fully functional
Operating Sustainably
16
The Company is fully committed to operating in a responsible and sustainable manner, taking care of our employees, the environment, and the communities in which we operate
Sustainability Highlights
ZEROwork-related fatal injuries in 2021
LTIFRH1 2021: 1.75
H1 2020: 1.23
Increase chiefly due
to improved reporting
ZEROmajor environmental incidents in 2021
ZEROmaterial COVID-19 outbreaks on site year to date
c.47%of mine employees fully-vaccinated against COVID-19
c.US$560kspent on community projects in 2021
Roman
Dertinov
Head of
Health &
Safety
Armen
Stepanyan
Head of
Environment

H2 2021 Outlook

2021 Guidance: Production and Costs
Total 2021 output of 430 to 470koz at own gold TCC of US$870/oz to US$970/oz
18
Production (koz) Total Cash Costs (US$/oz, unless stated otherwise)
2021e 2020a 2021 vs. 2020 Explanation 2021e 2020a 2021 vs. 2020 Explanation
Malomir 140 – 145 140 =Processing volumes, grades + recoveries
broadly in line with 2020760 – 860 761 ▲
Mining vols up 30% yoy, along with higher stripping
ratio + slightly lower grades to be processed at plant
Pioneer 135 – 140 119 ▲
Production increase vs. 2020 driven by
higher grades + launch of 3.6Mtpa
flotation plant
1,100 – 1,200 1,092 ▲
Higher processing costs as Pioneer starts processing
refractory ore via flotation, partially offset by lower
mining costs
Albyn 95 – 105 127 ▼
Lower volumes / recoveries resulting
from switch to processing more complex
Elginskoye ore
690 - 790 727 =
Reduced yoy production + higher costs due to
increased mining + processing expense associated
with challenging composition of Elginskoye ore
Additional cost of transporting Elginskoye ore to Albyn
RIP plant
Own gold 370 - 390 386 = Own gold production in line with 2020 870 - 970 852 ▲
3rd party 60 - 80 163 ▼
Reduced volumes of concentrate
available for purchase + lower grades vs.
2020 high of 101Kt at 48g/t
Processing
cost:
c.US$150-170/t
US$182/t =
Updated from initial guidance of US$180/t as improved
POX capacity utilisation has more than compensated
for the effects of lower grades in concentrate
Margin:
c.US$180/oz(1) US$274/oz ▼
Updated from initial guidance of US$200/oz as margins
on 3rd party concentrate directly linked to the purchase
prices for supplies available on the market, which have
increased
Total 430 - 470 548 ▼Total output lower due to reduced 3rd
party concentrate production
(1) Based on an estimated average 2021 gold sales price of US$1,750/oz

Key 2021 Milestones
19
JulJun OctMay Q3
Pioneer Flotation
Launch3.6Mtpa flotation plant
commissioned
Capital Markets
DayStrategy update, outlook
and Q&A with key
management
Business ReviewFindings, outcomes, and
actions on the back of the
business review
commenced in Q1 2021 by
the new CEO + his team
Q2 ProductionQ2 / H1 operational
results and corporate
update
Resolution 19Publication of preliminary
findings in relation to the
forensic investigation
carried out by KPMG

H1 2021 Financial Results

H1 2021 Financial Results Overview
21
Reduced top line due to lower gold sales, with profit for the period assisted by a write-down reversal in relation to carrying value of IRC following its reclassification as an asset-held-for-sale, fair value loss on the agreement to sell IRC stake and a non-cash gain from the revaluation of the convertible bond conversion option
Units H1 2021 H1 2020 HoH Change
Gold production (own gold) Koz 158.3 213.7 -26%
Gold production (3rd party gold) Koz 36.7 106.9 -66%
Total gold production (own + 3rd party gold) Koz 195.0 320.6 -39%
Total gold sales (own + 3rd party gold) Koz 187.1 312.4 -40%
Avg. realised gold price US$/oz 1,795 1,640 +9%
Group revenue US$m 351.9 522.7 -33%
TCC (own gold) US$/oz 906 800 +13%
Cost of purchasing + processing (3rd party gold) US$/oz 1,639 1,380 +19%
Operating profit(1) US$m 48.3 144.3 -67%
Underlying EBITDA US$m 114.3 192.6 -41%
Profit / (loss) for the period US$m 48.9 (22.0) n/m
Cash generated from operations (before working capital changes) US$m 113.7 183.3 -38%
Net cash from operating activities US$m 25.2 112.1 -77%
Net debt (as at 30 Jun vs. 1 Jan 2021) US$m (535.6) (500.6) +7%
Development capex US$m 42.9 54.4 -21%
Exploration capex US$m 4.4 5.2 -15%
(1) Since the publication of the FY 2020 results, operating profit is presented from the perspective of group operations excluding results of associate IRC. This is more representative of how the business is viewed following re-classification of IRC as an asset held for sale. This change in classification also been applied to the comparative period
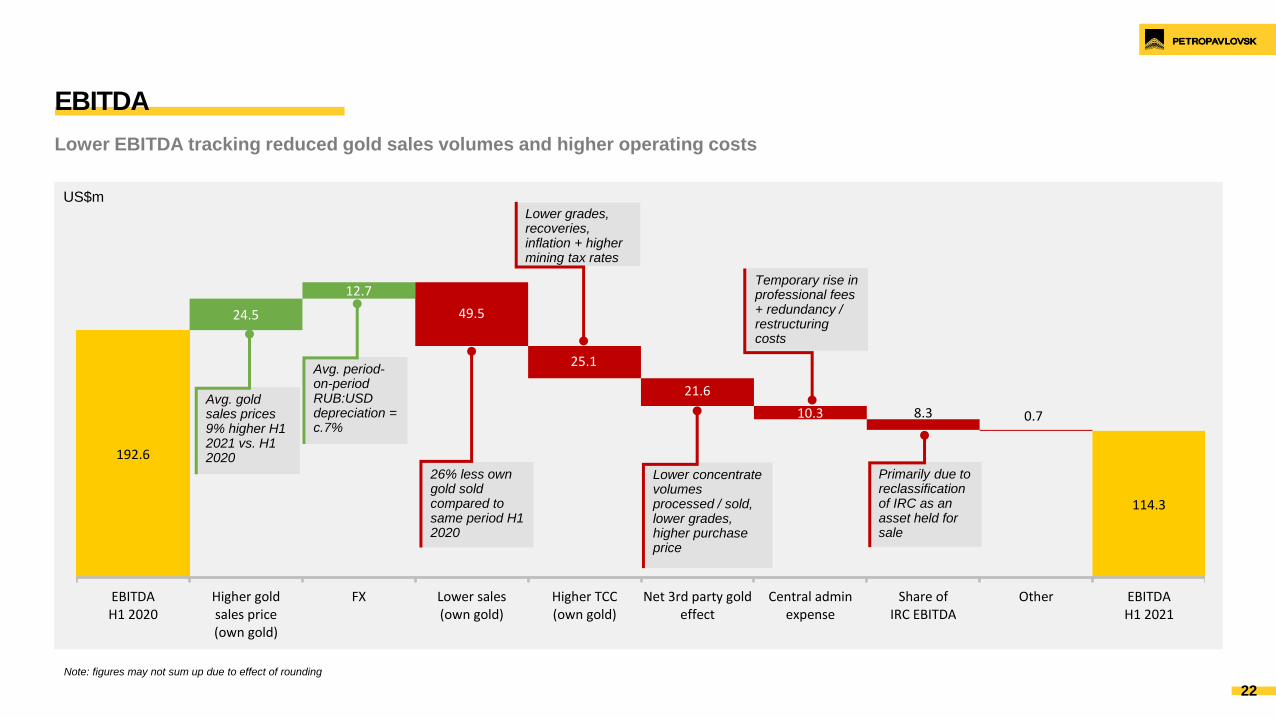
EBITDA
192.6
114.3
24.5
12.7
49.5
25.1
21.6
10.3 8.3 0.7
EBITDAH1 2020
Higher goldsales price(own gold)
FX Lower sales(own gold)
Higher TCC(own gold)
Net 3rd party goldeffect
Central adminexpense
Share ofIRC EBITDA
Other EBITDAH1 2021
Lower EBITDA tracking reduced gold sales volumes and higher operating costs
US$m
22
Note: figures may not sum up due to effect of rounding
Temporary rise in professional fees + redundancy / restructuring costs
26% less own gold sold compared to same period H1 2020
Lower grades, recoveries, inflation + higher mining tax rates
Avg. period-on-period RUB:USD depreciation = c.7%
Primarily due to reclassification of IRC as an asset held for sale
Avg. gold sales prices 9% higher H1 2021 vs. H1 2020
Lower concentrate volumes processed / sold, lower grades, higher purchase price
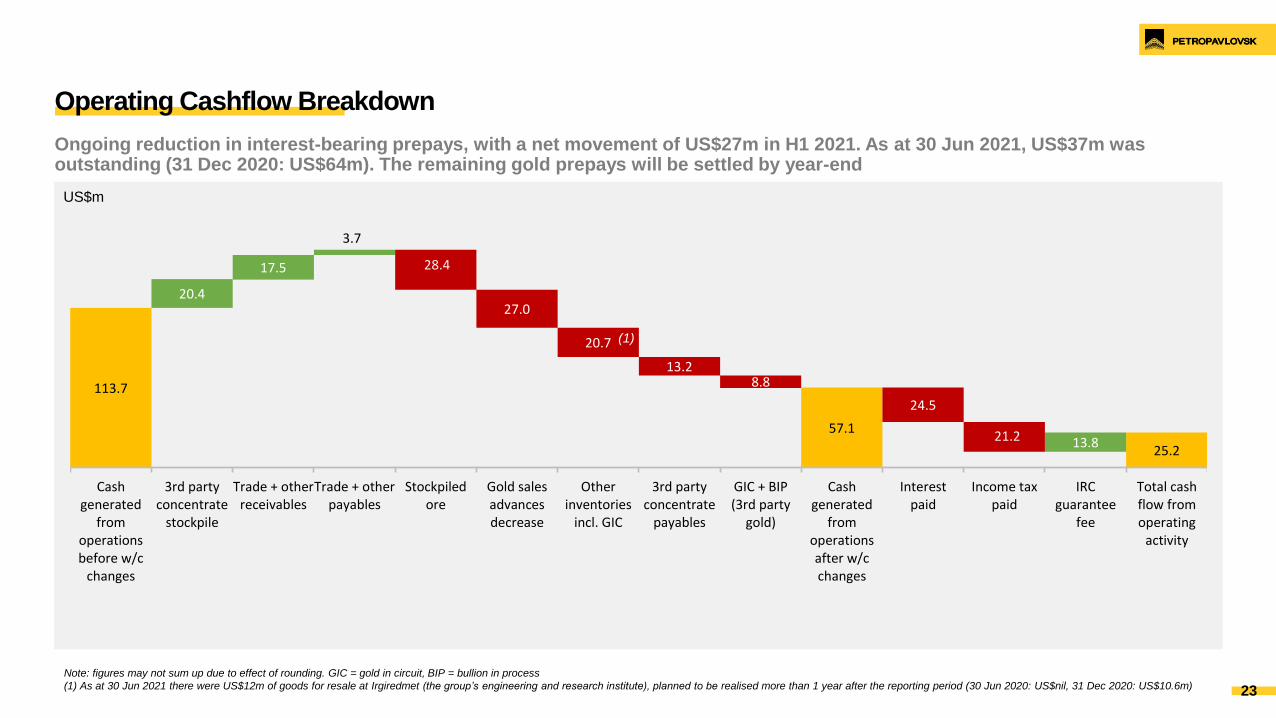
Operating Cashflow Breakdown
113.7
57.1
25.2
20.4
17.5
3.7
28.4
27.0
20.7
13.28.8
24.5
21.2 13.8
Cashgenerated
fromoperationsbefore w/c
changes
3rd partyconcentrate
stockpile
Trade + otherreceivables
Trade + otherpayables
Stockpiledore
Gold salesadvancesdecrease
Otherinventories
incl. GIC
3rd partyconcentrate
payables
GIC + BIP(3rd party
gold)
Cashgenerated
fromoperationsafter w/cchanges
Interestpaid
Income taxpaid
IRCguarantee
fee
Total cashflow fromoperating
activity
Ongoing reduction in interest-bearing prepays, with a net movement of US$27m in H1 2021. As at 30 Jun 2021, US$37m was outstanding (31 Dec 2020: US$64m). The remaining gold prepays will be settled by year-end
23
Note: figures may not sum up due to effect of rounding. GIC = gold in circuit, BIP = bullion in process
(1) As at 30 Jun 2021 there were US$12m of goods for resale at Irgiredmet (the group’s engineering and research institute), planned to be realised more than 1 year after the reporting period (30 Jun 2020: US$nil, 31 Dec 2020: US$10.6m)
US$m
(1)

Margins: Own Gold vs. 3rd Party Gold
Margins on our own gold (c.50%) are superior to margins on gold produced by buying in and processing 3rd party refractory gold concentrate (c.9%)
24
US$906/oz
US$1,639/oz
US$889/oz
US$156/oz
Own Gold 3rd PartyConcentrate
− Significantly higher margins from mining + processing refractory + non-
refractory gold from our own sources vs. purchasing 3rd party refractory
concentrate
− 3rd party concentrate margins decreased in H1 2021, due to lower
concentrate volumes supplied, lower concentrate grade content and
higher purchasing cost
TCC Margin
Margin:
50%
Margin:
9%
H1 2021 Margins: Own gold vs. 3rd Party Gold
H1 2021 average gold sales price: US$1,795/oz

Mine by Mine TCC and AISC
800
593
802
1,045906
781 822
1,148
Own Gold TCC Albyn Malomir Pioneer
1,220
718
1,141
1,4871,404
1,2941,179
1,677
AISC Albyn Malomir Pioneer
TCC (US$/oz) AISC (US$/oz)
Higher AISC reflects increased TCC and higher central admin expenses and a decrease in physical ounces sold, with sustaining capex at roughly the same level on an aggregate basis as in H1 2020
H1 2020 H1 2021 % change HoH
+32% +10% +80% +3% +13%+13% +15%+2%
Following depletion of
Albyn main pit, switch to
processing more
challenging Elginskoye ore
resulted in lower non-
refractory ore grades +
recoveries
Lower non-refractory milled
volumes + recoveries and
lower grade refractory
concentrate sent for
processing to the POX Hub
Preparation for flotation
facility launch resulted in
temporary plant shutdown
+ refractory ore stockpiling,
also lower non-refractory
ore recoveries
Higher TCC, decrease in
physical oz sold, increase
in central admin, +
increase in sustaining
exploration / development
capex, mainly in relation to
Elginskoye
Higher TCC, decrease in
physical oz sold, increase
in central admin, partly
offset by decrease in
capitalized stripping
expenditure + sustaining
capex
Higher TCC, decrease in physical oz sold, increase in central admin, impairment of gold in circuit, partly offset by decrease in capitalized stripping + sustaining capex
25

Total Capex Spend
24.1
6.8
14.1
4.2 5.2 5.2
59.6
16.7
11.3 10.8
1.54.4
2.6
47.3
Pioneer Malomir Albyn POX Exploration Other Total Capex Spend
Development capex spend was largely focused on completing the Pioneer flotation plant, expansion of the Malomir flotation plant and development and exploration work at Albyn
US$m
H1 2020 Capex H1 2021 Capex
26
Flotation plant
construction,
underground
development work,
tailings storage facility
3rd line flotation
construction, tailings
storage facility,
sustaining capex in
relation to 1st + 2nd
flotation lines
Tailings storage facility,
capitalized repairs
Exploration highlights
− Pioneer: refractory ore reserves expected to
increase
− Malomir: evaluation of high-grade ores in
underground workings along eastern flank of the
Quartzitovoye
− Elginskoye: exploration drilling programme to
better delineate deposit alongside new
technological mapping of the drilled-out area has
been completed → ore responds well to gravity-
flotation processing
-21%

H1 2021 Net Debt
25.2 0.8
500.6
47.3
12.6 1.1
535.6
Net Debtas at 1 Jan
2021
Cash fromoperations
Cash flow fromother investing,
financingactivities + FX
Capex Capitalisedstripping
Change in debt(amortised)
Net Debtas at 30 Jun
2021
US$m
27
Net debt +7% during the period, partly due to increase in the use of the RCF for day-to-day working capital needs instead of gold prepays
− Capex spend + capitalised stripping financed
by cash from operations + US$35m revolving
credit facility at interest rates of 2.8 – 4.5%
(RCF is significantly lower cost vs. existing
borrowings)
− H1 2021 Net Debt / EBITDA = 2.0x(1) (vs. 1.5x
in H1 2020)
− In July, c.US$136m of the company’s notes
were repurchased (US$364m remain
outstanding) using low interest rate
Gazprombank loan
− While Net Debt does not include the IRC
guarantee, IRC repaid US$50m to
Gazprombank in H1 2021 + settled guarantee
fees of US$13.8m to Petropavlovsk.
Outstanding IRC loan principal = US$143.5m(2)
Note: figures may not sum up due to effect of rounding
(1) Based on LTM EBITDA of US$272.4m (H2 2020 = US$158.1m + H1 2021 = US$114.3m) and 30 Jun 2021 Net Debt of US$535.6m (2) As at 27 Aug 2021

2021 2022 2023 2024
Debt Maturity Schedule and Leverage
H1 2020 fixed income debt + loan maturity schedule
Improved debt maturity profile with average cost of debt now lower vs. H1 2020
28
US$500m
Nov 2022
8.125%
US$25m US$24mUS$79m
US$38m
US$66m
2021 2022 2023 2024 2025 2026
H1 2021 fixed income debt + loan maturity schedule
Notes: US$136m was
repurchased in Jul 2021 as
part of a tender offer using low
interest rate loan
Convertible bond: as at 30 Jun 2021, US$87m has been converted into c.644m shares, US$38m remains outstanding
2022 =
US$439m
− Tender offer announced in July resulted in the buyback of c.US$136m of guaranteed notes,
using a lower interest rate loan vs. existing notes coupon
− Gazprombank RCF facility (up to US$122m), to replace gold prepays + support day-to-day
liquidity, available through to Jun 2026
US$125m
Jul 2024
8.25%
US$364m
Nov 2022
8.125%
Gazprombank Loan (2.8 – 4.5%) Gazprombank RCF (2.8 – 4.5%)Key: Guaranteed Notes Convertible Bond RCF facility available for drawdown (up to US$122m, 2.8 – 4.5%)
US$82m US$113m US$122m US$122m US$122m US$122m


