PEW RESEARCH CENTER
FOR RELEASE January 24, 2019
FOR MEDIA OR OTHER INQUIRIES:
Carroll Doherty, Director of Political Research
Jocelyn Kiley, Associate Director, Research
Bridget Johnson, Communications Manager
202.419.4372
www.pewresearch.org
RECOMMENDED CITATION
Pew Research Center, January, 2019, “Public’s
2019 Priorities: Economy, Health Care, Education
and Security All Near Top of List”
PEW RESEARCH CENTER
www.pewresearch.org
About Pew Research Center
Pew Research Center is a nonpartisan fact tank that informs the public about the issues,
attitudes and trends shaping America and the world. It does not take policy positions. It
conducts public opinion polling, demographic research, content analysis and other data-driven
social science research. The Center studies U.S. politics and policy; journalism and media;
internet, science and technology; religion and public life; Hispanic trends; global attitudes and
trends; and U.S. social and demographic trends. All of the Center’s reports are available at
www.pewresearch.org. Pew Research Center is a subsidiary of The Pew Charitable Trusts, its
primary funder.
© Pew Research Center 2019
PEW RESEARCH CENTER
At the outset of Donald Trump’s third year in office, the public’s to-do list for the president and the
116th Congress spans domains
with the economy, health care
costs, education and
preventing terrorism all cited
as top priorities by majorities
of Americans.
The public’s agenda for the
president and Congress is only
modestly different from a year
ago, but it reflects a continued
evolution of the national
agenda.
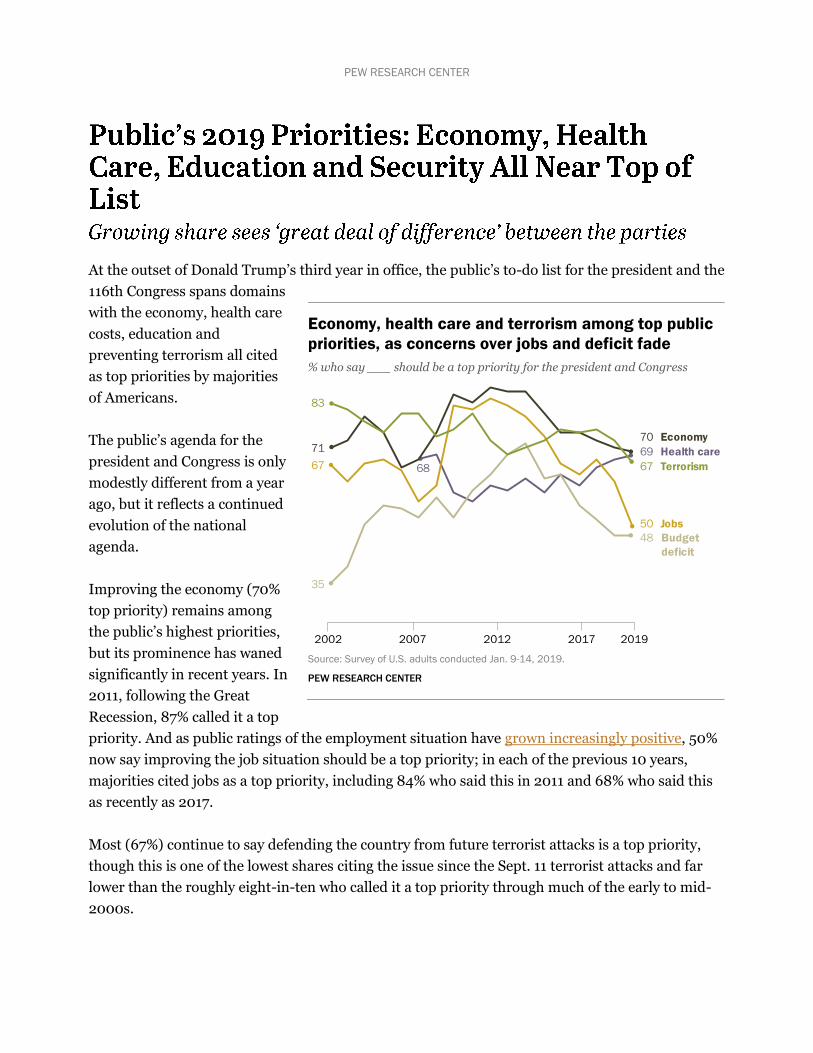
Improving the economy (70%
top priority) remains among
the public’s highest priorities,
but its prominence has waned
significantly in recent years. In
2011, following the Great
Recession, 87% called it a top
priority. And as public ratings of the employment situation have grown increasingly positive, 50%
now say improving the job situation should be a top priority; in each of the previous 10 years,
majorities cited jobs as a top priority, including 84% who said this in 2011 and 68% who said this
as recently as 2017.
Most (67%) continue to say defending the country from future terrorist attacks is a top priority,
though this is one of the lowest shares citing the issue since the Sept. 11 terrorist attacks and far
lower than the roughly eight-in-ten who called it a top priority through much of the early to mid-
2000s.
Economy, health care and terrorism among top public
priorities, as concerns over jobs and deficit fade
% who say ___ should be a top priority for the president and Congress
Source: Survey of U.S. adults conducted Jan. 9-14, 2019.
PEW RESEARCH CENTER
2
PEW RESEARCH CENTER
www.pewresearch.org
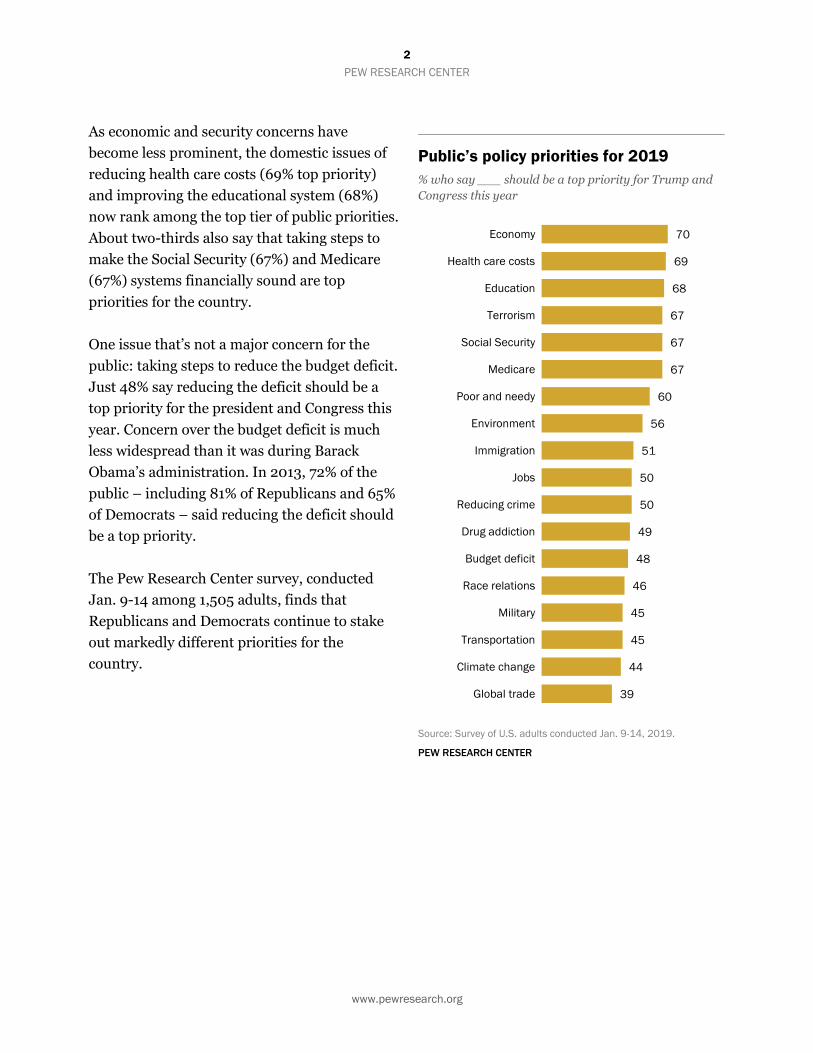
As economic and security concerns have
become less prominent, the domestic issues of
reducing health care costs (69% top priority)
and improving the educational system (68%)
now rank among the top tier of public priorities.
About two-thirds also say that taking steps to
make the Social Security (67%) and Medicare
(67%) systems financially sound are top
priorities for the country.
One issue that’s not a major concern for the
public: taking steps to reduce the budget deficit.
Just 48% say reducing the deficit should be a
top priority for the president and Congress this
year. Concern over the budget deficit is much
less widespread than it was during Barack
Obama’s administration. In 2013, 72% of the
public – including 81% of Republicans and 65%
of Democrats – said reducing the deficit should
be a top priority.
The Pew Research Center survey, conducted
Jan. 9-14 among 1,505 adults, finds that
Republicans and Democrats continue to stake
out markedly different priorities for the
country.
Public’s policy priorities for 2019
% who say ___ should be a top priority for Trump and
Congress this year
Source: Survey of U.S. adults conducted Jan. 9-14, 2019.
PEW RESEARCH CENTER
70
69
68
67
67
67
60
56
51
50
50
49
48
46
45
45
44
39
Economy
Health care costs
Education
Terrorism
Social Security
Medicare
Poor and needy
Environment
Immigration
Jobs
Reducing crime
Drug addiction
Budget deficit
Race relations
Military
Transportation
Climate change
Global trade
3
PEW RESEARCH CENTER
www.pewresearch.org
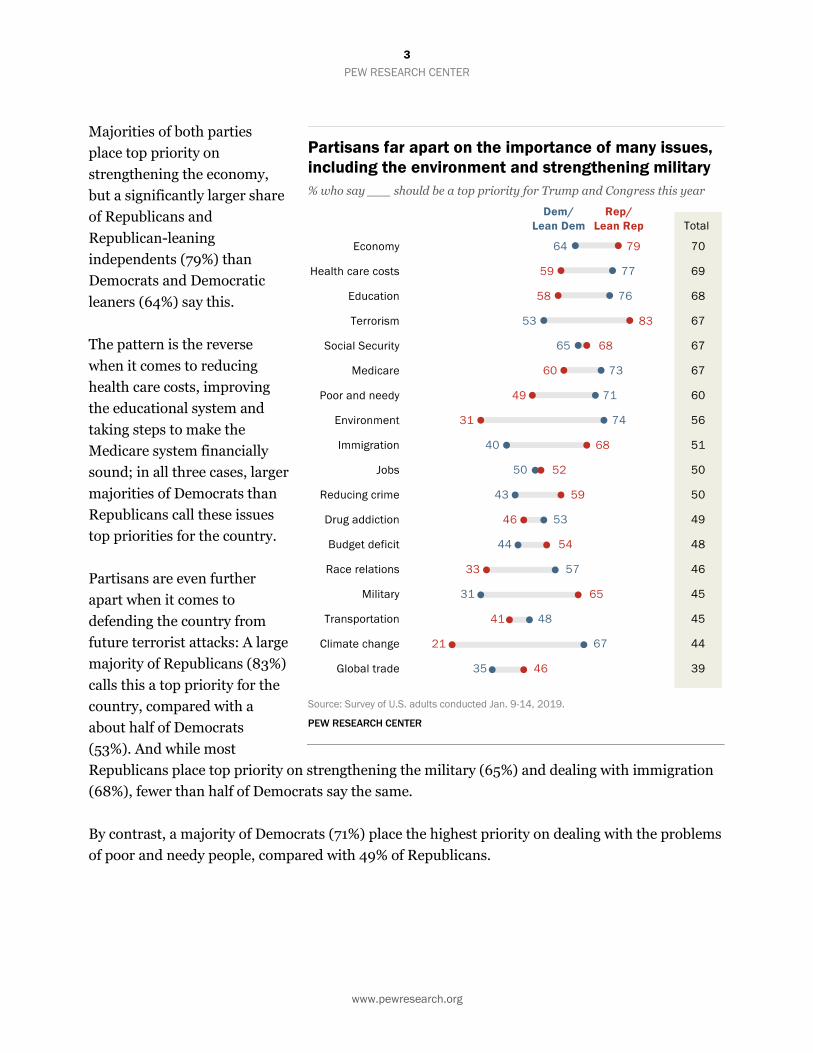
Majorities of both parties
place top priority on
strengthening the economy,
but a significantly larger share
of Republicans and
Republican-leaning
independents (79%) than
Democrats and Democratic
leaners (64%) say this.
The pattern is the reverse
when it comes to reducing
health care costs, improving
the educational system and
taking steps to make the
Medicare system financially
sound; in all three cases, larger
majorities of Democrats than
Republicans call these issues
top priorities for the country.
Partisans are even further
apart when it comes to
defending the country from
future terrorist attacks: A large
majority of Republicans (83%)
calls this a top priority for the
country, compared with a
about half of Democrats
(53%). And while most
Republicans place top priority on strengthening the military (65%) and dealing with immigration
(68%), fewer than half of Democrats say the same.
By contrast, a majority of Democrats (71%) place the highest priority on dealing with the problems
of poor and needy people, compared with 49% of Republicans.
Partisans far apart on the importance of many issues,
including the environment and strengthening military
% who say ___ should be a top priority for Trump and Congress this year
Source: Survey of U.S. adults conducted Jan. 9-14, 2019.
PEW RESEARCH CENTER
4
PEW RESEARCH CENTER
www.pewresearch.org
When it comes to the environment, Democrats are 43 percentage points more likely than
Republicans to say protecting the environment should be a top priority (74% vs. 31%) and 46
points more likely to call global climate change a top priority (67% vs. 21%).
Taking steps to make the Social Security system financially sound is one of the only issues where
comparable majorities of Republicans (68%) and Democrats (65%) say this should be a top
priority for the country.
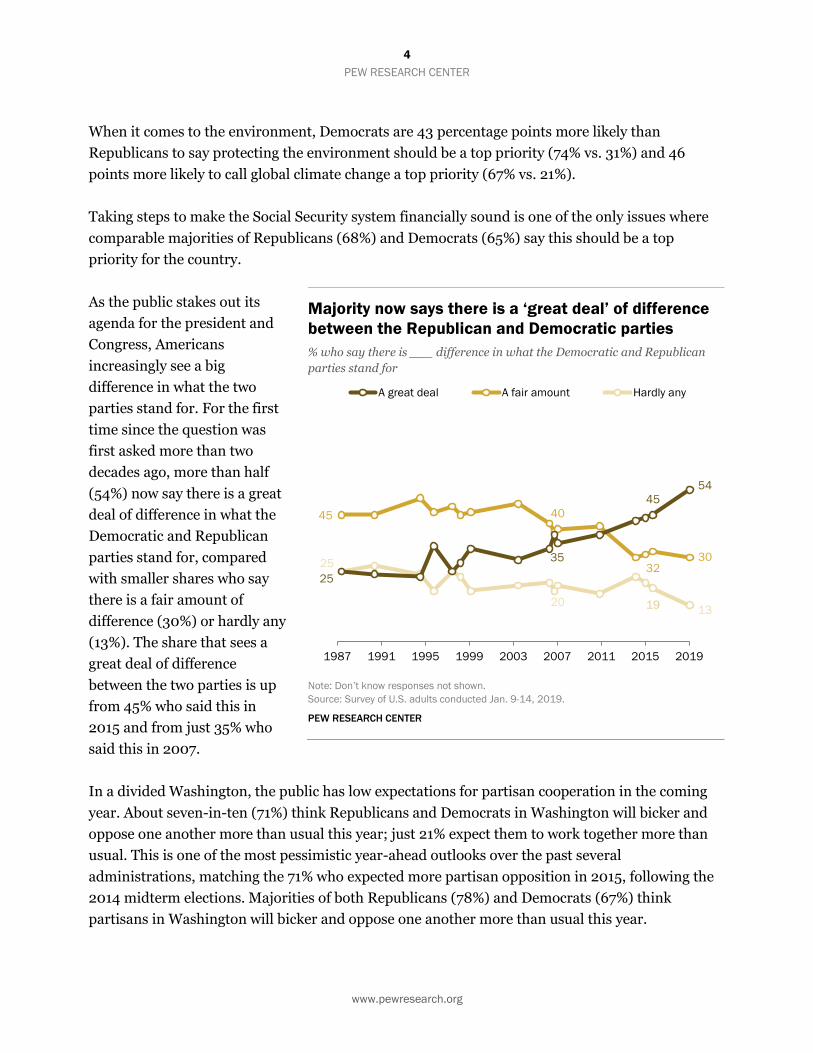
As the public stakes out its
agenda for the president and
Congress, Americans
increasingly see a big
difference in what the two
parties stand for. For the first
time since the question was
first asked more than two
decades ago, more than half
(54%) now say there is a great
deal of difference in what the
Democratic and Republican
parties stand for, compared
with smaller shares who say
there is a fair amount of
difference (30%) or hardly any
(13%). The share that sees a
great deal of difference
between the two parties is up
from 45% who said this in
2015 and from just 35% who
said this in 2007.
In a divided Washington, the public has low expectations for partisan cooperation in the coming
year. About seven-in-ten (71%) think Republicans and Democrats in Washington will bicker and
oppose one another more than usual this year; just 21% expect them to work together more than
usual. This is one of the most pessimistic year-ahead outlooks over the past several
administrations, matching the 71% who expected more partisan opposition in 2015, following the
2014 midterm elections. Majorities of both Republicans (78%) and Democrats (67%) think
partisans in Washington will bicker and oppose one another more than usual this year.
Majority now says there is a ‘great deal’ of difference
between the Republican and Democratic parties
% who say there is ___ difference in what the Democratic and Republican
parties stand for
Note: Don’t know responses not shown.
Source: Survey of U.S. adults conducted Jan. 9-14, 2019.
PEW RESEARCH CENTER
45 40
3230
25
20 19 13
25
35
45
54
1987 1991 1995 1999 2003 2007 2011 2015 2019
A great deal A fair amount Hardly any
5
PEW RESEARCH CENTER
www.pewresearch.org
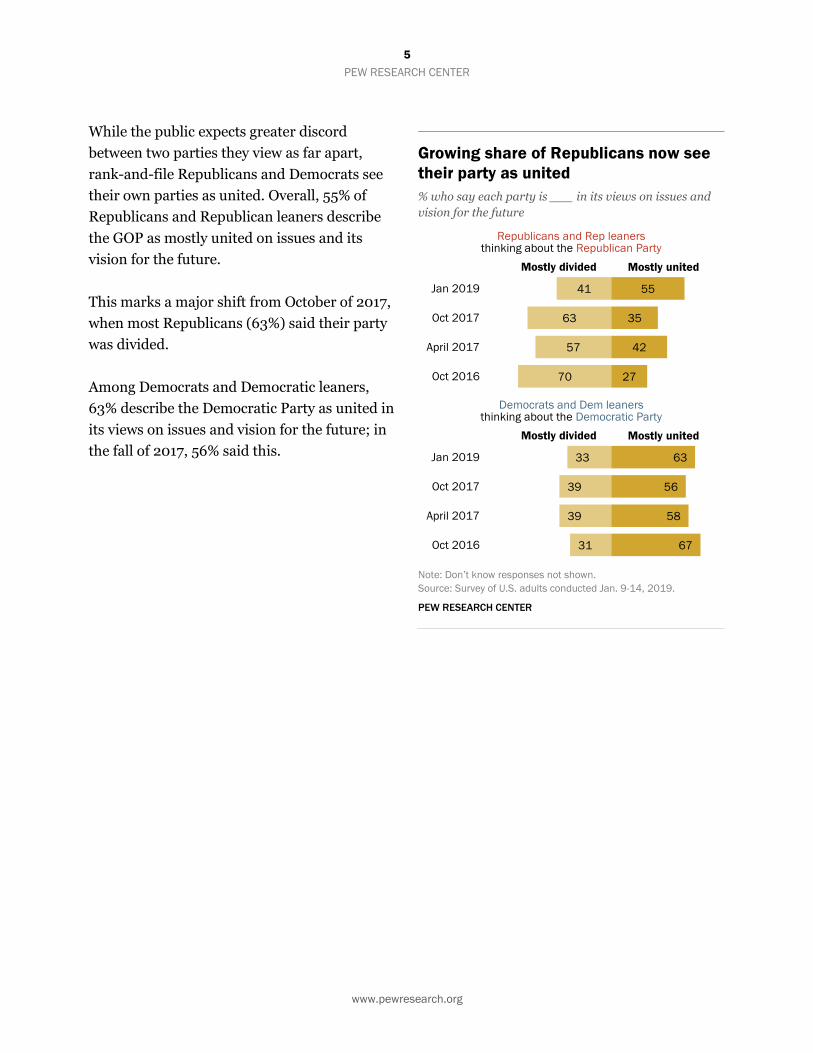
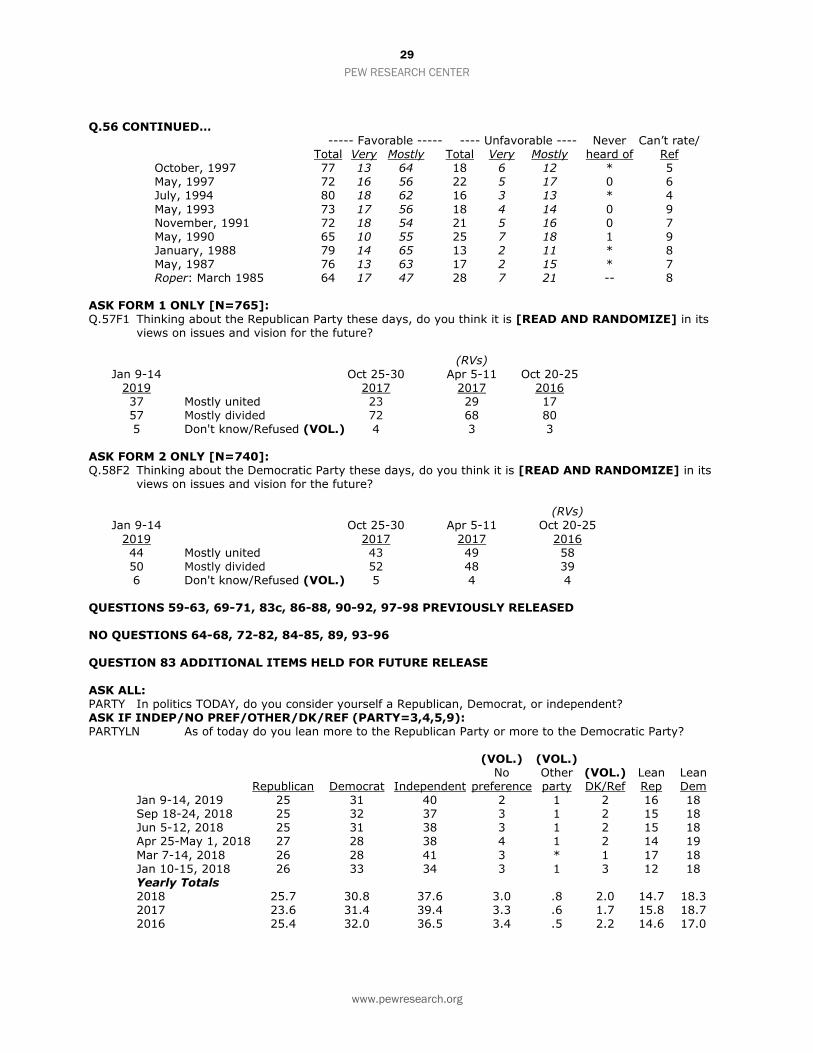
While the public expects greater discord
between two parties they view as far apart,
rank-and-file Republicans and Democrats see
their own parties as united. Overall, 55% of
Republicans and Republican leaners describe
the GOP as mostly united on issues and its
vision for the future.
This marks a major shift from October of 2017,
when most Republicans (63%) said their party
was divided.
Among Democrats and Democratic leaners,
63% describe the Democratic Party as united in
its views on issues and vision for the future; in
the fall of 2017, 56% said this.
Growing share of Republicans now see
their party as united
% who say each party is ___ in its views on issues and
vision for the future
Republicans and Rep leaners thinking about the Republican Party
Democrats and Dem leaners
thinking about the Democratic Party
Note: Don’t know responses not shown.
Source: Survey of U.S. adults conducted Jan. 9-14, 2019.
PEW RESEARCH CENTER
41
63
57
70
55
35
42
27
Jan 2019
Oct 2017
April 2017
Oct 2016
Mostly divided Mostly united
33
39
39
31
63
56
58
67
Jan 2019
Oct 2017
April 2017
Oct 2016
Mostly divided Mostly united
6
PEW RESEARCH CENTER
www.pewresearch.org
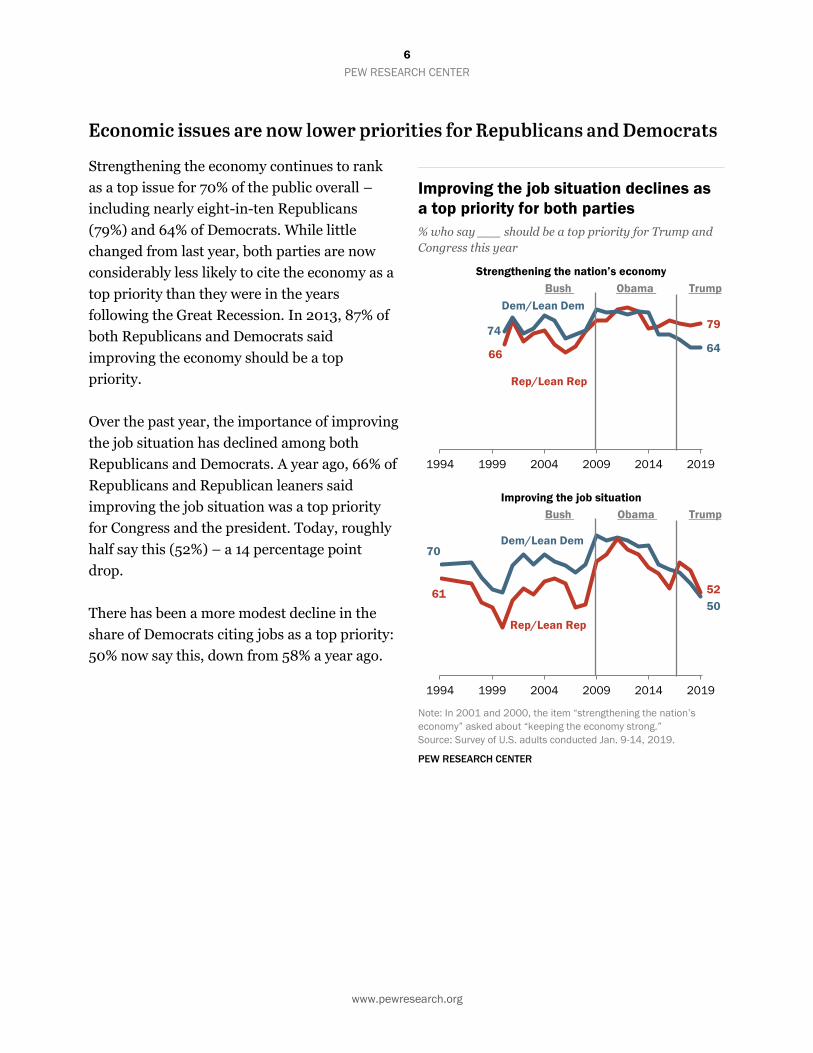
Strengthening the economy continues to rank
as a top issue for 70% of the public overall –
including nearly eight-in-ten Republicans
(79%) and 64% of Democrats. While little
changed from last year, both parties are now
considerably less likely to cite the economy as a
top priority than they were in the years
following the Great Recession. In 2013, 87% of
both Republicans and Democrats said
improving the economy should be a top
priority.
Over the past year, the importance of improving
the job situation has declined among both
Republicans and Democrats. A year ago, 66% of
Republicans and Republican leaners said
improving the job situation was a top priority
for Congress and the president. Today, roughly
half say this (52%) – a 14 percentage point
drop.
There has been a more modest decline in the
share of Democrats citing jobs as a top priority:
50% now say this, down from 58% a year ago.
Improving the job situation declines as
a top priority for both parties
% who say ___ should be a top priority for Trump and
Congress this year
Strengthening the nation’s economy
Improving the job situation
Note: In 2001 and 2000, the item “strengthening the nation’s
economy” asked about “keeping the economy strong.”
Source: Survey of U.S. adults conducted Jan. 9-14, 2019.
PEW RESEARCH CENTER
70
5061 52
1994 1999 2004 2009 2014 2019
Bush Obama
Rep/Lean Rep
Dem/Lean Dem
Trump
66
7974
64
1994 1999 2004 2009 2014 2019
Bush Obama
Rep/Lean Rep
Dem/Lean Dem
Trump
7
PEW RESEARCH CENTER
www.pewresearch.org
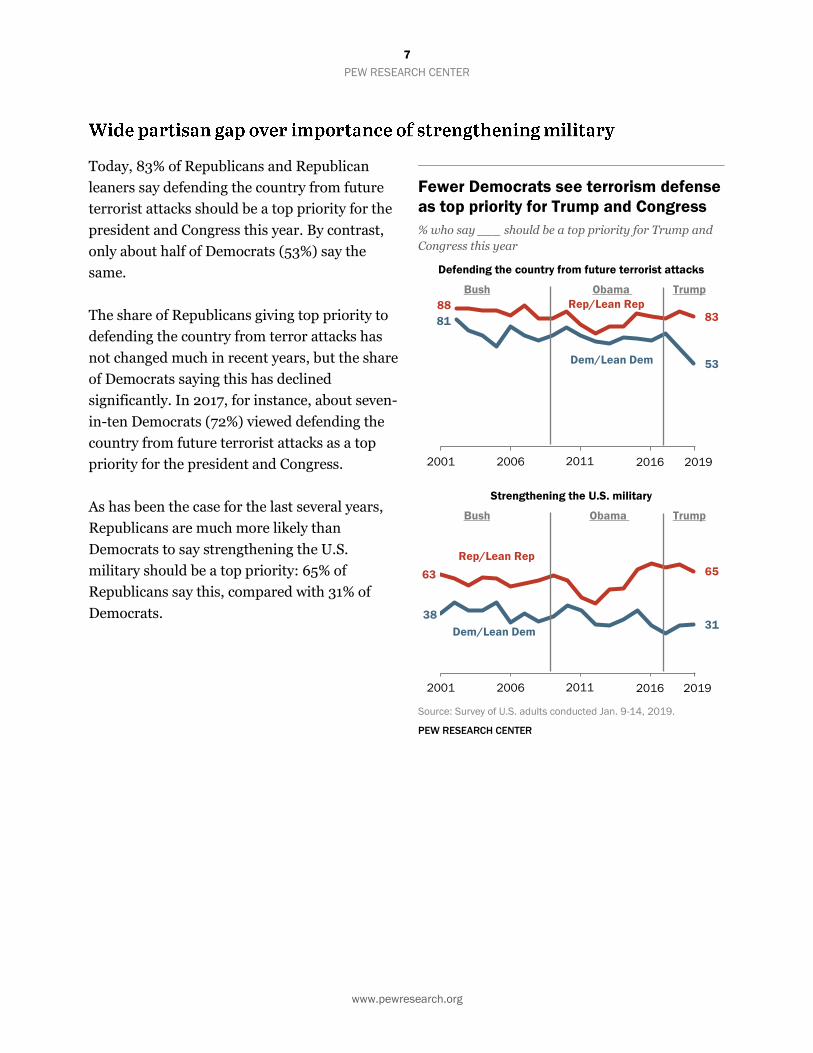
Today, 83% of Republicans and Republican
leaners say defending the country from future
terrorist attacks should be a top priority for the
president and Congress this year. By contrast,
only about half of Democrats (53%) say the
same.
The share of Republicans giving top priority to
defending the country from terror attacks has
not changed much in recent years, but the share
of Democrats saying this has declined
significantly. In 2017, for instance, about seven-
in-ten Democrats (72%) viewed defending the
country from future terrorist attacks as a top
priority for the president and Congress.
As has been the case for the last several years,
Republicans are much more likely than
Democrats to say strengthening the U.S.
military should be a top priority: 65% of
Republicans say this, compared with 31% of
Democrats.
Fewer Democrats see terrorism defense
as top priority for Trump and Congress
% who say ___ should be a top priority for Trump and
Congress this year
Defending the country from future terrorist attacks
Strengthening the U.S. military
Source: Survey of U.S. adults conducted Jan. 9-14, 2019.
PEW RESEARCH CENTER
63 65
3831
2001 2006 2011 2016
Bush Obama
Rep/Lean Rep
Dem/Lean Dem
Trump
20062001 2011 2016 2019
888381
53
2001 2006 2011 2016
Bush Obama
Rep/Lean Rep
Dem/Lean Dem
Trump
20062001 2011 2016 2019
8
PEW RESEARCH CENTER
www.pewresearch.org
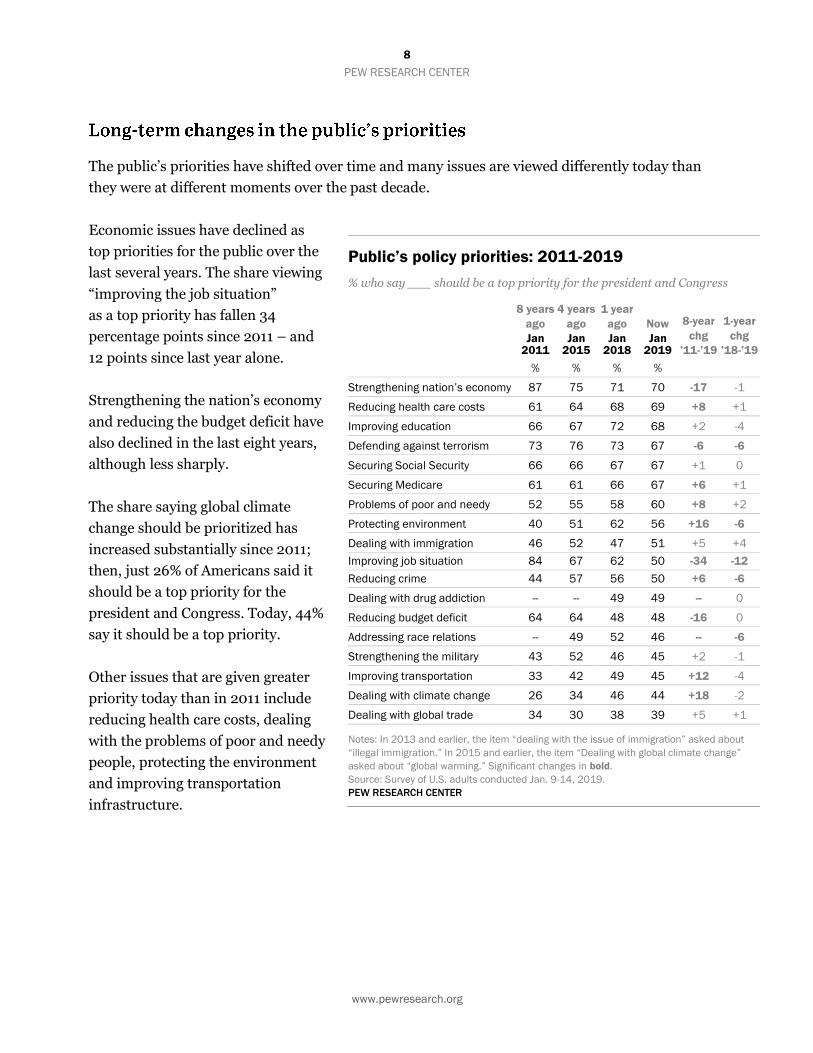
The public’s priorities have shifted over time and many issues are viewed differently today than
they were at different moments over the past decade.
Economic issues have declined as
top priorities for the public over the
last several years. The share viewing
“improving the job situation”
as a top priority has fallen 34
percentage points since 2011 – and
12 points since last year alone.
Strengthening the nation’s economy
and reducing the budget deficit have
also declined in the last eight years,
although less sharply.
The share saying global climate
change should be prioritized has
increased substantially since 2011;
then, just 26% of Americans said it
should be a top priority for the
president and Congress. Today, 44%
say it should be a top priority.
Other issues that are given greater
priority today than in 2011 include
reducing health care costs, dealing
with the problems of poor and needy
people, protecting the environment
and improving transportation
infrastructure.
Public’s policy priorities: 2011-2019
% who say ___ should be a top priority for the president and Congress
8 years
ago
Jan 2011
4 years
ago
Jan 2015
1 year
ago
Jan 2018
Now
Jan 2019
8-year
chg
’11-’19
1-year
chg
’18-’19
% % % %
Strengthening nation’s economy 87 75 71 70 -17 -1
Reducing health care costs 61 64 68 69 +8 +1
Improving education 66 67 72 68 +2 -4
Defending against terrorism 73 76 73 67 -6 -6
Securing Social Security 66 66 67 67 +1 0
Securing Medicare 61 61 66 67 +6 +1
Problems of poor and needy 52 55 58 60 +8 +2
Protecting environment 40 51 62 56 +16 -6
Dealing with immigration 46 52 47 51 +5 +4
Improving job situation 84 67 62 50 -34 -12
Reducing crime 44 57 56 50 +6 -6
Dealing with drug addiction -- -- 49 49 -- 0
Reducing budget deficit 64 64 48 48 -16 0
Addressing race relations -- 49 52 46 -- -6
Strengthening the military 43 52 46 45 +2 -1
Improving transportation 33 42 49 45 +12 -4
Dealing with climate change 26 34 46 44 +18 -2
Dealing with global trade 34 30 38 39 +5 +1
Notes: In 2013 and earlier, the item “dealing with the issue of immigration” asked about
“illegal immigration.” In 2015 and earlier, the item “Dealing with global climate change”
asked about “global warming.” Significant changes in bold.
Source: Survey of U.S. adults conducted Jan. 9-14, 2019.
PEW RESEARCH CENTER
9
PEW RESEARCH CENTER
www.pewresearch.org
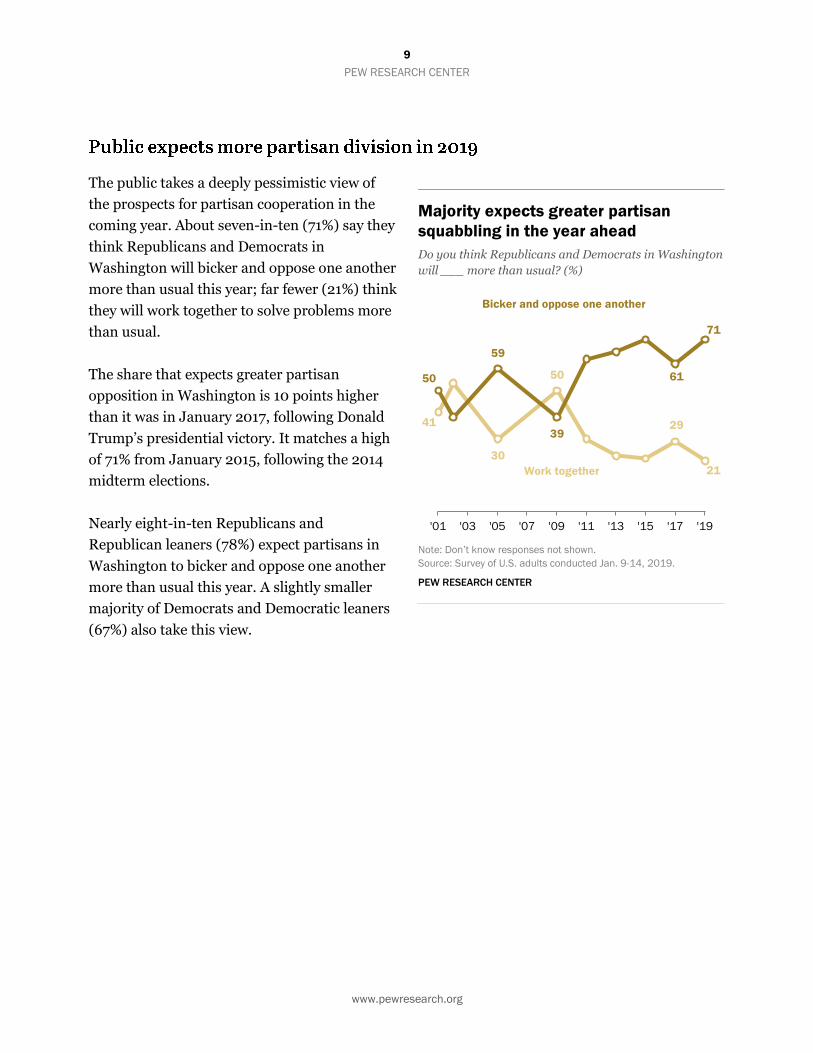
The public takes a deeply pessimistic view of
the prospects for partisan cooperation in the
coming year. About seven-in-ten (71%) say they
think Republicans and Democrats in
Washington will bicker and oppose one another
more than usual this year; far fewer (21%) think
they will work together to solve problems more
than usual.
The share that expects greater partisan
opposition in Washington is 10 points higher
than it was in January 2017, following Donald
Trump’s presidential victory. It matches a high
of 71% from January 2015, following the 2014
midterm elections.
Nearly eight-in-ten Republicans and
Republican leaners (78%) expect partisans in
Washington to bicker and oppose one another
more than usual this year. A slightly smaller
majority of Democrats and Democratic leaners
(67%) also take this view.
Majority expects greater partisan
squabbling in the year ahead
Do you think Republicans and Democrats in Washington
will ___ more than usual? (%)
Note: Don’t know responses not shown.
Source: Survey of U.S. adults conducted Jan. 9-14, 2019.
PEW RESEARCH CENTER
41
30
50
29
21
50
59
39
61
71
'01 '03 '05 '07 '09 '11 '13 '15 '17 '19
Bicker and oppose one another
Work together
10
PEW RESEARCH CENTER
www.pewresearch.org
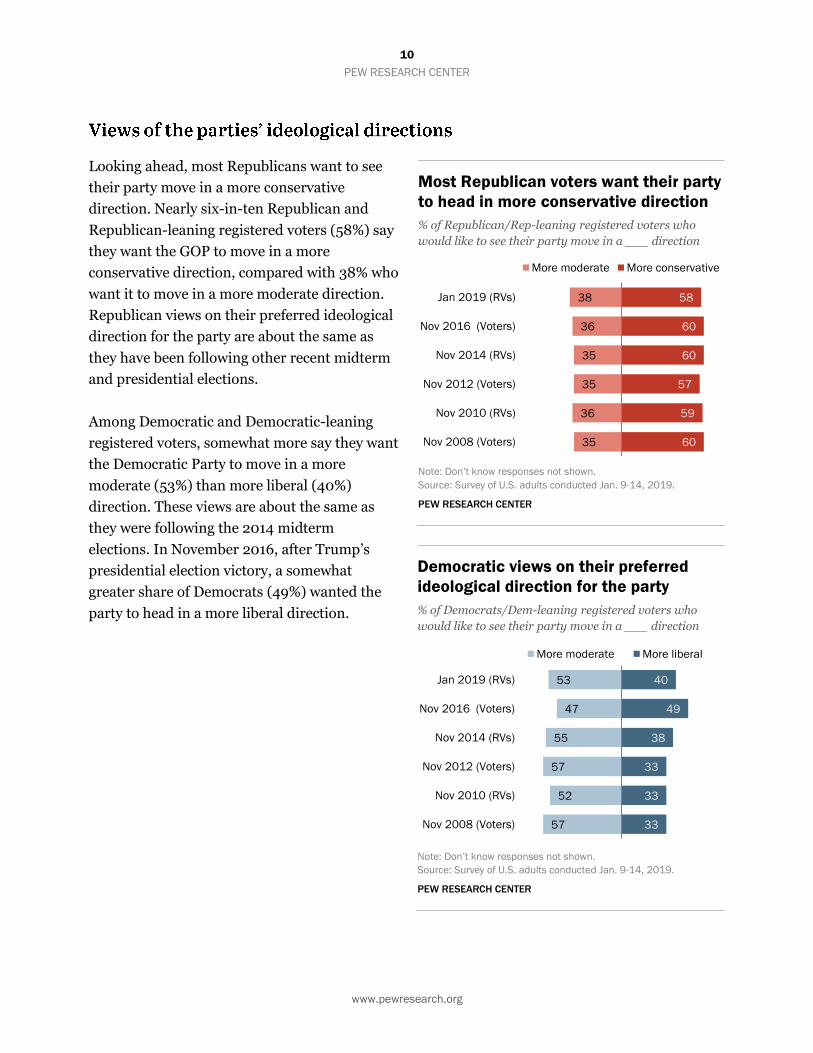
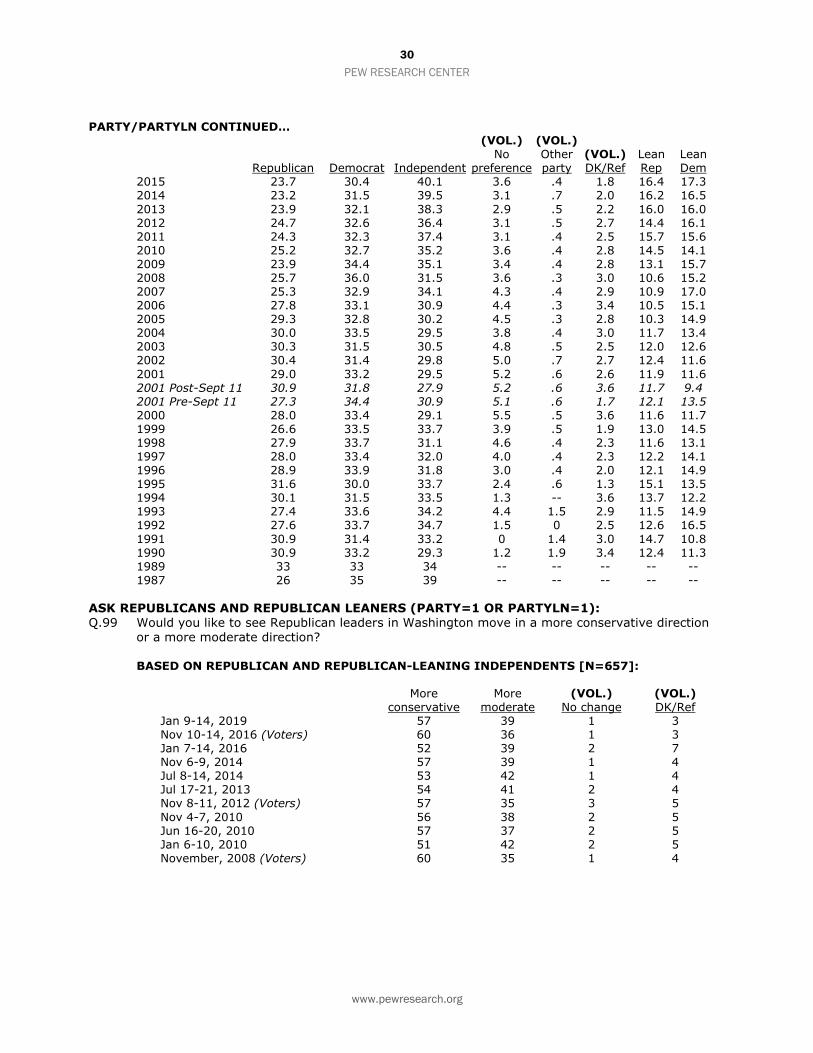
Looking ahead, most Republicans want to see
their party move in a more conservative
direction. Nearly six-in-ten Republican and
Republican-leaning registered voters (58%) say
they want the GOP to move in a more
conservative direction, compared with 38% who
want it to move in a more moderate direction.
Republican views on their preferred ideological
direction for the party are about the same as
they have been following other recent midterm
and presidential elections.
Among Democratic and Democratic-leaning
registered voters, somewhat more say they want
the Democratic Party to move in a more
moderate (53%) than more liberal (40%)
direction. These views are about the same as
they were following the 2014 midterm
elections. In November 2016, after Trump’s
presidential election victory, a somewhat
greater share of Democrats (49%) wanted the
party to head in a more liberal direction.
Most Republican voters want their party
to head in more conservative direction
% of Republican/Rep-leaning registered voters who
would like to see their party move in a ___ direction
Note: Don’t know responses not shown.
Source: Survey of U.S. adults conducted Jan. 9-14, 2019.
PEW RESEARCH CENTER
Democratic views on their preferred
ideological direction for the party
% of Democrats/Dem-leaning registered voters who
would like to see their party move in a ___ direction
Note: Don’t know responses not shown.
Source: Survey of U.S. adults conducted Jan. 9-14, 2019.
PEW RESEARCH CENTER
57
52
57
55
47
53
33
33
33
38
49
40
Nov 2008 (Voters)
Nov 2010 (RVs)
Nov 2012 (Voters)
Nov 2014 (RVs)
Nov 2016 (Voters)
Jan 2019 (RVs)
More moderate More liberal
35
36
35
35
36
38
60
59
57
60
60
58
Nov 2008 (Voters)
Nov 2010 (RVs)
Nov 2012 (Voters)
Nov 2014 (RVs)
Nov 2016 (Voters)
Jan 2019 (RVs)
More moderate More conservative
11
PEW RESEARCH CENTER
www.pewresearch.org
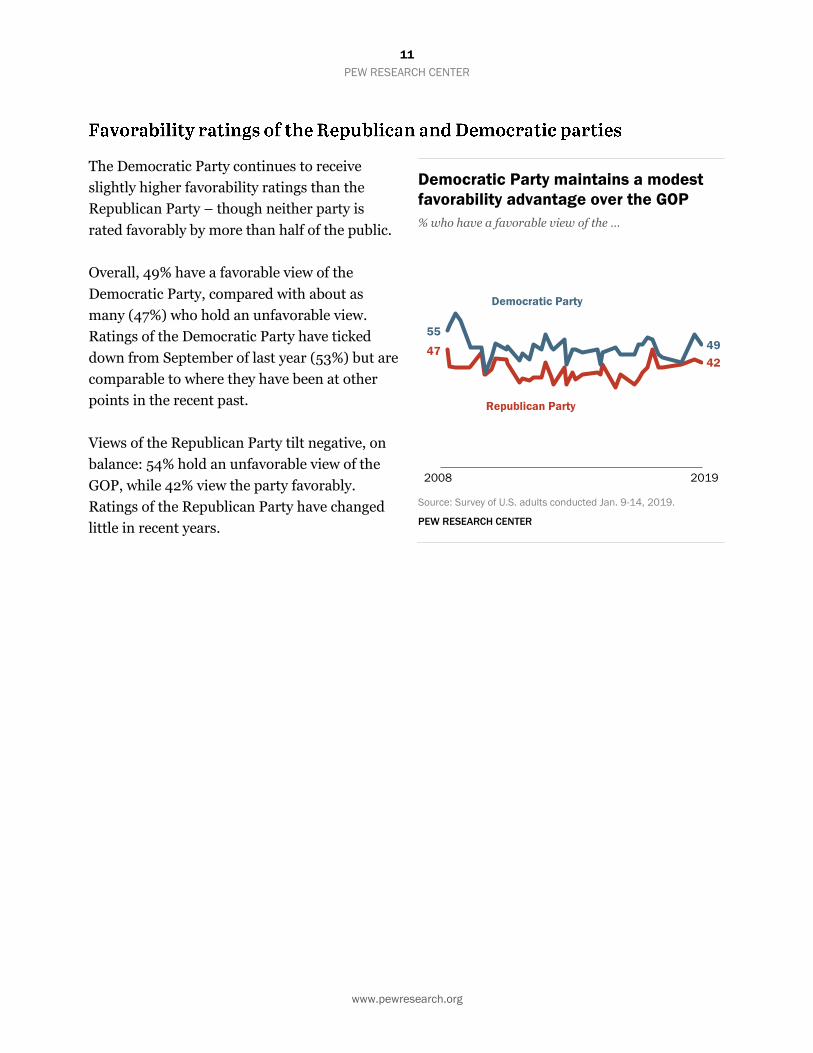
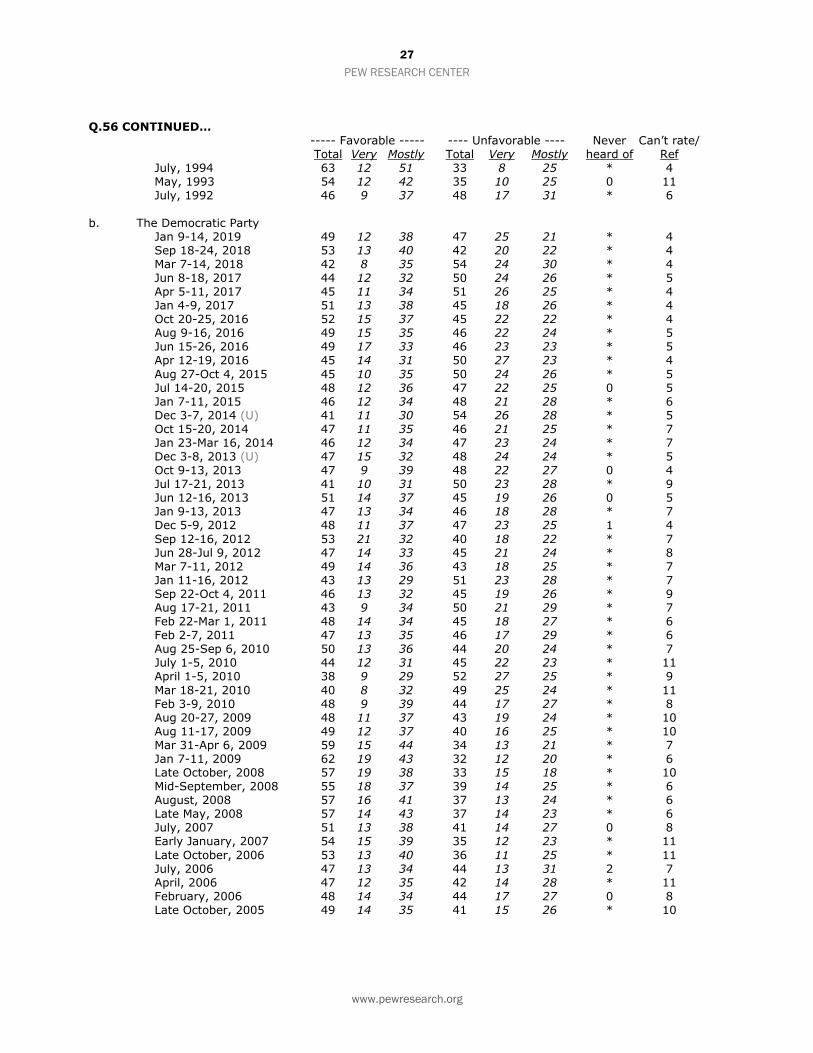
The Democratic Party continues to receive
slightly higher favorability ratings than the
Republican Party – though neither party is
rated favorably by more than half of the public.
Overall, 49% have a favorable view of the
Democratic Party, compared with about as
many (47%) who hold an unfavorable view.
Ratings of the Democratic Party have ticked
down from September of last year (53%) but are
comparable to where they have been at other
points in the recent past.
Views of the Republican Party tilt negative, on
balance: 54% hold an unfavorable view of the
GOP, while 42% view the party favorably.
Ratings of the Republican Party have changed
little in recent years.
Democratic Party maintains a modest
favorability advantage over the GOP
% who have a favorable view of the …
Source: Survey of U.S. adults conducted Jan. 9-14, 2019.
PEW RESEARCH CENTER
4742
55
49
Democratic Party
Republican Party
2008 2019
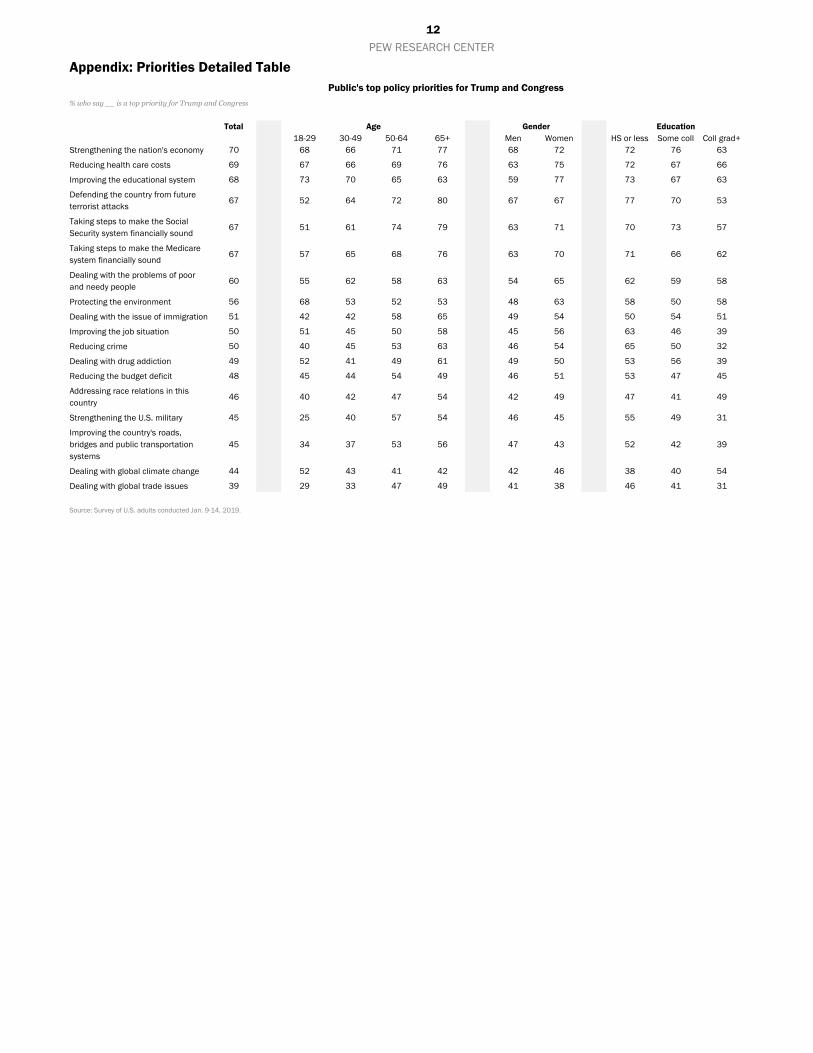
Public's top policy priorities for Trump and Congress
% who say __ is a top priority for Trump and Congress
Total
18-29 30-49 50-64 65+ Men Women HS or less Some coll Coll grad+
Strengthening the nation's economy 70 68 66 71 77 68 72 72 76 63
Reducing health care costs 69 67 66 69 76 63 75 72 67 66
Improving the educational system 68 73 70 65 63 59 77 73 67 63
Defending the country from future
terrorist attacks67 52 64 72 80 67 67 77 70 53
Taking steps to make the Social
Security system financially sound67 51 61 74 79 63 71 70 73 57
Taking steps to make the Medicare
system financially sound67 57 65 68 76 63 70 71 66 62
Dealing with the problems of poor
and needy people60 55 62 58 63 54 65 62 59 58
Protecting the environment 56 68 53 52 53 48 63 58 50 58
Dealing with the issue of immigration 51 42 42 58 65 49 54 50 54 51
Improving the job situation 50 51 45 50 58 45 56 63 46 39
Reducing crime 50 40 45 53 63 46 54 65 50 32
Dealing with drug addiction 49 52 41 49 61 49 50 53 56 39
Reducing the budget deficit 48 45 44 54 49 46 51 53 47 45
Addressing race relations in this
country46 40 42 47 54 42 49 47 41 49
Strengthening the U.S. military 45 25 40 57 54 46 45 55 49 31
Improving the country's roads,
bridges and public transportation
systems
45 34 37 53 56 47 43 52 42 39
Dealing with global climate change 44 52 43 41 42 42 46 38 40 54
Dealing with global trade issues 39 29 33 47 49 41 38 46 41 31
Source: Survey of U.S. adults conducted Jan. 9-14, 2019.
GenderAge Education
Appendix: Priorities Detailed Table
12PEW RESEARCH CENTER
13
PEW RESEARCH CENTER
www.pewresearch.org
Acknowledgements
This report is a collaborative effort based on the input and analysis of the following individuals:
Research team
Carroll Doherty, Director, Political Research
Jocelyn Kiley, Associate Director, Political Research
Alec Tyson, Senior Researcher
Bradley Jones, Research Associate
Baxter Oliphant, Research Associate
Hannah Hartig, Research Analyst
Amina Dunn, Research Assistant
John LaLoggia, Research Assistant
Haley Davie, Intern
Communications and editorial
Bridget Johnson, Communications Manager
Graphic design and web publishing
Alissa Scheller, Information Graphics Designer
Sara Atske, Assistant Digital Producer
14
PEW RESEARCH CENTER
www.pewresearch.org
Methodology
The analysis in this report is based on telephone interviews conducted January 9-14, 2019 among
a national sample of 1,505 adults, 18 years of age or older, living in all 50 U.S. states and the
District of Columbia (388 respondents were interviewed on a landline telephone, and 1,117 were
interviewed on a cell phone, including 724 who had no landline telephone). The survey was
conducted by interviewers under the direction of SSRS. A combination of landline and cell phone
random digit dial samples were used; both samples were provided by Marketing Systems Group.
Interviews were conducted in English and Spanish. Respondents in the landline sample were
selected by randomly asking for the youngest adult male or female who is now at home. Interviews
in the cell sample were conducted with the person who answered the phone, if that person was an
adult 18 years of age or older. Within the cell phone RDD frame, two strata were defined: numbers
flagged as a pre-paid phone and numbers not flagged as such. Numbers servicing a pre-paid phone
were sampled at a somewhat higher rate than other numbers. The weighting procedure corrected
for the different sampling rates. For detailed information about our survey methodology, see
http://www.pewresearch.org/methodology/u-s-survey-research/.
The combined landline and cell phone sample is weighted using an iterative technique that
matches gender, age, education, race, Hispanic origin and nativity and region to parameters from
the 2016 Census Bureau's American Community Survey one-year estimates and population
density to parameters from the Decennial Census. The sample also is weighted to match current
patterns of telephone status (landline only, cell phone only, or both landline and cell phone), based
on extrapolations from the 2016 National Health Interview Survey. The weighting procedure also
accounts for the fact that respondents with both landline and cell phones have a greater
probability of being included in the combined sample and adjusts for household size among
respondents with a landline phone. To account for the oversample of pre-paid cell phone sample,
an adjustment was made to the data before the sample was balanced to population parameters.
The sample was adjusted so that the proportion of prepaid numbers in the entire sample matched
the proportion of prepaid numbers in the base sample. The margins of error reported and
statistical tests of significance are adjusted to account for the survey’s design effect, a measure of
how much efficiency is lost from the weighting procedures.
15
PEW RESEARCH CENTER
www.pewresearch.org
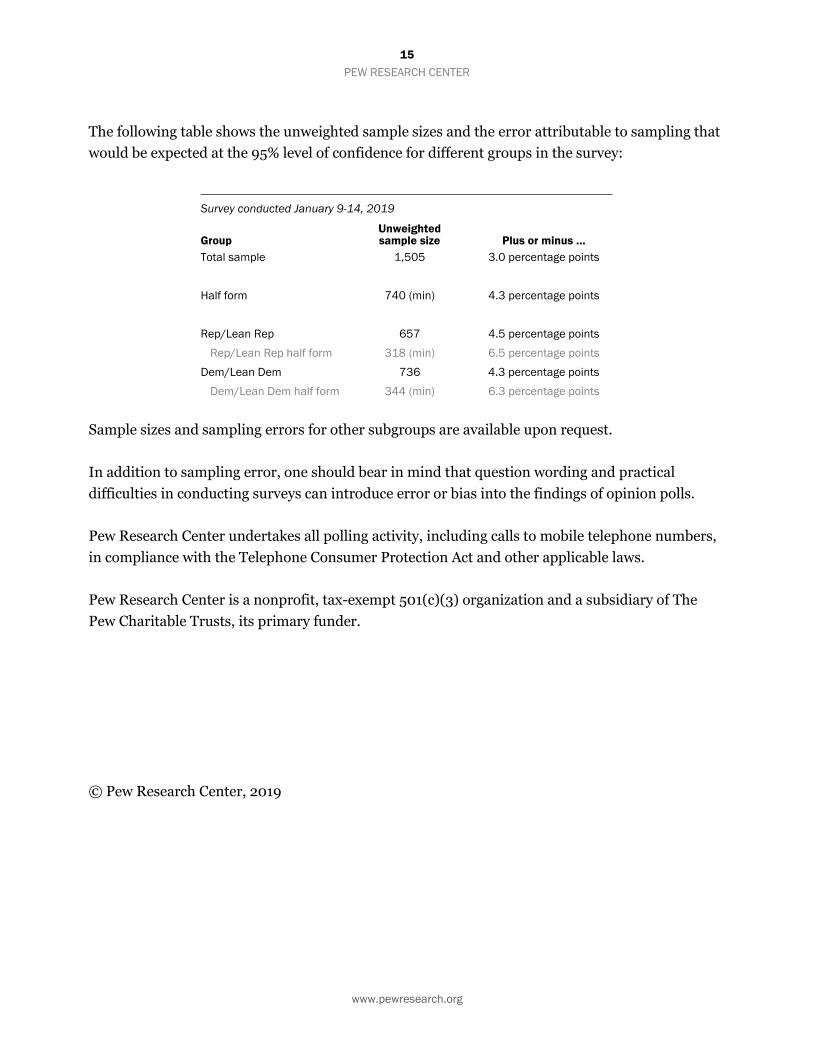
The following table shows the unweighted sample sizes and the error attributable to sampling that
would be expected at the 95% level of confidence for different groups in the survey:
Sample sizes and sampling errors for other subgroups are available upon request.
In addition to sampling error, one should bear in mind that question wording and practical
difficulties in conducting surveys can introduce error or bias into the findings of opinion polls.
Pew Research Center undertakes all polling activity, including calls to mobile telephone numbers,
in compliance with the Telephone Consumer Protection Act and other applicable laws.
Pew Research Center is a nonprofit, tax-exempt 501(c)(3) organization and a subsidiary of The
Pew Charitable Trusts, its primary funder.
© Pew Research Center, 2019
Survey conducted January 9-14, 2019
Group Unweighted sample size Plus or minus …
Total sample 1,505 3.0 percentage points
Half form 740 (min) 4.3 percentage points
Rep/Lean Rep 657 4.5 percentage points
Rep/Lean Rep half form 318 (min) 6.5 percentage points
Dem/Lean Dem 736 4.3 percentage points
Dem/Lean Dem half form 344 (min) 6.3 percentage points
16
PEW RESEARCH CENTER
www.pewresearch.org
PEW RESEARCH CENTER JANUARY 2019 POLITICAL SURVEY
FINAL TOPLINE JANUARY 9-14, 2019
N=1,505
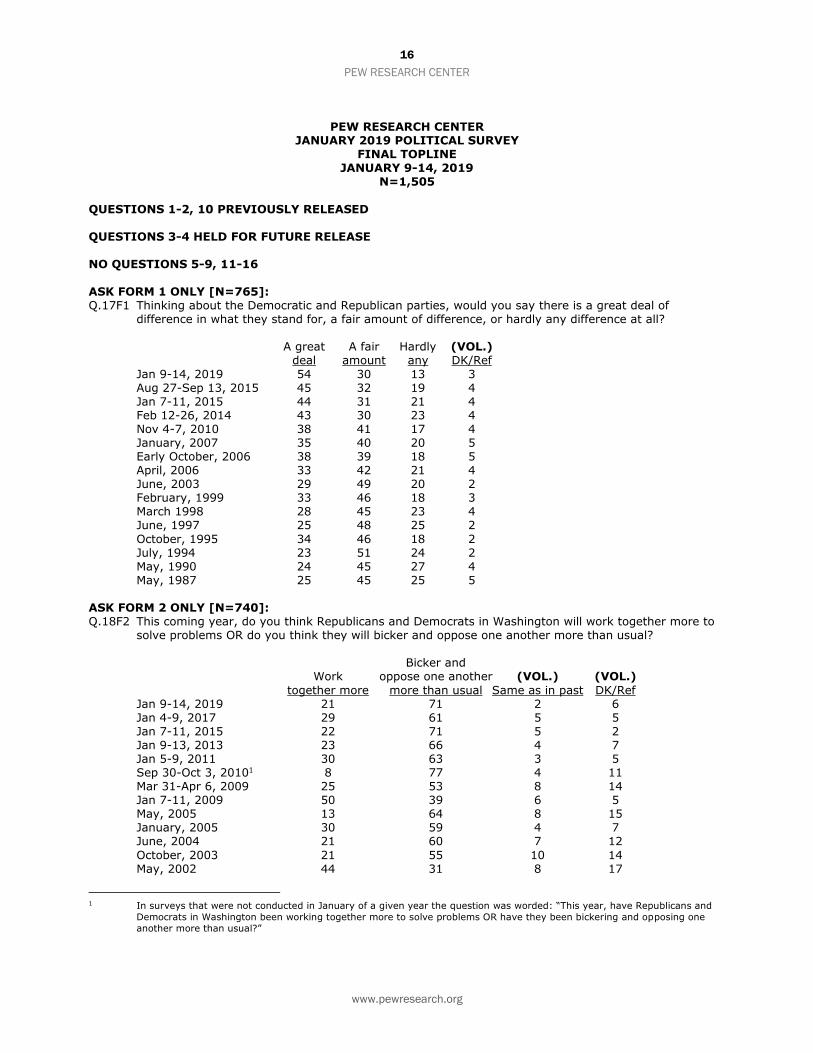
QUESTIONS 1-2, 10 PREVIOUSLY RELEASED QUESTIONS 3-4 HELD FOR FUTURE RELEASE NO QUESTIONS 5-9, 11-16 ASK FORM 1 ONLY [N=765]: Q.17F1 Thinking about the Democratic and Republican parties, would you say there is a great deal of
difference in what they stand for, a fair amount of difference, or hardly any difference at all?
A great A fair Hardly (VOL.) deal amount any DK/Ref
Jan 9-14, 2019 54 30 13 3 Aug 27-Sep 13, 2015 45 32 19 4 Jan 7-11, 2015 44 31 21 4 Feb 12-26, 2014 43 30 23 4 Nov 4-7, 2010 38 41 17 4 January, 2007 35 40 20 5 Early October, 2006 38 39 18 5 April, 2006 33 42 21 4 June, 2003 29 49 20 2 February, 1999 33 46 18 3 March 1998 28 45 23 4 June, 1997 25 48 25 2
October, 1995 34 46 18 2 July, 1994 23 51 24 2 May, 1990 24 45 27 4 May, 1987 25 45 25 5 ASK FORM 2 ONLY [N=740]: Q.18F2 This coming year, do you think Republicans and Democrats in Washington will work together more to
solve problems OR do you think they will bicker and oppose one another more than usual? Bicker and Work oppose one another (VOL.) (VOL.)
together more more than usual Same as in past DK/Ref Jan 9-14, 2019 21 71 2 6 Jan 4-9, 2017 29 61 5 5 Jan 7-11, 2015 22 71 5 2 Jan 9-13, 2013 23 66 4 7 Jan 5-9, 2011 30 63 3 5 Sep 30-Oct 3, 20101 8 77 4 11 Mar 31-Apr 6, 2009 25 53 8 14 Jan 7-11, 2009 50 39 6 5 May, 2005 13 64 8 15 January, 2005 30 59 4 7 June, 2004 21 60 7 12
October, 2003 21 55 10 14 May, 2002 44 31 8 17
1 In surveys that were not conducted in January of a given year the question was worded: “This year, have Republicans and
Democrats in Washington been working together more to solve problems OR have they been bickering and opposing one
another more than usual?”
17
PEW RESEARCH CENTER
www.pewresearch.org
Q.18F2 CONTINUED… Bicker and Work oppose one another (VOL.) (VOL.) together more more than usual Same as in past DK/Ref January, 2002 53 39 5 3 July, 2001 30 46 10 14
May, 2001 34 41 9 16 January, 2001 41 50 4 5 July, 2000 21 54 10 15 August, 1999 20 68 4 8 August, 1998 27 51 8 14 November, 1997 38 45 7 10 August, 1997 43 46 3 8 June, 1997 34 49 6 11 October, 1995 21 72 3 4 August, 1993 20 57 13 10 NO QUESTIONS 19-24, 26-28, 31-49
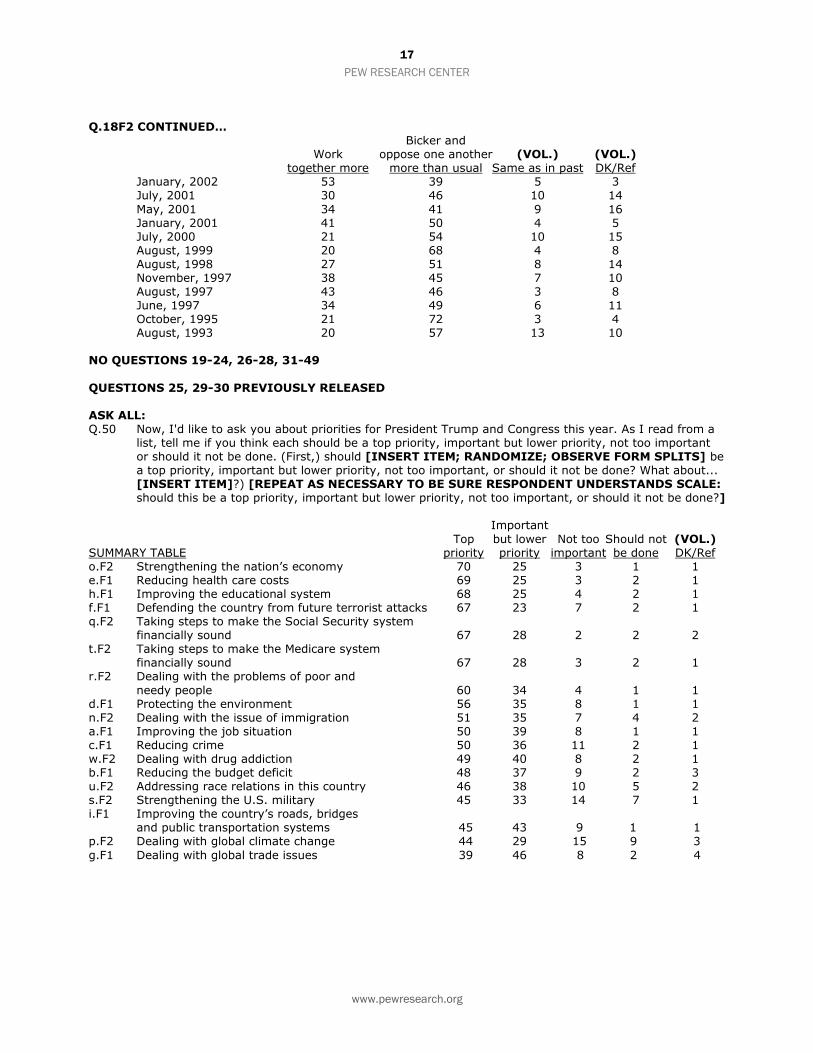
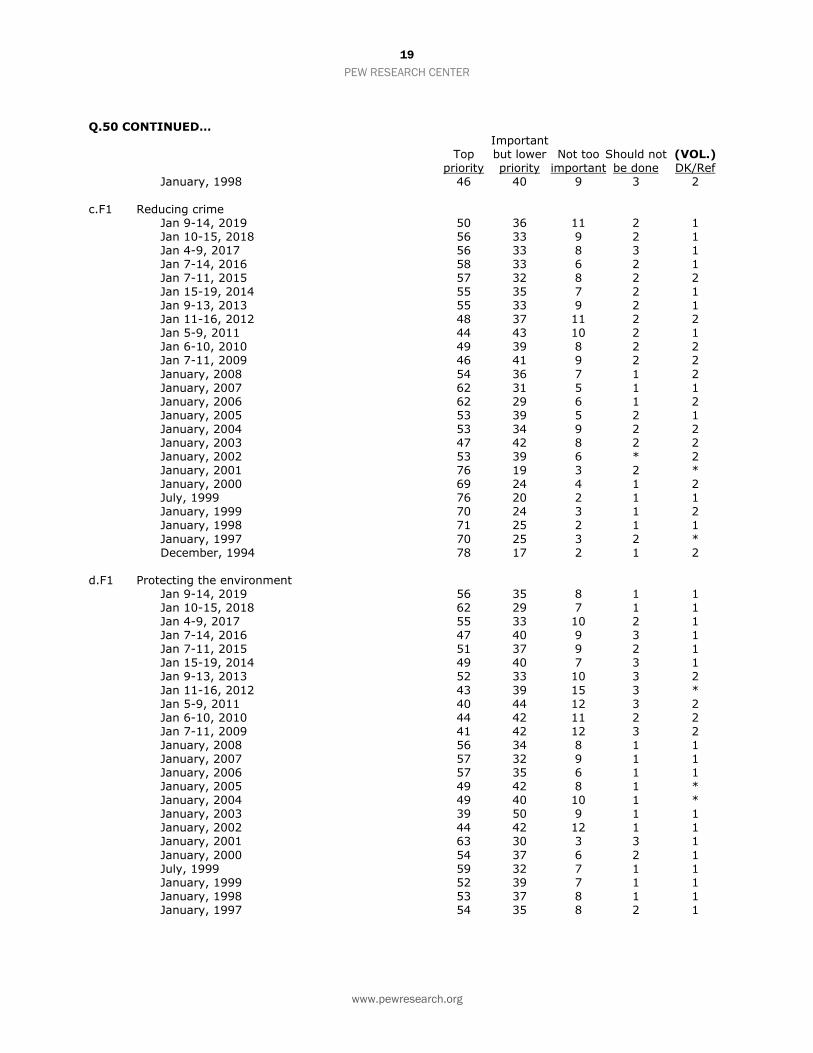
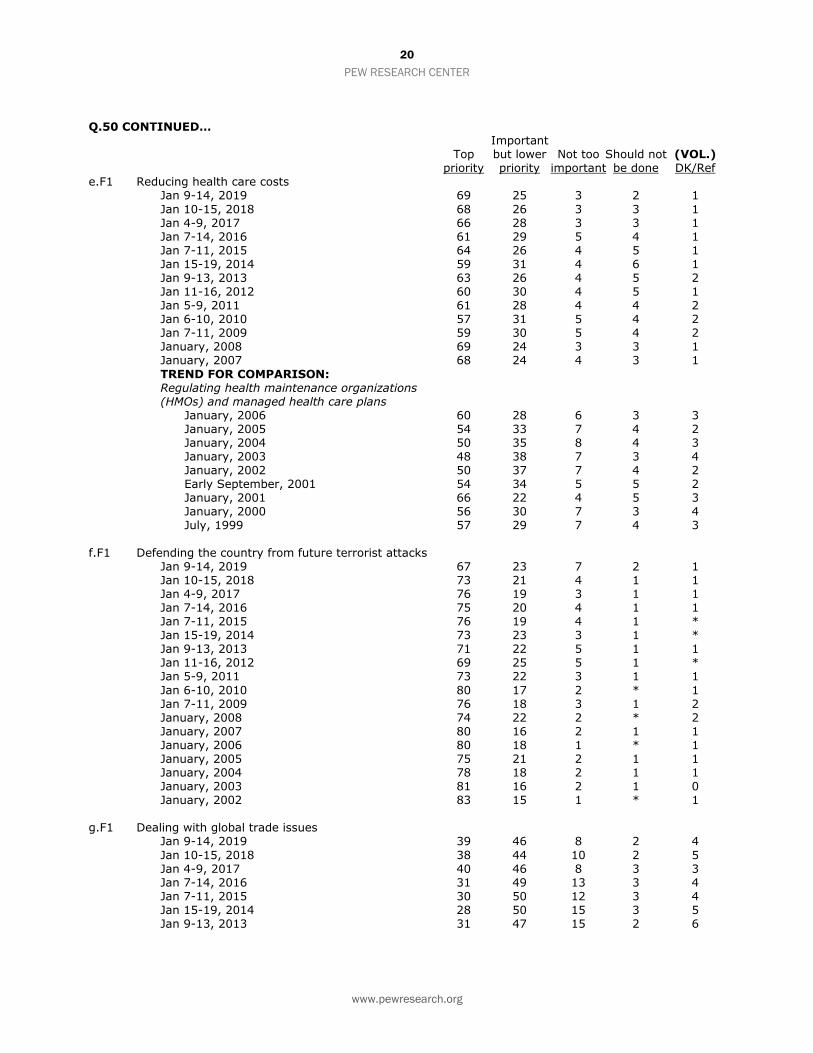
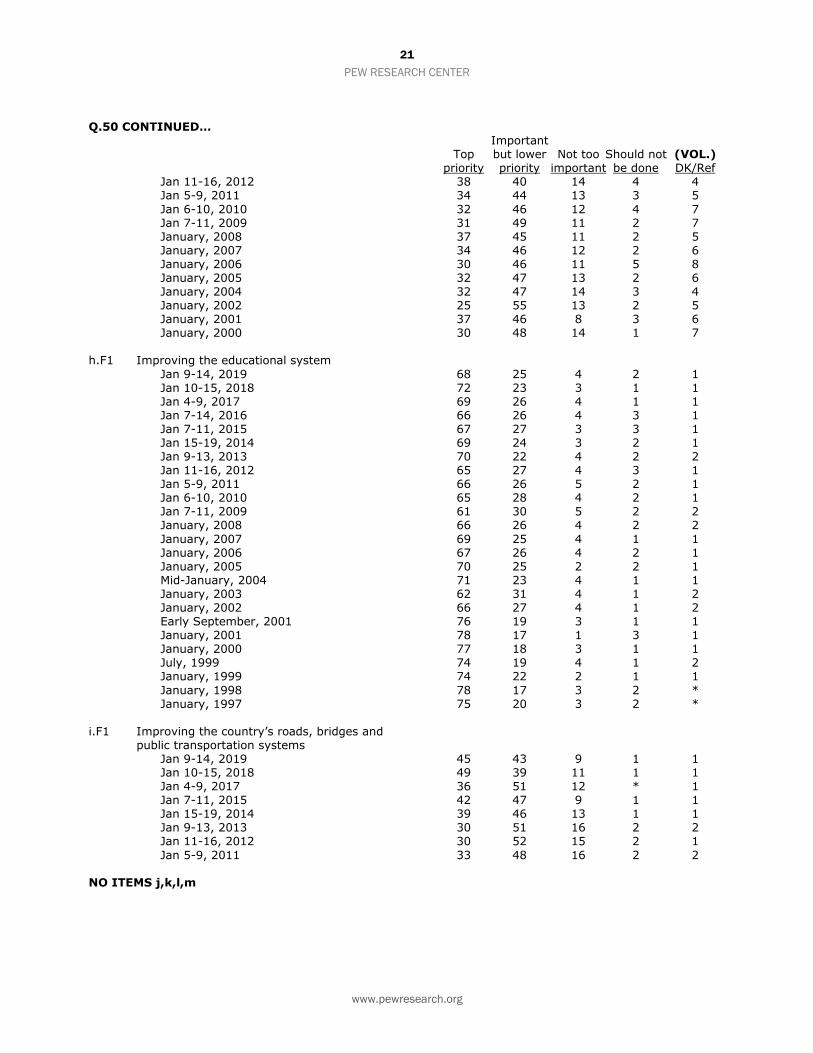
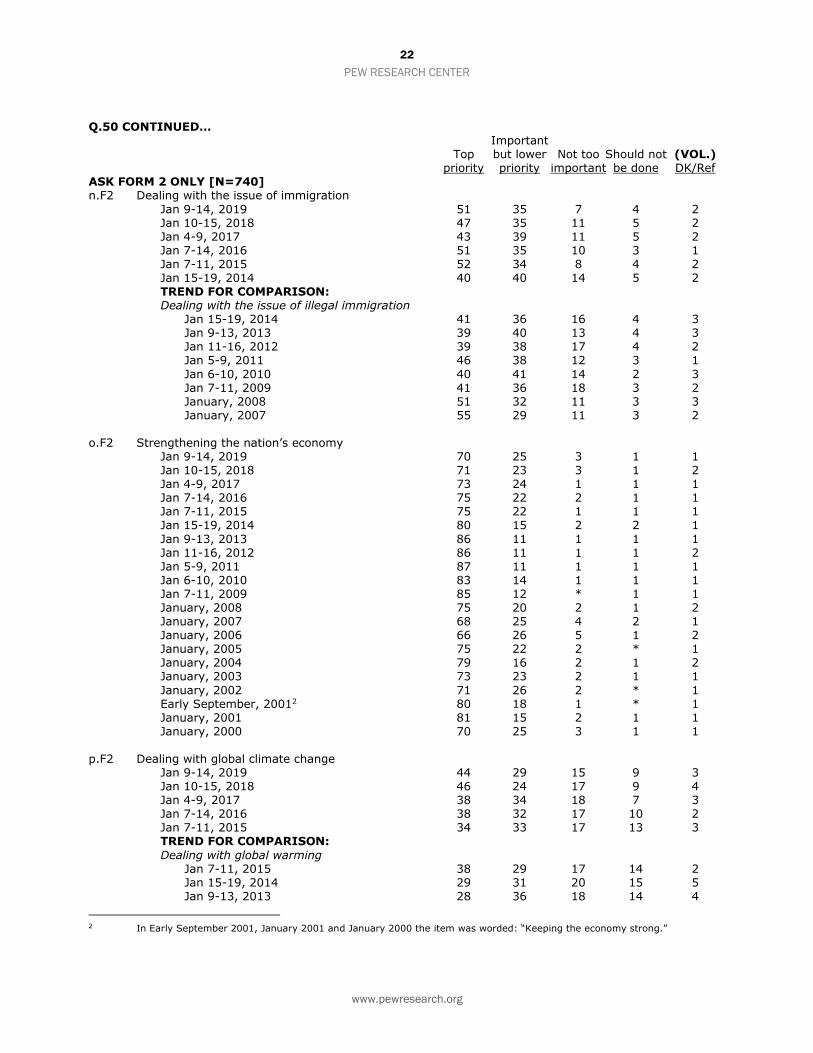
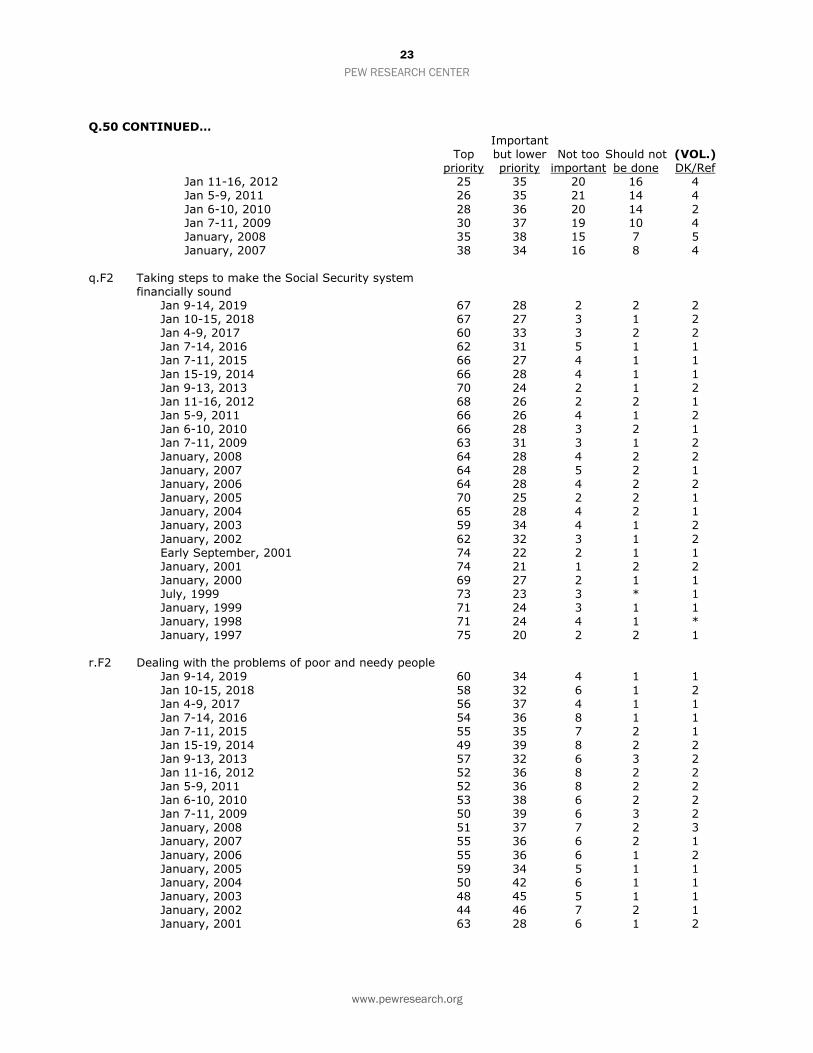
QUESTIONS 25, 29-30 PREVIOUSLY RELEASED ASK ALL: Q.50 Now, I'd like to ask you about priorities for President Trump and Congress this year. As I read from a
list, tell me if you think each should be a top priority, important but lower priority, not too important or should it not be done. (First,) should [INSERT ITEM; RANDOMIZE; OBSERVE FORM SPLITS] be a top priority, important but lower priority, not too important, or should it not be done? What about... [INSERT ITEM]?) [REPEAT AS NECESSARY TO BE SURE RESPONDENT UNDERSTANDS SCALE: should this be a top priority, important but lower priority, not too important, or should it not be done?]
Important
Top but lower Not too Should not (VOL.) SUMMARY TABLE priority priority important be done DK/Ref o.F2 Strengthening the nation’s economy 70 25 3 1 1 e.F1 Reducing health care costs 69 25 3 2 1 h.F1 Improving the educational system 68 25 4 2 1 f.F1 Defending the country from future terrorist attacks 67 23 7 2 1 q.F2 Taking steps to make the Social Security system financially sound 67 28 2 2 2 t.F2 Taking steps to make the Medicare system financially sound 67 28 3 2 1 r.F2 Dealing with the problems of poor and
needy people 60 34 4 1 1 d.F1 Protecting the environment 56 35 8 1 1 n.F2 Dealing with the issue of immigration 51 35 7 4 2 a.F1 Improving the job situation 50 39 8 1 1 c.F1 Reducing crime 50 36 11 2 1 w.F2 Dealing with drug addiction 49 40 8 2 1 b.F1 Reducing the budget deficit 48 37 9 2 3 u.F2 Addressing race relations in this country 46 38 10 5 2 s.F2 Strengthening the U.S. military 45 33 14 7 1 i.F1 Improving the country’s roads, bridges and public transportation systems 45 43 9 1 1 p.F2 Dealing with global climate change 44 29 15 9 3
g.F1 Dealing with global trade issues 39 46 8 2 4
18
PEW RESEARCH CENTER
www.pewresearch.org
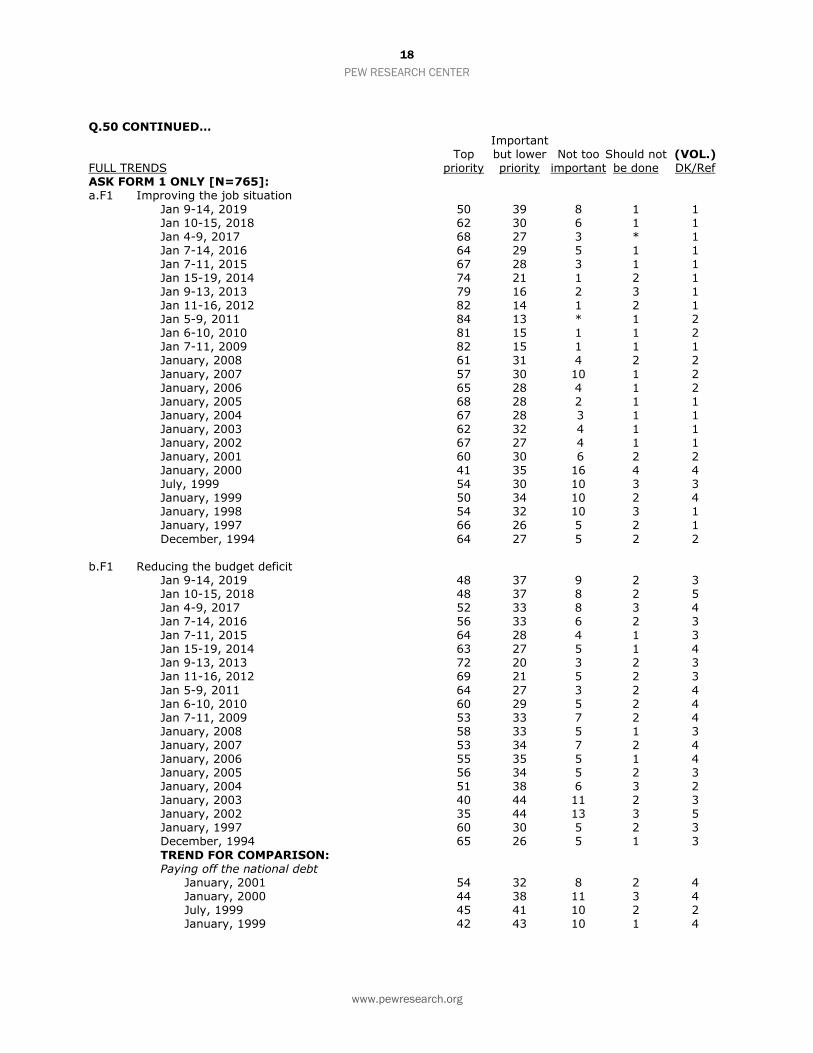
Q.50 CONTINUED… Important Top but lower Not too Should not (VOL.) FULL TRENDS priority priority important be done DK/Ref ASK FORM 1 ONLY [N=765]: a.F1 Improving the job situation
Jan 9-14, 2019 50 39 8 1 1 Jan 10-15, 2018 62 30 6 1 1 Jan 4-9, 2017 68 27 3 * 1 Jan 7-14, 2016 64 29 5 1 1 Jan 7-11, 2015 67 28 3 1 1 Jan 15-19, 2014 74 21 1 2 1 Jan 9-13, 2013 79 16 2 3 1 Jan 11-16, 2012 82 14 1 2 1 Jan 5-9, 2011 84 13 * 1 2 Jan 6-10, 2010 81 15 1 1 2 Jan 7-11, 2009 82 15 1 1 1 January, 2008 61 31 4 2 2
January, 2007 57 30 10 1 2 January, 2006 65 28 4 1 2 January, 2005 68 28 2 1 1 January, 2004 67 28 3 1 1 January, 2003 62 32 4 1 1 January, 2002 67 27 4 1 1 January, 2001 60 30 6 2 2 January, 2000 41 35 16 4 4 July, 1999 54 30 10 3 3 January, 1999 50 34 10 2 4 January, 1998 54 32 10 3 1 January, 1997 66 26 5 2 1
December, 1994 64 27 5 2 2 b.F1 Reducing the budget deficit Jan 9-14, 2019 48 37 9 2 3 Jan 10-15, 2018 48 37 8 2 5 Jan 4-9, 2017 52 33 8 3 4 Jan 7-14, 2016 56 33 6 2 3 Jan 7-11, 2015 64 28 4 1 3 Jan 15-19, 2014 63 27 5 1 4 Jan 9-13, 2013 72 20 3 2 3 Jan 11-16, 2012 69 21 5 2 3
Jan 5-9, 2011 64 27 3 2 4 Jan 6-10, 2010 60 29 5 2 4 Jan 7-11, 2009 53 33 7 2 4 January, 2008 58 33 5 1 3 January, 2007 53 34 7 2 4 January, 2006 55 35 5 1 4 January, 2005 56 34 5 2 3 January, 2004 51 38 6 3 2 January, 2003 40 44 11 2 3 January, 2002 35 44 13 3 5 January, 1997 60 30 5 2 3 December, 1994 65 26 5 1 3
TREND FOR COMPARISON: Paying off the national debt January, 2001 54 32 8 2 4 January, 2000 44 38 11 3 4 July, 1999 45 41 10 2 2 January, 1999 42 43 10 1 4
19
PEW RESEARCH CENTER
www.pewresearch.org
Q.50 CONTINUED… Important Top but lower Not too Should not (VOL.) priority priority important be done DK/Ref January, 1998 46 40 9 3 2
c.F1 Reducing crime Jan 9-14, 2019 50 36 11 2 1 Jan 10-15, 2018 56 33 9 2 1 Jan 4-9, 2017 56 33 8 3 1 Jan 7-14, 2016 58 33 6 2 1 Jan 7-11, 2015 57 32 8 2 2 Jan 15-19, 2014 55 35 7 2 1 Jan 9-13, 2013 55 33 9 2 1 Jan 11-16, 2012 48 37 11 2 2 Jan 5-9, 2011 44 43 10 2 1 Jan 6-10, 2010 49 39 8 2 2 Jan 7-11, 2009 46 41 9 2 2
January, 2008 54 36 7 1 2 January, 2007 62 31 5 1 1 January, 2006 62 29 6 1 2 January, 2005 53 39 5 2 1 January, 2004 53 34 9 2 2 January, 2003 47 42 8 2 2 January, 2002 53 39 6 * 2 January, 2001 76 19 3 2 * January, 2000 69 24 4 1 2 July, 1999 76 20 2 1 1 January, 1999 70 24 3 1 2 January, 1998 71 25 2 1 1
January, 1997 70 25 3 2 * December, 1994 78 17 2 1 2 d.F1 Protecting the environment Jan 9-14, 2019 56 35 8 1 1 Jan 10-15, 2018 62 29 7 1 1 Jan 4-9, 2017 55 33 10 2 1 Jan 7-14, 2016 47 40 9 3 1 Jan 7-11, 2015 51 37 9 2 1 Jan 15-19, 2014 49 40 7 3 1 Jan 9-13, 2013 52 33 10 3 2
Jan 11-16, 2012 43 39 15 3 * Jan 5-9, 2011 40 44 12 3 2 Jan 6-10, 2010 44 42 11 2 2 Jan 7-11, 2009 41 42 12 3 2 January, 2008 56 34 8 1 1 January, 2007 57 32 9 1 1 January, 2006 57 35 6 1 1 January, 2005 49 42 8 1 * January, 2004 49 40 10 1 * January, 2003 39 50 9 1 1 January, 2002 44 42 12 1 1 January, 2001 63 30 3 3 1
January, 2000 54 37 6 2 1 July, 1999 59 32 7 1 1 January, 1999 52 39 7 1 1 January, 1998 53 37 8 1 1 January, 1997 54 35 8 2 1
20
PEW RESEARCH CENTER
www.pewresearch.org
Q.50 CONTINUED… Important Top but lower Not too Should not (VOL.) priority priority important be done DK/Ref e.F1 Reducing health care costs Jan 9-14, 2019 69 25 3 2 1
Jan 10-15, 2018 68 26 3 3 1 Jan 4-9, 2017 66 28 3 3 1 Jan 7-14, 2016 61 29 5 4 1 Jan 7-11, 2015 64 26 4 5 1 Jan 15-19, 2014 59 31 4 6 1 Jan 9-13, 2013 63 26 4 5 2 Jan 11-16, 2012 60 30 4 5 1 Jan 5-9, 2011 61 28 4 4 2 Jan 6-10, 2010 57 31 5 4 2 Jan 7-11, 2009 59 30 5 4 2 January, 2008 69 24 3 3 1 January, 2007 68 24 4 3 1
TREND FOR COMPARISON: Regulating health maintenance organizations (HMOs) and managed health care plans January, 2006 60 28 6 3 3 January, 2005 54 33 7 4 2 January, 2004 50 35 8 4 3 January, 2003 48 38 7 3 4 January, 2002 50 37 7 4 2 Early September, 2001 54 34 5 5 2 January, 2001 66 22 4 5 3 January, 2000 56 30 7 3 4 July, 1999 57 29 7 4 3
f.F1 Defending the country from future terrorist attacks Jan 9-14, 2019 67 23 7 2 1 Jan 10-15, 2018 73 21 4 1 1 Jan 4-9, 2017 76 19 3 1 1 Jan 7-14, 2016 75 20 4 1 1 Jan 7-11, 2015 76 19 4 1 * Jan 15-19, 2014 73 23 3 1 * Jan 9-13, 2013 71 22 5 1 1 Jan 11-16, 2012 69 25 5 1 * Jan 5-9, 2011 73 22 3 1 1
Jan 6-10, 2010 80 17 2 * 1 Jan 7-11, 2009 76 18 3 1 2 January, 2008 74 22 2 * 2 January, 2007 80 16 2 1 1 January, 2006 80 18 1 * 1 January, 2005 75 21 2 1 1 January, 2004 78 18 2 1 1 January, 2003 81 16 2 1 0 January, 2002 83 15 1 * 1 g.F1 Dealing with global trade issues Jan 9-14, 2019 39 46 8 2 4
Jan 10-15, 2018 38 44 10 2 5 Jan 4-9, 2017 40 46 8 3 3 Jan 7-14, 2016 31 49 13 3 4 Jan 7-11, 2015 30 50 12 3 4 Jan 15-19, 2014 28 50 15 3 5 Jan 9-13, 2013 31 47 15 2 6
21
PEW RESEARCH CENTER
www.pewresearch.org
Q.50 CONTINUED… Important Top but lower Not too Should not (VOL.) priority priority important be done DK/Ref Jan 11-16, 2012 38 40 14 4 4 Jan 5-9, 2011 34 44 13 3 5
Jan 6-10, 2010 32 46 12 4 7 Jan 7-11, 2009 31 49 11 2 7 January, 2008 37 45 11 2 5 January, 2007 34 46 12 2 6 January, 2006 30 46 11 5 8 January, 2005 32 47 13 2 6 January, 2004 32 47 14 3 4 January, 2002 25 55 13 2 5 January, 2001 37 46 8 3 6 January, 2000 30 48 14 1 7 h.F1 Improving the educational system
Jan 9-14, 2019 68 25 4 2 1 Jan 10-15, 2018 72 23 3 1 1 Jan 4-9, 2017 69 26 4 1 1 Jan 7-14, 2016 66 26 4 3 1 Jan 7-11, 2015 67 27 3 3 1 Jan 15-19, 2014 69 24 3 2 1 Jan 9-13, 2013 70 22 4 2 2 Jan 11-16, 2012 65 27 4 3 1 Jan 5-9, 2011 66 26 5 2 1 Jan 6-10, 2010 65 28 4 2 1 Jan 7-11, 2009 61 30 5 2 2 January, 2008 66 26 4 2 2
January, 2007 69 25 4 1 1 January, 2006 67 26 4 2 1 January, 2005 70 25 2 2 1 Mid-January, 2004 71 23 4 1 1 January, 2003 62 31 4 1 2 January, 2002 66 27 4 1 2 Early September, 2001 76 19 3 1 1 January, 2001 78 17 1 3 1 January, 2000 77 18 3 1 1 July, 1999 74 19 4 1 2 January, 1999 74 22 2 1 1
January, 1998 78 17 3 2 * January, 1997 75 20 3 2 * i.F1 Improving the country’s roads, bridges and
public transportation systems Jan 9-14, 2019 45 43 9 1 1 Jan 10-15, 2018 49 39 11 1 1 Jan 4-9, 2017 36 51 12 * 1 Jan 7-11, 2015 42 47 9 1 1 Jan 15-19, 2014 39 46 13 1 1 Jan 9-13, 2013 30 51 16 2 2 Jan 11-16, 2012 30 52 15 2 1
Jan 5-9, 2011 33 48 16 2 2 NO ITEMS j,k,l,m
22
PEW RESEARCH CENTER
www.pewresearch.org
Q.50 CONTINUED… Important Top but lower Not too Should not (VOL.) priority priority important be done DK/Ref ASK FORM 2 ONLY [N=740] n.F2 Dealing with the issue of immigration
Jan 9-14, 2019 51 35 7 4 2 Jan 10-15, 2018 47 35 11 5 2 Jan 4-9, 2017 43 39 11 5 2 Jan 7-14, 2016 51 35 10 3 1 Jan 7-11, 2015 52 34 8 4 2 Jan 15-19, 2014 40 40 14 5 2 TREND FOR COMPARISON: Dealing with the issue of illegal immigration Jan 15-19, 2014 41 36 16 4 3 Jan 9-13, 2013 39 40 13 4 3 Jan 11-16, 2012 39 38 17 4 2 Jan 5-9, 2011 46 38 12 3 1
Jan 6-10, 2010 40 41 14 2 3 Jan 7-11, 2009 41 36 18 3 2 January, 2008 51 32 11 3 3 January, 2007 55 29 11 3 2 o.F2 Strengthening the nation’s economy Jan 9-14, 2019 70 25 3 1 1 Jan 10-15, 2018 71 23 3 1 2 Jan 4-9, 2017 73 24 1 1 1 Jan 7-14, 2016 75 22 2 1 1 Jan 7-11, 2015 75 22 1 1 1 Jan 15-19, 2014 80 15 2 2 1
Jan 9-13, 2013 86 11 1 1 1 Jan 11-16, 2012 86 11 1 1 2 Jan 5-9, 2011 87 11 1 1 1 Jan 6-10, 2010 83 14 1 1 1 Jan 7-11, 2009 85 12 * 1 1 January, 2008 75 20 2 1 2 January, 2007 68 25 4 2 1 January, 2006 66 26 5 1 2 January, 2005 75 22 2 * 1 January, 2004 79 16 2 1 2 January, 2003 73 23 2 1 1
January, 2002 71 26 2 * 1 Early September, 20012 80 18 1 * 1 January, 2001 81 15 2 1 1 January, 2000 70 25 3 1 1 p.F2 Dealing with global climate change Jan 9-14, 2019 44 29 15 9 3 Jan 10-15, 2018 46 24 17 9 4 Jan 4-9, 2017 38 34 18 7 3 Jan 7-14, 2016 38 32 17 10 2 Jan 7-11, 2015 34 33 17 13 3 TREND FOR COMPARISON:
Dealing with global warming Jan 7-11, 2015 38 29 17 14 2 Jan 15-19, 2014 29 31 20 15 5 Jan 9-13, 2013 28 36 18 14 4
2 In Early September 2001, January 2001 and January 2000 the item was worded: “Keeping the economy strong.”
23
PEW RESEARCH CENTER
www.pewresearch.org
Q.50 CONTINUED… Important Top but lower Not too Should not (VOL.) priority priority important be done DK/Ref Jan 11-16, 2012 25 35 20 16 4 Jan 5-9, 2011 26 35 21 14 4
Jan 6-10, 2010 28 36 20 14 2 Jan 7-11, 2009 30 37 19 10 4 January, 2008 35 38 15 7 5 January, 2007 38 34 16 8 4 q.F2 Taking steps to make the Social Security system
financially sound Jan 9-14, 2019 67 28 2 2 2 Jan 10-15, 2018 67 27 3 1 2 Jan 4-9, 2017 60 33 3 2 2 Jan 7-14, 2016 62 31 5 1 1 Jan 7-11, 2015 66 27 4 1 1
Jan 15-19, 2014 66 28 4 1 1 Jan 9-13, 2013 70 24 2 1 2 Jan 11-16, 2012 68 26 2 2 1 Jan 5-9, 2011 66 26 4 1 2 Jan 6-10, 2010 66 28 3 2 1 Jan 7-11, 2009 63 31 3 1 2 January, 2008 64 28 4 2 2 January, 2007 64 28 5 2 1 January, 2006 64 28 4 2 2 January, 2005 70 25 2 2 1 January, 2004 65 28 4 2 1 January, 2003 59 34 4 1 2
January, 2002 62 32 3 1 2 Early September, 2001 74 22 2 1 1 January, 2001 74 21 1 2 2 January, 2000 69 27 2 1 1 July, 1999 73 23 3 * 1 January, 1999 71 24 3 1 1 January, 1998 71 24 4 1 * January, 1997 75 20 2 2 1 r.F2 Dealing with the problems of poor and needy people Jan 9-14, 2019 60 34 4 1 1
Jan 10-15, 2018 58 32 6 1 2 Jan 4-9, 2017 56 37 4 1 1 Jan 7-14, 2016 54 36 8 1 1 Jan 7-11, 2015 55 35 7 2 1 Jan 15-19, 2014 49 39 8 2 2 Jan 9-13, 2013 57 32 6 3 2 Jan 11-16, 2012 52 36 8 2 2 Jan 5-9, 2011 52 36 8 2 2 Jan 6-10, 2010 53 38 6 2 2 Jan 7-11, 2009 50 39 6 3 2 January, 2008 51 37 7 2 3 January, 2007 55 36 6 2 1
January, 2006 55 36 6 1 2 January, 2005 59 34 5 1 1 January, 2004 50 42 6 1 1 January, 2003 48 45 5 1 1 January, 2002 44 46 7 2 1 January, 2001 63 28 6 1 2
24
PEW RESEARCH CENTER
www.pewresearch.org
Q.50 CONTINUED… Important Top but lower Not too Should not (VOL.) priority priority important be done DK/Ref January, 2000 55 38 4 1 2 July, 1999 60 33 5 1 1
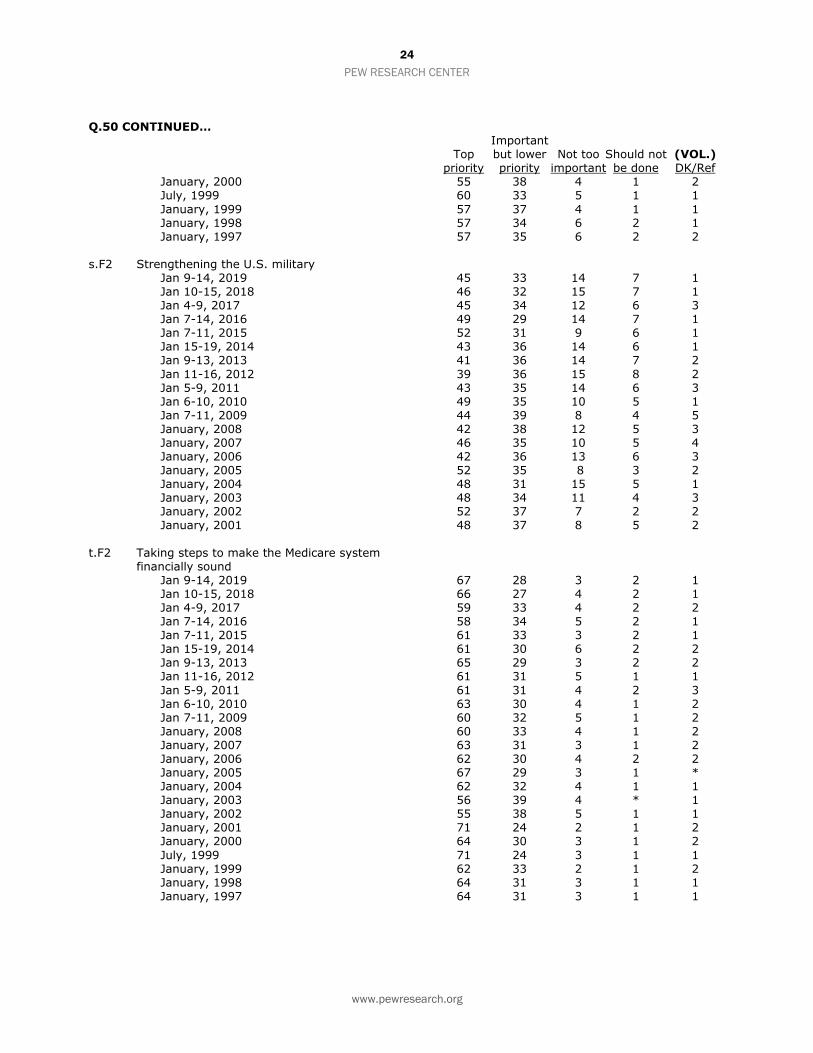
January, 1999 57 37 4 1 1 January, 1998 57 34 6 2 1 January, 1997 57 35 6 2 2 s.F2 Strengthening the U.S. military Jan 9-14, 2019 45 33 14 7 1 Jan 10-15, 2018 46 32 15 7 1 Jan 4-9, 2017 45 34 12 6 3 Jan 7-14, 2016 49 29 14 7 1 Jan 7-11, 2015 52 31 9 6 1 Jan 15-19, 2014 43 36 14 6 1 Jan 9-13, 2013 41 36 14 7 2
Jan 11-16, 2012 39 36 15 8 2 Jan 5-9, 2011 43 35 14 6 3 Jan 6-10, 2010 49 35 10 5 1 Jan 7-11, 2009 44 39 8 4 5 January, 2008 42 38 12 5 3 January, 2007 46 35 10 5 4 January, 2006 42 36 13 6 3 January, 2005 52 35 8 3 2 January, 2004 48 31 15 5 1 January, 2003 48 34 11 4 3 January, 2002 52 37 7 2 2 January, 2001 48 37 8 5 2
t.F2 Taking steps to make the Medicare system
financially sound Jan 9-14, 2019 67 28 3 2 1 Jan 10-15, 2018 66 27 4 2 1 Jan 4-9, 2017 59 33 4 2 2 Jan 7-14, 2016 58 34 5 2 1 Jan 7-11, 2015 61 33 3 2 1 Jan 15-19, 2014 61 30 6 2 2 Jan 9-13, 2013 65 29 3 2 2 Jan 11-16, 2012 61 31 5 1 1
Jan 5-9, 2011 61 31 4 2 3 Jan 6-10, 2010 63 30 4 1 2 Jan 7-11, 2009 60 32 5 1 2 January, 2008 60 33 4 1 2 January, 2007 63 31 3 1 2 January, 2006 62 30 4 2 2 January, 2005 67 29 3 1 * January, 2004 62 32 4 1 1 January, 2003 56 39 4 * 1 January, 2002 55 38 5 1 1 January, 2001 71 24 2 1 2 January, 2000 64 30 3 1 2
July, 1999 71 24 3 1 1 January, 1999 62 33 2 1 2 January, 1998 64 31 3 1 1 January, 1997 64 31 3 1 1
25
PEW RESEARCH CENTER
www.pewresearch.org
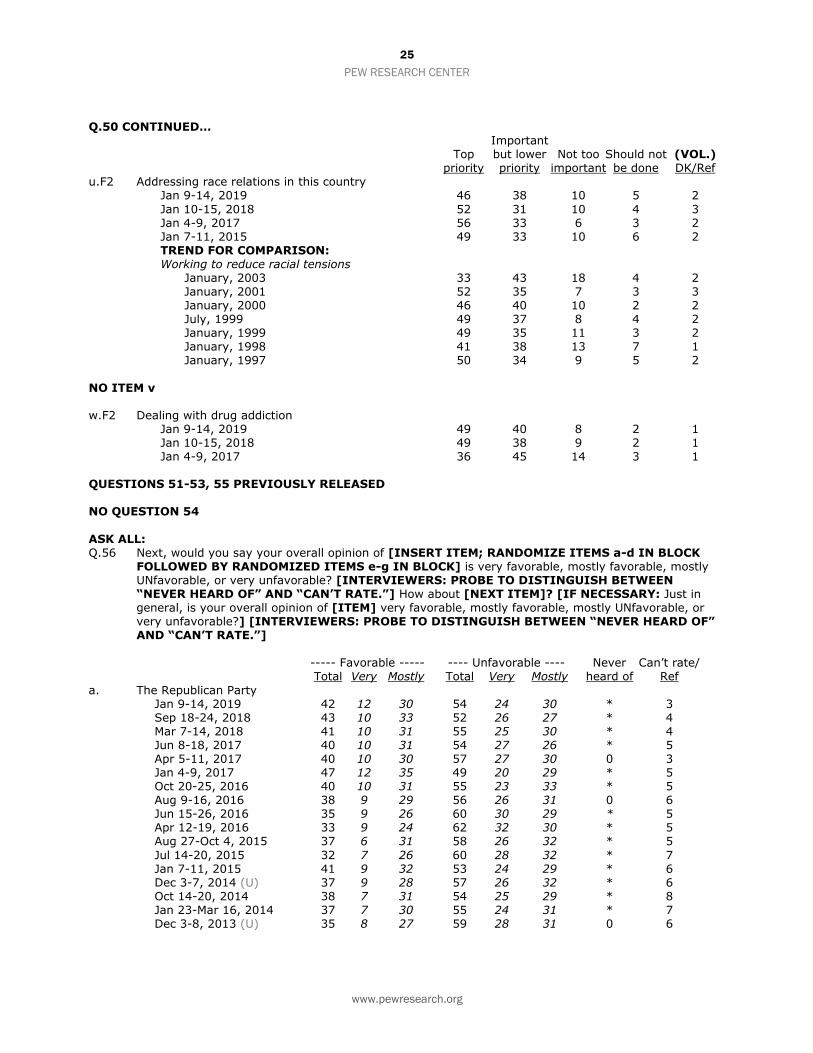
Q.50 CONTINUED… Important Top but lower Not too Should not (VOL.) priority priority important be done DK/Ref u.F2 Addressing race relations in this country Jan 9-14, 2019 46 38 10 5 2
Jan 10-15, 2018 52 31 10 4 3 Jan 4-9, 2017 56 33 6 3 2 Jan 7-11, 2015 49 33 10 6 2 TREND FOR COMPARISON: Working to reduce racial tensions January, 2003 33 43 18 4 2 January, 2001 52 35 7 3 3 January, 2000 46 40 10 2 2 July, 1999 49 37 8 4 2 January, 1999 49 35 11 3 2 January, 1998 41 38 13 7 1 January, 1997 50 34 9 5 2
NO ITEM v w.F2 Dealing with drug addiction Jan 9-14, 2019 49 40 8 2 1 Jan 10-15, 2018 49 38 9 2 1 Jan 4-9, 2017 36 45 14 3 1 QUESTIONS 51-53, 55 PREVIOUSLY RELEASED NO QUESTION 54
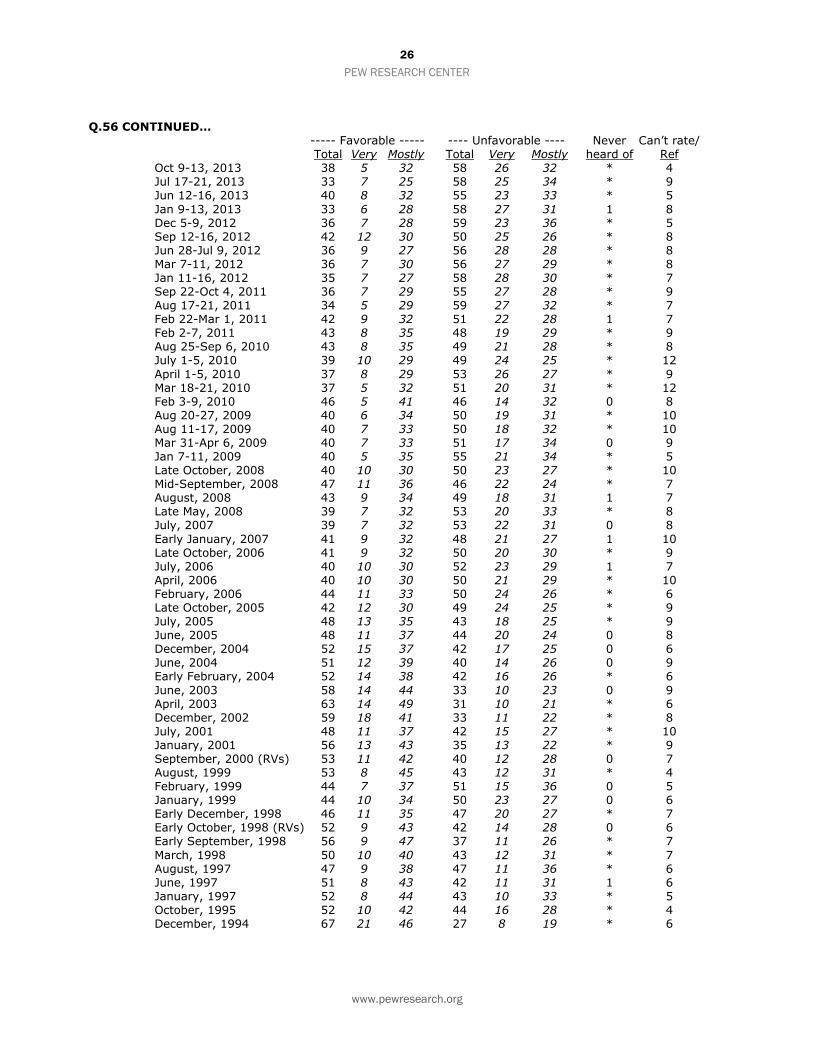
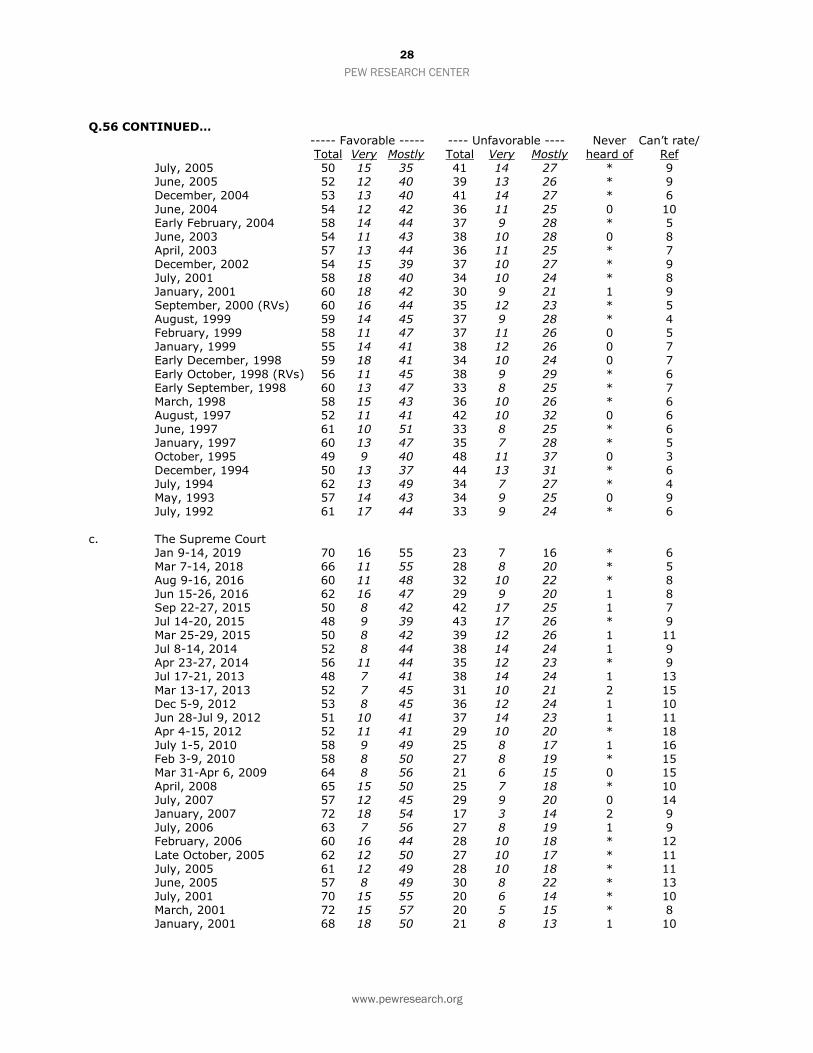
ASK ALL: Q.56 Next, would you say your overall opinion of [INSERT ITEM; RANDOMIZE ITEMS a-d IN BLOCK
FOLLOWED BY RANDOMIZED ITEMS e-g IN BLOCK] is very favorable, mostly favorable, mostly UNfavorable, or very unfavorable? [INTERVIEWERS: PROBE TO DISTINGUISH BETWEEN “NEVER HEARD OF” AND “CAN’T RATE.”] How about [NEXT ITEM]? [IF NECESSARY: Just in general, is your overall opinion of [ITEM] very favorable, mostly favorable, mostly UNfavorable, or very unfavorable?] [INTERVIEWERS: PROBE TO DISTINGUISH BETWEEN “NEVER HEARD OF” AND “CAN’T RATE.”]
----- Favorable ----- ---- Unfavorable ---- Never Can’t rate/ Total Very Mostly Total Very Mostly heard of Ref
a. The Republican Party Jan 9-14, 2019 42 12 30 54 24 30 * 3 Sep 18-24, 2018 43 10 33 52 26 27 * 4 Mar 7-14, 2018 41 10 31 55 25 30 * 4 Jun 8-18, 2017 40 10 31 54 27 26 * 5 Apr 5-11, 2017 40 10 30 57 27 30 0 3 Jan 4-9, 2017 47 12 35 49 20 29 * 5 Oct 20-25, 2016 40 10 31 55 23 33 * 5 Aug 9-16, 2016 38 9 29 56 26 31 0 6 Jun 15-26, 2016 35 9 26 60 30 29 * 5 Apr 12-19, 2016 33 9 24 62 32 30 * 5 Aug 27-Oct 4, 2015 37 6 31 58 26 32 * 5
Jul 14-20, 2015 32 7 26 60 28 32 * 7 Jan 7-11, 2015 41 9 32 53 24 29 * 6 Dec 3-7, 2014 (U) 37 9 28 57 26 32 * 6 Oct 14-20, 2014 38 7 31 54 25 29 * 8 Jan 23-Mar 16, 2014 37 7 30 55 24 31 * 7 Dec 3-8, 2013 (U) 35 8 27 59 28 31 0 6
26
PEW RESEARCH CENTER
www.pewresearch.org
Q.56 CONTINUED… ----- Favorable ----- ---- Unfavorable ---- Never Can’t rate/ Total Very Mostly Total Very Mostly heard of Ref Oct 9-13, 2013 38 5 32 58 26 32 * 4 Jul 17-21, 2013 33 7 25 58 25 34 * 9 Jun 12-16, 2013 40 8 32 55 23 33 * 5
Jan 9-13, 2013 33 6 28 58 27 31 1 8 Dec 5-9, 2012 36 7 28 59 23 36 * 5 Sep 12-16, 2012 42 12 30 50 25 26 * 8 Jun 28-Jul 9, 2012 36 9 27 56 28 28 * 8 Mar 7-11, 2012 36 7 30 56 27 29 * 8 Jan 11-16, 2012 35 7 27 58 28 30 * 7 Sep 22-Oct 4, 2011 36 7 29 55 27 28 * 9 Aug 17-21, 2011 34 5 29 59 27 32 * 7 Feb 22-Mar 1, 2011 42 9 32 51 22 28 1 7 Feb 2-7, 2011 43 8 35 48 19 29 * 9 Aug 25-Sep 6, 2010 43 8 35 49 21 28 * 8 July 1-5, 2010 39 10 29 49 24 25 * 12
April 1-5, 2010 37 8 29 53 26 27 * 9 Mar 18-21, 2010 37 5 32 51 20 31 * 12 Feb 3-9, 2010 46 5 41 46 14 32 0 8 Aug 20-27, 2009 40 6 34 50 19 31 * 10 Aug 11-17, 2009 40 7 33 50 18 32 * 10 Mar 31-Apr 6, 2009 40 7 33 51 17 34 0 9 Jan 7-11, 2009 40 5 35 55 21 34 * 5 Late October, 2008 40 10 30 50 23 27 * 10 Mid-September, 2008 47 11 36 46 22 24 * 7 August, 2008 43 9 34 49 18 31 1 7 Late May, 2008 39 7 32 53 20 33 * 8 July, 2007 39 7 32 53 22 31 0 8
Early January, 2007 41 9 32 48 21 27 1 10 Late October, 2006 41 9 32 50 20 30 * 9 July, 2006 40 10 30 52 23 29 1 7 April, 2006 40 10 30 50 21 29 * 10 February, 2006 44 11 33 50 24 26 * 6 Late October, 2005 42 12 30 49 24 25 * 9 July, 2005 48 13 35 43 18 25 * 9 June, 2005 48 11 37 44 20 24 0 8 December, 2004 52 15 37 42 17 25 0 6 June, 2004 51 12 39 40 14 26 0 9 Early February, 2004 52 14 38 42 16 26 * 6
June, 2003 58 14 44 33 10 23 0 9 April, 2003 63 14 49 31 10 21 * 6 December, 2002 59 18 41 33 11 22 * 8 July, 2001 48 11 37 42 15 27 * 10 January, 2001 56 13 43 35 13 22 * 9 September, 2000 (RVs) 53 11 42 40 12 28 0 7 August, 1999 53 8 45 43 12 31 * 4 February, 1999 44 7 37 51 15 36 0 5 January, 1999 44 10 34 50 23 27 0 6 Early December, 1998 46 11 35 47 20 27 * 7 Early October, 1998 (RVs) 52 9 43 42 14 28 0 6 Early September, 1998 56 9 47 37 11 26 * 7
March, 1998 50 10 40 43 12 31 * 7 August, 1997 47 9 38 47 11 36 * 6 June, 1997 51 8 43 42 11 31 1 6 January, 1997 52 8 44 43 10 33 * 5 October, 1995 52 10 42 44 16 28 * 4 December, 1994 67 21 46 27 8 19 * 6
27
PEW RESEARCH CENTER
www.pewresearch.org
Q.56 CONTINUED… ----- Favorable ----- ---- Unfavorable ---- Never Can’t rate/ Total Very Mostly Total Very Mostly heard of Ref July, 1994 63 12 51 33 8 25 * 4 May, 1993 54 12 42 35 10 25 0 11 July, 1992 46 9 37 48 17 31 * 6
b. The Democratic Party Jan 9-14, 2019 49 12 38 47 25 21 * 4 Sep 18-24, 2018 53 13 40 42 20 22 * 4 Mar 7-14, 2018 42 8 35 54 24 30 * 4 Jun 8-18, 2017 44 12 32 50 24 26 * 5 Apr 5-11, 2017 45 11 34 51 26 25 * 4 Jan 4-9, 2017 51 13 38 45 18 26 * 4 Oct 20-25, 2016 52 15 37 45 22 22 * 4 Aug 9-16, 2016 49 15 35 46 22 24 * 5 Jun 15-26, 2016 49 17 33 46 23 23 * 5 Apr 12-19, 2016 45 14 31 50 27 23 * 4
Aug 27-Oct 4, 2015 45 10 35 50 24 26 * 5 Jul 14-20, 2015 48 12 36 47 22 25 0 5 Jan 7-11, 2015 46 12 34 48 21 28 * 6 Dec 3-7, 2014 (U) 41 11 30 54 26 28 * 5 Oct 15-20, 2014 47 11 35 46 21 25 * 7 Jan 23-Mar 16, 2014 46 12 34 47 23 24 * 7 Dec 3-8, 2013 (U) 47 15 32 48 24 24 * 5 Oct 9-13, 2013 47 9 39 48 22 27 0 4 Jul 17-21, 2013 41 10 31 50 23 28 * 9 Jun 12-16, 2013 51 14 37 45 19 26 0 5 Jan 9-13, 2013 47 13 34 46 18 28 * 7 Dec 5-9, 2012 48 11 37 47 23 25 1 4
Sep 12-16, 2012 53 21 32 40 18 22 * 7 Jun 28-Jul 9, 2012 47 14 33 45 21 24 * 8 Mar 7-11, 2012 49 14 36 43 18 25 * 7 Jan 11-16, 2012 43 13 29 51 23 28 * 7 Sep 22-Oct 4, 2011 46 13 32 45 19 26 * 9 Aug 17-21, 2011 43 9 34 50 21 29 * 7 Feb 22-Mar 1, 2011 48 14 34 45 18 27 * 6 Feb 2-7, 2011 47 13 35 46 17 29 * 6 Aug 25-Sep 6, 2010 50 13 36 44 20 24 * 7 July 1-5, 2010 44 12 31 45 22 23 * 11 April 1-5, 2010 38 9 29 52 27 25 * 9
Mar 18-21, 2010 40 8 32 49 25 24 * 11 Feb 3-9, 2010 48 9 39 44 17 27 * 8 Aug 20-27, 2009 48 11 37 43 19 24 * 10 Aug 11-17, 2009 49 12 37 40 16 25 * 10 Mar 31-Apr 6, 2009 59 15 44 34 13 21 * 7 Jan 7-11, 2009 62 19 43 32 12 20 * 6 Late October, 2008 57 19 38 33 15 18 * 10 Mid-September, 2008 55 18 37 39 14 25 * 6 August, 2008 57 16 41 37 13 24 * 6 Late May, 2008 57 14 43 37 14 23 * 6 July, 2007 51 13 38 41 14 27 0 8 Early January, 2007 54 15 39 35 12 23 * 11
Late October, 2006 53 13 40 36 11 25 * 11 July, 2006 47 13 34 44 13 31 2 7 April, 2006 47 12 35 42 14 28 * 11 February, 2006 48 14 34 44 17 27 0 8 Late October, 2005 49 14 35 41 15 26 * 10
28
PEW RESEARCH CENTER
www.pewresearch.org
Q.56 CONTINUED… ----- Favorable ----- ---- Unfavorable ---- Never Can’t rate/ Total Very Mostly Total Very Mostly heard of Ref July, 2005 50 15 35 41 14 27 * 9 June, 2005 52 12 40 39 13 26 * 9 December, 2004 53 13 40 41 14 27 * 6
June, 2004 54 12 42 36 11 25 0 10 Early February, 2004 58 14 44 37 9 28 * 5 June, 2003 54 11 43 38 10 28 0 8 April, 2003 57 13 44 36 11 25 * 7 December, 2002 54 15 39 37 10 27 * 9 July, 2001 58 18 40 34 10 24 * 8 January, 2001 60 18 42 30 9 21 1 9 September, 2000 (RVs) 60 16 44 35 12 23 * 5 August, 1999 59 14 45 37 9 28 * 4 February, 1999 58 11 47 37 11 26 0 5 January, 1999 55 14 41 38 12 26 0 7 Early December, 1998 59 18 41 34 10 24 0 7
Early October, 1998 (RVs) 56 11 45 38 9 29 * 6 Early September, 1998 60 13 47 33 8 25 * 7 March, 1998 58 15 43 36 10 26 * 6 August, 1997 52 11 41 42 10 32 0 6 June, 1997 61 10 51 33 8 25 * 6 January, 1997 60 13 47 35 7 28 * 5 October, 1995 49 9 40 48 11 37 0 3 December, 1994 50 13 37 44 13 31 * 6 July, 1994 62 13 49 34 7 27 * 4 May, 1993 57 14 43 34 9 25 0 9 July, 1992 61 17 44 33 9 24 * 6
c. The Supreme Court Jan 9-14, 2019 70 16 55 23 7 16 * 6 Mar 7-14, 2018 66 11 55 28 8 20 * 5 Aug 9-16, 2016 60 11 48 32 10 22 * 8 Jun 15-26, 2016 62 16 47 29 9 20 1 8 Sep 22-27, 2015 50 8 42 42 17 25 1 7 Jul 14-20, 2015 48 9 39 43 17 26 * 9 Mar 25-29, 2015 50 8 42 39 12 26 1 11 Jul 8-14, 2014 52 8 44 38 14 24 1 9 Apr 23-27, 2014 56 11 44 35 12 23 * 9 Jul 17-21, 2013 48 7 41 38 14 24 1 13
Mar 13-17, 2013 52 7 45 31 10 21 2 15 Dec 5-9, 2012 53 8 45 36 12 24 1 10 Jun 28-Jul 9, 2012 51 10 41 37 14 23 1 11 Apr 4-15, 2012 52 11 41 29 10 20 * 18 July 1-5, 2010 58 9 49 25 8 17 1 16 Feb 3-9, 2010 58 8 50 27 8 19 * 15 Mar 31-Apr 6, 2009 64 8 56 21 6 15 0 15 April, 2008 65 15 50 25 7 18 * 10 July, 2007 57 12 45 29 9 20 0 14 January, 2007 72 18 54 17 3 14 2 9 July, 2006 63 7 56 27 8 19 1 9 February, 2006 60 16 44 28 10 18 * 12
Late October, 2005 62 12 50 27 10 17 * 11 July, 2005 61 12 49 28 10 18 * 11 June, 2005 57 8 49 30 8 22 * 13 July, 2001 70 15 55 20 6 14 * 10 March, 2001 72 15 57 20 5 15 * 8 January, 2001 68 18 50 21 8 13 1 10
29
PEW RESEARCH CENTER
www.pewresearch.org
Q.56 CONTINUED… ----- Favorable ----- ---- Unfavorable ---- Never Can’t rate/ Total Very Mostly Total Very Mostly heard of Ref October, 1997 77 13 64 18 6 12 * 5 May, 1997 72 16 56 22 5 17 0 6 July, 1994 80 18 62 16 3 13 * 4
May, 1993 73 17 56 18 4 14 0 9 November, 1991 72 18 54 21 5 16 0 7 May, 1990 65 10 55 25 7 18 1 9 January, 1988 79 14 65 13 2 11 * 8 May, 1987 76 13 63 17 2 15 * 7 Roper: March 1985 64 17 47 28 7 21 -- 8 ASK FORM 1 ONLY [N=765]: Q.57F1 Thinking about the Republican Party these days, do you think it is [READ AND RANDOMIZE] in its
views on issues and vision for the future? (RVs)
Jan 9-14 Oct 25-30 Apr 5-11 Oct 20-25 2019 2017 2017 2016 37 Mostly united 23 29 17 57 Mostly divided 72 68 80 5 Don't know/Refused (VOL.) 4 3 3 ASK FORM 2 ONLY [N=740]: Q.58F2 Thinking about the Democratic Party these days, do you think it is [READ AND RANDOMIZE] in its
views on issues and vision for the future? (RVs) Jan 9-14 Oct 25-30 Apr 5-11 Oct 20-25
2019 2017 2017 2016 44 Mostly united 43 49 58 50 Mostly divided 52 48 39 6 Don't know/Refused (VOL.) 5 4 4 QUESTIONS 59-63, 69-71, 83c, 86-88, 90-92, 97-98 PREVIOUSLY RELEASED NO QUESTIONS 64-68, 72-82, 84-85, 89, 93-96 QUESTION 83 ADDITIONAL ITEMS HELD FOR FUTURE RELEASE
ASK ALL: PARTY In politics TODAY, do you consider yourself a Republican, Democrat, or independent? ASK IF INDEP/NO PREF/OTHER/DK/REF (PARTY=3,4,5,9): PARTYLN As of today do you lean more to the Republican Party or more to the Democratic Party? (VOL.) (VOL.) No Other (VOL.) Lean Lean Republican Democrat Independent preference party DK/Ref Rep Dem Jan 9-14, 2019 25 31 40 2 1 2 16 18 Sep 18-24, 2018 25 32 37 3 1 2 15 18 Jun 5-12, 2018 25 31 38 3 1 2 15 18 Apr 25-May 1, 2018 27 28 38 4 1 2 14 19
Mar 7-14, 2018 26 28 41 3 * 1 17 18 Jan 10-15, 2018 26 33 34 3 1 3 12 18 Yearly Totals 2018 25.7 30.8 37.6 3.0 .8 2.0 14.7 18.3 2017 23.6 31.4 39.4 3.3 .6 1.7 15.8 18.7 2016 25.4 32.0 36.5 3.4 .5 2.2 14.6 17.0
30
PEW RESEARCH CENTER
www.pewresearch.org
PARTY/PARTYLN CONTINUED… (VOL.) (VOL.) No Other (VOL.) Lean Lean Republican Democrat Independent preference party DK/Ref Rep Dem 2015 23.7 30.4 40.1 3.6 .4 1.8 16.4 17.3 2014 23.2 31.5 39.5 3.1 .7 2.0 16.2 16.5
2013 23.9 32.1 38.3 2.9 .5 2.2 16.0 16.0 2012 24.7 32.6 36.4 3.1 .5 2.7 14.4 16.1 2011 24.3 32.3 37.4 3.1 .4 2.5 15.7 15.6 2010 25.2 32.7 35.2 3.6 .4 2.8 14.5 14.1 2009 23.9 34.4 35.1 3.4 .4 2.8 13.1 15.7 2008 25.7 36.0 31.5 3.6 .3 3.0 10.6 15.2 2007 25.3 32.9 34.1 4.3 .4 2.9 10.9 17.0 2006 27.8 33.1 30.9 4.4 .3 3.4 10.5 15.1 2005 29.3 32.8 30.2 4.5 .3 2.8 10.3 14.9 2004 30.0 33.5 29.5 3.8 .4 3.0 11.7 13.4 2003 30.3 31.5 30.5 4.8 .5 2.5 12.0 12.6 2002 30.4 31.4 29.8 5.0 .7 2.7 12.4 11.6
2001 29.0 33.2 29.5 5.2 .6 2.6 11.9 11.6 2001 Post-Sept 11 30.9 31.8 27.9 5.2 .6 3.6 11.7 9.4 2001 Pre-Sept 11 27.3 34.4 30.9 5.1 .6 1.7 12.1 13.5 2000 28.0 33.4 29.1 5.5 .5 3.6 11.6 11.7 1999 26.6 33.5 33.7 3.9 .5 1.9 13.0 14.5 1998 27.9 33.7 31.1 4.6 .4 2.3 11.6 13.1 1997 28.0 33.4 32.0 4.0 .4 2.3 12.2 14.1 1996 28.9 33.9 31.8 3.0 .4 2.0 12.1 14.9 1995 31.6 30.0 33.7 2.4 .6 1.3 15.1 13.5 1994 30.1 31.5 33.5 1.3 -- 3.6 13.7 12.2 1993 27.4 33.6 34.2 4.4 1.5 2.9 11.5 14.9 1992 27.6 33.7 34.7 1.5 0 2.5 12.6 16.5
1991 30.9 31.4 33.2 0 1.4 3.0 14.7 10.8 1990 30.9 33.2 29.3 1.2 1.9 3.4 12.4 11.3 1989 33 33 34 -- -- -- -- -- 1987 26 35 39 -- -- -- -- --
ASK REPUBLICANS AND REPUBLICAN LEANERS (PARTY=1 OR PARTYLN=1): Q.99 Would you like to see Republican leaders in Washington move in a more conservative direction
or a more moderate direction? BASED ON REPUBLICAN AND REPUBLICAN-LEANING INDEPENDENTS [N=657]: More More (VOL.) (VOL.) conservative moderate No change DK/Ref Jan 9-14, 2019 57 39 1 3 Nov 10-14, 2016 (Voters) 60 36 1 3 Jan 7-14, 2016 52 39 2 7 Nov 6-9, 2014 57 39 1 4 Jul 8-14, 2014 53 42 1 4 Jul 17-21, 2013 54 41 2 4 Nov 8-11, 2012 (Voters) 57 35 3 5
Nov 4-7, 2010 56 38 2 5 Jun 16-20, 2010 57 37 2 5 Jan 6-10, 2010 51 42 2 5 November, 2008 (Voters) 60 35 1 4
31
PEW RESEARCH CENTER
www.pewresearch.org
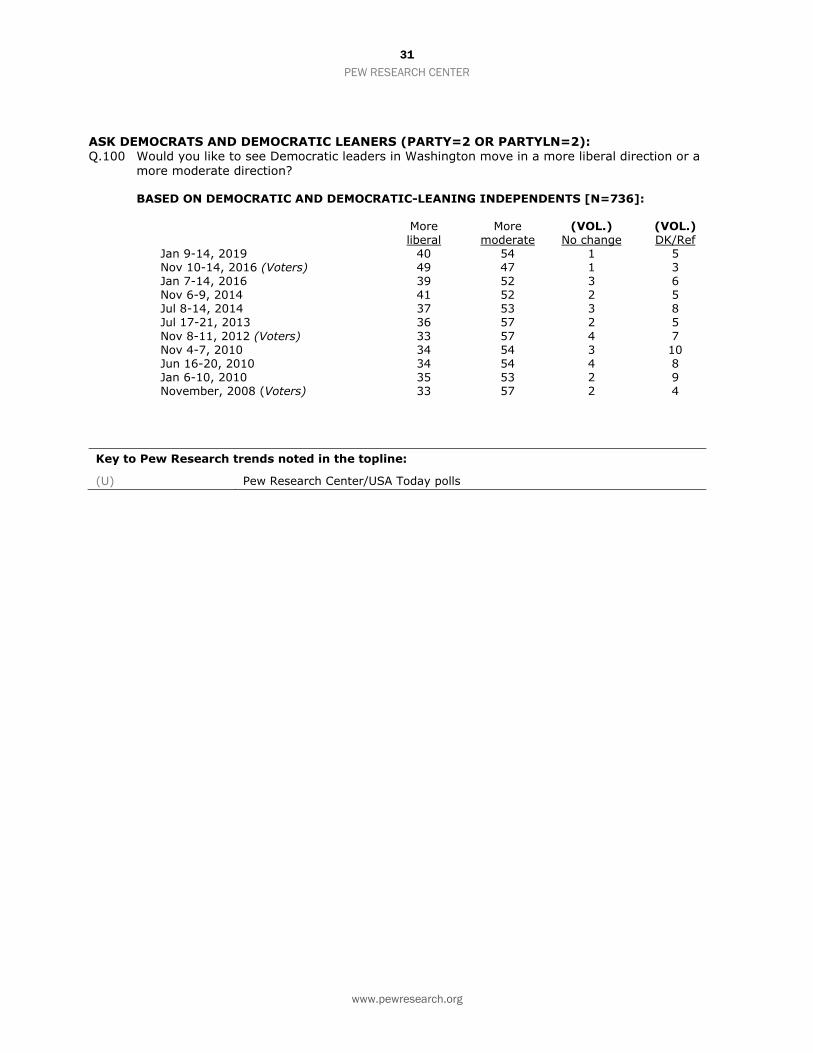
ASK DEMOCRATS AND DEMOCRATIC LEANERS (PARTY=2 OR PARTYLN=2): Q.100 Would you like to see Democratic leaders in Washington move in a more liberal direction or a
more moderate direction? BASED ON DEMOCRATIC AND DEMOCRATIC-LEANING INDEPENDENTS [N=736]: More More (VOL.) (VOL.) liberal moderate No change DK/Ref Jan 9-14, 2019 40 54 1 5 Nov 10-14, 2016 (Voters) 49 47 1 3 Jan 7-14, 2016 39 52 3 6 Nov 6-9, 2014 41 52 2 5 Jul 8-14, 2014 37 53 3 8 Jul 17-21, 2013 36 57 2 5
Nov 8-11, 2012 (Voters) 33 57 4 7 Nov 4-7, 2010 34 54 3 10 Jun 16-20, 2010 34 54 4 8 Jan 6-10, 2010 35 53 2 9 November, 2008 (Voters) 33 57 2 4
Key to Pew Research trends noted in the topline:
(U) Pew Research Center/USA Today polls


