
PART III
PHASE EQUILIBRIA INVESTIGATIONS OFBINARY, TERNARY, AND HIGHER
ORDER SYSTEMS0
"PART Ill. PHASE EQUINJBRIA STUDIES IN THE Nb-Ta,.C SYSTEM
F- BOOKER a(nl E. RI'DY
TECHNICAL REPORT AFML-TR-6").1 7. PART Ijl
MAY 197o
This docUt'fnnt has ineen appr-,'(,d foy pimit rsIleaM2 aml sale:its distriblifion is im nliited!
AIR FORCE MATERIA.LS LABOR:\TORYAIR FORCE SYSTIE.MS COMMANI)
\V I(! IT-I-\TTIASON AIR FOI;CE R•ASE. 011O1
NOTICES
When Government drawings, specifications, or other data are usedfor any purpose other than in connection with a definitely related Governmentprocurement operation, the Uni:ed States Government thereby incurs noresponsibility nor any obligation whatsoe-'er, and the fact that the Govern-ment may ha,,e formulated, furnished, or in any way supplied the said draw-ings, specifications, or other data, is not to be regarded, by implication orotherwise, as in any manner licensing the holder or any other person orcorporation, or conveying any rights or permission to manufacture, use, orsell any patented invention that may in any way be related thereto. Thisdocument has been approved for public release and sale; its distribution isunlimited.
IMiT~fIC•TOU
I?
Copies ol this report should not be returned unless return is required bysecurity consideration, contractual obligations, %,r notice cn a specficdocument.
600 - June 1970 - C04•S - 123-2a11

PHASE EQUILIBRIA INVESTIGATIONS OFBINARY, TERNARY, AND HIGHER
ORDER SYSTEMS
PART fl. PHASE EQWUBMA STUDIES IN THE NbWTa-C SYSITM
P. BOOKER and E. RUDY
Ih document has be appoved f public relme nd sAne;its distribufi is unlmited

FOREWORD
The experimental research described in this technical report wascarried out at the Materials Research Laboratory, Aerojet-General Corpora-tion, Sacramento, California, under USAF Contract F33615-67-C-1513,Project 7350, Task 735001. The contract was administered under the direc-tion of the Air Force Materials Laboratory (MAMC), with Capt. P. J. Marchiando,as Project Engineer, and Dr. E. Rudy, Aerojet-General Corporation (now at theOregon Graduate Center, Portland, Oregon) serving as Principal Investigator.
The authors wish to acknowledge the help of Messrs J. Pomodoro(fabrication of samples), and of R. Crisloni, who prepared the drawings.
The manuscript of this report was released by the authors March 1970for publication.
Other reports issued, or in preparation, under USAF ContractF33615-67-C-1513, include!
Part I. The Pbase Diagrams of the Systems Ti-Nb-C, Ti-Ta-C,and Ti-Mo-C
Part II. Effect of Re and Al Additions on the Metal-Rich PhaseEquilibria in the Ti-Mo-C and Ti-Nb-C Systems.
This technical report has been reviewed and is api-roved.
Chief, Ceramics and Graph.;te BranchMetals and Ceramics DivisionAir Force Materials Laborate, y
ii

ABSTRACT
The solid state and solid-liquid equilibria of the Nb-Ta-C systemhbave oeen determined by melting point determinations, X-ray and cherni%.a;analysis, metallography, and differential thermal analysis for temperaturesabove 1500"C.
The ternary system has a complete solid solution of monocarbidesand also of subcarbides if the fifference in carbon atom ordering is dis -regarded. Eutectic troughs in both the metal-rich axd carbon-rich regionsof the ternary are present. Calculated tie-line distributions agree wel withexpe'rimental results.
11?

TABLE OF CONTENTS
I. Introduction and Summary |
A. Introduction 1
B. Summary 1
II. Literature Review 5
A. 'I he Tantalum -Niobium System 5
B. The Niobium-Carbon System 6
C. The Tantalum-Carbon System 7
D. The Niobium-Tantaluto-Carbon Sisterm 8
Ill. Experimental Program 9
A. Starting Materials 9
B. Alloy Preparation and Heat Treatments I 0
C. Determination of Melting Points 12
D. Differential Thermri Analysis (DTA) 213
E. Metallography 14
F. X --Ray Analysis 14
G. Chernical Analysis 13
IV. Experimental Results 16
A. The Tantalum-Niobium Binary System 16
B. Solid State Phase Equilibria in the Ternary 77Nb-Ta-C System
C. Phase Equilibria at High Temperature 27
D. Assembly of the Phase Diagram 42
V. Conclusions and Discussion 49
References 55
iv

ILLUSTRATIONS
FIGURE PAGE
1. Nb-Ta: Phase Diagram 1
2. Nb-Ta-C- Constitution Diagram 3
3. Nb-Ta-C: Scheil-Schulz Reaction L 3gram
4. Nb-Ta-C: Liquidus Projections 4
5. Nb-Ta-C: Isopleth at 32.5 Atomic % Carbon 4
6. Nb-Ta: Phase Diagram 5
7. Nb-C: Phase Diagram 6
8. Ta-C: Phase Diagram 7
S9. Nb-Ta-C: Compositions of Melting Point Samples 11
10. Nb-Ta-C: Compositions of Alloys Investigated byDifferential Thermal Analysis 12
11. Nb-TA-C: Compositions of Solid-State Sampies
Heat-Treated at 1500 and 180O0C 13
12. Nb-Ta: Melting Temperatures 16
13. Nb-Ta-C: Qualitative X-Ray Evaluation of AlloysEquilibrated at 1800"C 17
14. Nb-Ta-C: Qualitative X-Ray Evaluation of AlloysEquilibrated at 1500C 18
15. Nb-Ta-C: Lattice Parameters of the TernaryMonocarbide Solid Solutions 19
16. Nb-Ta-C: Lattice Parameters of the TernarySubcarbide Solid Solutions 20
17. Nb-Ta-C: Order-Disorder Phase Reaction of Nb C andTa2 C in Ternary Alloys 22
18. Nb-Ta-C: Photomicrograph of a DTA Sample147120/33 At.%) 23
19. Nb-Ta-C: Photomicrograph cf a DTA Sample(55/12/33 At.%) 24
v
ILLUSTRATIONS (Cont)
FIGURE PAGE
20. Nb-Ta-C: a - 6-Nb 2 C Phase Reaction in Ternary Alloys 25
21. Nb-Ta-C: Phoýtomicrograph of a DTA Sample(55/12/33 At. %) 26
Z2. Nb-Ta-C: Photomicrograph of a DTA Sample(62/5/33 At.%) 27
23. Nb-Ta-Ct Photomicrograph of an Arc-Melted Sample(49/4912 At.%) 28
24. Nb-Ta-C: Photomicrograph of an Arc-Melted Sample(48/47/5 At.%) 29
25. Nb-Ta-C: Photomicrograph of an Arc-Melted Sample(46/46/8 At.%) 29
26. Nb-TA-C: Melting Temperatures and Location of theMetal-Rich Eutectic Trough Between (Nb, Taa) and(Nb. Ta)2 C 30
27. Nb-Ta-C: Photomicrograph of an Arc-Melted Sample(75/14/11 At.%) 31
28. Nlb-Ta-C: Photomicrograph of an Arc-Melted Sample(33/59/11 At.%) 31
29. Nb-Ta-C: Photomicrograph of an Arc-Melted Sample(15/73/12 At.%) 32
30. Nb-Ta-C: Phot,,icrograph cf a DTA Sample(62/10/28 At.%) 33
31. Nb-Ta-C: Photomicrograph of a DTA Sample(32/40/28 At.%) 33
32. Nb-Ta-C: Peritectic Melting Temperatures of theSolid Solution (Nb, Ta)2 C 34
33. Nb-Ta-C: Photomicrograph of a Melting Point Sample(60/5/35 At.%) 35
34. Nb-Ta-C: Photomicrog:aph of a Melting Point Sample(47/18/35 At.%) 36
35. Nb-Ta-C: Maximum Solidus Temperatures of theTernary Monocarbide Phase 37
vi

IILLUSTRATIONS (Cont)
FIGURE PA'3E
36. Nb-Ta-C: Photornicrograph of a Melting Point Samplh(1/43/47 At. 'A 38
37. Nb- Ta-C: Photomicrograph of a Melting Point Sample(25/30/45 At.%) 38
38. Nb-Ta-C: Photomicrograph of a Melting Point Sample(40/15/45 At.%) 39
39. Nb-Ta-C: Experiment.-0 Solidus Temperatures andLocation of the Eutecttc Trough Between the Mono-carbide Solid Solution and Graphite 40
40. Nb-Ta-C: Photomicrograph of a Melting Point Sample(11/28/61 At.%) 41
41. Nb-Ta-C: Photrnicrograph of a Melting Point Sample(33/6/61 At. %) 41
42-53 Nb-Ta-C: Isothermal Sections at 1500, 1800, 2200,2400, 2600, 2900, 3200, 3320, 3440, 3600, 3650, and3800"C 49-48
54. Nb-Ta-C: Liquidus Projections 48
55. Nb-Ta-C: Schematic Illustration for the Formation ofthe 7 -(Nb, Ta)2C I xPhase 50
56. Nb-Ta-C: Calculated Section at 1800"C 53
57. Nb-T;.-C: Calculated Section at 1500"C 54
vii

TABLE PAGE
I Structure and Lattice Parameters of Niobium andTantalumr Carbides 8
2 Carbon Analyses and Lattice Parameters of Carbide
Starting Materials 10
3 Free Enthalpy Data of Niobium Carbides 51
4 Free Enthalpy Data of Tantalum Carbides 51
viii
I

I. INTRODUCTION AND SUMMARY
A. INTRODUCTION
The continuing work on the delinearization of the high-
temperature phase equilibria of binary, ternary, and higher order refractory
metal-carbide, boride, nitride, and silicide systems is directed in this re-
port to the study of the Nb-Ta-C system with the expressed purpose of using
w e data generated for possible applications in the field of new cutting tools
containing refractory metal alloys as a binder phase.
B. SUMMARY
Figure I shows results of the new investigations in Nb-Ta
binary system; the narrow two-phase region of liquid and melt has been
confirmed.
A Incipient melting3100 3014 E Specimen collapsed
* Melted isothermallyi "- .( Tinc =Tcoll" )
20 0
cc
S2700-
4,.,
2500-26.-8.
2300
0 20 40 60 80 100
To - ATOMIC % NIOBIUM - Nb
Figure 1. Nb-Ta: Phase Diagram
?1
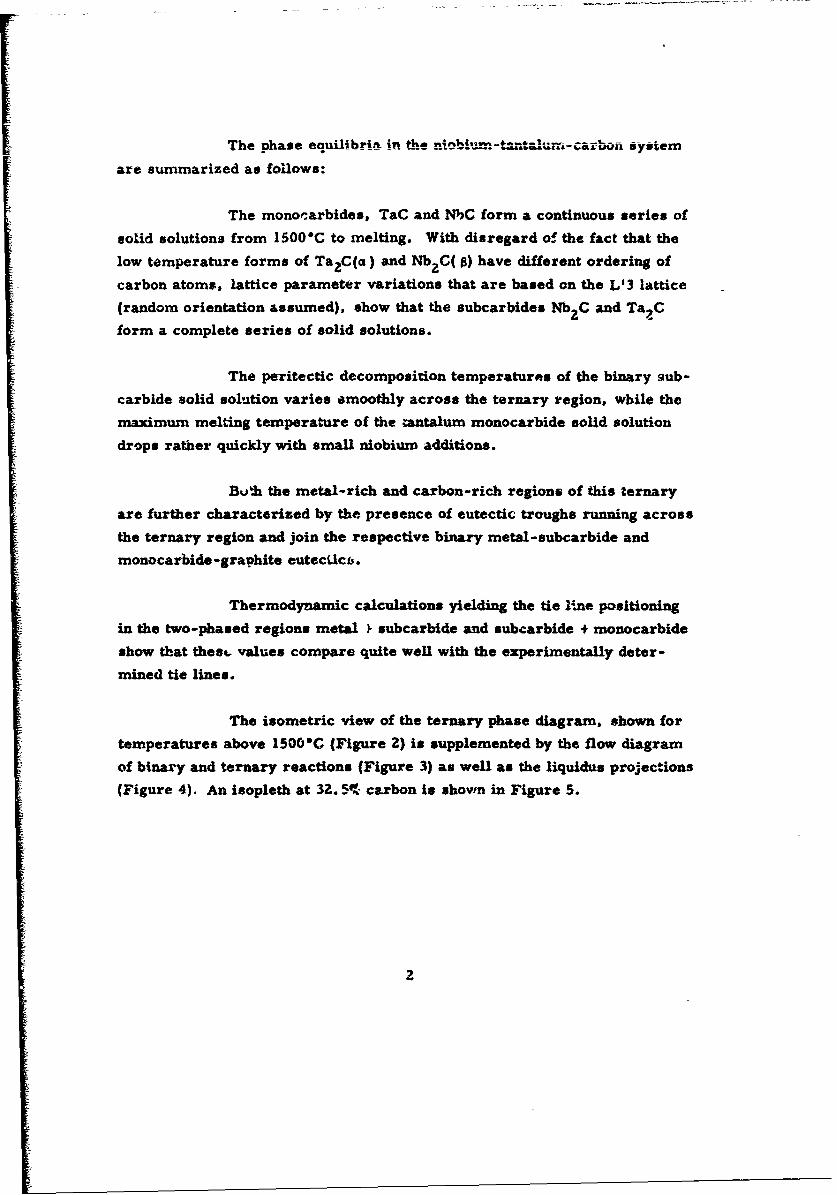
The phase equilibria in the nFobiu.-.-tntalum-arbon systern
are summarized as follows:
The monocarbides, TaC and NhC form a continuous series of
solid solutions from 1500"C to melting. With disregard of the-fact that the
low temperature forms of Ta 2 C(a ) and NbzC( 0) have different ordering of
carbon atoms, lattice parameter variations that are based on the L'3 lattice
(random orientation assumed), show that the subcarbides Nb2 C and TaC
form a complete series of solid solutions.
The peritectic decomposition temperatures of the binary qub-
carbide solid solution varies smoothly across the ternary region, while the
maximum melting temperature of the tantalum monocarbide solid. solution
drops rather quickly with small niobium additions.
Buh the metal-rich and carbon-rich regions of this ternary
are further characterized by the presence of eutectic troughs running across
the ternary region and join the respective binary metal-subcarbide and
monocarbide-graphite eutecilcb.
Thermodynamic calculations yielding the tie line positioning
in the two-phased regions metal ý subcarbide and subcarbide + monocarbide
show that thest values compare quite well with the experimentally deter-
mined tie lines.
The isometric view of the ternary phase diagram, shown for
temperatures above 150COC (Figure 2) is supplemented by the flow diagram
of binary and ternary reactions (Figure 3) as well as the liquidus projections
(Figure 4). An isopleth at 32. 50- carbon is shovwn in Figure 5.

\.61%
.44V III'c440'
2600-
?400-4
-200.
200
C-%
t. 200
%30uw 7.N0aC osttto iga
901 1240T *flL
1ho00. 0 ~yS
Figur 2. N- IC _osiuio iga
To-M T.-b)-s ?sTOt% -5s4C-tI+ L ~ ~ - + + *
+3 33

240- 35000
36138 .......
Nb-- 340 ATI 350 TANALM 0T
Fiue40bT-:Liuu rjcin
3320
305- 320
29033(
2 000 0609 0
NNb 4 -TMI TANTALUM EXHNEAOoC% STC 4
Fig ure 5. Nb-Ta-C: Lsopleh at3.5AomeciconCabo
34004

II. LITERATURE REVIEW
A. THE TANTALUM-NIOBIUM SYSTEM
These two metals form a continuous series of solid solutions
in the body centered cubic structurel); the phase diagram was determined
by Williams and Pechin}; the constitution diagram, showing the smooth
variation in solidus temperatures, is giver in Figure 6.
Wt% Tantalum20 40 60 70 80 90
3000
2800
S 2400
2000
(Cb, Ta)
2200
S0?9 40 60 80 O00
At. • Tantalum
7igure 6. Nb-Ta: %hase Diagram(2)
5

B. THE NIOBIUM-CAR.BON SYSTEM
The investigations of the niobium-carbon system by
E. K. Storms and N. H. Krikorian 3 ) and H. Kimura and Y. Sasaki•4" were
recently supplemented by E. Rudy, et al. (5,6) The system, Figure 7, con-
tains a very refractory monocarbide with the B-i structure (Table 1) and a
subcarbide, which exists in at least two different states of sublattice order at
low temperntures 5 1 1 l, and in a disordered state above approximately Z500"C{6 ).
The melting point measurements by E. Rudy, et al. (5) are in close confirmation
of the data by H. Kimura and Y. Sasaki| 4 1.
3600- 44-1
L "1L L+C
3400L4NbC 305±20
3200 0 -49 6O-+3035"±-200• + 37±1
C 3000WJ NbC+ CSL u Nb;
42800
" 2600 2 2468-10 e ."
24000 2l 24400
2 200 10.51-'05U
Nb+ Nb2C(IO) e - 49.6zooo
0 10 20 30 40 50 60 70Nb ATOMIC % CARBON
Figure 7. Nb-C: Phase Diagram(5 ' 6,
6

C. THE TANTALUM-CARBC)1 SYSTEM
The inost recent phase diagram (1~of the tantalumn-ca~rbon
system is shown in F~igure 8. The system contains an extremely refractory,
cubic monocarbide aiid a peritectically decomposing, hexagonal subcarbide.
The ordered, law-twnperature modification of TaC transforms at tem-
peratures between 2' 0 10 and 2200'C(12 into another modification, which is
characterized by the absence of Jong-range ordee in the carbon sublattice.
With the exception c'f the displacive transformation. which is absent in Ta C,
the transformation chara-teristics are similar to that of Mo 2 C. Another
phase, ,reported to occur in the vicinity of 40 At. % carbon (1w4) idi
cated to be only metastable (215;the latter viewpoint, however, was dis-
puted in more recent work (1 6 ) . A compilation of structural data as well as
of lattice parametera for the tantalum2 carbide. is also contained in Table 1.
3985±40047±0.5
3500- 3330±3C034±6
'Ii 61±0.55
x1 3000
Ta+Taj($
At.U.1500Tu 2C(fl)
0 10 20 30 4020±0 60 0 8
((1)Figur 8.T-:LaeDaga hddAe
Show the Rang 3f th 4M-ta498as% C
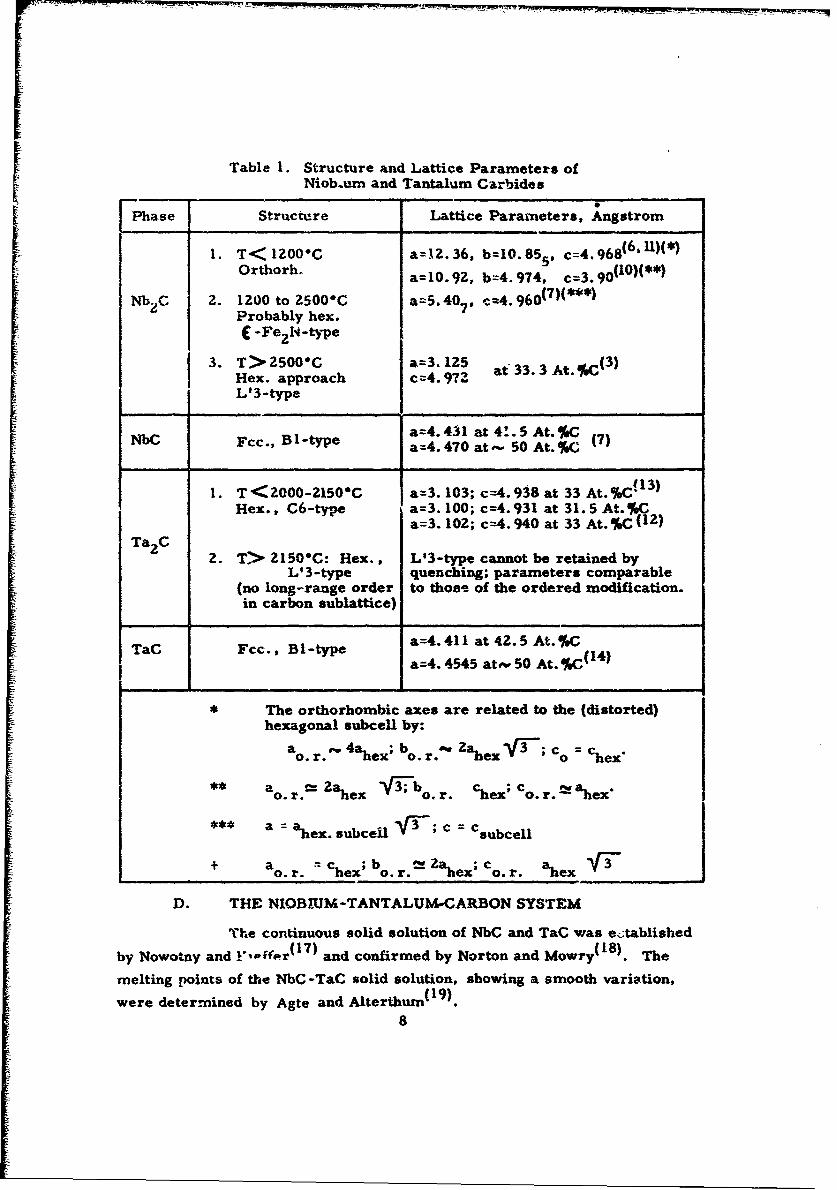
Table 1. Structure and Lattice Parameters ofNiob.um and Tantalum Carbides
Phase Structure Lattice Parameters, Angstrom
1. T< 1200"C a=12.36, b=10.85,, c=4.968(6.,,,,1)(*)
Orthorh. a=10.9Z, b=4.974, c=3.90(lO)(**)
Nb zC 2. 1200 to 2500*C a=5.40 7, -=4.960(7)(***)
Probably hex.C -Fe 2 1-4tye
3. T> 2500"C a=3. 125 atL3.3A.%(3)
Hex. approach c=4. 97t1L'3-type
NbC FCC., Bl-type a=4.431 at 4!.5 At.%C
"'b .,Btp a=4. 470 at, -50 At. %C
1 113)1. T<2000-2150&C a=3.103; c=4.938 at 33 At. %C'
Hex., C6-type a=3. 100; c=4. 931 at 31.5 At.%Ca=3. 102; c--4. 940 at 33 At. %C (12)
TazC 2. T> 21506C: Hex., L'3-type cannot be retained byL' 3-type quenching; parameters comparable
(no long-range order to those of the ordered modification.in carbon sublattice)
TaC Fcc., Bl-type a=4.411at42.5At.%Ca=4. 4545 at-% 50 At. %C(14)
* The orthorhombic axes are related to the (distorted)hexagonal subcell by:
a r. - b . r. " co = Chex '
** ao. r.O: 2-ahex VT b o.r. chex; co.r.2 ahex"
*** a = ahex. subceU -V3; c = CsubceU
+ ao. r. ". Chex;bo. r. r. ahex
D. THE NIOBXUM-TANTALUMCARBON SYSTEM
The continuous solid solution of NbC and TaC was e-tablishedby Nowotny and !'- •er(17) and confirmed by Norton and Mowry( 1 8 ). The
melting points of the NbC-TaC solid solution, showing a smooth variation,
were determined by Agte and Alterthum( 1 9 ).8

FF
14-
A, STARTING MATERIALS
Th3 elemental powders, as well as alloys consisting of Nb C,
NbC, Ta 2 C, and TaC, served as the stat ng materials for the preparation
of the experimental alloys.
Niobium metal powder was purchased from the Wah Chang
Corporation, Albany, Oregon. The powder had the following miain impurities
(in ppm): O--x730, N-45, H-80, C-30. Ta-.500, Zr-200, and the sun of
other metallic impurities-.-500.
Tantalum metal powder, also purchased from the Wah Chang
Corporation, Albany, Oregon, had the following main impurities (in ppm):
Al-Z2, C-170, Cr-wZ0, Cu--40, Fe-210, H-40, W-64, 0-590, Si--40,
Ti-*20, W-27, Nb--u100. The lattice parameter of this starting material
was a = 3.303 A.
The Wah Chang Corporation, Albany, Oregon, supplied the
tantalum monocarbide. The main impurities were (in ppm): A11--20,
Nb-420, Cr-300, Cu-20, Si-10, Ti-14, Zn-.a10, (0-280). * The monocarbidehad a carbon content of 6. 11• (49, 5 At.%). * The particle size was less than
15/1; the lattice parameter of this starting material was a = 4.455 •.
The spectrographic-grade graphite powder was purchased
from the Union Carbide Corporation, Carbon Produzts Division, and had the
following main impurities (in ppm): S-110, Si-46, Cu-44, Fe-40, Al-8,
Ti-4, Mg-2, V-trace, and ash-800 maximum. The particle size was 99%
smaller than 74g. No second phase irn'urities were detected in highly
overexposed X-ray films.
*The chemical analysis o-" the starting materials was performed at theQuality Control Division, Aerojet-General Corporation.
9
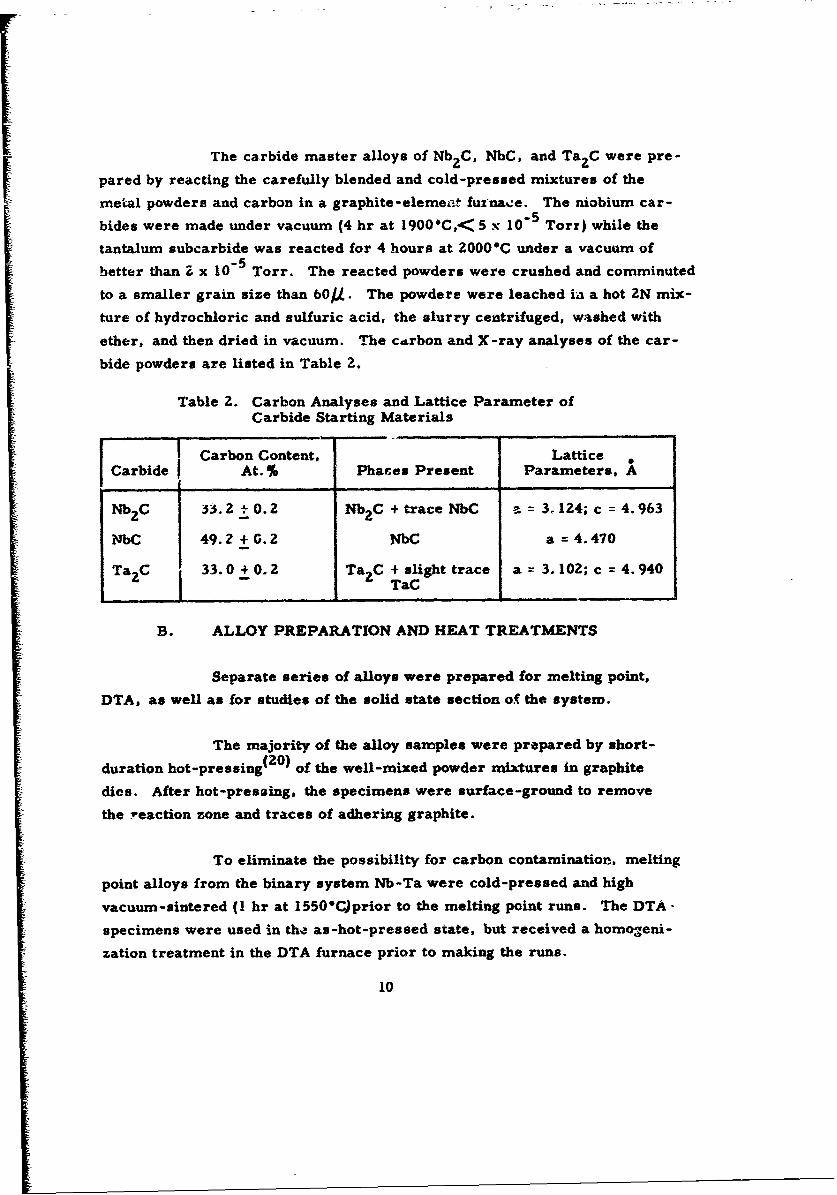
The carbide master alloys of Nb2 C, NbC, and Ta 2 C were pre-
pared by reacting the carefully blended and cold-pressed mixtures of the
metal powders and carbon in a graphite-elemeat fuznae. The niobium car-
bides were made under vacuum (4 hr at 19001C,< 5 x- 10.5 Torr) while the
tantalum subcarbide was reacted for 4 hours at 2000"C under a vacuum of
better than 2 x 10"5 Torr. The reacted powders were crushed and comminuted
to a smaller grain size than 60/g. The powders were leached ia a hot 2N mix-
ture of hydrochloric and sulfuric acid, the slurry centrifuged, washed with
ether, and then dried in vacuum. The cLrbon and X-ray analyses of the car-
bide powders are listed in Table 2.
Table 2. Carbon Analyses and Lattice Parameter ofCarbide Starting Materials
I Carbon Content, Lattice *
Carbide At. % Phares Present Parameters, A
Nb2C 33.Z- 0.2 NbzC + trace NbC = 3. 124; c = 4.963
S49.2 + G.2 NbC a = 4.470
Ta2C 33.0+0.2 Ta 2 C + slight trace a = 3.102; c = 4. 940I -- TaC
B. ALLOY PREPARATION AND HEAT TREATMENTS
Separate series of alloys were prepared for melting point,
DTA, as well as for studies of the solid state section of the system.
The majority of the alloy samples were prepared by short-
duration hot-pressing( 2 0 } of the well-mixed powder mixtures in graphite
dies. After hot-pressing, the specimens were surface-ground to remove
the reaction zone and traces of adhering graphite.
To eliminate the possibility for carbon contamination, melting
point alloys from the binary system Nb-Ta were cold-pressed and high
vacuum-sintered (I hr at 1550C)prior to the melting point runs. The DTA-
specimens were used in the as-hot-pressed state, but received a homogeni-
zation treatment in the DTA furnace prior to making the runs.
10
For metallographic investigation, selected melting point speci-
mens from the concentration areas around the eutectic troughs were examined.
Wherever the melting point samples were too porous for metallographic
examination, they were arc-melted in a nonconsumable tungsten electrode
melting furnace under a high-purity helium atmosphere.
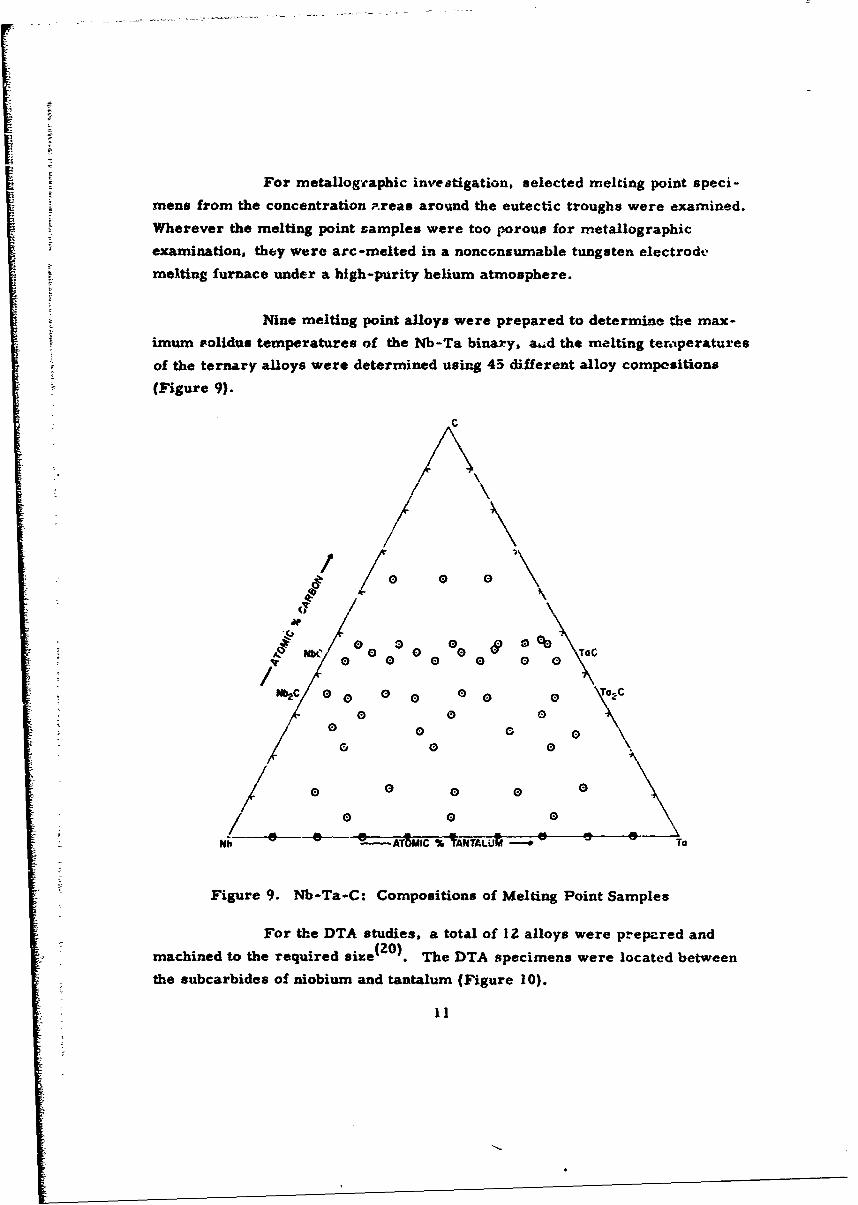
Nine melting point alloys were prepared to determine the max-
imum rolidus temperatures of the Nb-Ta binary, ad the melting termperatures
of the ternary alloys were determined using 43 different alloy compositions
(Figure 9).
C
/ G
0 0 0o
: ~/\
Se e 0
/NbC 0 o G 0 TaCb2C 0 a~
00 0 0
Nb ItA UUI -. To
Figure 9. Nb-Ta-C: Compositions of Melting Point Samples
For the DTA studies, a total of 12 alloys were prepared and
machined to the required size(2 0 ). The DTA specimens were located between
the subcarbides of niobium and tantalum (Figure 10).
11

W-7
Nb N A T00
A-0
Nb -ATOMIC% TANTALUM~ ToAigur to Di39nalloys werempo eared of AnllysInvestiate-
A total oi39 alloys were prepared for the solid state in-iesti-
gation of the system. The alloys having carbon compositions greater than
34 At.% C were heat treated at 1800"C for 64 hr. and selected alloys were
also heat treated at 1500"C for 64 hr as su wn in Figure 11. Both heat
treatments were carried out in a tungsten mesh element furnace (R. Brew
Company) under a high-purity helium atmosphere.
C. DETERMINATION OF MELTING POINTS
The melting points of the ternary alloys were determined by
the previously described Pirani-technique( 2 0 ' 21) To minimize the carbon
losses ztt the high melting temreratures in the mono-arbide region. the
melting point furnace was pressurized with high purity helium to 2-1/4
atmospheres after a short degassiag of the sample under a 30-in. Hg vacuum
at about 2000"C.
The temperature measurements were carried out with a dis-
appearing filament micropyrometer, which was calibrated against a certified
12
[2

0 Alloys heat treated at15000C for 64 hour-
0 Alloys heat treated atIW00C for 64 hours
- / NbC To C
I 0 0S0 0 S
STNb2 CF% . 0 ei 9 tapl
OV 0 0 0 0
0S 0 0
Nb TOFigure 11. Nb-Ta-C: Compositions of Solid State Samples
Heat-Treated at 1500°C and 1800"C
lamp from the National Bureau of Standards. The temperature was corrected
for absorption losses in the qzartz window of the raelting point furnace and
deviations due to non-black-body conditions of the observation hole. The
detailed treatment with regard to the temperature corrections has been(0,ZO I)described in previous reports
D. DIFFERENTIAL THERMAL ANALYSIS (DTA)
The DTA specimens were run under a protective, high-purity
helium atmosphere at Z atmospheres pressure. The details of the DTA
apparatus have been presented in earlier publications (0,ZZ)
The effect of tantalum upon the (x A/3 Nb2C transformation was
investigated !y this technique. The DTA measurements also yielded informa-
tion on the order-disorder transformation in the suLcarbide phase. Finally,
13
the DTA runs gave the incipient melting te.perntature close to ,h -
geneous range of the subcarbide phase; these temperatures are usually diffi-
cult to observe using the Pirani-method because relatively little liquid is
formed at the incirient melting temperature.
E. METALLOGRAPHY
For the metallographic studies, the specimens were mounted
in a mixture of diallylphthalate-lucite-copper base mounting material. After
coarse grinding on silicon carbide paper with grit sizes varying from i20 to
600, the samples were polished on a nylon cloth using a slurry of Linde-B
alumina (0. AL) in a 5% chromic acid solution.
To obtain the desired phase contrasts, alloys with carbon
concentrations from 0 to 25 At. % were differentiated by anodizing the speci-
men in a 10% oxalic acid solution. This treatment oroduced a brownish-red
tarnish on the metal grains, while the subcarbide grains remained essentially
unaffected. Samples with carbon ccntents between 28 and 43 At. % were first
anodized in a 10% oxzAlic acid solution, followed by dip-etching in an aqueous
aqua regia-hydrofluoric acid solution [9 parts HO- 1 part (60% HC 1-20%
HNO3 -20% HF)1 and then further dip-etching in 20% Murakami's solution.
Alloys from the concentration range of 43 to 48 At. % carbon
were either dip-etched in a 20% A--,-kamils solution or a concentrated acid
- solution of the above described mixture of HCI, HNO3 , and HF. For excess
graphite containing alloys, no etching was required; i. e., the samples .vere
examined in the as-polished state.
The photomicrographs were made on a Zeiss Ultraphot 1I
metallograph.
F. X -RAY ANALYSIS
Debye-Scherrer powder diffraction patterns, using Cu-K a
radiation, were made of all samples after melting point, DTA, and solid
state investigations as well as of arc-melted samples.
14
The exposures were taken in a 57.4 mm camera on a Siemens-I Crystalloflex iR unit; the Bragg-angles of the diffraction lines were measured
on a Siemens-Kirem coincidence 3cale with micrometer dial (2 mm indicator
trav'el per 0.01 mm translational motion of the measuring slide.)
G. CHEMICAL ANALYSIS
Carbon analyses were performed on the carbide starting mate-
rials as well as approximately one-quarter of selected experimental alloy
samples. They were analyzed for carbon concentration using the direct
cembustion method, i. e., the carbon content was determined by measuringthe thermal condactivity of the rombusted CO2 -O 2 gas mixture in a Leco
carbon analyzer.
The results of the carbon analysis on selected experimental
alloy samples showed that the carbon loss was never greater than 2 At. %,
and in most cases was less than I At. %.
I5
•wA •
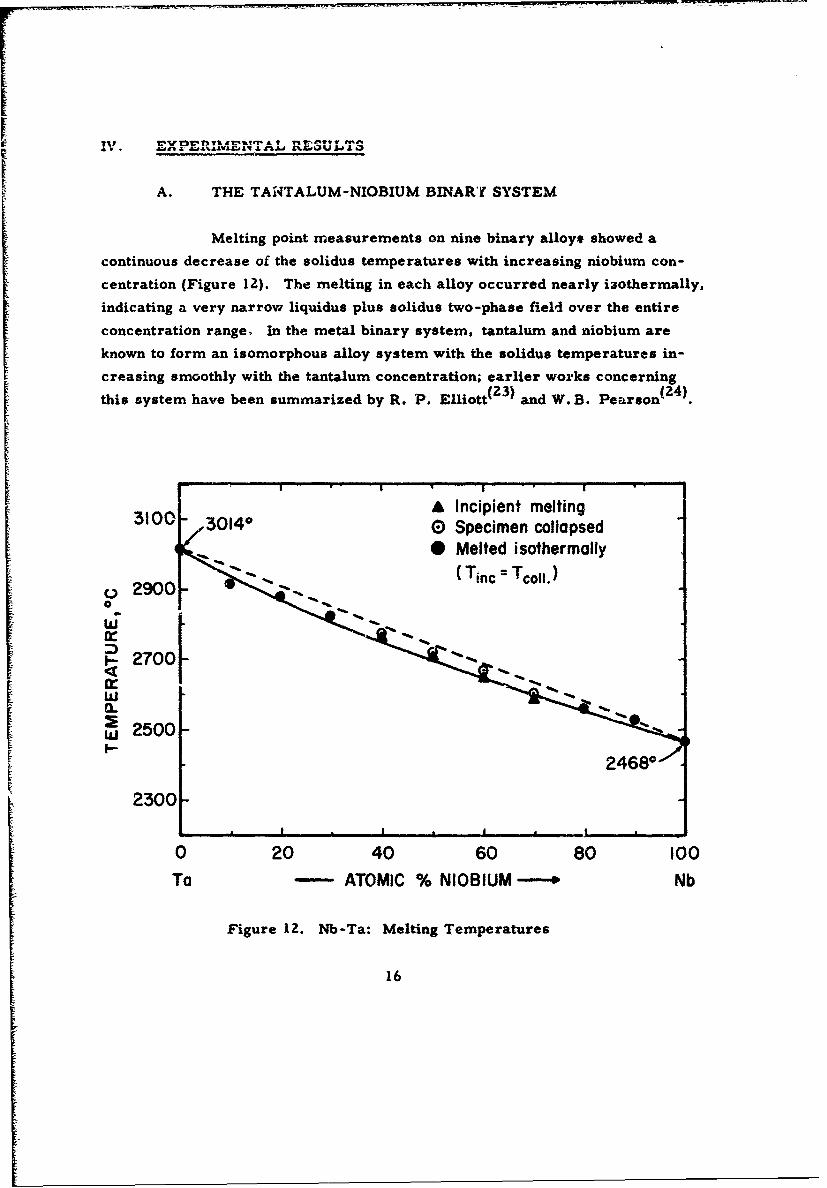
A. THE TAN4TALUM-NIOBIUM BINARY' SYSTEM
Melting point measurements on nine binary alloy* showed a
continuous decrease of the solidus temperatures with increasing niobium con-
centration (Figure 12). The melting in each alloy occurred nearly iiothermally,
indicating a very narrow liquidus plus solidus two-phase field over the entire
concentration range, In the metal binary system, tantalum and niobium are
known to form an isomorphous alloy system with the solidus temperatures in-
creasing smoothly with the tantalum concentration; earlier works concerning(23(24)this system have been summarized by R. P. Elliott and W.B. Pearson(
A Incipient melting3100 30140 0 Specimen collapsed
4 l0 Melted isothermally( Tnc =Tco11.)
,29000
270044
W 2500 -
2300
0 20 40 60 80 100
Ta - ATOMIC % NIOBIUM - Nb
Figure 12. Nb-Ta: Melting Temperatures
16
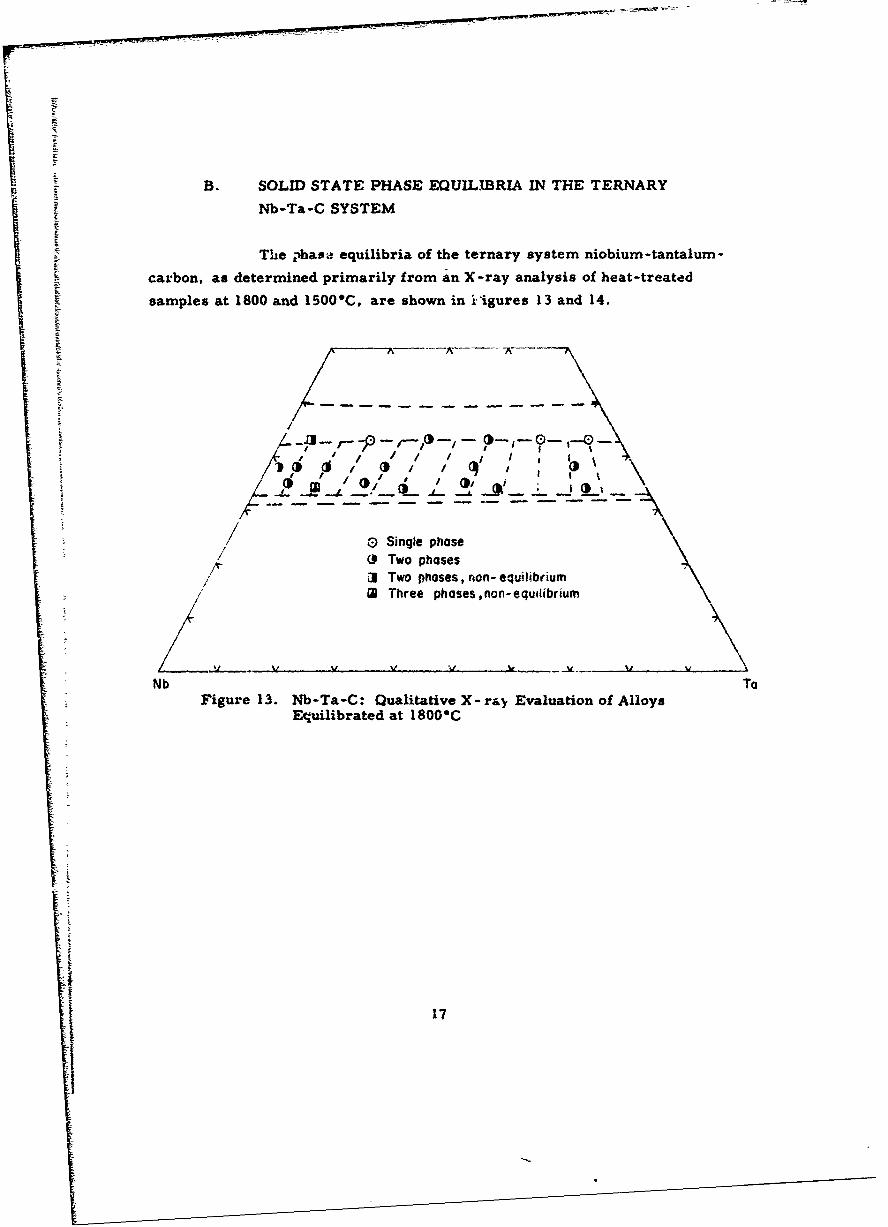
B. SOLID STATE PHASE EQUILIBRIA IN THE TERNARY
Nb-Ta-C SYSTEM
The phasl. equilibria of the ternary system niobium-tantalum-
carbon, as determined primarily from an X-ray analysis of heat-treated
samples at 1800 and 1500"C, are shown in 1igures 13 and 14.
i -/
/ 0 Single phase@ Two phases
/ "31 Two phases, non- equilibriumW Three phases,non-equilibrium
, , .2L........ v " , A, L _. y. .
Nb ToFigure 13. Nb-Ta-C: Qualitative X- raý Evaluation of Alloys
Equilibrated at 1800"C
17
I

rII
0 Two phases
/ * Two phases
Three phases, non-equilibrium/
/ / / / / ' 0/ / ! / I i I \/ It/ , / / ! / ! /i :1I ,
/ / / ./ 1/ 1--_---• _- - ,- _
Nb To
Figure 14. Nb-Ta-C: Qualitative X- ray Evaluation of AlloysEquilibrated at 1500"C
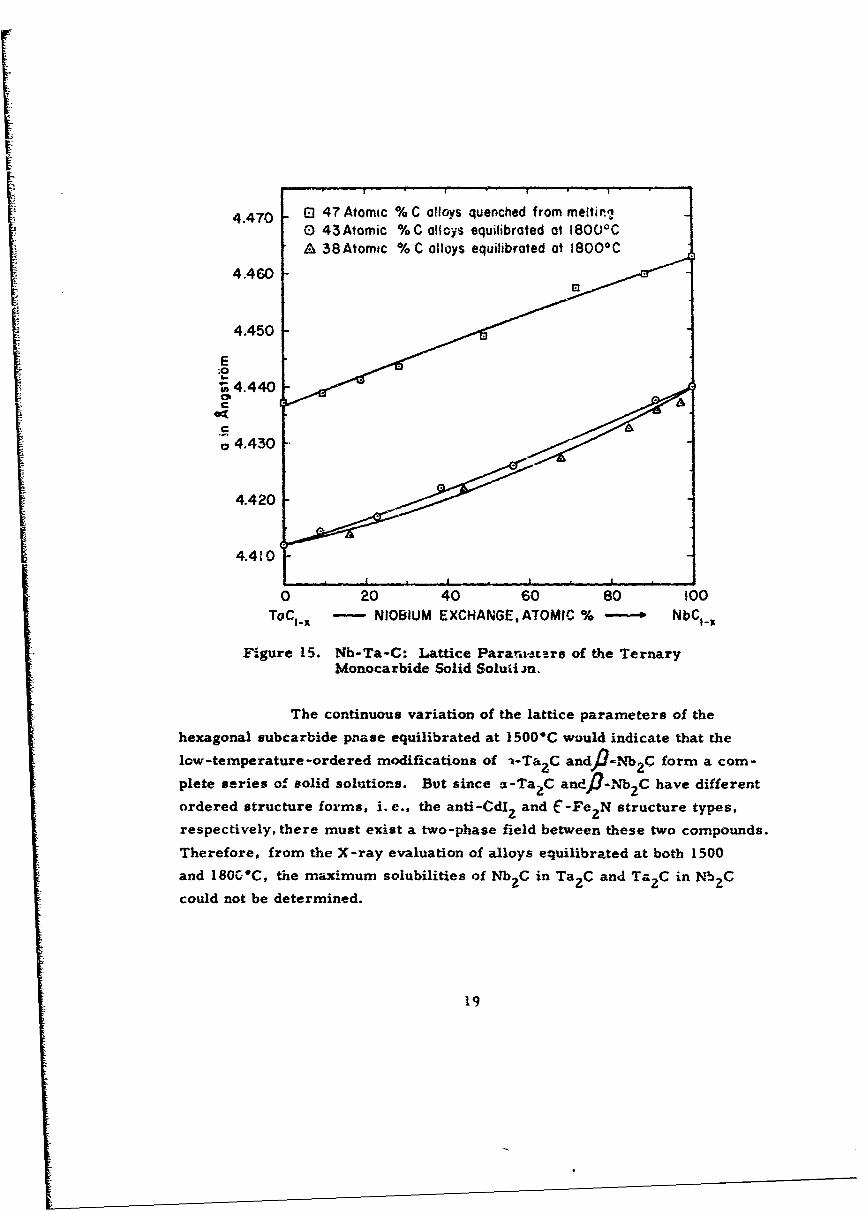
At 1800"C, NbC and TaC form a continuous series of solidsolutions as shown by the lattice parameter variations of the cubic mono-
carbide phase (Figure 15). The lattice parameters of quenched alloys at 38
At. % carbon correspond to compositions In the two-phase field of monocar-
bide plus subcarbide, while those alloys at 43 At. % carbon are essentially on
the lower phase boundary of the monocarbide solid solution.
The variation of the lattice parameters of the hexagonal sub-
carbide alloys quenched from 1500"C are shown in Figure 16. The lattice
parameters of the alloy series at 28 At. % carbon correspond to compositions
in the two-phase field of metal plus subcarbide, while the alloy series at
33 At. % carbon varies from -, I to 2 At.% carbon above the carbon-rich
boundary of the subcarbide ph.ase.
18
4.470 0 47 Atomic % C alloys quenched from meltirn0 43Atomic %C alloys equilibrated at 1800 0 CA 38Atomic % C alloys equilibrated at 18000C
4.460
4.450
E.0
'too' 4.440
4.420
4.410
0 20 40 60 80 100ToCI. 1 - NIOBIUM EXCHANGE, ATOMIC % -- NbCtx
Figure 15. Nb-Ta-C: Lattice Pararezsrs of the TernaryMonocarbide Solid Solutiin.
The continuous variation of the lattice parameters of the
hexagonal subcarbide phase equilibrated at 1500*C would indicate that the
low-temperature-ordered modifications of v.Ta C andfl.Nb2 C form a com-
plete series of solid solutions. But since a-Ta2C andfi-NNb2 C have different
ordered structure forms, i.e., the anti-Cdl, and C-Fe2 N structure types,
respectively, there must exist a two-phase field between these two compounds.
Therefore, from the X-ray evaluation of alloys equilibrated at both 1500
and 180C*C, the maximum solubilities of Nb2C in Ta 2 C and Ta 2 C in NbzC
could not be determined.
19

4.970[4.950-G
:0
CO
42920 El 33 Atomic % C alloys equilibrated at 15000C
0 28 Atomic % C alloys equilibrated at 1500OC
CO
0 20 40 80 80 !00T02C - NIO8WUM EXCHANGEATOMIC % - ~Nb2C
Figure 16. Nb-Ta-C: Lattice Paramneters of the TernarySubcarbide Solid Solutions.
Because the only difference between~ the two ordered structures
of th.a subcarbide phase lies in the arrangement of the carbon atoms in the
metal host lattice, an extensive study by means of neutron and electron
diffravýtion would be required to determine the distribution of the carbon
.toms among -the interstitial lattice sites; tAs investigation would reveal the
maximum metal exchanges of niobium anid tantalum in the two different
20

(a and/j) forms of tantalum and niobium subcarbide, respectively. There-
fore, in the present study of this system, the two ordered forms of the sub-
carbide phase are shown to form a complete series of solid solutions.
As shown in Figures 13 and 14, the tie-liae distributions within
the metal-subcarbide two phase field at 1500*C and the subcarbide-monocarbide
two-phase field at 1800*C were determined by comparing the lattice parameters
of the phases present in the two-phývsed alloys with the lattice parameter varia-
tions of the solid solution series. As a result of the lower equilibration tem-
perature of 1500"C, the homogeneity limits of the solid solutions and the com-
positions of the coexisting phases in the two-phase fields assume slightly
different values.
The continuatior of the order-disorder phase transformation
of Nb2C and Ta 2 C into the ternary is not specifically shown in the sectiondrawings, as was previously mentioned. DTA studies carried out on two alloyseries at 28 and 33 At. % carbon revealed the presence of the order-disorder
transformation in the subcarbide phase in both hyper- and hypostoichiometric
alloys. As shown in the DTA thermograms (cooling) of Figure 17, the order-
disorder phase reaction appears quite prominent, but for alJoys located
farther away from the binary boundary phases the reaction became extremely
sluggish both in the metal-rich and carbon-rich subcarbide alloys; and hence
the temperature variation of the ordering reaction could not be determined.
Alloys located close to the metal-rich boundary of the sub-
carbide phase showed a slight decrease An the transition temperatures from
-2480"C for the Nb2C binary phase and-2050*C for the Ta 2 C binary phase.
For the alloys located at approximately the stoichiometric composition of the
subcarbide phase, there was alse _ slight decrease of the transition tempera-
ture from-2500C for the Nb2 C binary phase and-Z130*C for the TazC
binary phase. If this trend in the transformation temperatures continues into
the ternary system, the high-temperature-disordered form of 7-(Nb, Ta) 2C-ss
at hyperstoichiometric composition probably participates in either a

\ Nb(62)-Ta(I0)-C(28)At.%
5•C-sec-;
Nb(62)-To(5)-C(33)At.% 4 -c
x
Nb(5)-To(67)-C(28)At,% ,// \W , 4 "C -sec-'
T°2C(y--)
Nb(7)-To(60)-C(33)At.-%/
2800 2600 2400 2200 2000 W800 1600- TEMPERATURE,"-
Figure 17. Nb-Ta-C: Order-Disorder Phase Reaction of Nb C and Ta 2 Cin Ternary Alloys: DTA Thermograms (Cooling) of TernaryAlloys Containing 28 and 33 At. % Carbon.
four-phase reaction of the type: 7 -(Nb, Ta),C-ss Z L(Nb, Ta) 2 C-ss
(Nb-rich) +A• -(Nb, Ta),C-ss(Ta, rich) +6 -(Nb, Ta)Cl -ss, or a limiting tie-
line reaction of the type 7' -(Nb, Ta)CI 3-(Nb, Ta)?C + 6 -(Nb. Ta)CI x.
The variation of the order-disorder phase reactions as determined from the
DTA stuay is presented in the isopleth at 32. 5 At. % C (Figure 5).
22
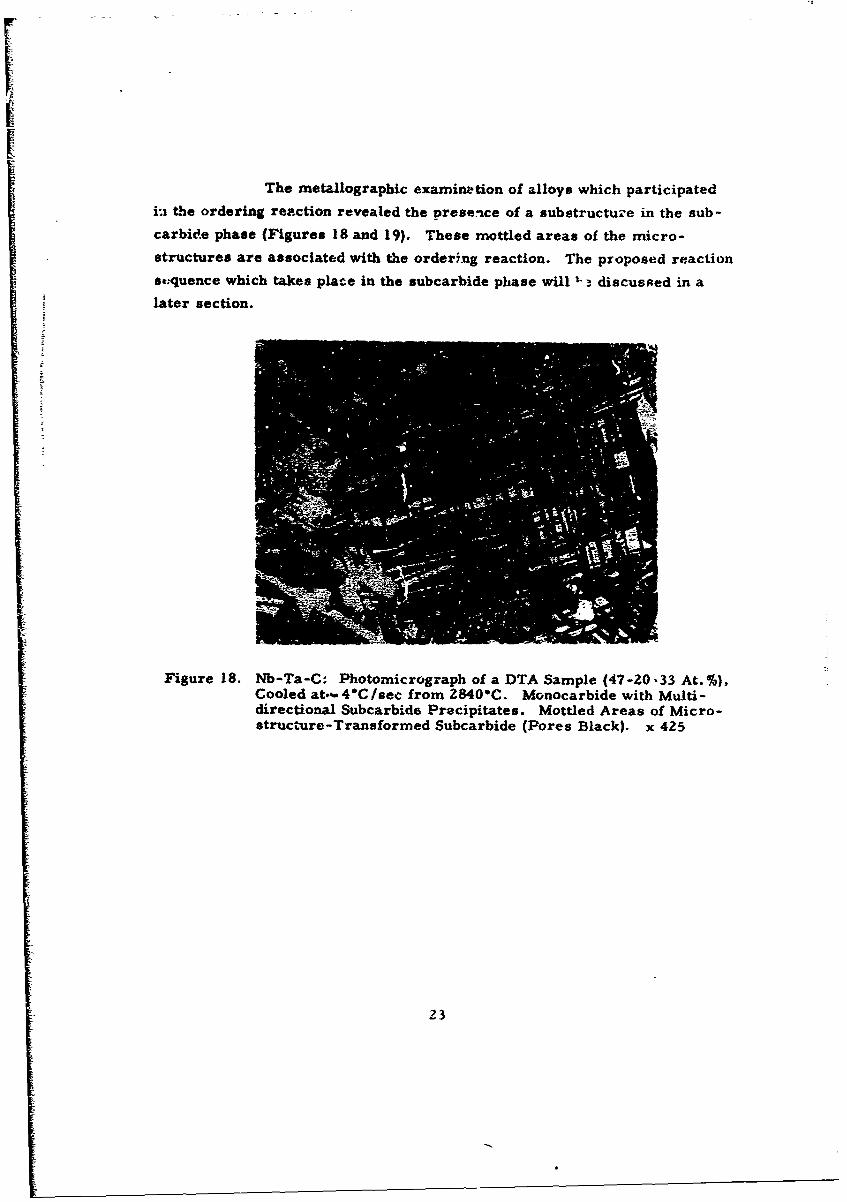
The metallographic examinition of alloys which participatedi:i the ordering reaction revealed the presence of a substructu•'e in the sub -
carbidce phase (Figures 18 and 19). These mottled areas of the micro-
structures are associated with the orderi.ug reaction. The proposed reactionscquence which takes place in the subcarbide phase will '- discussed in a
later section.
Figure 18. Nb-Ta-C: Photomicrograph of a DTA Sample (47-20-33 At.%),Cooled at,-.4*C/sec from 2840"C. Monocarbide with Multi-directional Subcarbide Precipitates. Mottled Areas of Micro-structure-Transformed Subcarbide (Pores Black). x 425
23
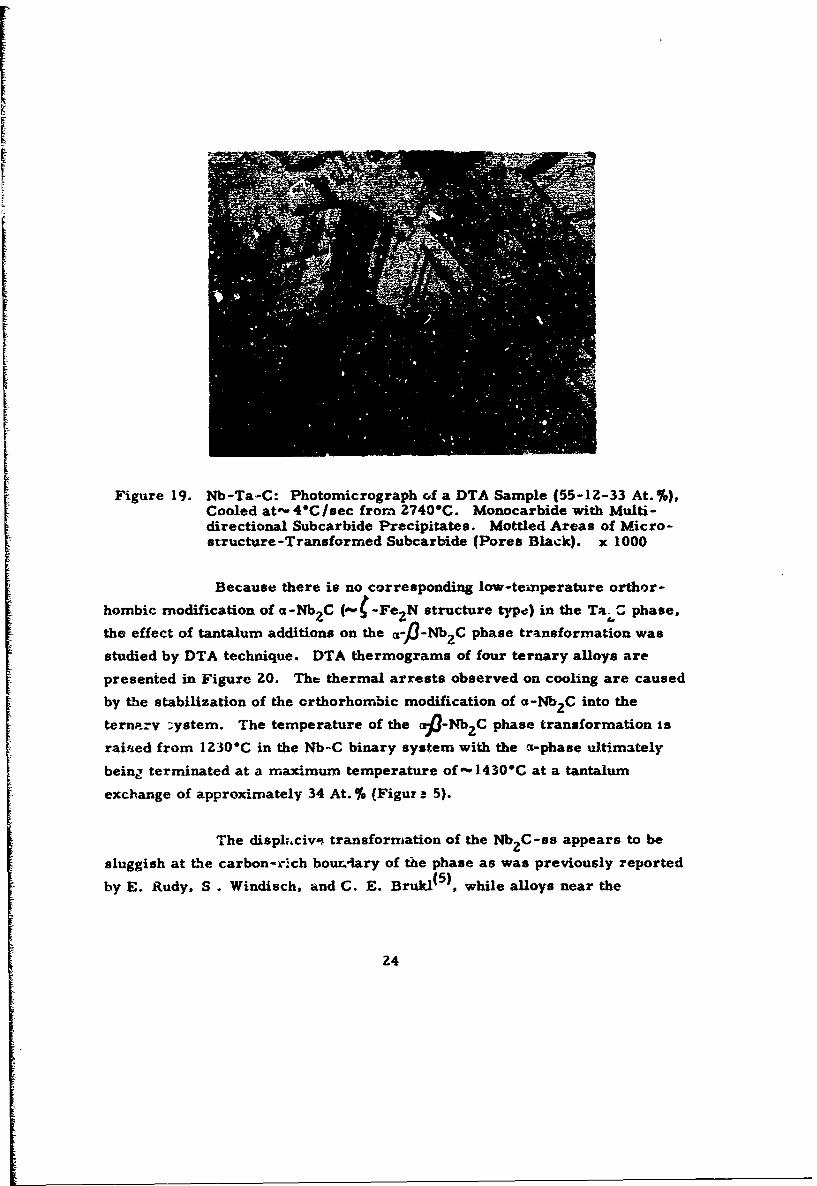
Figure 19. Nb-Ta-C: Photomicrograph of a DTA Sample (55-12-33 At.%),
Cooled at'-4*C/sec from 27400C. Monocarbide with Multi-directional Subcarbide Precipitates. Mottled Areas of Micro-structure-Transformed Subcarbide (Pores Black). x 1000
Because there is no corresponding low-temperature orthor-horbic modification of i-Nb2 C (',I-Fe 2 N structure type) in the Ta. 'phase,
the effect of tantalum additions on the cCJJ-NbzC phase transformation was
studied by DTA technique. DTA thermograms of four ternary alloys are
presented in Figure 20. The thermal arrests observed on cooling are caused
by the stabilization of the orthorhombic modification of a-Nb2 C into the
ternarv :ystem. The temperature of the O°O-Nbb2 C phase transformation is
raiifed from 1230"C in the Nb-C binary system with the %-phase ultimately
being terminated at a maximum temperature of - 1430"C at a tantalum
exchange of approximately 34 At. % (Figur a 5).
The displ;,civ-, transformation of the Nb2 C -ss appears to be
sluggish at the carbon-ri-ch boundary of the phase as was previously reported
by E. Rudy, S. Windisch, and C. E. Brukl(5) , while alloys near the
24

Cooling rates: 4*CsecII Nb(62)-To (10) C(28)At. %
Nb(47)-To(25C(28) At. %
Nb(62)-Ta(5)-
0
I C(3 3)At.%
1800 1400 1000T'EMPERATURF, OC -
Figure 20. Nb-Ta-C: ot-)3-NbC Phase Reaction in Ternary Alloys:DTA Therniagrarns (Cooling', of Alloys Located in theVicinity of Nb2 C.
25

.•eta1-rv hse bundary-x appnear tet inelpron the transformation more rad;lv.
This is eviden~ced by comparing the size of the enthalpy changes shown by the
two alloy series at Z8 and 33 At.% carbon in Figure 20, and also by comparing
the microstructures of the heat-treated alloys which were furnaced quenched
from 1500"C (Figure 14).
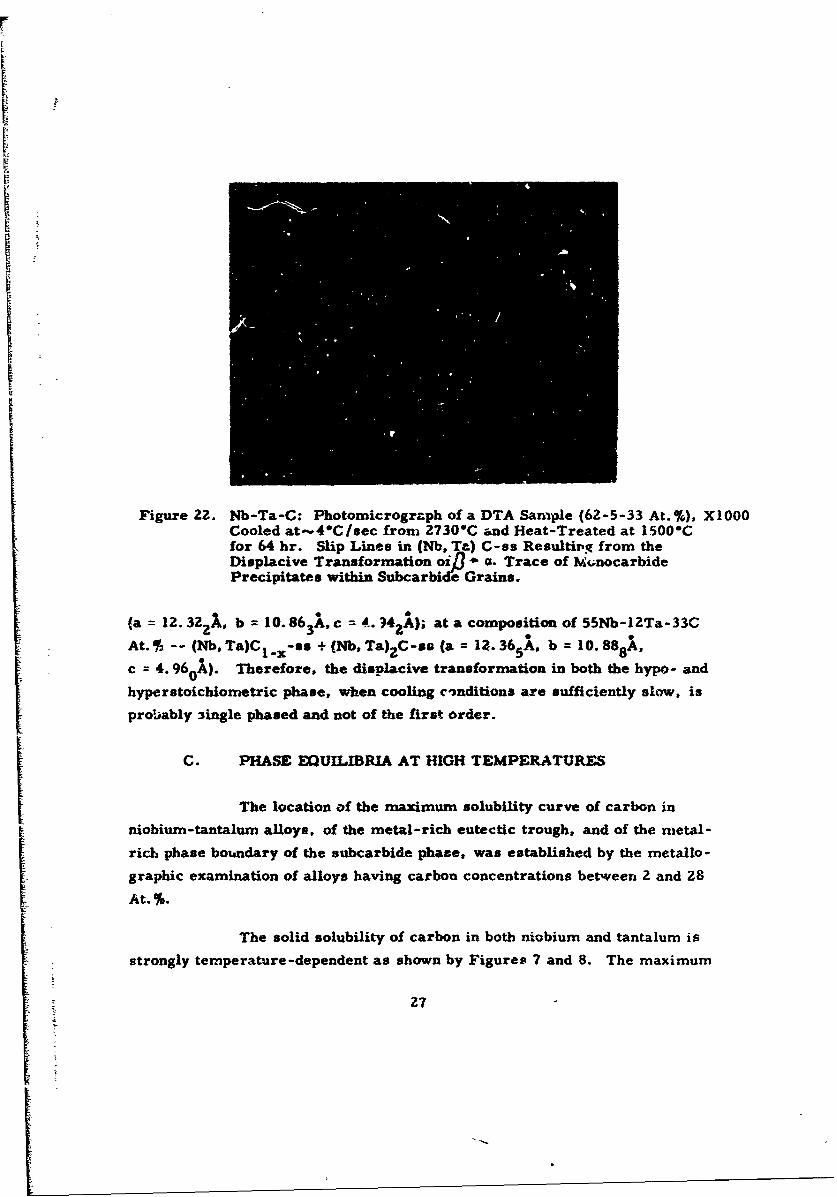
The low-temperature a modification is formed by a distortion
of the hexagonalG-Nb 2 C as reported by E. Rudy and C. E. Bruk(6) . The
displacive transformation is recognized by the appearance of slip lines in
the subcarbide grains (Figures 21 and 22).
Figure 21. Nb-Ta-C: Photomicrograph of a DTA Sample (55-12-33 X680At. %), Cooled at- 4*C /sec from 2740*C and Heat-Treatedat 15000C for 64 hr. Slip Lines in (Nb, Ta)2 C-ss Resultingfrom the Displacive Transformationfl.-* ft. Trace of Mono-carbide Precipitates within Subcarbide Grains (Pores Black).
From the X-ray analysis of the DTA alloys at 28 and 33 At.%
carbon, those alloys which participated in the displacive transformation
exhibited only two phases in equilibrium. That is, in alloys cooled from
"-2700CC at 41C/sec and, for example, at a composition of 47Nb-M5Ta-28r.,
At. %, two phases exist in equilibrium -- (Nb, Ta)-ss + (Nb, Ta)2 C-ss
26
r
Figure 22. Nb-Ta-C: Photomicrograph of a DTA Sample (62-5-33 At. %), X1000Cooled at - 4C /sec from 2730*C and Heat-Treated at 1500"Cfor 64 hr. Slip Lines in (Nb, Ta) C-us Resultip.q from theDisplacive Transformation oij 3, a. Trace of )4;nocarbidePrecipitates within Subcarbice Grains.
(a= 12.32)A, b = I0.86 c = 4. ?4,A); at a composition of 55Nb-I2Ta-33Cz 3•
At.%• -- (Nb, Ta)C -as + (Nb, Ta),C-so (a = 12. 36 5A, b = I0.888 A,
c = 4.960 ,). Therefore, the displacive transformation in both the hypo- and
hype rstoichiometric phase, when cooling cinditions axe sufficiently slow, is
probably 3ingle phased and not of the first order.
C. PHASE EQUILIBRIA AT HIGH TEMPERATURES
The location of the maximum solubility curve of carbon ini niobium -tantalum alloys, of the metal-rich eutectic trough, and of the metal-
rich phase boundary of the subcarbide phase, was established by the metallo-
graphic examination of alloys having carbon concentrations between 2 and 28At..
The solid solubility of carbon in both niobium and tantalum is
strongly temperature-dependent as shown by Figures 7 and 8. The maximum
27

ItOlubility of carbon in both thefe metals is 7. 5 At. % at temperatures of23539C (Nb + Nb7C eutectic) and 28430C ITa + TA-C v..ect.- iL-_* - . . .-_ Z - • ,• J"L 66" .4
ternary alloy series with carbon concentrationsv of Z. 5. and 8 At. %, which werearc -melted, the metallographic examination showed the same type of pre -cipitation structures which were found in the metal-carbon binary systems(5' 12)The microstructures of rapidly quenched arc-melted alloys exhibited anessentially random distribution of the (Nb. Ta),C precipitates in the (Nb, Ta)matrix, and also a tendency for the subcarbide pLase to segregate to the grainboundaries of the metal phase (Figures 23, Z4, and 25). The ternary alloyat 5 At. % C (Figure 24) shows a slight trace of tbe (Nb, Ta) + (Nb, Ta)2C eutecticin the metal grain boundaries.
Figure 23. Nb-Ta-Cs Photomicrograph of an Arc-Melted Sample XZZ0(49-49-2 At. %). Primary (Nb. Ta) Grains with Intra-granular (Nb, Ta)2 C Precipitations. Note Segregationof Precipitate Phase to the Grain Boundaries.
28

Figure 24. Nb-Ta-C: Photomicrograph of an Arc-Melted Sample X270(48-47-5 At.%). Primary (Nb Ta) Grains with Intra-granular (Nb, Ta) C Precipitations. Trace of (Nb, Ta) +(Nb, Ta) C EutecAc Plus Segregated (Nb, Ta)2 CPrecipi~tes in the Grain Boundaries.
Figure Z5. Nb-Ta-C: Photomicrograph of an Arc-Melted Sample X210(46-46-8 At.%). Primary (Nb, Ta) Grains with Intragranular(Nb, Ta)2 C Precipitations. (Nb, Ta) + (Nb, Ta)2 C EutecticPlus Segregated (Nb, Ta)2 C Precipitates in the GrainBoundaries.
29
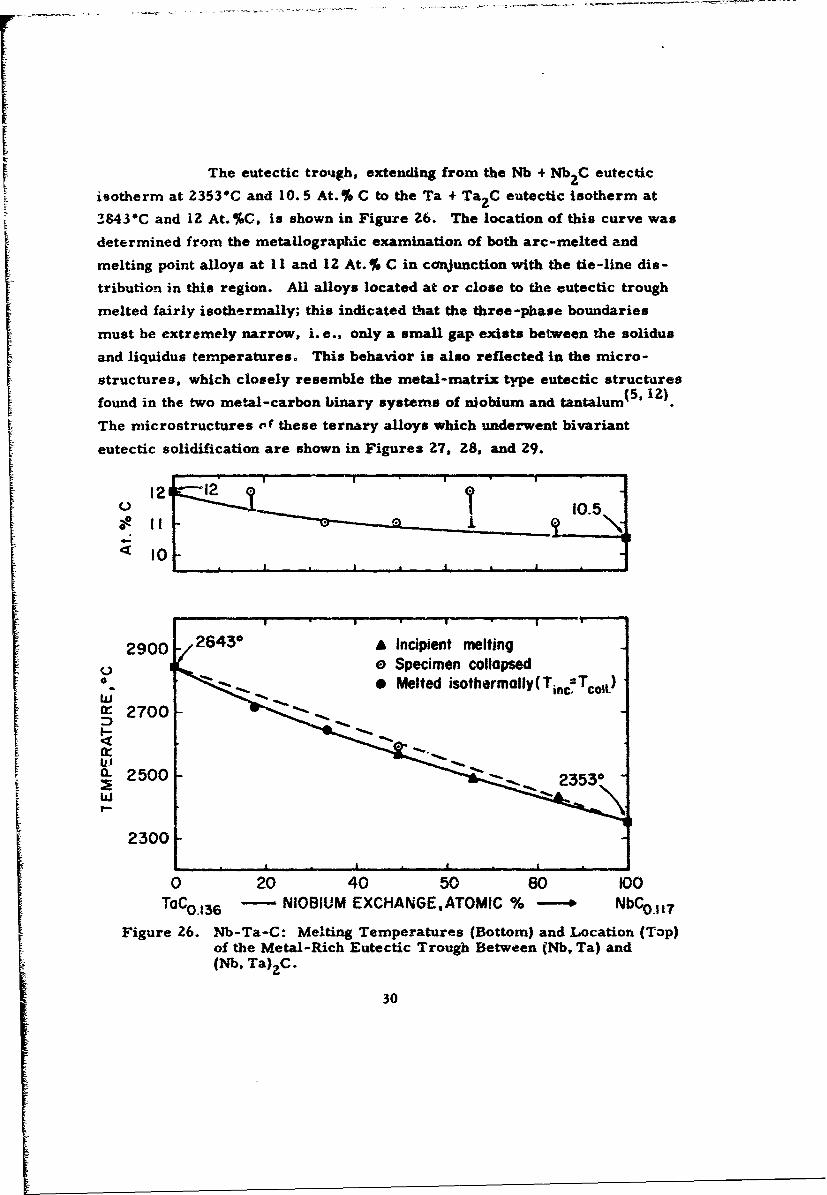
The eutectic trough, extending from the Nb + Nb2 C eutectic
isotherm at 2353 C and 10.5 At.% C to the Ta + Ta2 C eutectic isotherm at
6843"C and 12 At.%C, is shown in Figure 26. The location of this curve was
determined from the metallographic examination of both arc-melted and
melting point alloys at 11 and 12 At. % C in conjunction with the tie-line dis-
tribution in this region. All alloys located at or close to the eutectic trough
melted fairly isothermally; this indicated that the three-phase boundaries
must be extremely narrow, i.e., only a small gap exists between the solidus
and liquidus temperatures. This behavior iu also reflected in the micro-
structures, which closely resemble the metal-matrix type eutectic structures
found in the two metal-carbon binary systems of niobium and tantalum( 5 ' 12).
The microstructures of these ternary alloys which underwent bivariant
eutectic solidification are shown in Figures 27, 28, and 29.
o 2 110.5
a I0 I ,
2900 2843° A Incipient meltingQ.. e Specimen collapsed|
0- *-. Melted isothermally(Tin2.Tol)
S27o0-
a- 25002O 23530°
0 20 40 50 80 100T('Co.156 -- NIOBIUM EXCHANGE,ATOMIC % NbCo., 7
Figure 26. Nb-Ta-C: Melting Temperatures (Bottom) and Location (Top)of the Metal-Rich Eutectic Trough Between (Nb, Ta) and(Nb, Ta)3C.
30
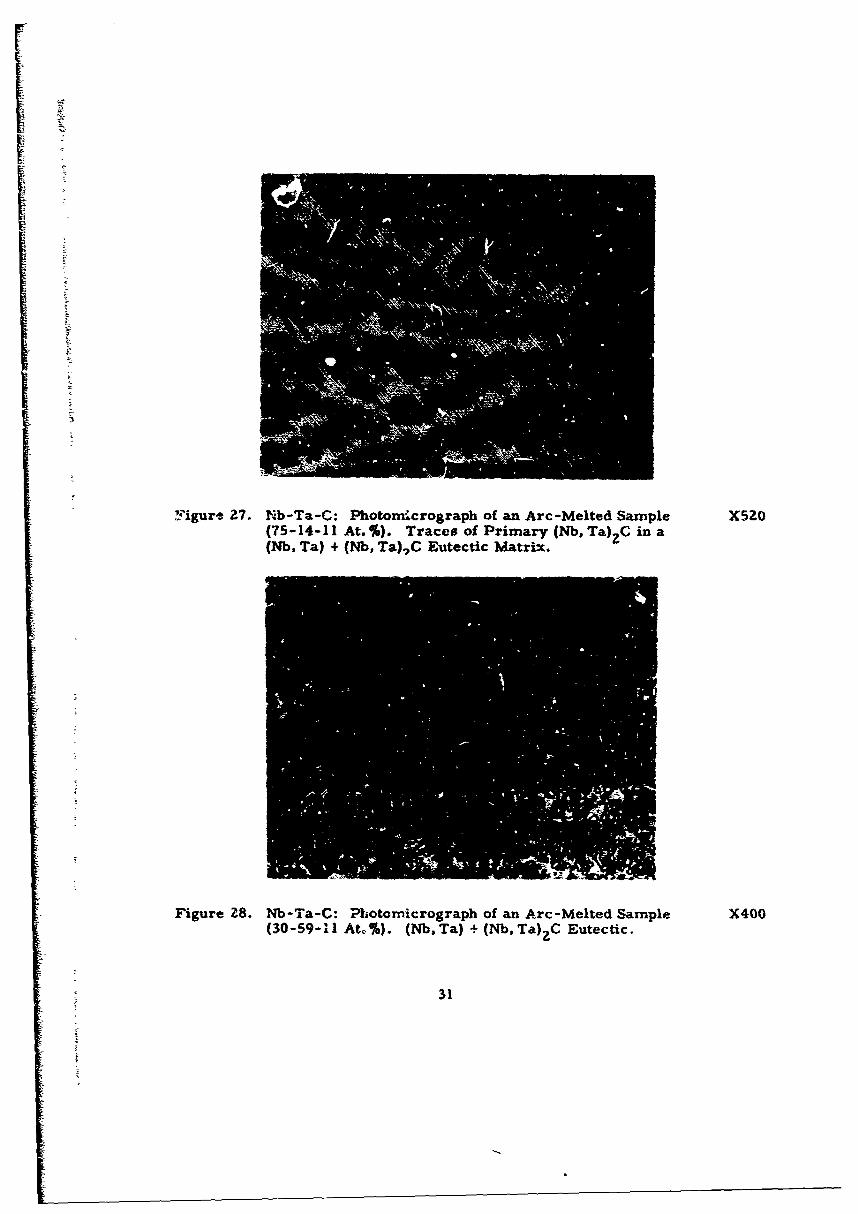
F~igure 27. Nb-Ta-C: Photornkrograph of an Arc-Melted Sample X520(75-14-11 At.%). Traces of Primary (Nb, Ta) zC in a(Nb, Ta) + (Nb, Ta),C Eutectic Matrix.
Figure 28. Nb-Ta-C: Photomnicrograph of an Arc-Melted Sample X400(30-59-I1 At0 %). (NbTa) +(Nb, Ta)?C Eutectic.
31

Figure 29. Nb-Ta-C: Photomicrograph of an Arc-Melted Sample X200(15-73-12 At.%). Slight Trace of Primary (Nb, Ta)2 Cin (Nb, Ta) + (Nb, Ta)2 C Eutectic Matrix.
Typical microstructures of alloys located in the vicinity of the
metal-rich homogeneity limits of the (Nb, Ta)2 C phase at the (Nb, Ta)-
(Nb, Ta)2 C eutectic temperatures are shown in Figures 30 and 31. These
photomicrographs show the primary (Nb, Ta)2 C grains with intragranular
metal precipitations and varying amounts of (Nb, Ta) at the grain boundaries
(subcarbide depleted eutectic).
The ternary subcarbide solid solution (Nb, Ta)2 C melts peri-
tectically in a manne2 similar to the binary phases, Nb2C and Ta 2 C. The
variation of the peritectic temperatures was determined by measuzing the
incipient melting poit±a of 14 alloys having carbon concentrations between 25
and 35 At.%.
Figure 32 shows the melting behavior of alloys which partici-
pated in the peritectic melting of the subcarbide phase. The majority of the
alloys melted very heterogeneously, especially those at 30 and 35 At. %C.
32

Figure 30. Nb-Ta-C: Photomicrograph of a DTAIS~ample (62-10-28 X475At.%), Cooled at- 3C/sec from Z770*C. Primary Nb-Rich (Nb. Ta) C with Intragranular Metal Precipitations..Small ArnoZis of Metal Phase at the Grain Boundaries.
Figure 31. Nb-Ta-C: Photomicrograph of a DTA Sample (32-40-28 X1000At. %). Quenched Irom &Z750*C. Primary (Nb, Ta),C withIntragranular Metal Precipitations in a Sn:ocarbideDepleted-Metal Eutectic Matrix (Pores Black).
33

3400 3333OW
0 E32000
S~~30 At.%/ C E)o3=W 3000 34At. % C Specimen collapsed
S.35 AM '% C 0
2800 34At.% C A Incipient melting
# I00 20 40 60 80 100
To2C - NIOBIUM EXCHANGEATOMIC % - Nb2C
Figure 32. Nb-Ta-C: Peritect.c Melting Temperature3 of the SolidSolution - (Nb, Ta)2 C.
This extreme twe phase melting results from the steep solidus surfaces of
the subcarbide and monocarbide phases; therefore, the collapsing tempera-
tures of these alloys along with their metallographic examination were used
to determine the maximum melting and location of the (Nb, Ta),C-ss boundary.
A photomicrograph showing the peritectic-type reaction is
presented in Figure 33. This structure shows the peritectic-like non-
equilibrium mixture of metal, subcarbide, and monocarbide. The micro-
structurer, of ternary, alloys located closer to the Ta-C binary system did not
yield nonequilibrium structures like that shown in Figure 33. For example,
in alloys which were equilibrated above the solidus temperatures, the peri-
tectic reaction did not proceed to completion during rapid cooling. A typical
microstructure is presented in Figure 34, which shows the nonequilibriu-n
structure consisting of metal, subcarbide, and monocarbide. Also, the uni-
directional monocarbide precipitations in the (Nb, Ta),C grains give evidence
for the extension of the carbon-rich phase boundary to hyperstoichiometric
composition in ternary subcarhide alloys.
34
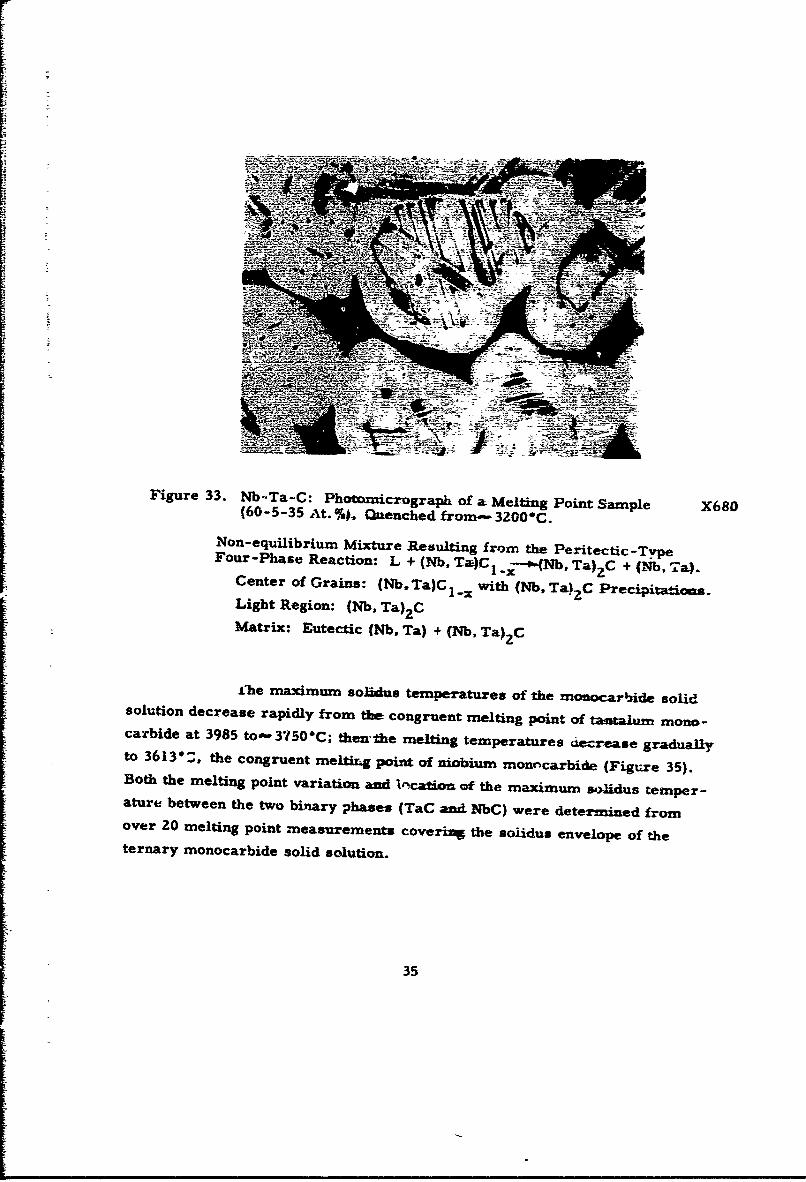
Figure 33. Nb-~Ta-C: Photoznicmograph Of a Melting Point S-ample X680(60-5-35 At.%). Quenched from-. 32000C.Non-equilibrium Mixture Resulting from the Peritectic-Tv.peFour -Phase Reaction: L + (Nb, T-a)c, ---*4Nb, Ta),C + AMb, Ta).
Centr ofGrans: Nb.T)C 1 with (Nb, Ta)ZC Precipitations.Light Region: (Nb, Ta)2CMatrix: Eutectic (Nb, Ta) + (Nb, Ta),C
£7he maximum soi~dus temperatures of the mosocarbide solidsolution decrease rapidly from the congruent melting point of autuaummo-carbide at 3985 to"- 3/50*C; then-the melting temperatures decrease graduallyto 36130:, the congruent meltiLx4 point of niiibinin monncarbide- (Figure 35).Both the melting point variatiOn and 1r"ýcation oft the maximum solidus temper-aturef between the two binary phases (TaC and NbC) were determined fromover 20 melting point measurements covering the solidug envelope Of theternary monocarbide solid solution.
35
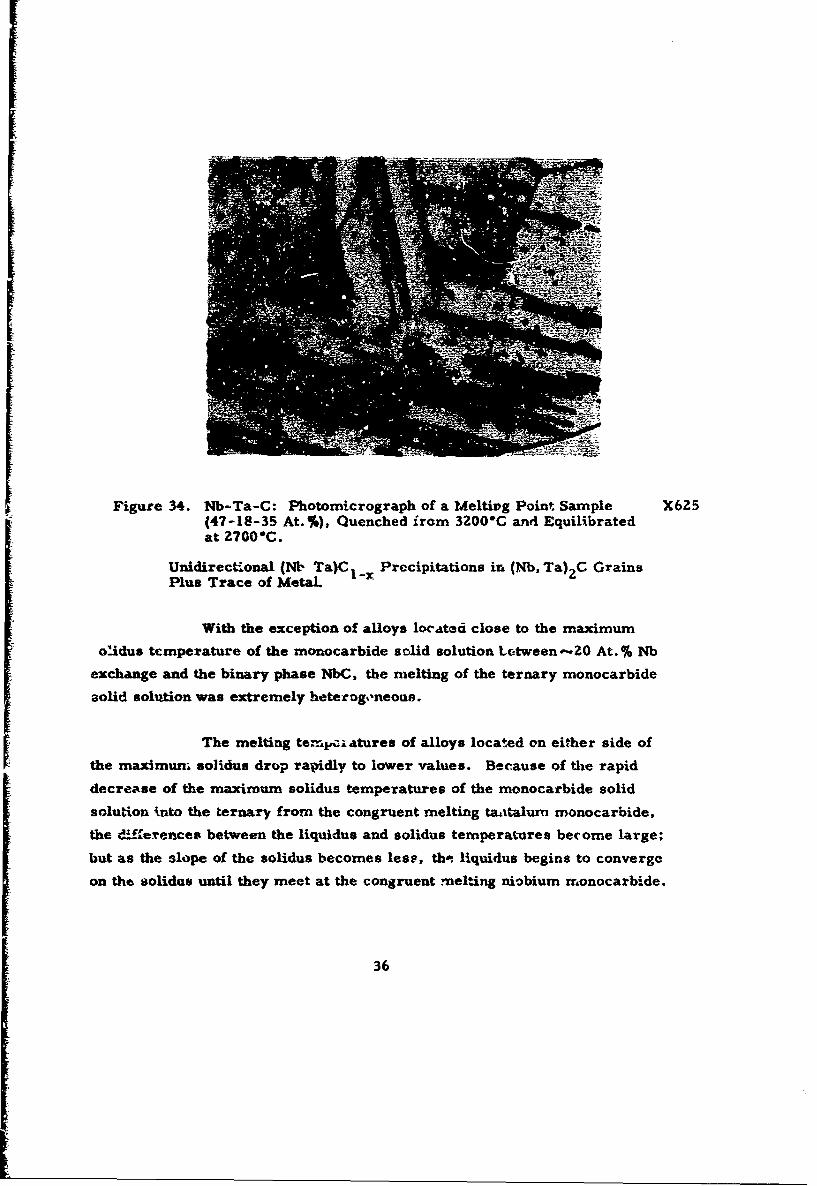
Figure 34. Nb-Ta-C: Photomicrograph of a Meltivg Point Sample X625(47-18-35 At.%). Quenched irom 3200*C and Equilibratedat 2700"C.
Unidirectional (Nb Ta)CI -x Precipitations in (Nb, Ta),C GrainsPlus Trace of Metal.
With the exception of alloys IorAted close to the maximum
olidus temperature of the monocarbide solid solution Letween '-Z0 At. % Nb
exchange and the binary phase NbC, the melting of the ternary monocarbide
solid solution was extremely heterogneous.
The melting tem.,a-atures of alloys located on either side of
the maximunm solidus drop rapidly to lower values. Because of the rapid
decrease of the maximum solidus temperatures of the monocarbide solid
solution into the ternary from the congruent melting taitalum rnonocarbide,
the %dIferences between the liquidus and solidus temperatures become large;
but as the slope of the solidus becomes less, the liquidus begins to converge
on the solidus until they meet at the congruent melting niobium rronocarbide.
36

48 -'4
46|-•
rr
400 •39850 A incipient melting
w 0 Specimen collapsedS• @0 Melted ijothermolly (Ti = Tcollj
0 a
< 3800 9
S3600I i - a I I A-- - I A
0 20 40 60 80 n00
TaCoe69 -- NIOBIUM EXCHANGE, ATOMIC % NbCo.78
Figure 35. Nb-Ta-C: Maximum Solidus Temperatures of t~he TernaryMonocarbide Phase.
Top: Concentration Line of the Maximum Solldus.
As a result of this, alloys quenched from liquidus temperatures ("ove the
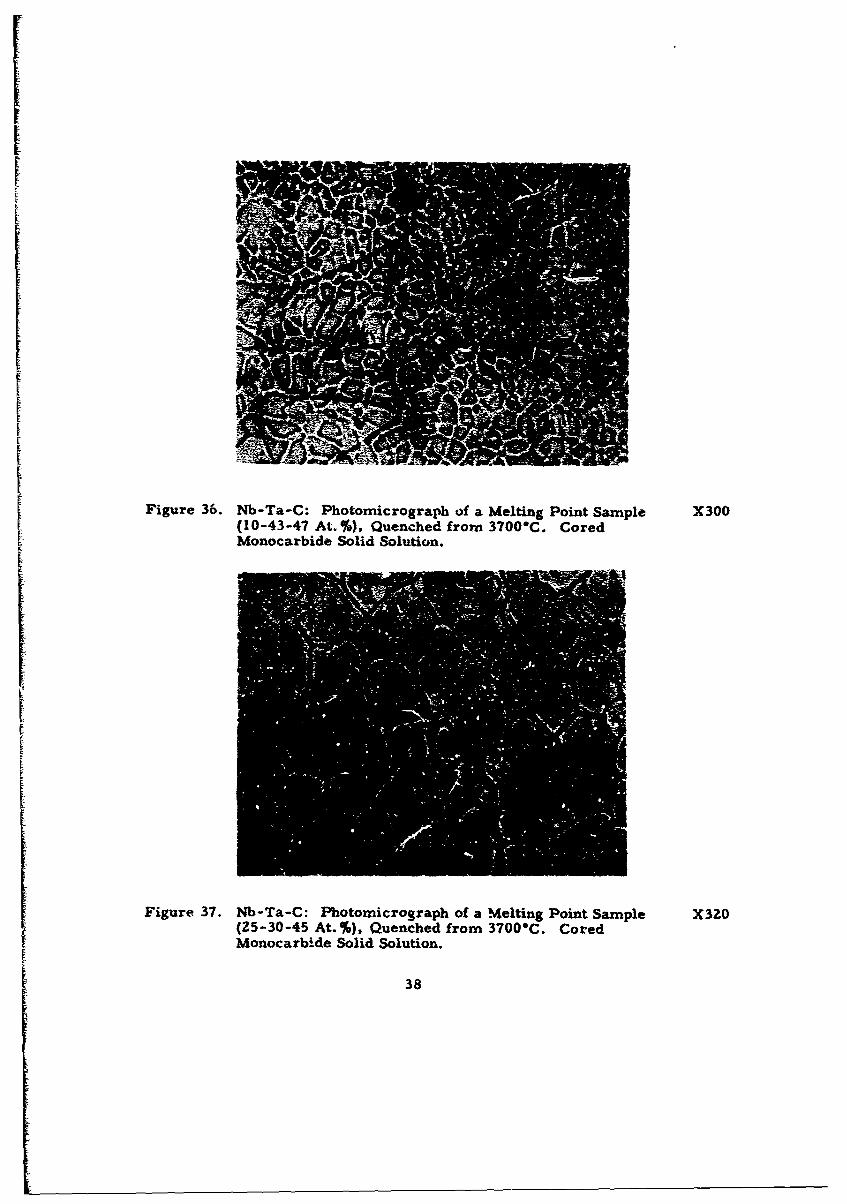
maximum solidus exhibited various degrees of coring an a function of theniobium exchange (Figures 36, 37, and 38).
37
I
Figure 36. Nb-Ta-C: Photomicrograph of a Melting Point Sample X300(10-43-47 At.%), Quenched from 3700*C. Cored
E Monocarbide Solid Solution.
Figure 37. Nb-Ta-C: Photomicrograph of a Melting Point Sample X320(25-30-45 At.%), Quenched from 3700*C. CoredMonocarbide Solid Solution.
38
FA
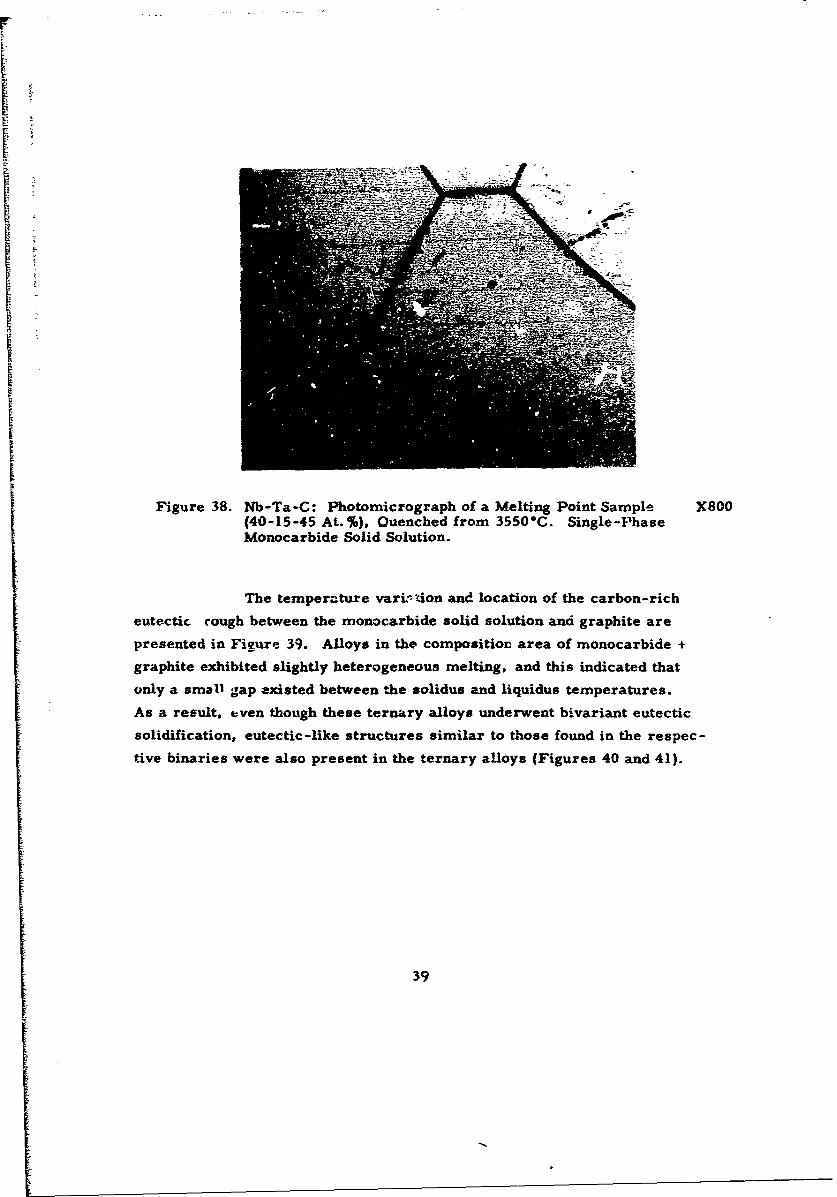
Figure 38. Nb-Ta-C: Photomicrograph of a Melting Point Sample X800(40-15-45 At.%), Quenched from 3550"C. Single-PhaseMonocarbide Solid Solution.
The tempera.ture varintion and location of the carbon-rich
eutectic cough between the monocarbide solid solution and graphite are
presented in Figure 39. Alloys in the composition area of monocarbide +
graphite exhibited slightly heterogeneous melting, and this indicated that
only a small gap existed between the solidus and liquidus temperatures.
As a result, even though these ternary alloys underwent bivariant eutectic
solidification, eutectic-like structures similar to those found in the respec-
tive binaries were also present in the ternary alloys (Figures 40 and 41).
39

62 61661 60
1460
S3500 34450 A Incipient melting0 0 Specimen collapsed
D- 3400- 3305"
W 3300I--
0 20 40 60 80 100TaC1.5 6 - NiOBIUM EXCHANGE, ATOMIC % -- NbC1.5 3
Figure 39. Ngb-Ta-C: Experimental Solidus Temperatures and Locationof the Eutectic Trough Between the Monocarbide SolidSolution and Graphite.
40

L
Figure 40. Nb-Ta-C: Photomicrograph of a Melting Point Sample X150(I11-28-61 At.%•). Quenched from 3430"C. PrimaryMonocarbide Plus (Nb, Ta,)C + C Eutectic.
•-Figure 41. lNb-Ta-C: Photomicrograph of a Melting Point Sample XlS0S(33-6-61 !kt. %), Quenched f:-.)m 3350"*C. (Nb, Ta)C + C
Eutectic. Very Slight Trace of Primary Graphite.
41
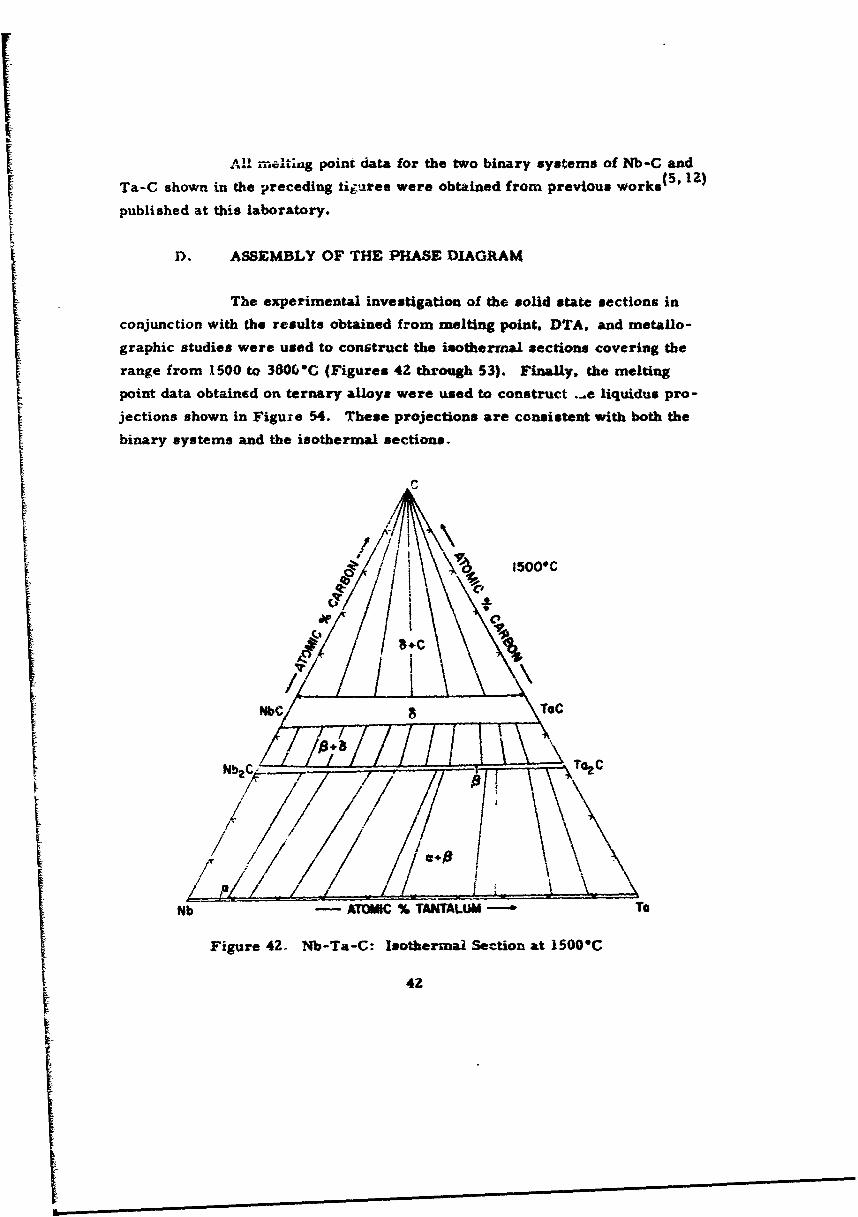
All o n elting point data for the two binary systems of Nb-C andTa-C shown in the preceding Iiiares were obtained from previous works{5 2
published at this laboratory.
D. ASSEMBLY OF THE PHASE DIAGRAM
The experimental investigation of the solid state sections in
conjunction with the results obtained from melting point. DTA, and metallo-
graphic studies were used to construct the isothermal sections covering the
range from 1500 to 3806*C (Figures 42 through 53). Finally, the melting
point data obtained on ternary alloys were used to construct .-_e liquidus pro-
jections shown in Figure 54. These projections are consistent with both the
binary systems and the isothermal sections.
• \15000C
S.C
Nb2C, a2C
a*
Nb - ATOUC % TANTALLUMM To
Figure 42. Nb-Ta-C: Isothermal Section at 1500oC
42

/
,,,
/- I
Mb - ATOMIC % TANTALUM- T
Figure 43. Nb-Ta-C: Isothermal Section at IS00"C
C.• • 2200-C
/ 15 \TTC
I/f//f /~a //' 7<j//I/. ,, + •
S/ l ,:, , / / +; . • \ \
Nbl -- ATOtUK. % TANTALU --- TO
Figure 44. Nb-Ta-C: Isothermzl Section at 2200"C
43

II /!\/ /
N Y-T42 C
Nb- ATOMIC % TANTALUM To
Figure 45. Nb-Ta-C: Isothermal Section at 2400*C
C
& 2600rC
,, /If/
/ I/cNbC S \Tac
Nb 2 C yTa2CL•y' -/ /,
I• -- Orc % TANMLUM "• j
Figure 46. Nb-Ta-C: Isothermal Section at 2600*C
44

.,
r!\
NbC /TiC8\
Nb2C /C
L
Nb -ATOMIC % TANTALUM- To
Figure 47. Nb-Ta-C: Isothermal Section at 29001C
C
~./ 52006C
/l ,~
Nb -ATOMIC TANTALUM. T/F/
Figure 48. Nb-Ta-C: Isothermal Section at 3Z00"C
45
£S\•I,.a3:3200C
4 NbC To
/ \/ \
'f-4
Nb TANTALUM
-- ATOMIC % TANAUMT
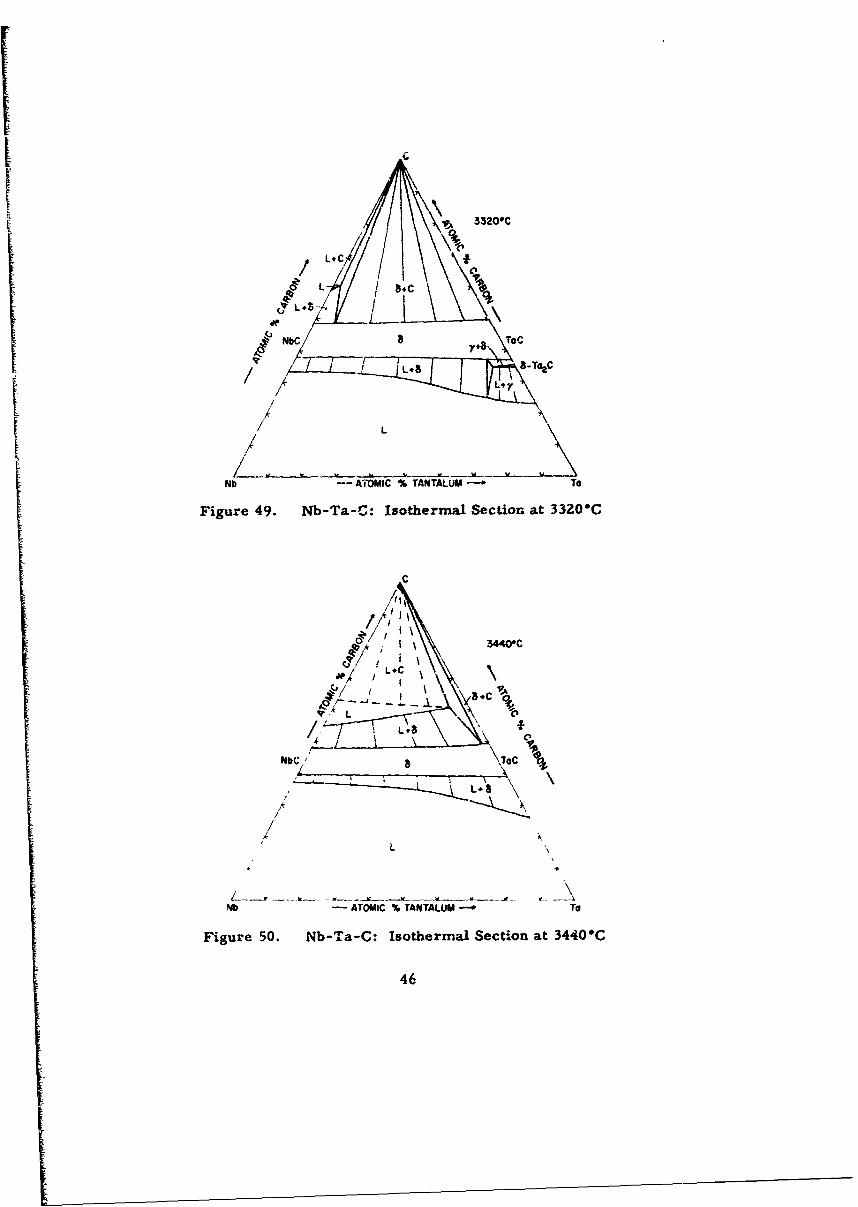
Figure 49. Nb-Ta-C: Isothermal Section at 33Z0*C
C
1 /'or 34400C
*/ 1L. %4
,bC1 - S '\ ',• . , c \
LL*a
/AA
/\TO
LL
Nb ATOMIC % TANTALUM - To
Figure 50. Nb-Ta-C: Isothermal Section at 3440*C
46
/L.C 0 3600 0C
Ci
L
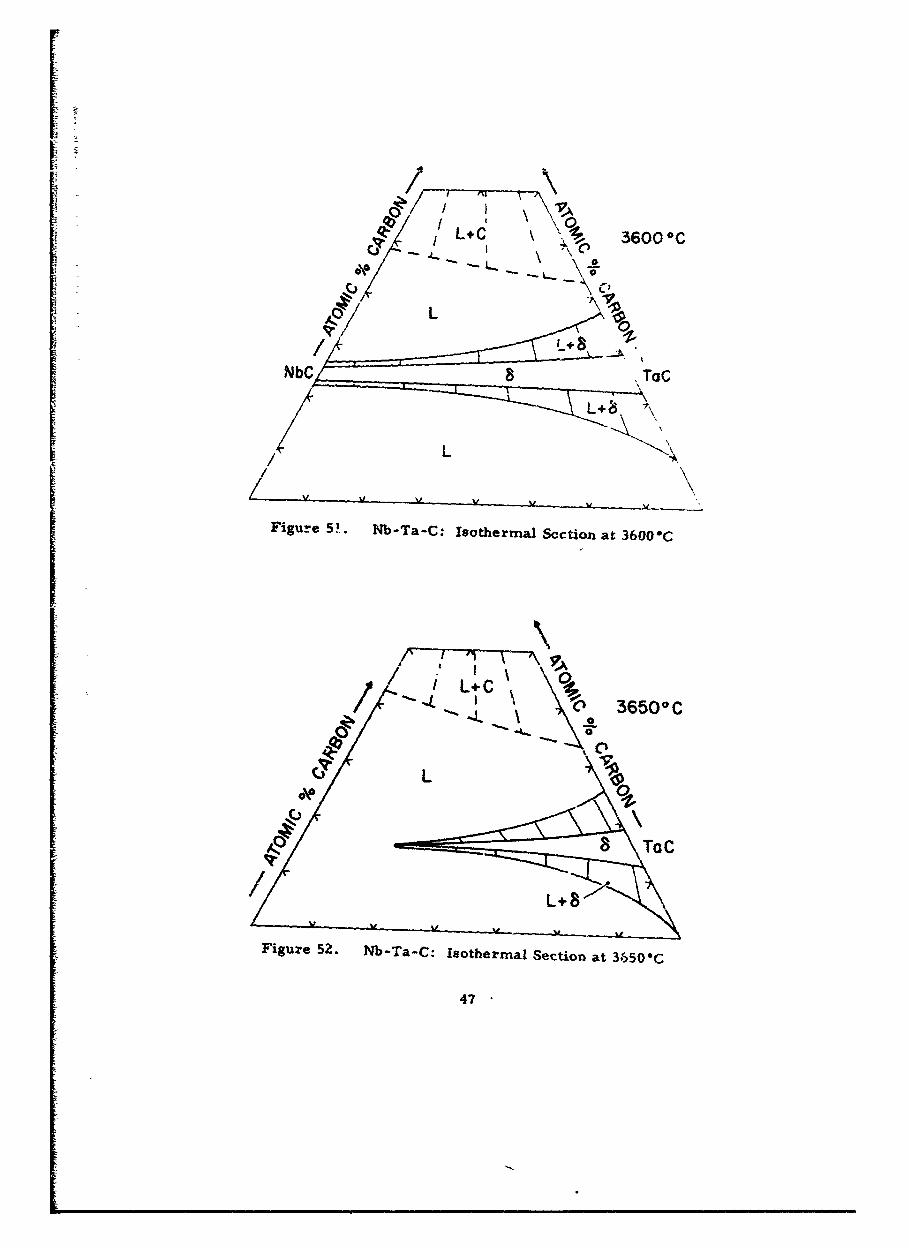
Figure P)* Nb-Ta-C: Isothermal Section at 36000C
L+C0
a ~ 36500C
0\0
To
Figure 52. Nb-Ta-C: Isothermal Section at 3650-C
47

/ C -- 7 380000C
L! TOC
L+8~
AZ/d L
Figure 53. Nb-Ta-C: Isothermal Section at 3800*C
33050 3445
0............. Maximu S.iu Tepraue.o... aC 1 (iqiuProecton weeetiae ro0h0mligcA0ateitc
of0 the0 allos)00
I70240 63

V. CONCLUSIONS AND DISCUSSION
As mentioned previously, the order-disorder phase reaction which
occurs in the subcarbide solid solution is not shown in either the section
drawings or the isometric view of the entire phase diagram. The DTA study
showed the ordering reaction to decrease in temperature into the ternary
froin the respective binary phases, but the reaction became extremely
sluggish in the ternary system, and its temperature variation as a function of
metal exchange could not be established. The metailographic examination of
alloys located close to the binary phases and also th.cse in the ternary showed
identical structures which are associated with the ordering reactiorn in the
gubcarbide solid solution.
Therefore, since the order-disorder transition temperatures in
Nb2 C and Ta2 C are lowered by the mutual metal evchanges, and assuming
that a miscibility gat does not exist bt.tween the two ordered forrcs o! "4he
MeC-ss; the disordered subcarbide phase will first appear in the ternary T
system at a limiting tie-line type reaction of the form disordered-(Nb, Ta)?CI fec
ordered-(Nb, Ta)2 C + (Nb. Ta)C Ix . The proposed reaction sequence fo1 the
initiation of the disordered subcarbide phase is prevented in Fig-ure 55. This
reaction sequence is also consiatent with the two-phased process which occurs
in the respective binary systems at hyperstoichiometric compositions. There-
fore, as shown in the proposed reaction sequence, the two, three-phased fields
will run out to the respective binary systems with increasing temperature leaving
behind a complete series of solid solutions of the disordered-(Nb, Ta)2C.
Because the transition in NbzC and TaC at hypostoichiometric compo-
sitions does not involve a first-nrder phase change, no three-phase equilibria
are expected to result in the order-disorder transformation at the metal-rich
boundary of the subcarbide phase. The same is probably true for the displacive
transformation which occurs in the Nb.C binary phase at- 1230"C. From the
experimental results, the orthorhombic to hexagonal transition seems to be of a
higher order type at both hypo- and hyperstoichiometric compositions.
49

NbC 'CTaC
Nb 2 C T02C
NbC To C
Nb2 C TO~ZT2
NbCU1 d
Nb2C A 02CNbC -T- ToC
Nb2CI T02CTc< <T, 4T2cT 3
Figure 55. N-b-Ta-C: Schematic IMusti ation for the Formation of the?f-(Nb. Ta)2 C1 I + Phase: Disordered- 7 '-(Nb. Ta),,C I+x =
Ordered-,8 -(Nb, Ta)2 C + 6-(b Ta, 1x
50

To compare the experimental tie-line distributioro in the two-phase
fi6ids of (Nb. Ta)-(Nb, Ta)2 C Ix and (Nb, Ta)2 C 1I_ - (Nb, Ta)CI- with the
thermodynamically calculated values, one hao to tnow the free enthalpies of
formation of the binary phases at the respective carbon concentrations.
Tables 3 and 4 list the entheilpy differences which were uscd for the
calculation of the tie-line distributi 3ns in the corresponding two-phase fields.
Using the assumptions of convtant carbon concentrations and ideal
solution behavior in the three series of solid solutions, the conditional equa-
tions governing the two-phase equilibria in the ternary system are:
Sf(N b, T a )C= a AG f(N b T a )C v E q (1)
a XTa T,p •XTa T,p
and3AG f(Nb. TaKCv V AG f(Nb, TaX w Eq (2)
SXa T,p Ta T, p
Table 3. Free Enthalpy Data of Niobium Carbides
Phase Free Energy of Formation__hse _(cal/gr-At. Nb)
NbC0. 7 5 AGf = -28,185 + 0.755 T
NbC0. 4 8 AGf -2.,100 (constant)
NbC0 .5 6Gf = -22,900 (constant)
Table 4. Free Enthalpy Data of Tantalum Carbides
"IPhase Free Energy of FormationI (cal/gr-At. Ta)
TaC 0 . 7 5 AGf = -26,943 - 0.88 T
TaC0. 4 8 AGf = -23,000 (constant)
TaC0.5 AGf = -24,300 (constant)
51
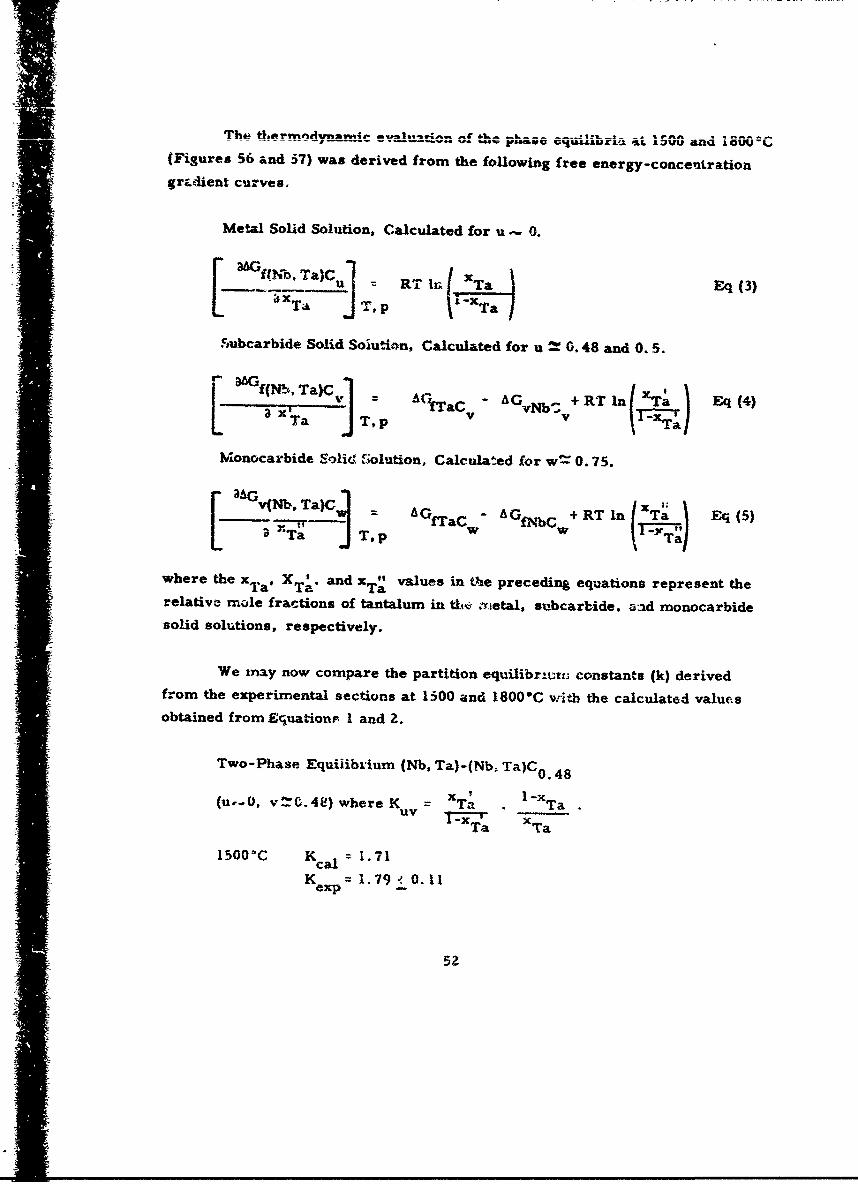
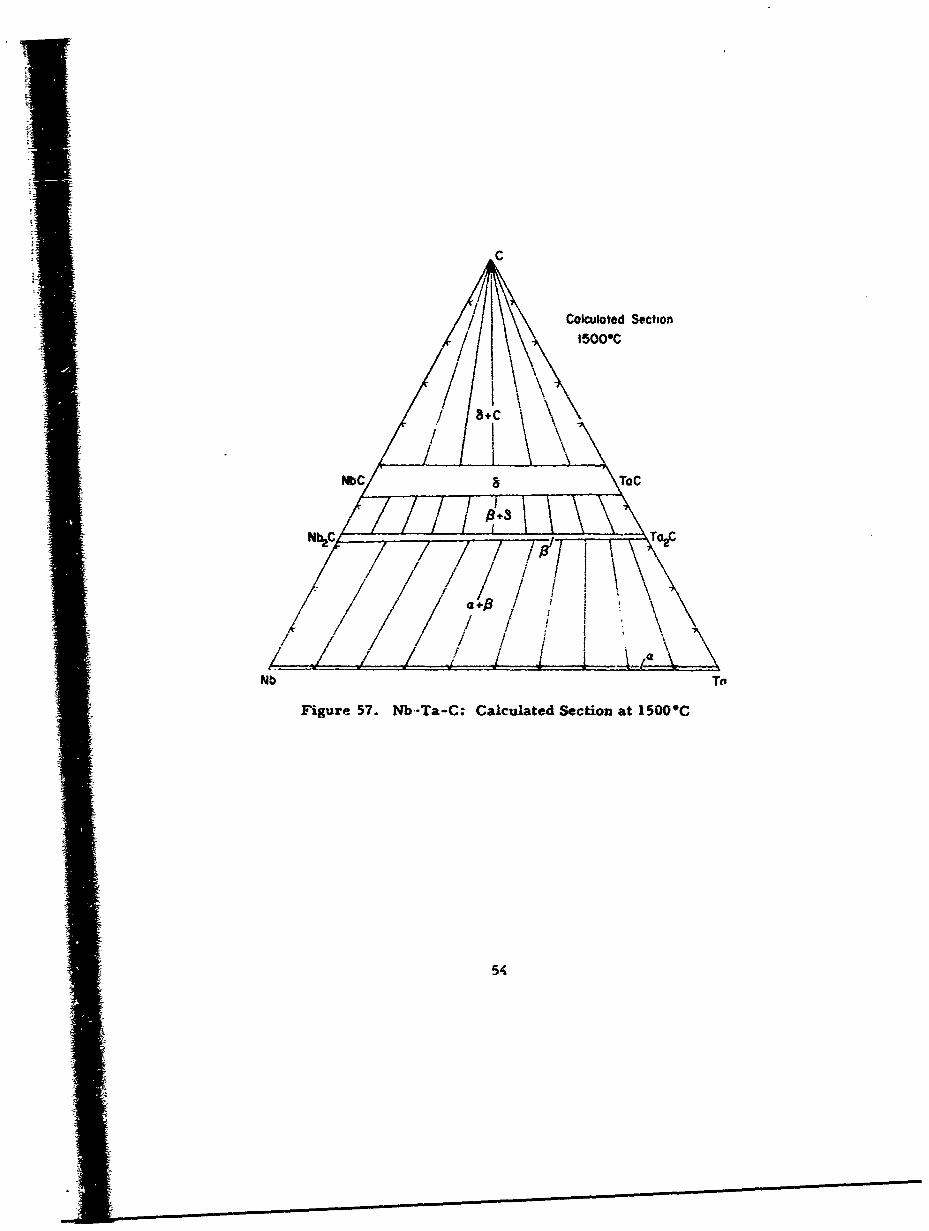
Thip~~~~~ thbrninvi-_ __2 s _i. .. ........ .. jU" & t .... .. . . V-- , . U and IGOO-(Figures 56 and 37) was derived from the following free energy-concentrationgr•.dient curves.
Metal Solid Solution, Calculated for u 0.
[3%NT)C RT izu (x~a Eq (3)
""ubcarbide Solid Solution, Calculated for u 6. 48 and 0.5.
aAG f(M, Ta)C fVTC - AGvNb-+ RT In xTa Eq (4)
LTa T, p)
Monocarbide Siolid Solution, Calculated for w= 0.75.
__ = Ta) I G - A + RT In IXTa Eq (5)
I - ý- Ta' T. p aI I
where the XTa, X ' and x a values in the preceding equations represent theT Ta' Tarelative mole fractions of tantalum in the Yietal, subcarbide, a:ad monocarbidesolid solutions, respectively.
We miay now compare the partition equilibr.urt. constants (k) derivedfrom the experimental sections at 1300 and 1800"C w;ith the calculated valuesobtained from Equations I and 2.
Two-Phase Equilibrium (Nb, Ta)-(Nb, Ta)C0. 4 8
x I I-X(u,.-0, v G.48) where K T . l-TaI uv X -
T1a Ta
1500 C Kca = 1. 71
K = 1.79 0. 11iexp --
I5

Two-Phase Equilibrium (1.b, Ta)C0 .5" (Nb, Ta)C0.75
(u-0.5, w =0.75) where Kw = Ta . TaTa Ta
1800"C KCal = 1.22
K e = 1. V + 0.04exp l.7OO
The unceztainties in the experimentally determined (K) values are a result of
the scatter of values obtained from the indivicdual tie lines.
C
Colculated Sectioni1 1 K18001C
/ / ,& \\
. / I Io
it~
Nb C . . . . . 0-----: , •
Nb/TOC
: Figure 56. Nb-Ta-C: Calculated Section at 1800"C,
I53
/ 53
/ /
C
/CColculoted Section1500-C
Nb /To
Figure 57. Nb-Ta-C: Calculated Section at 1500*C
54

REFERENCES
1. Bueckle, H.: Z. Metallk. 37 (1946) 53
S 2. Williams, D.E. and W.H. Pechin: Trans. ASM 50 (1958)1081
3. Storms, E.K. and N.H. Krikorian: J. Phys. Chem. 64 (1960)1471
4. Kimura, H. anl Y. Sasali: Trans. Jap. Inst. Met. 2 (1961)98
5. Rudy, E., S. Windisch, and C.E. Brukl: AFML-TR-65-2, Part I,Vol. X:- (Sept. 1967)
6. Rudy, E. and C.E. Brukl: J. Amer. Ceram. Soc. 50 No. 5, (1967), 265
7. Terao, N.: Jap. J. Appl. Phys, 3 (1964), 104.
8. Volkova, N.M. and P. V. Gel'd: Izvest. Vysh, Uchebnik Zaved.Tsvetnaya Metallurgiya 3 (1965), 77.
9. Alyamovsidi, S. I., G. P. Sheikin, and P. V. Gel'd, J. Neorg. Chim. 8(1963), 2000.
10. Yvon, K., H. Nowotny, and R. Kieffer: Mh. Chem. 2L (1967), 34.
11. Rudy, E.: AFML-TR-65-2, Part nI, Vol. VIE (March 1966), 105.
12. Rudy, E. and D.P. Ha.rmon: AFML-TR-65-2, Part I, Vol. V (Jan. 1966).
13. Bowman, A.L., T.C. Wallace, J. L. Yarnell, R. G. Wenzel, andE. K. Storms: Acta Cryst. 19 (1965), 6
14. Lesser, R. and G. Brauer: Z. Metallkde.49 (1958), 6ZZ.
15. Zaplatynsky, I.: J. Amer. Ceram. Soc. 49, No. 2 (1966), 109.
16. Brizes, W.F. and S.M. Tobin: J. Am. Ceram. Soc. 50 (:967), 115
17. Nowotny, H. and R. Kieffer: Z. Metallk. 38 (1947), 257
18. Norton, J.T. and A. L. Mowrv J. Metals 1(1949) 133.
19. Agte, C. and H. Alterthum: Z. Tech. Physik 11 (1930) 182.
20. Rudy, E.. St. Windisch, and Y.A. Chang: AFML-TR-65-2, Part I,Vol. I, (ian. 1965).
21. Rudy, E. and G. Progulski: Planseeber. Pulvermet., 15. No. 1,p. 13 (1967).
1 s55
REFERENCES (Cont)
22. Heetderks, H.D., E. Rudy, and T. E. Eckert: PlanseeberPulvermet,13, p. 105 (1965), also USAF Report AFML-TR-65-2, Part IV, Vol. IMT65).
2>. Elliott, R. P.: Constitution of Binary Alloys, First Supplement,McGraw-Hill, New York (1965).
24. Pearson, W. B. : Handbook of Lattice Spcigs and Structures ofMetals, Pergamon PMess, New York (195u).
56

UNCLASSIFIED
*)OCUWMET CONTROL UGA A- 3 & C'(~~kwft9 f~e~~ i lf tti,. be*p .1 46bakter mad irtth- reoaf-i -use be anterad m whoa w a.w irwopat is ciss8#14"
I. ORIGINA TING ACTIVITY (COOPIM MO&.) RPR EUIYCASFCTO
Aerojet-General CorporationWCRU
3. RE.PORT TITLE
Phase Equilibria Investigations of Binary, Ternary, and Higher OrderSystems. Part 111. The Nb-Ta-C System
4. OEICRIPTVIV# NOTES (ry"* "pert mndiueSWJ* m e fesb )
S. AU THORISI (iftS #1000, MRWe 0d. ufl. M101 A806)
Booker, Phljlip H.Rudy, Erwin
0. REPORT OAT#. Tae TOTAL NO0. OF PAGES 7&. No. or REFS
April 1970) ____ ___ 67 2486. CONTRt3CS Oft GRAN T ;0. 99k ORIGEINATO~RS REPORr NtUMAERCS)
P33615-67-C-3 513 None6. 00ROJECT NO.
7350-. Task 735001 IS. OTHER REPOR T .50(51 (Any &% e oebam. Ilat aw be A.SSOWO
AFNL-TR-69-117, Part IIIIS. DISTRIUUTI@Nt STATEMOENT
This document has been approved for public release and sale; itsdistribution is unlimited.
I I. SUPPLEWENTARV MOVES St2 SO. N spwot1MILITAIY ACTIVITY
Air Force Katerials LaboratoryIrigh-Itr AFB, Ohio 45433
23T. STRA\C T
The so-lid state and solid-liquid equilibria of the Nh-Ta-Csy'stem ha~iý*!eeu determined by melting point determinationa, X-rayand chemical analysis, metallography, and differential thermal analysisfor tempercturee above 1500*C.
The ternary system has a complete solid solution of monocarbidesand also of subcarbides it the differences in carbon -atom orderingis disregarded. Eutectic troughs in both thu metal-rich and carbon-rich regions of the ternary are present. Calculated tie-line distri-butions agree well with L~perimental results.
DD "2.1473____ ____
P.tn# a~~iai.

Secutity CIommification
$a LIN4K A LINK a LINK CKey "ORO*
M@LC WT fOLK WT fot*. WT
Phase EquilibriaCutting ToolsNiobium-Tantalum-CarbonThermodynamics
Secwty cs~stfic~Io


