Photometry
Measuring Energy
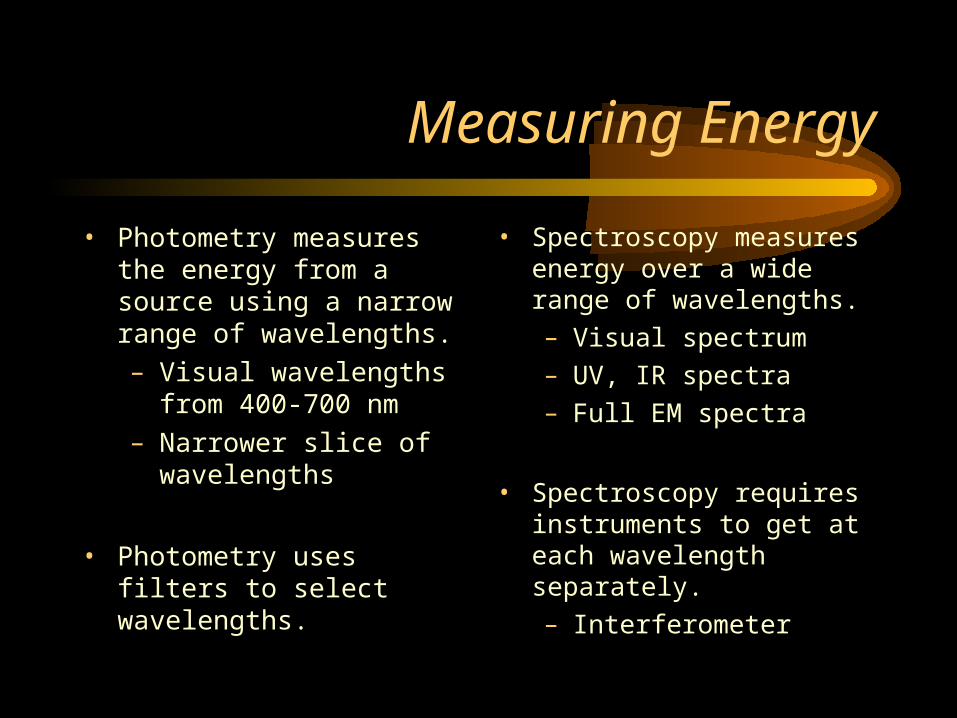
• Photometry measures the energy from a source using a narrow range of wavelengths.
– Visual wavelengths from 400-700 nm
– Narrower slice of wavelengths
• Photometry uses filters to select wavelengths.
• Spectroscopy measures energy over a wide range of wavelengths.
– Visual spectrum
– UV, IR spectra
– Full EM spectra
• Spectroscopy requires instruments to get at each wavelength separately.
– Interferometer
Luminosity of Stars
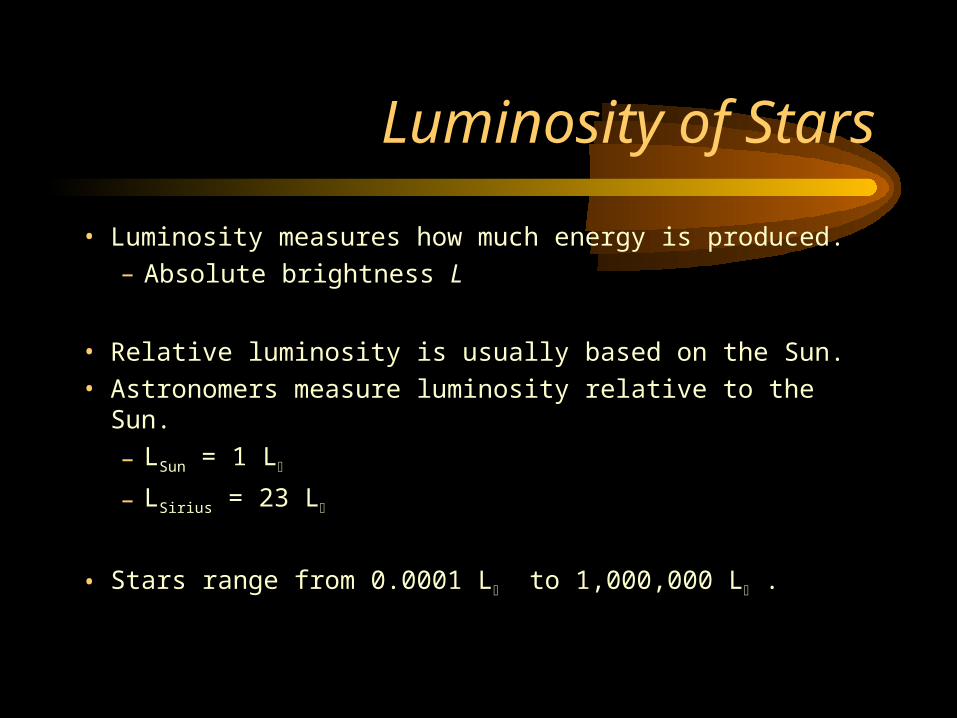
• Luminosity measures how much energy is produced.
– Absolute brightness L
• Relative luminosity is usually based on the Sun.
• Astronomers measure luminosity relative to the Sun.
– LSun = 1 L
– LSirius = 23 L
• Stars range from 0.0001 L to 1,000,000 L .
Magnitude
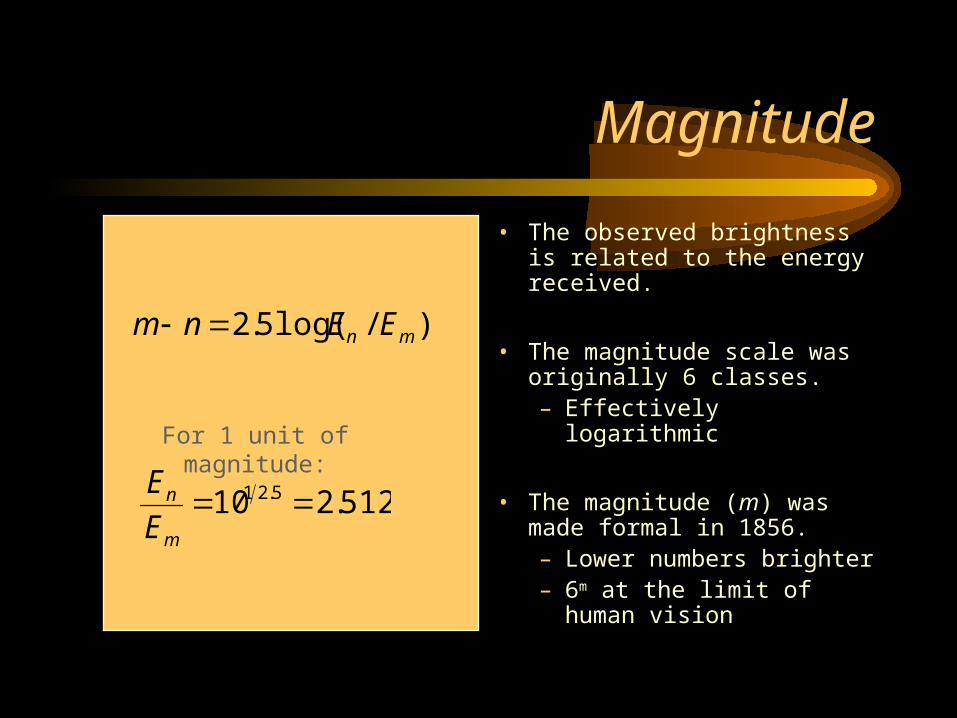
• The observed brightness is related to the energy received.
• The magnitude scale was originally 6 classes.– Effectively logarithmic
• The magnitude (m) was made formal in 1856.– Lower numbers brighter– 6m at the limit of human
vision
)/log(5.2 mn EEnm
512.210 5.21 m
n
E
E
For 1 unit of magnitude:
Brightness Magnified
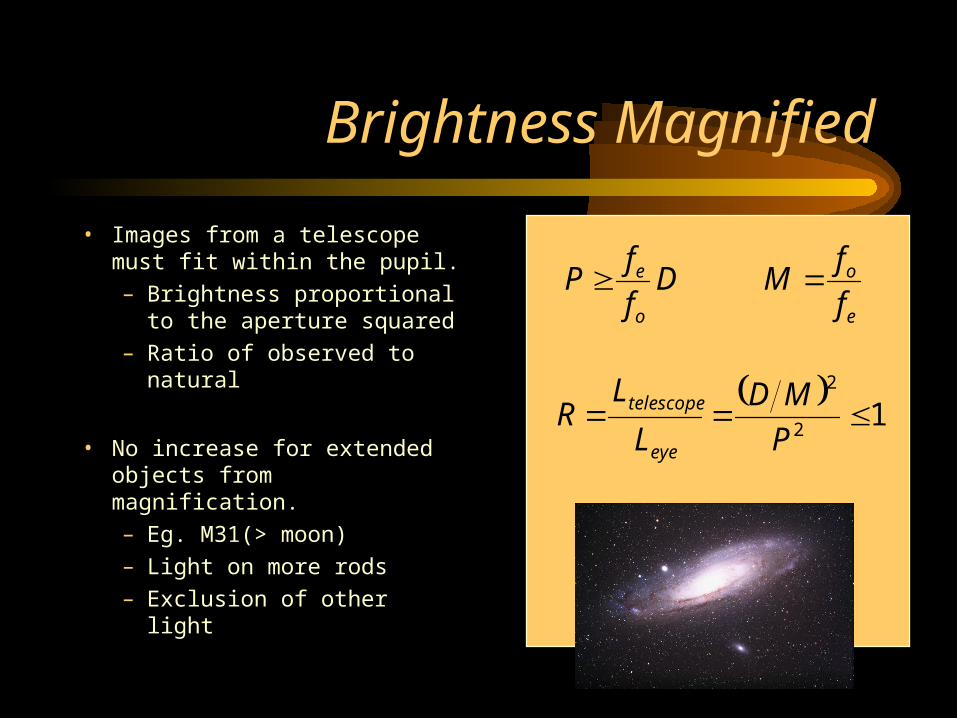
• Images from a telescope must fit within the pupil.
– Brightness proportional to the aperture squared
– Ratio of observed to natural
• No increase for extended objects from magnification.
– Eg. M31(> moon)
– Light on more rods
– Exclusion of other light
Df
fP
o
ee
o
f
fM
1
2
2
P
MD
L
LR
eye
telescope
Point Source Magnified
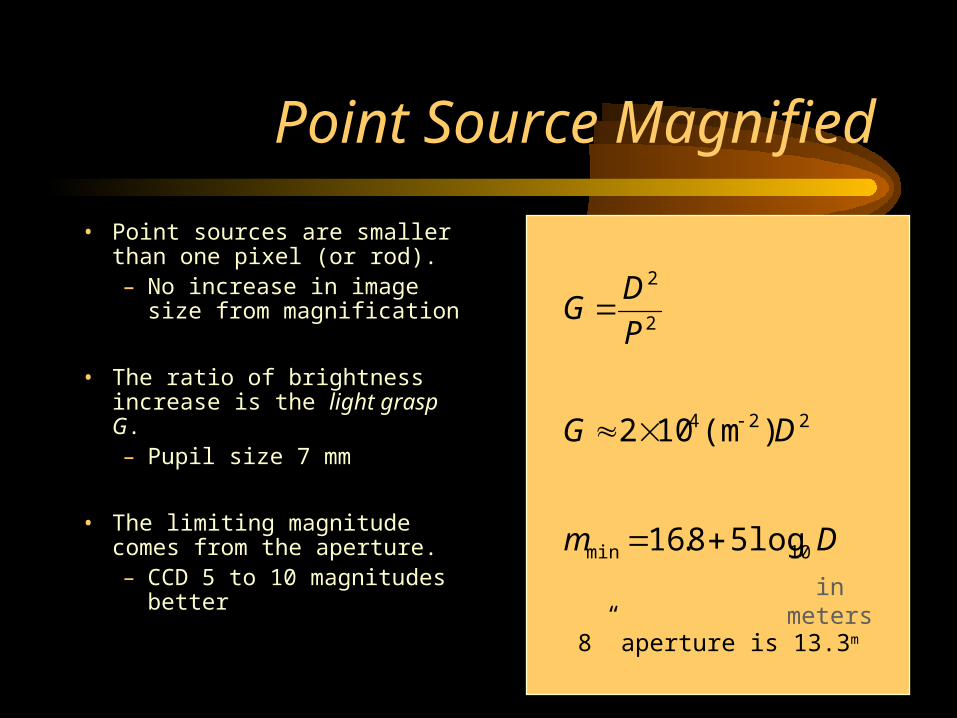
• Point sources are smaller than one pixel (or rod).– No increase in image size
from magnification
• The ratio of brightness increase is the light grasp G.– Pupil size 7 mm
• The limiting magnitude comes from the aperture.– CCD 5 to 10 magnitudes
better
Dm 10min log58.16
224 )(m102 DG
2
2
P
DG
in meters
8” aperture is 13.3m
Apparent Magnitude
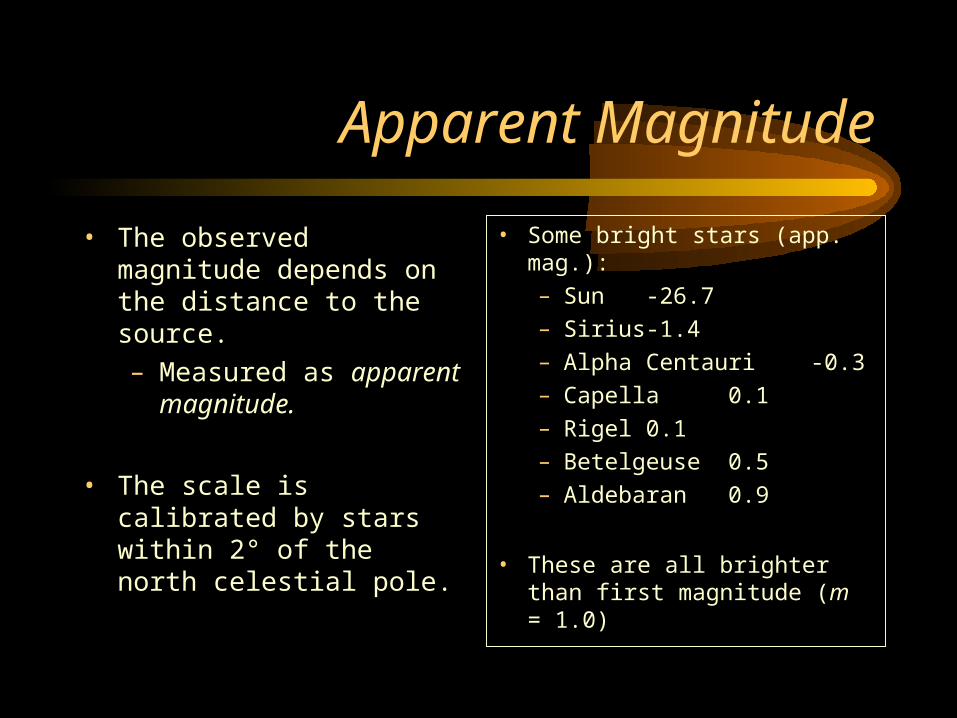
• The observed magnitude depends on the distance to the source.
– Measured as apparent magnitude.
• The scale is calibrated by stars within 2° of the north celestial pole.
• Some bright stars (app. mag.):– Sun -26.7– Sirius -1.4– Alpha Centauri -0.3– Capella 0.1– Rigel 0.1– Betelgeuse 0.5– Aldebaran
0.9
• These are all brighter than first magnitude (m = 1.0)
Distance Correction
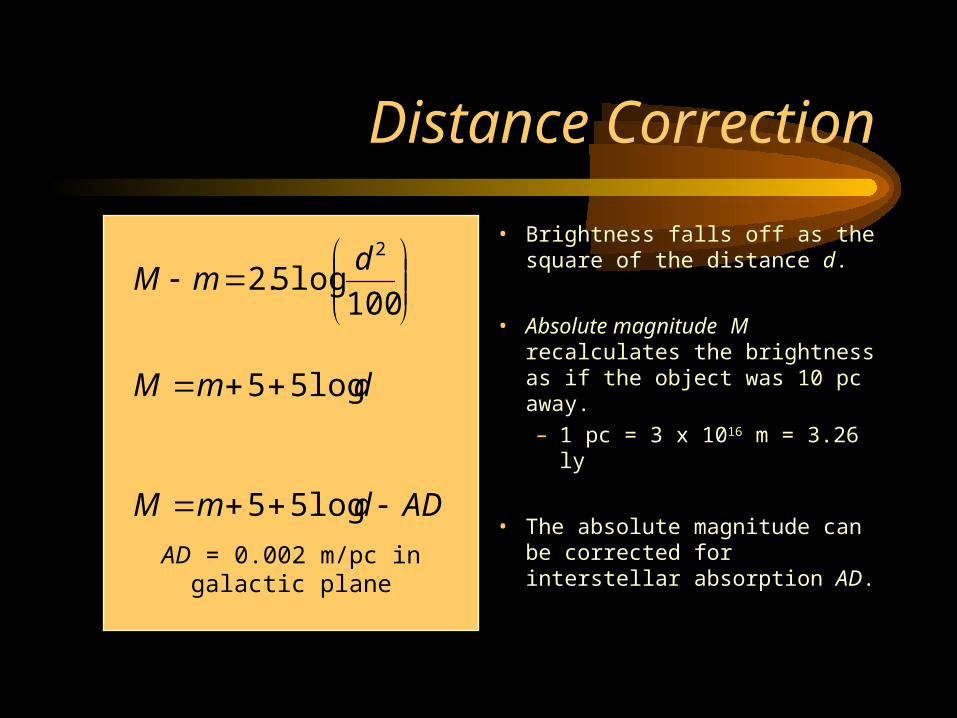
• Brightness falls off as the square of the distance d.
• Absolute magnitude M recalculates the brightness as if the object was 10 pc away.
– 1 pc = 3 x 10¹⁶ m = 3.26 ly
• The absolute magnitude can be corrected for interstellar absorption AD.
100log5.2
2dmM
dmM log55
ADdmM log55
AD = 0.002 m/pc in galactic plane
Absolute Magnitude
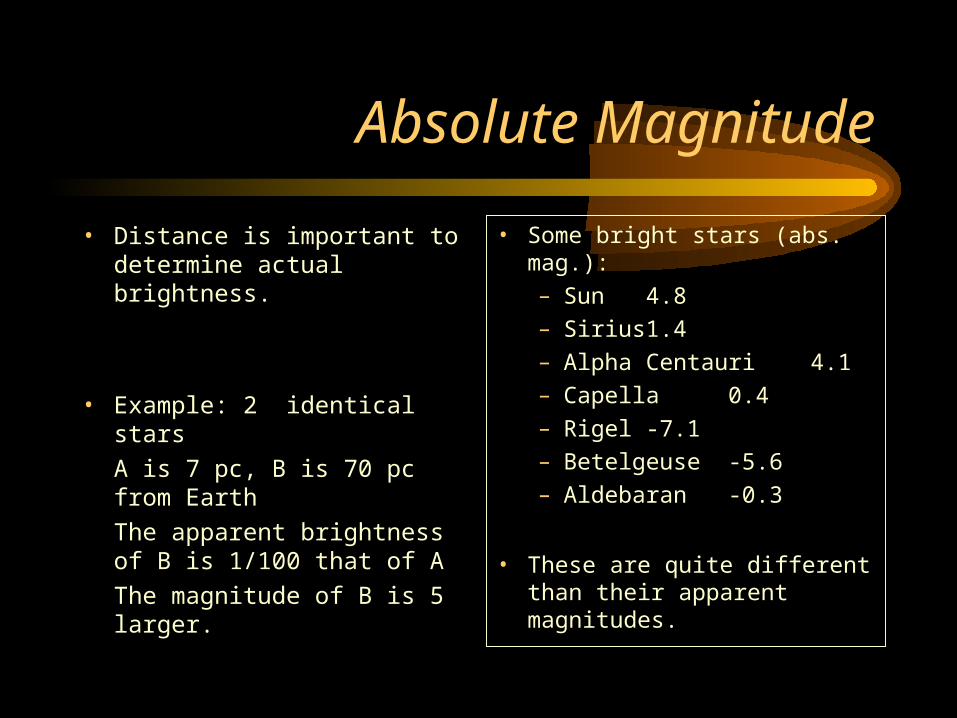
• Distance is important to determine actual brightness.
• Example: 2 identical stars
A is 7 pc, B is 70 pc from Earth
The apparent brightness of B is 1/100 that of A
The magnitude of B is 5 larger.
• Some bright stars (abs. mag.):– Sun 4.8– Sirius 1.4– Alpha Centauri 4.1– Capella 0.4
– Rigel -7.1– Betelgeuse -5.6– Aldebaran -
0.3
• These are quite different than their apparent magnitudes.
Imaging
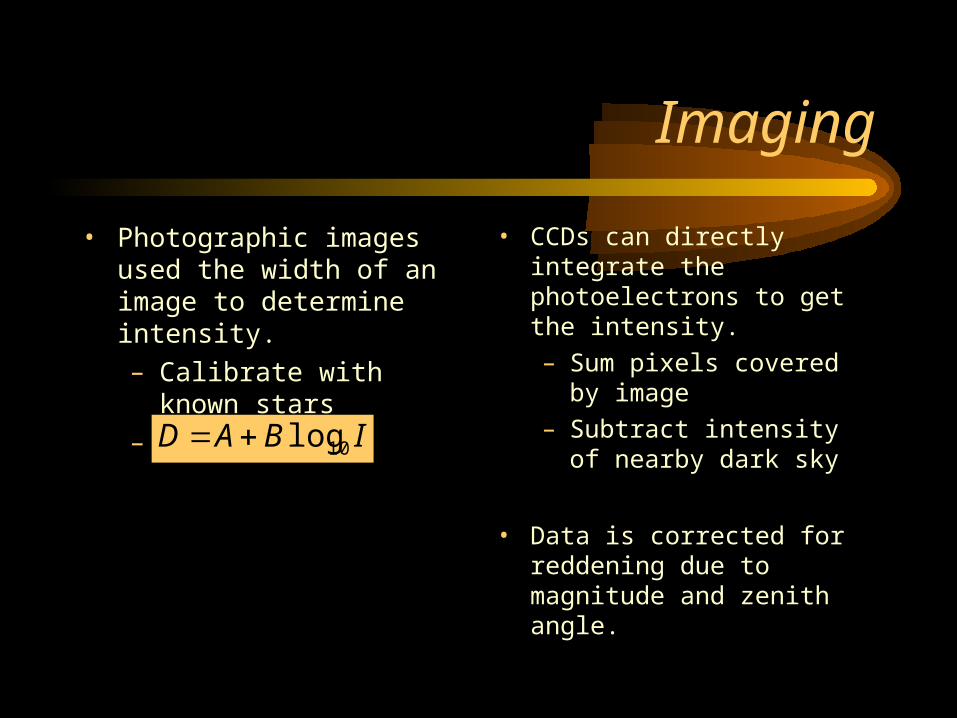
• Photographic images used the width of an image to determine intensity.
– Calibrate with known stars
– Fit to curve
• CCDs can directly integrate the photoelectrons to get the intensity.
– Sum pixels covered by image
– Subtract intensity of nearby dark sky
• Data is corrected for reddening due to magnitude and zenith angle.
IBAD 10log
Solar Facts
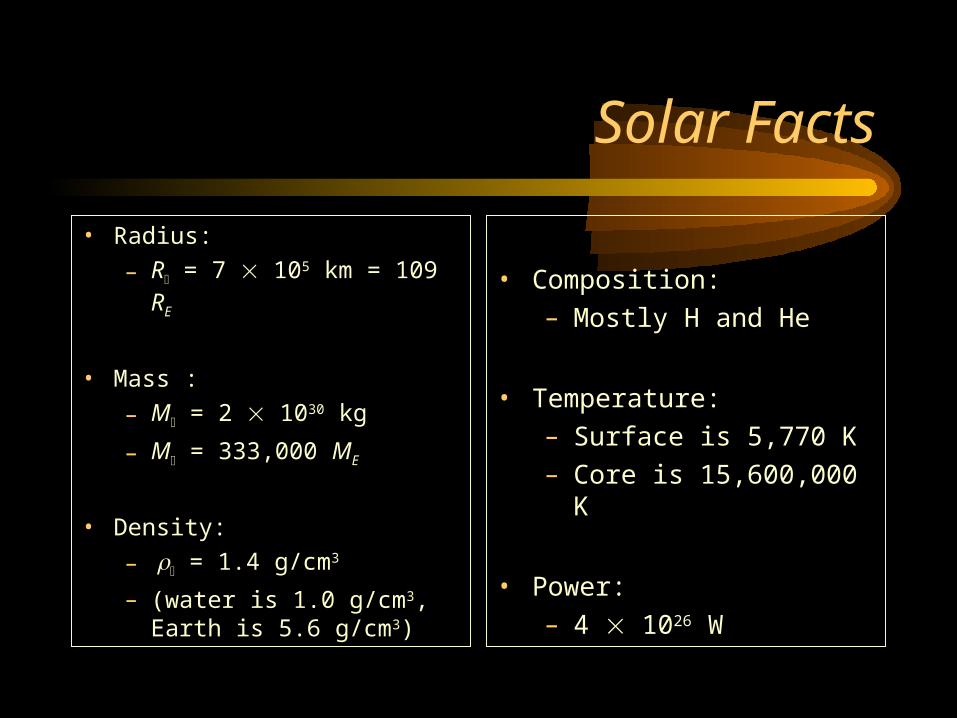
• Radius:
– R = 7 105 km = 109 RE
• Mass :
– M = 2 1030 kg
– M = 333,000 ME
• Density:
– = 1.4 g/cm3
– (water is 1.0 g/cm3, Earth is 5.6 g/cm3)
• Composition:
– Mostly H and He
• Temperature:
– Surface is 5,770 K
– Core is 15,600,000 K
• Power:
– 4 1026 W
Hydrogen Ionization
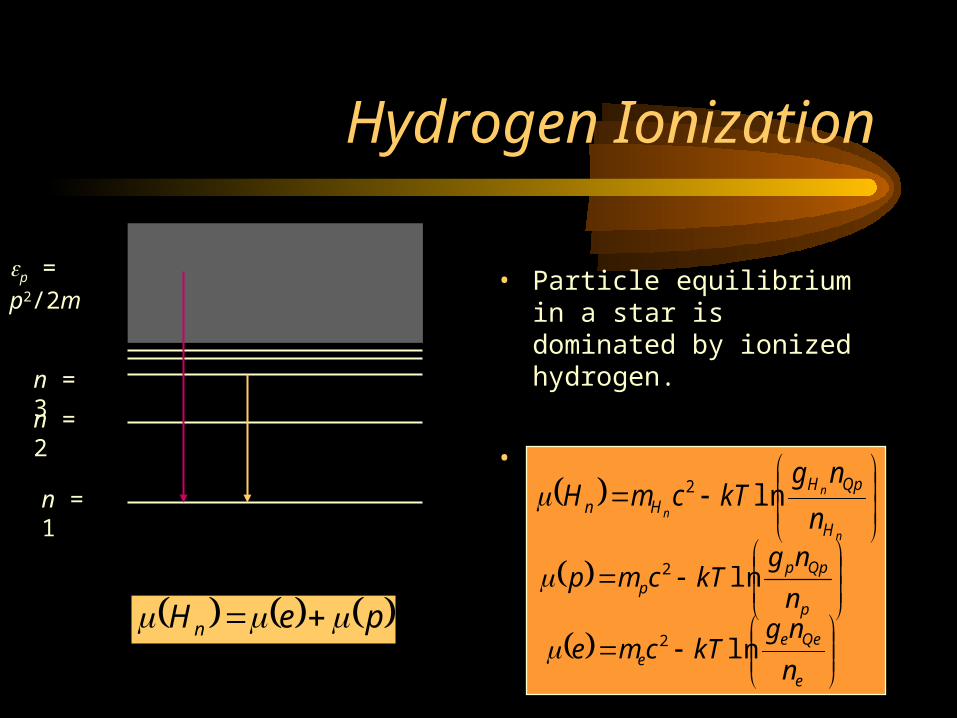
• Particle equilibrium in a star is dominated by ionized hydrogen.
• Equilibrium is a balance of chemical potentials.
n = 1
n = 2
n = 3
peH n
p = p2/2m
n
n
n
H
QpHHn n
ngkTcmH ln2
p
Qppp n
ngkTcmp ln2
e
Qeee n
ngkTcme ln2
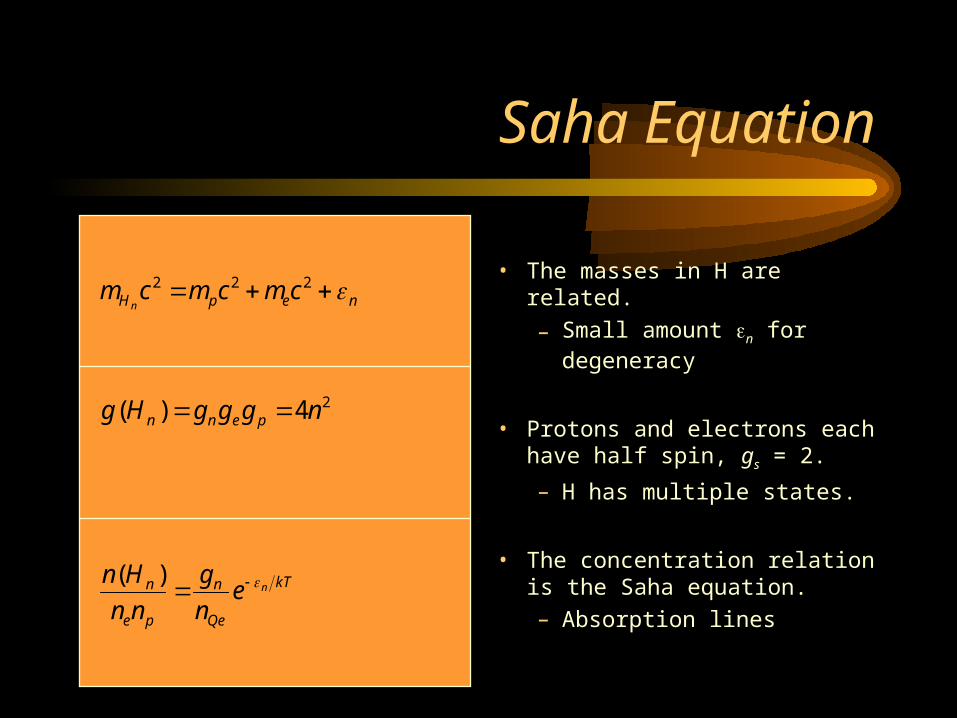
Saha Equation
• The masses in H are related.
– Small amount n for degeneracy
• Protons and electrons each have half spin, gs = 2.
– H has multiple states.
• The concentration relation is the Saha equation.
– Absorption lines
kT
Qe
n
pe
n nen
g
nn
Hn )(
nepH cmcmcmn
222
24)( ngggHg penn
Spectral Types
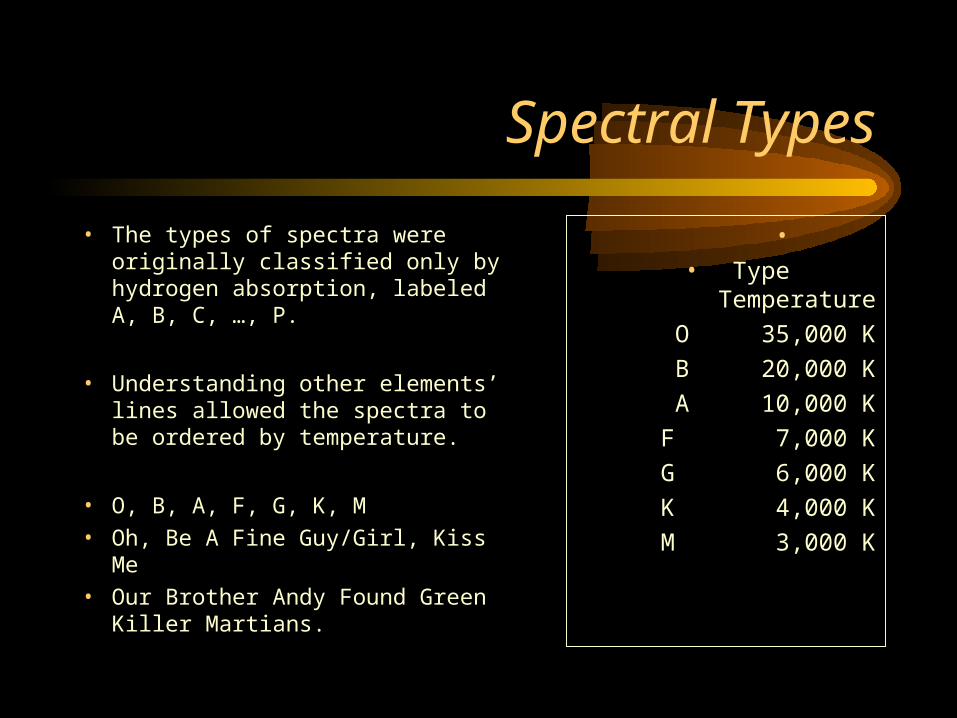
• The types of spectra were originally classified only by hydrogen absorption, labeled A, B, C, …, P.
• Understanding other elements’ lines allowed the spectra to be ordered by temperature.
• O, B, A, F, G, K, M
• Oh, Be A Fine Guy/Girl, Kiss Me
• Our Brother Andy Found Green Killer Martians.
•
• Type Temperature
O 35,000 K
B20,000 K
A 10,000 K
F 7,000 K
G 6,000 K
K 4,000 K
M 3,000 K
Spectral Classes
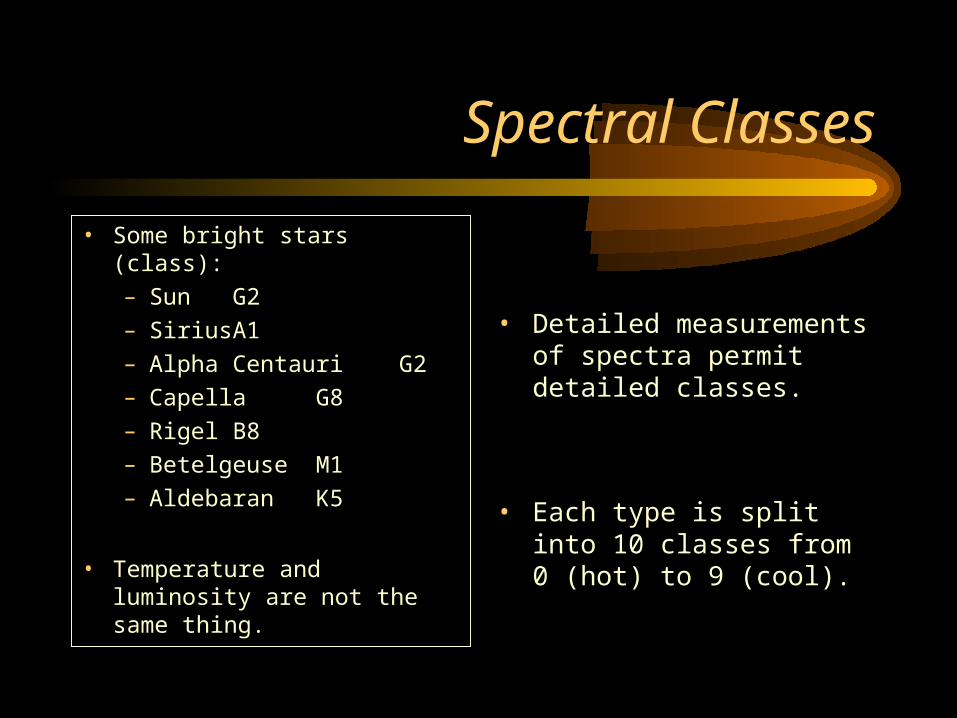
• Some bright stars (class):– Sun G2– Sirius A1– Alpha Centauri G2– Capella G8– Rigel B8– Betelgeuse M1– Aldebaran
K5
• Temperature and luminosity are not the same thing.
• Detailed measurements of spectra permit detailed classes.
• Each type is split into 10 classes from 0 (hot) to 9 (cool).
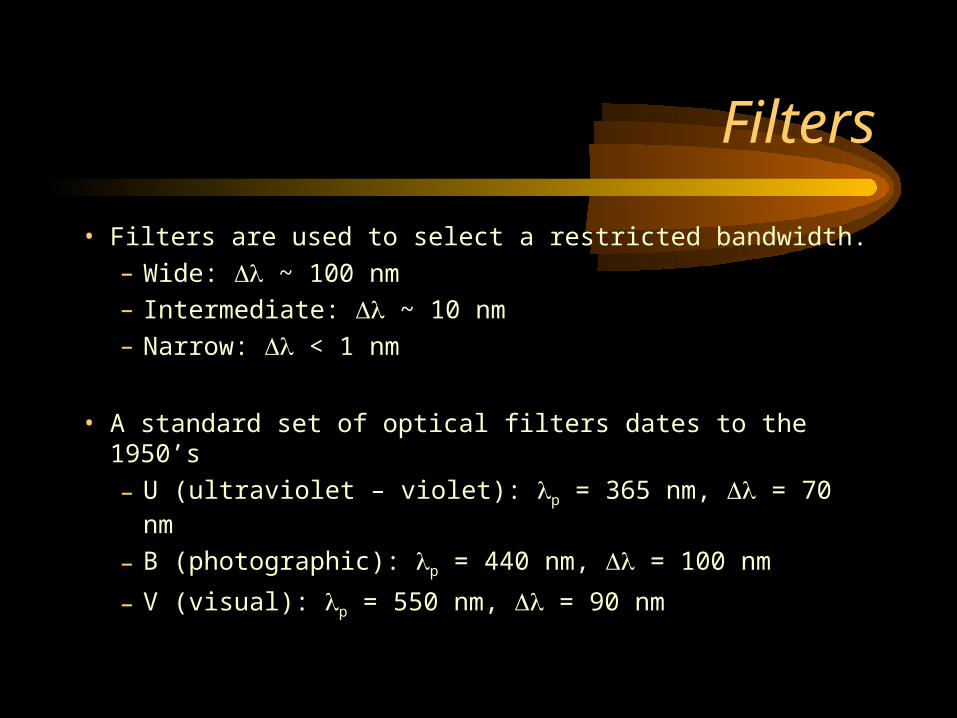
Filters
• Filters are used to select a restricted bandwidth.
– Wide: ~ 100 nm
– Intermediate: ~ 10 nm
– Narrow: < 1 nm
• A standard set of optical filters dates to the 1950’s
– U (ultraviolet – violet): p = 365 nm, = 70 nm
– B (photographic): p = 440 nm, = 100 nm
– V (visual): p = 550 nm, = 90 nm
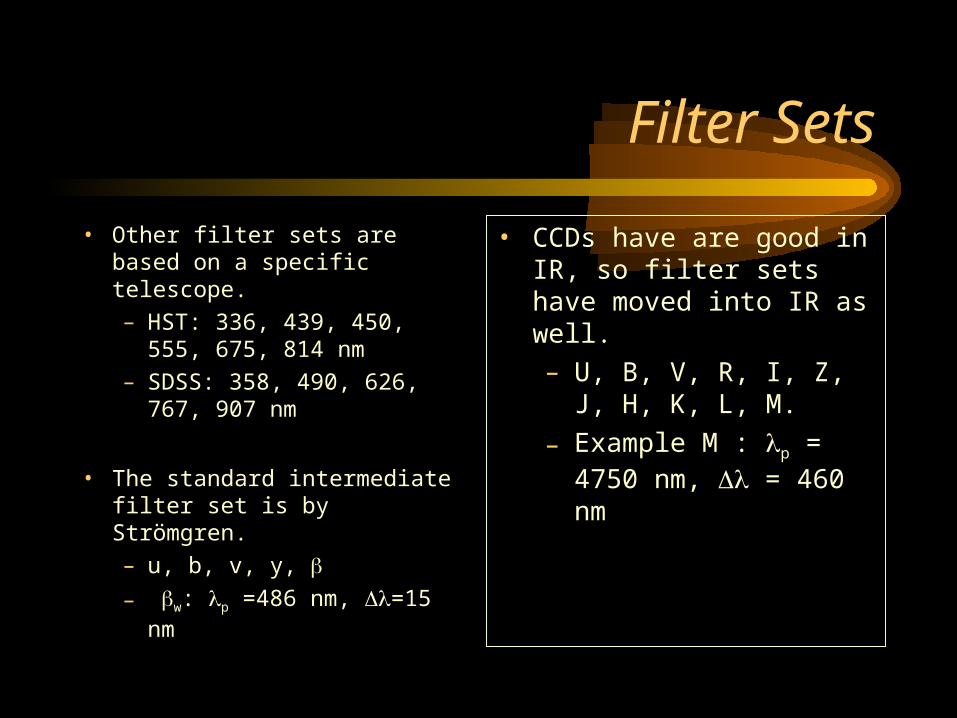
Filter Sets
• Other filter sets are based on a specific telescope.
– HST: 336, 439, 450, 555, 675, 814 nm
– SDSS: 358, 490, 626, 767, 907 nm
• The standard intermediate filter set is by Strömgren.
– u, b, v, y,
– w: p =486 nm, =15 nm
• CCDs have are good in IR, so filter sets have moved into IR as well.
– U, B, V, R, I, Z, J, H, K, L, M.
– Example M : p = 4750 nm, = 460 nm
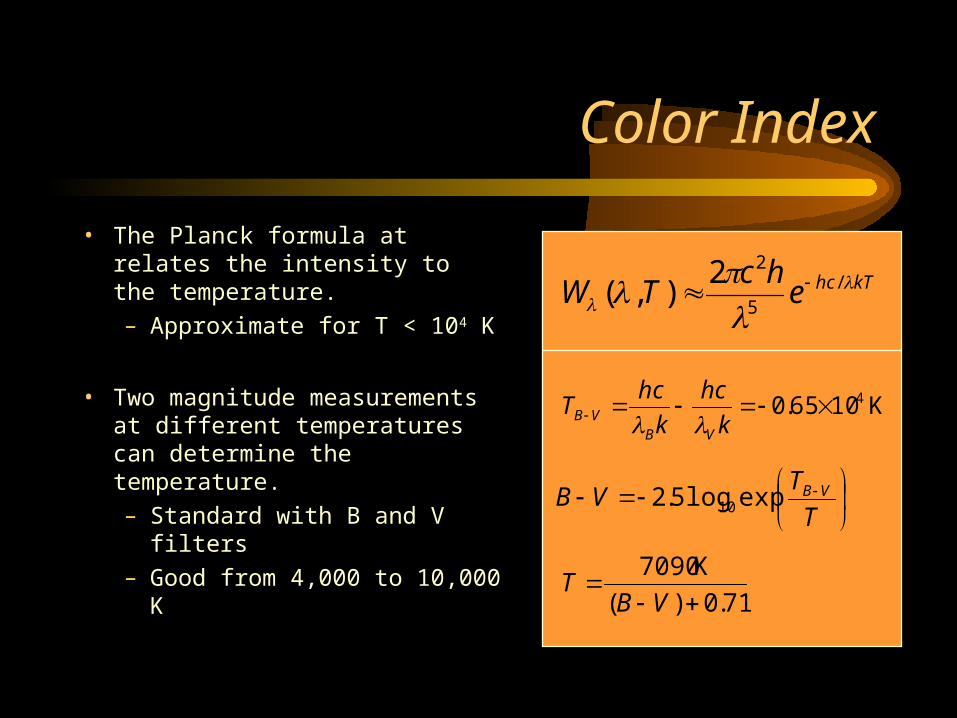
Color Index
• The Planck formula at relates the intensity to the temperature.
– Approximate for T < 104 K
• Two magnitude measurements at different temperatures can determine the temperature.
– Standard with B and V filters
– Good from 4,000 to 10,000 K
kThcehc
TW
/5
22),(
T
TVB VBexplog5.2 10
K1065.0 4 k
hc
k
hcT
VBVB
71.0)(
K7090
VBT
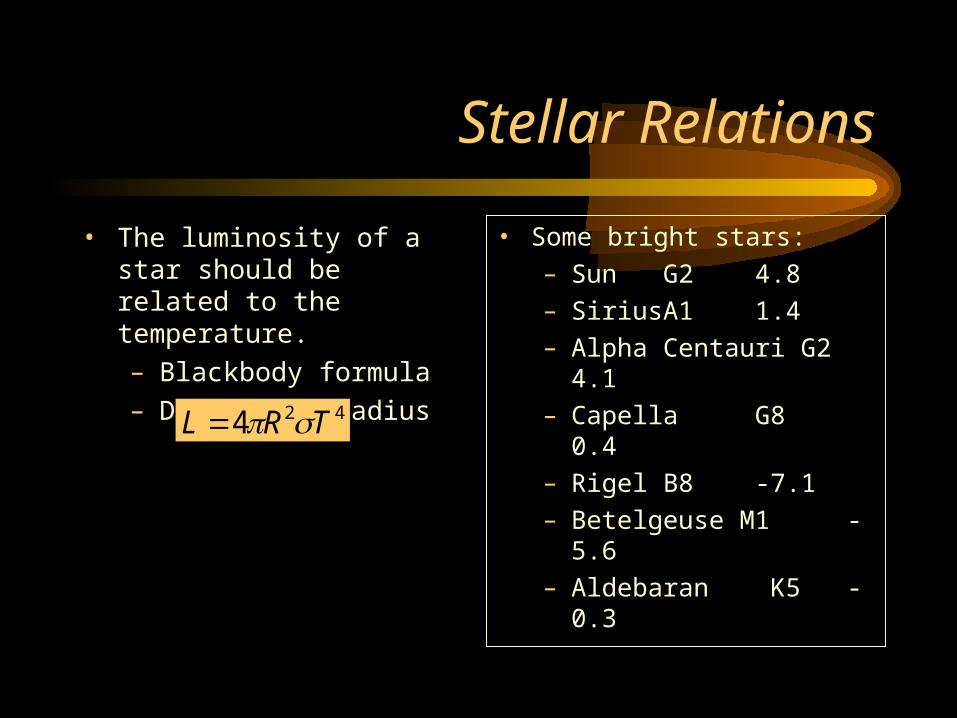
Stellar Relations
• The luminosity of a star should be related to the temperature.
– Blackbody formula
– Depends on radius
• Some bright stars:
– Sun G2 4.8
– Sirius A1 1.4
– Alpha Centauri G24.1
– Capella G8 0.4
– Rigel B8 -7.1
– Betelgeuse M1 -5.6
– Aldebaran K5 -0.3
424 TRL
Luminosity vs. Temperature
• Most stars show a relationship between temperature and luminosity.
– Absolute magnitude can replace luminosity.
– Spectral type/class can replace temperature.
-20
-15
-10
-5
0
5
10
15
20
Abs. M
agnitude
O B A F G K MSpectral Type
Sun
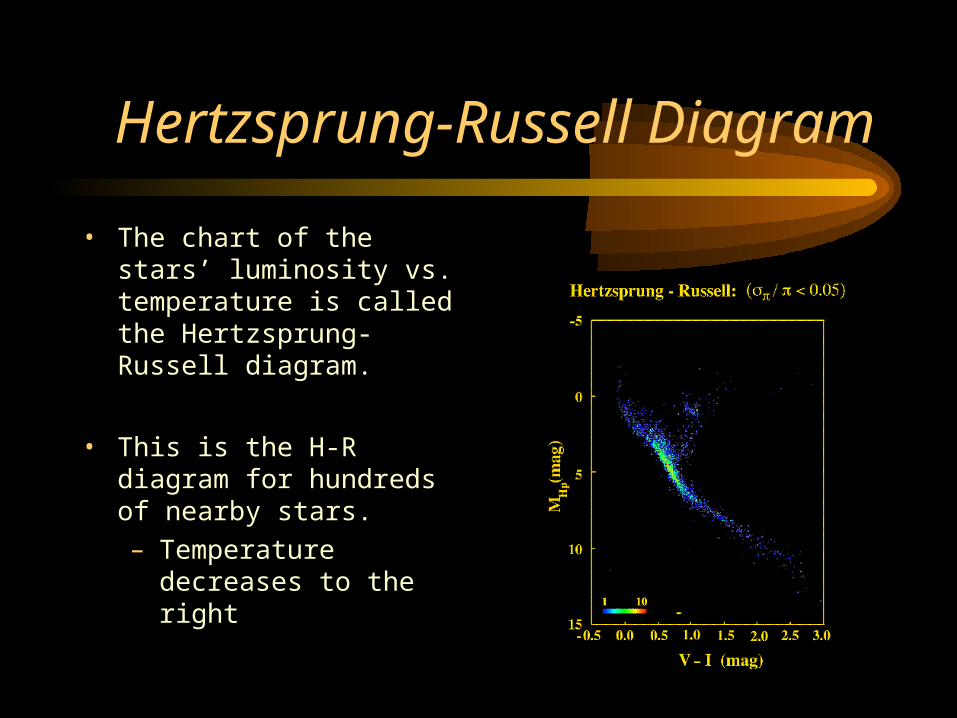
Hertzsprung-Russell Diagram
• The chart of the stars’ luminosity vs. temperature is called the Hertzsprung-Russell diagram.
• This is the H-R diagram for hundreds of nearby stars.
– Temperature decreases to the right
Main Sequence
• Most stars are on a line called the main sequence.
• The size is related to temperature and luminosity:
– hot = large radius
– medium = medium radius
– cool = small radius
-20
-15
-10
-5
0
5
10
15
20
Abs. M
agnitude
O B A F G K MSpectral Type
1 solar radius
Sirius
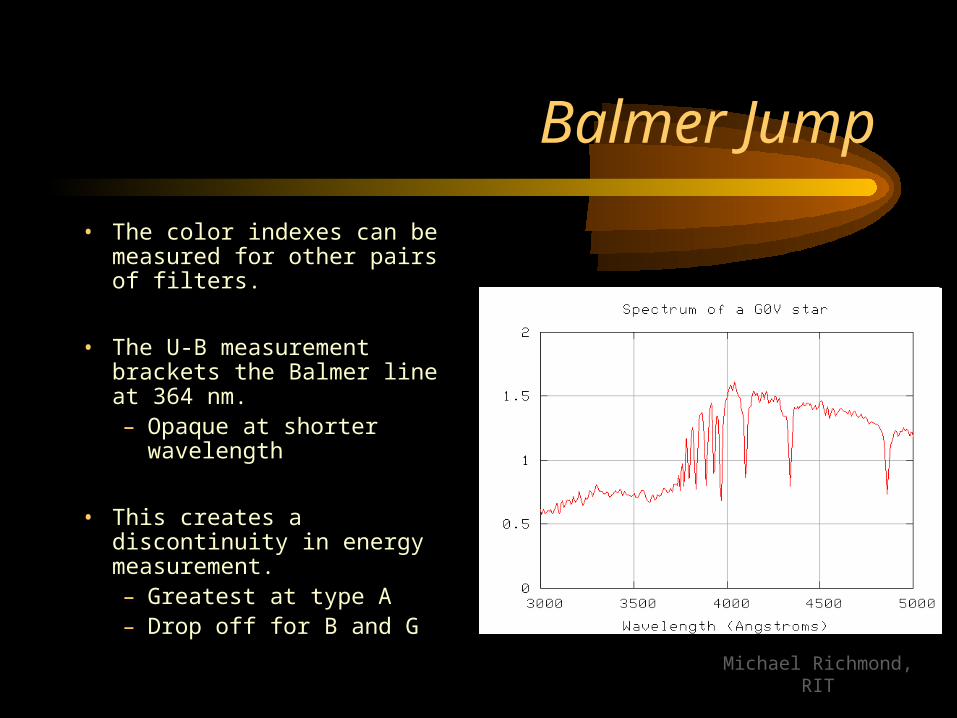
Balmer Jump
• The color indexes can be measured for other pairs of filters.
• The U-B measurement brackets the Balmer line at 364 nm.– Opaque at shorter
wavelength
• This creates a discontinuity in energy measurement.– Greatest at type A– Drop off for B and G
Michael Richmond, RIT
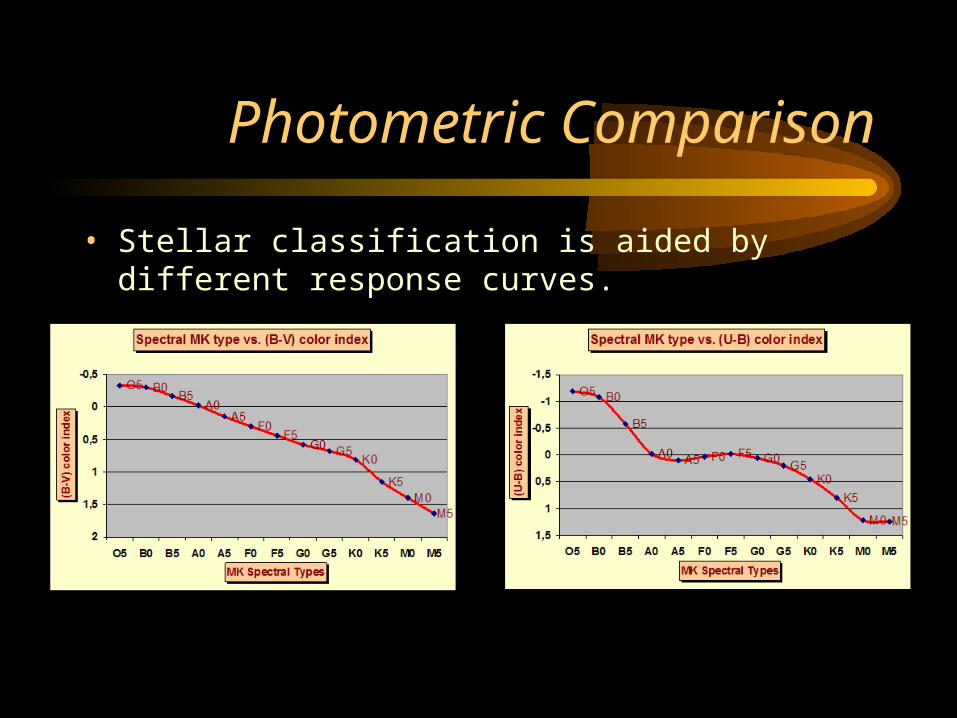
Photometric Comparison
• Stellar classification is aided by different response curves.
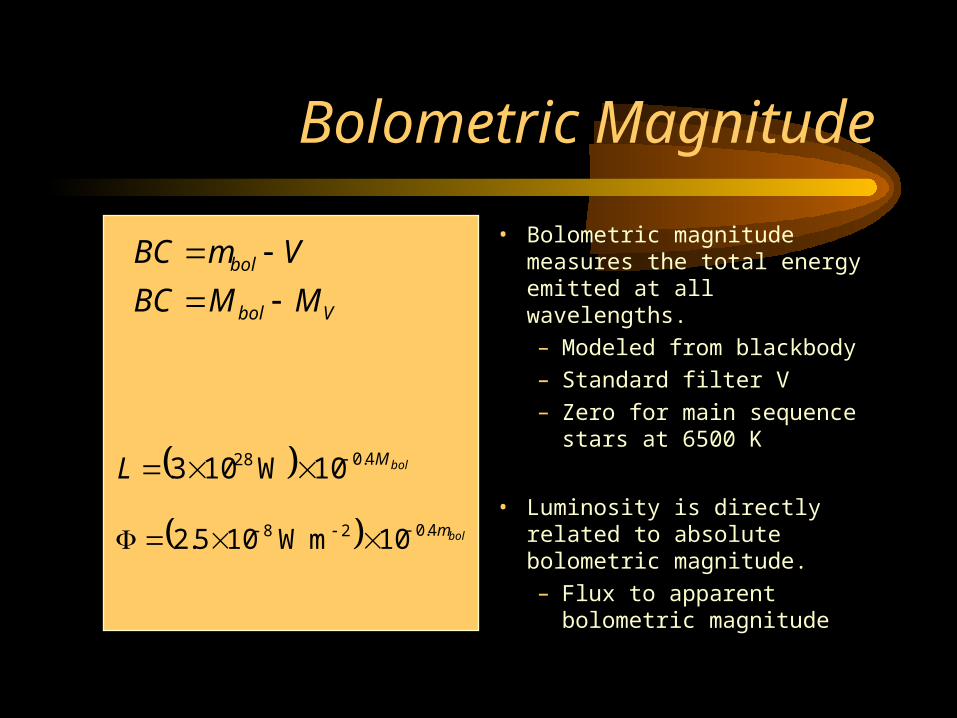
Bolometric Magnitude
• Bolometric magnitude measures the total energy emitted at all wavelengths.
– Modeled from blackbody
– Standard filter V
– Zero for main sequence stars at 6500 K
• Luminosity is directly related to absolute bolometric magnitude.
– Flux to apparent bolometric magnitude
Vbol
bol
MMBC
VmBC
bolML 4.028 10W103
bolm4.028 10mW105.2


