
1
PHYSICOCHEMICAL AND
TOXICOLOGICAL ASSESSMENT OF THE
SEMI-VOLATILE AND NON-VOLATILE
FRACTIONS OF PM FROM HEAVY- DUTY
VEHICLES OPERATING WITH AND
WITHOUT EMISSIONS CONTROL
TECHNOLOGIES Final report
Professor Constantinos Sioutas, Sc.D.
5/2/2011
2
Table of Contents
List of Figures ............................................................................................................................................. 4
List of Tables ................................................................................................................................................. 5
Abstract ......................................................................................................................................................... 6
1. Executive Summary ............................................................................................................................... 7
1.1 Background ........................................................................................................................... 7
1.2 Methods ................................................................................................................................ 7
1.3 Results ................................................................................................................................... 7
1.4 Conclusions ........................................................................................................................... 8
2. Introduction ........................................................................................................................................ 10
2.1 Statement of Significance ................................................................................................... 10
2.2 Background ......................................................................................................................... 11
2.3 Study Objectives.................................................................................................................. 12
2.4 Major Components of the Study ......................................................................................... 12
3. Experimental Methods........................................................................................................................ 14
3.1 Dynamometer Setup ........................................................................................................... 14
3.2 Vehicles ............................................................................................................................... 15
3.3 Equipment and Instruments ............................................................................................... 17
4. Physical Characteristics of the Exhaust Particles (Semi-volatile and Non-volatile) from Retrofitted
Vehicles ....................................................................................................................................................... 19
4.1 Introduction ........................................................................................................................ 19
4.2 Data Reduction .................................................................................................................... 19
4.3 Results ................................................................................................................................. 21
4.4 Conclusions ......................................................................................................................... 32
5. Chemical Characteristics of Exhaust Particles from Retrofitted Vehicles ........................................... 34
5.1 Introduction ........................................................................................................................ 34
5.2 Sample Analysis ................................................................................................................... 34
5.3 Results ................................................................................................................................. 35
5.4 Conclusions ......................................................................................................................... 50
6. Toxicological Characteristics of Semi-volatile and Non-volatile Fraction of DEPs from Retrofitted
Vehicles ....................................................................................................................................................... 51

3
6.1 Introduction ........................................................................................................................ 51
6.2 Sample Analysis ................................................................................................................... 52
6.3 Results ................................................................................................................................. 53
6.4 Conclusions ......................................................................................................................... 63
7. List of Publications from this Study ..................................................................................................... 64
8. Major Conclusions ............................................................................................................................... 65
9. Acknowledgments ............................................................................................................................... 66
10. References ...................................................................................................................................... 67

4
List of Figures
Figure 3-1 Dynamometer set-up ................................................................................................................. 15
Figure 4-1 Particle number size distributions ............................................................................................. 23
Figure 4-2 Number (DMS) and mass emission factors (nano-MOUDI). ...................................................... 27
Figure 4-3 Reduced Variable 1 (R): Ratio of total particle to solid or thermo-denuded particle count. .... 28
Figure 4-4 Size distribution of thermo denuded aerosols for cruise mode. ............................................... 29
Figure 4-5 Mass fractions remaining at different thermodenuder temperature settings. ........................ 29
Figure 4-6 Reduced Variable 2: Surface rated diameter. ............................................................................ 30
Figure 4-7 Time series of surface diameter (Ds), surface concentration (EAD signal and total particle
concentration (DMS count) for a) DPX; b) Baseline- UDDS run. ................................................................. 31
Figure 4-8 Reduced Variable 3: Mass specific surface concentration. ....................................................... 32
Figure 5-1 Emission factors of integrated chemical species measured by MOUDI-NanoMOUDI. a). Cruise
50 mph b). Transient UDDS. ........................................................................................................................ 36
Figure 5-2 EC, WSOC and WIOC emission rates at a) Cruise 50mph and b) Transient UDDS c) Proportion
of WSOC to OC. ........................................................................................................................................... 38
Figure 5-3 (a) Emission factors of PAHs, hopanes and steranes of baseline and control device-equipped
vehicles in UDDS cycle. (b) Emission factors of n-alkanes and acids of baseline and control device-
equipped vehicles in UDDS cycle. ............................................................................................................... 40
Figure 5-4 (a) Emission factors of PAHs, hopanes and steranes of baseline and control device-equipped
vehicles in cruise cycle. (b) Emission factors of n-alkanes and acids of baseline and control device-
equipped vehicles in cruise cycle. ............................................................................................................... 42
Figure 5-5 Comparison of the ratios of PAHs, hopanes and steranes to organic carbon emission factors in
μg/g from baseline and controlled vehicles. (a) running on UDDS cycle. (b) cruise cycle. (c) Ratios of
PAHs, hopanes and steranes to organic carbon emission factors in μg/g as reported by Riddle et al.,
(2007) .......................................................................................................................................................... 44
Figure 5-6 Emission rates of size-resolved PM chemical species. a) Cruise 50 mph, b) Transient UDDS c)
Baseline vehicle. .......................................................................................................................................... 46
Figure 5-7 a, b: Size-resolved EC/OC mass distribution at a) Cruise mode b) UDDS mode. ....................... 49
Figure 6-1 a, b, c: DTT consumption in n-moles min-1 μg-1 of PM of thermo-denuded and undenuded
PM. .............................................................................................................................................................. 55
Figure 6-2 Relationship between oxidative activity and semi-volatile PM fraction at 150◦C..................... 56
Figure 6-3a,b,c: DTT consumption per unit distance ( in n-moles min-1 km-1) traveled by vehicles for
Cruise and UDDS cycles and per hour( in n-moles min-1 hr-1) for Idle. ..................................................... 58
Figure 6-4 Reactive Oxygen Species (ROS) activity of PM from the tested vehicles, expressed as (a) per
mass of PM, and (b) per km (or hr for idle) of vehicle driven. .................................................................... 59
Figure 6-5 Percent removal of ROS activity in relation to that of aggregate water soluble metals after
Chelex treatment of the exhaust PM samples from test vehicle-configurations under different driving
cycles. .......................................................................................................................................................... 60

5
List of Tables
Table 3-1 Details of test fleet ........................................................................................................................ 9
Table 4-1 Size fractionated mass EFs (mg km -1 for Cruise and UDDS, mg hr-1 for Idle) ........................... 26
Table 6-1 Correlation coefficient (R) and significance level (P) for DTT activity and selected chemical
species ......................................................................................................................................................... 61
Table 6-2 Correlation coefficients and associated levels of significance for the regression between ROS
activity and major water-soluble metals of PM .......................................................................................... 62

6
Abstract
This final report presents the investigation results of the CARB vehicle emissions study, with focus on the
physicochemical and toxicological properties of the semi-volatile and non-volatile fractions of PM from
heavy duty diesel vehicles, operating with and without emissions control technologies. A wide variety of
diesel fuelled vehicles, representing the current in-use fleet, have been tested in the California Air
Resources Board’s (CARB) heavy-duty diesel emission testing laboratory (HDETL) in downtown Los
Angeles, including a 1998 Kenworth truck, a diesel hybrid electric bus, a school bus, and a Caltrans truck
on three driving cycles, i.e. steady state cruise (50mph), transient [EPA urban dynamometer driving
schedule (UDDS)] and idle to simulate various real-world driving conditions. The tested emission control
devices include a Continuously Regenerating Technology (CRT); CRT in combination with a selective
catalytic reduction system (Zeolite or vanadium based SCRTs) etc. Detailed physico-chemical and
toxicological characteristics of PM were measured for each vehicle and driving cycle, including physical
properties (e.g. PM mass and size distribution), chemical (EC, OC, organic compounds, trace elements,
inorganic ions) and toxicological [dithiothreitol (DTT) and macrophage reactive oxygen species (ROS)
assays] characterization of the collected PM samples.
Substantial reduction in PM mass emissions (>90%) was accomplished for the tested vehicles
operating with advanced emission control technologies, while such a reduction was not observed for
particle number concentrations under cruise conditions, with the exceptions of the Hybrid-CCRT and EPF
vehicles. Significant reductions in the emission of major chemical constituents (TC, OC, EC, and organic
compounds) were achieved by the introduction of retrofits. Sulfate dominated the PM composition in
vehicle configurations (V-SCRT-UDDS, Z-SCRT-Cruise, CRT, DPX) with considerable nucleation mode and
total carbon was dominant for the configurations with less (ZSCRT-UDDS) or insignificant (CCRT, Horizon)
nucleation. V-SCRT and Z-SCRT effectively reduced PAHs, hopanes and steranes, n-alkanes and acids by
more than 99%, and often to levels below detection limits for both cruise and UDDS cycles. The CRT
technology also showed similar reductions with SCRT for medium and high molecular weight PAHs,
acids, but with slightly lower removal efficiencies for other organic compounds. Despite an increase in
the intrinsic activity (both DTT and ROS, per mass basis) of exhaust PM with use of most control
technologies, the overall activity (expressed per km or per hr) was substantially reduced for retrofitted
configurations compared to the baseline vehicle. Significant reduction in DTT activity (by 50-100%) was
observed for thermally-denuded PM from vehicles with retrofitted technologies (PM with significant
semi-volatile fraction). On the other hand, Chelex treatment of PM samples removed a substantial (≥70
%) fraction of the ROS activity, corroborating the effect of transition metals on this activity. Correlation
analysis performed between measured activity and the chemical constituents showed that DTT activity
is strongly associated (R=0.94) with the water soluble organic carbon (WSOC), while the ROS activity was
mostly driven by Fe content of the PM samples.

7
1. Executive Summary
1.1 Background The objective of this project was to enhance a planned ARB vehicle emissions study with the research
component to determine the physicochemical and toxicological properties of particulate matter (PM)
from heavy duty vehicles operating with and without emissions control technologies. The key objective
of this comprehensive 4-year project was to determine the physicochemical and toxicological properties
of the semi-volatile and non-volatile fractions of PM from heavy duty diesel vehicles operating with and
without emissions control technologies.
1.2 Methods In this study, we assessed the PM-related oxidative activity from a wide variety of vehicles to
represent the in-use fleet, including diesel vehicles with and without advanced PM emission control
technologies. We investigated different driving cycles, since engine operation is known to affect the
concentration, relative amounts and chemical composition of the nucleation and accumulation PM
modes emitted. Experiments were carried out at the California Air Resources Board’s (CARB) heavy-duty
diesel emission testing laboratory (HDETL) in downtown Los Angeles. Ayala et al., (2002) described the
dynamometer specifications in details. Three driving cycles, i.e. steady state cruise (50mph), transient
[EPA urban dynamometer driving schedule (UDDS)] and idle were tested to simulate various real-world
driving conditions. The fuel used to run the engines was CARB ultra-low sulfur diesel (ULSD) with sulfur
content less than 15 ppm. Tunnel blank levels were measured and vehicles were conditioned (warmed
up) every day before the start of official runs. The CVS was cleaned prior to starting the project. The test
fleet comprised of four heavy-duty diesel vehicles in seven configurations. A 1998 Kenworth truck
served as a baseline vehicle, without any emission control technology. The same Kenworth truck was
also tested with three different control technologies: a Continuously Regenerating Technology [CRT],
consisting of a diesel oxidation catalyst (DOC) followed by an uncatalyzed trap; CRT in combination with
a selective catalytic reduction system [Zeolite or vanadium based SCRTs]. The other three test vehicles
were a diesel hybrid electric bus, a school bus, and a Caltrans truck. Detailed physico-chemical and
toxicological characteristics of PM were measured for each vehicle and driving cycle, including physical
properties (e.g. PM mass and size distribution), chemical (EC, OC, organic compounds, trace elements,
inorganic ions) and toxicological [dithiothreitol (DTT) and macrophage reactive oxygen species (ROS)
assays] characterization of the collected PM samples.
1.3 Results Substantial reduction in PM mass emissions (>90%) was accomplished for the HDDV operating with
advanced emission control technologies. This reduction was not observed for particle number
concentrations under cruise conditions, with the exceptions of the Hybrid-CCRT and EPF vehicles, which
were efficient in controlling both - mass and number emissions. In general, significant nucleation mode
particles (<50nm) were formed during cruise cycles in comparison with the UDDS cycles, which emit
higher PM mass in the accumulation mode. The nucleation mode particles (<50nm) were mainly
internally mixed, and evaporated considerably between 150 to 230oC.
Significant reductions in the emission of major chemical constituents (TC, OC, EC, and organic
compounds) were achieved by the introduction of retrofits. V-SCRT and Z-SCRT effectively reduced
PAHs, hopanes and steranes, n-alkanes and acids by more than 99%, and often to levels below detection

8
limits for both cruise and UDDS cycles. The CRT technology also showed similar reductions with SCRT for
medium and high molecular weight PAHs, acids, but with slightly lower removal efficiencies for other
organic compounds. Sulfate dominated the PM composition in vehicle configurations (V-SCRT-UDDS, Z-
SCRT-Cruise, CRT, DPX) with considerable nucleation mode and TC was dominant for the configurations
with less (ZSCRT-UDDS) or insignificant (CCRT, Horizon) nucleation.
Despite an increase in the intrinsic activity (both DTT and ROS, per PM mass basis) of exhaust PM with
use of most control technologies, the overall activity (expressed per km or per hr) was substantially
reduced for retrofitted configurations compared to the baseline vehicle. Significant reduction in DTT
activity (by 50-100%) was observed for thermally-denuded PM from vehicles with retrofitted
technologies (PM with significant semi-volatile fraction). On the other hand, Chelex treatment of
undenuded PM samples removed a substantial (≥70 %) fraction of the ROS activity. Correlation analysis
performed between measured activity and the chemical constituents showed that DTT activity is
strongly associated (R=0.94) with the water soluble organic carbon (WSOC), while the ROS activity was
mostly driven by the Fe content of the PM samples.
1.4 Conclusions The newer diesel engines with emission control devices are very efficient in reducing the mass emission
of particulate matter. However, enhanced formation of nucleation mode particles is observed in the
exhausts of some retrofitted configurations. The vast majority of these nucleation mode particles are
semi-volatile in nature.
The total emissions (per distance of vehicle traveled) of the major chemical species (e.g. elemental and
organic carbon) are substantially reduced in the retrofitted vehicles compared to the baseline vehicle.
However, sulfate emissions increase for the configurations with enhanced nucleation mode particles in
their exhaust. Although the retrofitted vehicles emit less water soluble organic carbon (WSOC) per mile
of vehicle driven, the per PM mass water soluble fraction of the organic carbon (WSOC/OC) is increased
for most configurations.
With the introduction of control devices, the individual ratios of speciated organic compounds to OC are
reduced significantly for PAHs, while the reduction was more modest for hopanes and steranes,
implying that fuel and lubricating oil have substantially different contributions to the OC emitted by
vehicles operating with control devices compared to the baseline vehicle. We hypothesize that PAHs can
form in combustion processes and/or originate from diesel fuel, whereas hopanes and steranes come
from lubricating oils.
Despite an increase in the intrinsic oxidative activity (both DTT and ROS, per mass basis) of exhaust PM
with the use of control technologies for most configurations, the overall activity (expressed per km or
per hr) was substantially reduced for retrofitted configurations compared to the baseline vehicle.
The semi-volatile fraction of the exhaust particles was observed to be highly oxidative in nature as
demonstrated by a significant reduction in DTT activity (by 50-100%) observed for thermally-denuded
PM. However, non-volatile species - particularly transition metals, are also responsible in cellular
oxidative stress, as indicated by a substantial removal (≥70 %) of the ROS activity after Chelex treatment
of the PM samples.
An important caveat of the toxicological findings of this study is that they are all based on molecular or
cellular assays that examine the toxicity of the PM suspension collected from a given vehicle and driving

9
configuration based on bulk PM mass. By their nature and design, these investigations did not take into
account important parameters determining the toxicity and overall health effects attributable to the
inhalation of an aerosol, such as particle size. The substantial reduction in the overall particle size
distribution of newer vehicles creates an aerosol with a much higher lung deposition fraction than the
baseline vehicle, and with considerably different toxicokinetics inside the human body once inhaled.
Such important investigations can only be addressed by in vivo inhalation exposure studies to these
aerosols, whether using animal models or human volunteers (or both), and are greatly needed in order
to provide a more complete perspective to the results of this study.

10
2. Introduction
2.1 Statement of Significance
This study addresses the well-publicized and significant effects of particulate matter (PM) emissions
from heavy-duty diesel vehicles on health and the environment. Although PM originating from these
sources is known to be responsible for a myriad of adverse health outcomes, ranging from cancer to
cardiopulmonary disease, and environmental problems, ranging from global warming to acid rain, the
fields of combustion, atmospheric science, and public health are sufficiently separated that a unified
plan of action is presently not feasible. Epidemiological and toxicological studies have demonstrated
strong links between ambient particulate matter mass exposure and adverse health outcomes (NRC,
2004). However, it is not clear which physical or chemical properties of particulate matter (PM) pose the
greatest health risk.
The objective of this project was to enhance a planned ARB vehicle emissions study with the research
component to determine the physicochemical and toxicological properties of particulate matter (PM)
from heavy duty vehicles operating with and without emissions control technologies. Heavy-duty diesel
trucks constitute only a small fraction of the total fleet in California but have an important contribution
to the emissions of fine and ultrafine particles. The outcomes of this study will be very helpful in
assessing the health consequences of population exposure to diesel traffic sources in Los Angeles, where
on average individuals spend 2-3 hours per day commuting in heavily congested freeways. The Los
Angeles Basin (LAB) is home to more than 15 million individuals and it has been described as the most
polluted airshed in the US, with a complex, persistent and unique PM pollution problem. Despite
considerable improvements in air quality over the past two decades, Los Angeles continues to exhibit
the most severe ozone and PM air quality problem in the U.S. because of the continuing increase in
population and traffic. The LAB covers approximately 12,000 square miles and this region has
experienced faster population growth than the rest of the nation since World War II. Growth is
expected to increase significantly towards the end of the century and through 2020. The population is
expected to increase 1.5 times by the year 2020 from 1990 levels. By 2020 the south coast air basin is
expected to have a population of 21,000,000 as compared to 3,800,000 in 1950. The region has tens of
thousands of heavy duty trucks transporting goods from the LA Harbor (the busiest in the US) to the rest
of the US, all putting primary particles and reactive gases that act as particle precursors into the
atmosphere.
The topography and climate of the LAB are some of the reasons for this area having high air pollution
potential. Several air quality studies including our own, have shown that the LAB is known for distinct
areas of different meteorological conditions (microclimates), which result in enormous spatial variations
of PM, including species of toxicological interest, i.e., organic and elemental carbon, (OC, EC), nitrate,
metals, polycyclic aromatic hydrocarbons (PAH) and gaseous co-pollutants. This is in contrast to
metropolitan areas of the eastern US, where a large fraction of PM pollution is regional, and in which
PM2.5 and their components are more uniformly distributed.

11
A major objective of this comprehensive 4-year project was to determine the physicochemical and
toxicological properties of the semi-volatile and non-volatile fractions of PM from heavy duty diesel
vehicles operating with and without emissions control technologies. With the exception of uncontrolled
diesel, the majority of PM emitted by these vehicles is semi volatile in nature, formed by condensation
of super saturated vapors as they cool in the ambient atmosphere. Measurements of the relative
toxicity of these particles compared to the more refractory (non volatile “accumulation” mode) PM are
valuable in terms of assessing the need for additional control strategies.
As part of this study, we assessed the PM-related oxidative activity from a wide variety of vehicles to
represent the in-use fleet, including diesel vehicles with and without advanced PM emission control
technologies. We investigated different driving cycles, since engine operation is known to affect the
concentration, relative amounts and chemical composition of the nucleation and accumulation PM
modes emitted. This study highlights the need of promulgating effective vehicular emission control
strategies aiming at reducing public risk in terms of acute as well as chronic health outcomes.
The semi-volatile PM fraction of vehicle emissions is extremely important in terms of its contribution
to human exposure. Current emission control technologies remove effectively the non-volatile fraction,
but are less effective at controlling the volatile fraction. Removal of the non-volatile PM fraction can
increase the concentration of the volatile aerosol fraction by enhancing nucleation of condensing
organic vapors (Bagley et al., 1998; Kittelson, 1998). Knowing how the toxicity of vehicular PM varies
with particle component volatility will be vital in directing the design of emission control technologies
that will be more effective in protecting the public health. The discussion on the treatment of the solid
(refractory) and semi-volatile fractions in emission tests is still ongoing. While it is becoming obvious
that the PM mass measurement alone is no longer adequate for emissions certification, the best
alternative is still under discussion. The recommendation by European Union (EU) is to measure the
number concentration of solid particles in addition to mass, maintaining the test cycles and the primary
dilution system (CVS full exhaust flow tunnel) used now. EU claims that “this is a pragmatic approach,
which allows a fast realization” (Burtscher, 2005). The unequivocal demonstration of the significant
toxicity of the semi-volatile nucleation PM mode from heavy duty engines in this study raises significant
concerns on the validity, effectiveness and overall wisdom of such a standard. The research described in
this study generates invaluable information to the CARB, who is responsible for developing statewide
strategies to reduce the emission of smog-forming pollutants and toxics by mobile sources.
2.2 Background
Measurements of particle emissions from motor vehicles have been accomplished via dynamometer
source testing (Chase et al., 2000; Kwon et al., 2003; Sakurai et al., 2003a; Sakurai et al., 2003b; Schauer
et al., 1999; Schauer et al., 2002), roadway tunnel sampling (Fraser et al., 1998), on-road chase
experiments (Shah et al., 2004a; Vogt et al., 2003) and roadside measurements (Harrison et al., 2003;
Sturm et al., 2003; Zhu et al., 2002a; Zhu et al., 2004; Zhu et al., 2002b). In general, particles directly
emitted from diesel engines are in the size range from 20 nm to 130 nm in aerodynamic diameter for
(Morawska et al., 1998). Many of the organic chemical constituents of these particles are semi-volatile,
existing simultaneously in the gas and particle phases at equilibrium (Schauer et al., 1999; Schauer et al.,
2002). Changes in ambient temperature and gas phase concentrations of these components can affect
the measured particle size distributions due to evaporation or condensation. It has been shown that the
particle size distributions determined by dynamometer testing are dependent on the dilution ratios and
12
dilution air conditions of the sampling apparatus (Holmen and Qu, 2004; Lyyranen et al., 2004;
Vaaraslahti et al., 2004).
Recent emissions testing in either dynamometer or on-road testing facilities have shown that
particles emitted from these diesel vehicles are externally mixed, i.e. different particles of the same size
can have different chemical compositions. Depending on vehicle type, age and ambient conditions,
between 70-90% of the particles by number and 10-30% by mass may consist of more volatile material
than others (known as semi-volatile), and partially or completely evaporate upon heating (Sakurai et al.,
2003b).
These results were further corroborated by the modeling study of Zhang et al., (2004), as well as the
experimental field studies of Kuhn et al., (2005b), who demonstrated that condensation, evaporation,
and dilution were the major factors affecting aerosol size distributions in the first 250 m downwind from
freeways. The high concentrations of particle numbers in the proximity of freeways raise concerns for
population exposure during commute. The particle volatility, which causes the dynamically shifting size
distributions of these freshly emitted particles, needs to be better characterized to accurately assess
population exposure to the physical and chemical properties of PM. For example, the volatility of these
particles explains the more rapid decay in their concentration with respect to distance from a roadway,
compared to that of non-labile PM species (such as EC) or gaseous co-pollutants such as CO and NOx,
the concentration decrease of which would be affected mostly by atmospheric dilution. The increased
dilution with distance to roadway decreases the concentration of vapors in equilibrium with these
particles, which enhances evaporation of these vapors from the particle phase to re-establish
equilibrium (Zhang et al., 2004). The exposure and health implications of these findings have not yet
been investigated. Considering that the majority of people’s exposure during commute will be
dominated (at least based on particle numbers) by these particles, it would be useful to know whether
the non-volatile or semi-volatile material is more toxic.
2.3 Study Objectives
The main goal of this research is to provide information on the physico-chemical characteristics as
well as relative toxicity of semi-volatile fraction of the diesel exhaust particles compared to the larger,
non-volatile (refractory), mostly carbonaceous fraction, collected from a variety of different engines,
each operating under different driving conditions in dynamometer facilities. CARB plans an extensive
emissions research program at its heavy-duty emissions laboratories and our study complements and
enhances CARB’s research efforts and leverages the significant capacity offered by our group. This was a
collaborative study led by the Research Division of the California Air Resources Board and the Aerosol
Laboratory of the University of Southern California with support from University of California Los
Angeles (UCLA) and University of Wisconsin Madison (UWM) for chemical and toxicological analysis.
2.4 Major Components of the Study
The major components of this study can be summarized as below:
1) Conduct dynamometer experiments to collect the total and size fractionated diesel exhaust particles
on appropriate substrates for physical, chemical and toxicological analysis, along with real-time data
collection (particle number concentration and size distribution)

13
2) Conduct the physical (e.g. PM mass and size distribution), chemical (EC, OC, organic compounds,
trace elements, inorganic ions) and toxicological [dithiothreitol (DTT) and macrophage reactive
oxygen species (ROS) assays] characterization of the collected PM samples.
3) Conduct data analysis, and prepare manuscripts for publication in the peer-reviewed literature.
4) Prepare quarterly progress reports for CARB.
5) Prepare and submit the final report to CARB at the end of the project.

14
3. Experimental Methods
3.1 Dynamometer Setup
Experiments were carried out at the California Air Resources Board’s (CARB) heavy-duty diesel
emission testing laboratory (HDETL) in downtown Los Angeles. Ayala et al., (2002) described the
dynamometer specifications in details. Figure 3.1 shows the schematic of the experimental setup. The
sampling train includes heavy-duty chassis dynamometer, constant volume sampling (CVS) dilution
tunnel and aerosol samplers. Diesel vehicle exhausts were transported by a stainless steel hose pipe and
diluted with filtered air through the CVS. Measurements were taken 18 diameter lengths downstream of
the exhaust introduction in the CVS. Three driving cycles, i.e. steady state cruise (50mph), transient [EPA
urban dynamometer driving schedule (UDDS)] and idle were tested to simulate various real-world
driving conditions. The fuel used to run the engines was CARB ultra-low sulfur diesel (ULSD) with sulfur
content less than 15 ppm. Tunnel blank levels were measured and vehicles were conditioned (warmed
up) every day before the start of official runs. The CVS was cleaned prior to starting the project.
The dilution air flow rate at the CVS was 2600 cfm (74 m3min
-1) for cruise and UDDS cycles, and 1600
cfm (45.4 m3min
-1) for the idle, respectively. For EPF and Hybrid-CCRT, the flow rates were maintained at
1600 cfm for all cycles. These flow-rates result in approximate dilution ratios of 6-9 for cruise, 5-80 for
UDDS, and 15-25 for idle.

15
Figure 3-1 Dynamometer set-up
3.2 Vehicles
The test fleet comprised of four heavy-duty diesel vehicles in seven configurations (Table 3.1). A 1998
Kenworth truck served as a baseline vehicle, without any emission control technology. The other three
test vehicles were a diesel hybrid electric bus, a school bus, and a Caltrans truck.
The diesel hybrid electric bus (San Joaquin Valley RTD) is equipped with a catalyzed continuously
regenerative trap, or CCRT, consisting of a diesel oxidation catalyst (DOC) followed by a catalyzed trap,
which was virtually brand-new, with only 1000 miles on the odometer.
The Kenworth truck was tested with three different control technologies: a Continuously
Regenerating Technology [CRT], consisting of a diesel oxidation catalyst (DOC) followed by an
uncatalyzed trap; CRT in combination with a selective catalytic reduction system [Zeolite or vanadium
based SCRTs]. The two SCRT technologies consist of a wall-flow particulate trap (CRT) followed by a SCR
section. The CRT was the same in each configuration. The difference between them lies in the choice of
catalysts (vanadium or Zeolite) for the SCR to control oxides of nitrogen (NOx).
The Caltrans truck, with a smaller engine (7.6 L) than the Kenworth truck (11 L, Table 3.1), is
retrofitted with an Engelhard DPX filter. The DPX filter is comprised of a diesel particulate trap with a
catalytic wash-coat.

16
The last test vehicle was an Elk Grove school bus, equipped with an electric particle filter (EPF-
Horizon). The EPF consists of a non-catalyzed silicon carbide substrate for PM control, coupled with an
electric heating element and a small blower. The trap is regenerated periodically using electricity from
the grid (plug in configuration) during non-operational periods—mostly at night.
Hereafter, the test fleet is referred as baseline, CRT, V-SCRT, Z-SCRT, DPX, hybrid/CCRT and School
Bus/Horizon/EPF.

9
Table 3-1 Details of test fleet
Vehicle Engine After treatment (AT)
Dilution
Make
Nomenclature Year Miles
Curb
Weight
(lb)
GVWR
(lb)
Tested
Wt (lb) Model
Size
[L] Type Miles on AT
Approximate
Dilution Ratio in
CVS
Kenworth
V-SCRT
1998 360000 26,640
80,000
53,320
Cummins
M11,
reflashed 11
Vanadium
based SCRT 50,000
9.2 Cruise 6-
30 UDDS 14
Idle
Kenworth
Z-SCRT
1998 360000 26,640
80,000
53,320
Cummins
M11,
reflashed 11
Zeolite
based SCRT
0 on SCR,
50,000 on
CRT
9.2 Cruise 6-
30 UDDS 14
Idle
International
DPX
1999 40,000 15,030 27,500
20,920
International
DT466E 7.6
Engelhard
DPX 30,000
6.2 Cruise 5-
25 UDDS 22
Idle
Gillig (35ft)
with Alison
Hybrid
Hybrid/CCRT
2007 1000 NA NA NA Cummins 5.9 CCRT 1000
5-50 UDDS
Thompson-
School Bus
School
Bus/EPF/Horizon
1988 325000 NA NA NA Cummins 5.9
Cleaire -
Horizon 32,000
8.3 Cruise 8-
80 UDDS 25
Idle
Kenworth
CRT
1998 NA 26,640
80,000
53,320
Cummins
M11,
reflashed 11
Continuously
Regenerating
Technology 64,000
9.2 Cruise 6-
30 UDDS 14
Idle
Kenworth
Baseline
1998 374000 26,640
80,000
53,320
Cummins
M11,
reflashed 11 None NA.
9.2 Cruise 6-
30 UDDS 14
Idle

17
3.3 Equipment and Instruments
Specific descriptions of some of the instruments and equipment used for this study are provided
below.
Nano-MOUDI
Size-resolved samples were collected using a micro-orifice uniform deposited impactor (MOUDI)
upstream of a nano-MOUDI (MSP Corporation, Minneapolis, MN) loaded with pre-cleaned aluminum foil
substrates. Particles were classified in the following aerodynamic size ranges: 10-18 nm, 18-32 nm, 32-
56 nm, 56-100 nm, 100-180 nm, 180 nm-2.5 μm and >2.5 μm. The MOUDI-Nano MOUDI tandem was
operated for multiple runs in order to accumulate sufficient mass for chemical analysis for each vehicle
and driving cycle.
DMS/ EEPS
Size distribution of engine exhausts from the CVS was monitored every second by two multiple
channel differential mobility spectrometers: a DMS500 (Cambustion) and an engine exhaust particle
sizer (EEPS 3090, TSI Inc.). Both DMS and EEPS classify particles on the basis of their electrical mobility
diameter. The cut-off size ranges of EEPS and DMS are 5.6-523 nm and 4.5- 1000 nm, respectively. With
high time resolutions, they are both capable of tracking transient particle behavior, especially during
UDDS cycles. With few exceptions (V-SCRT, Z-SCRT only), in which the DMS was placed downstream of
the particle measurement program (PMP) sampler, both instruments were connected directly to CVS.
PMP
A particle measurement program (PMP) protocol was developed in Europe to measure the solid
particle emissions from light duty vehicles. The sampling train of PMP contains a volatile particle
remover (VPR) and a particle counter (>23nm). The VPR provides two stage dilution connected by an
evaporation tube (ET). The temperature for the primary dilution, ET and secondary dilution is 150, 300
and ~35 oC, respectively. Detailed information for the PMP can be seen in Herner et al., (2007a).
Thermodenuder
Particle volatility was determined by two thermodenuders (Model ELA-230, Dekati Ltd) sampling in
parallel, each heating the entering aerosol to 150 and 230 oC, respectively. The thermodenuder consists
of a heating section, followed by an adsorption/cooling unit. As aerosol stream was drawn from the CVS
and passed through the heating tube, part of its volatile/semi-volatile components was sheared off.
These labile species adsorb onto a layer of activated charcoal placed on the walls of the thermodenuder,
leaving the non-volatile PM fraction to be collected on Teflon filters (47mm, PTFE, Gelman) placed
downstream of the thermodenuders. Multiple runs were integrated to achieve desired sample mass
loadings on these filters to perform various chemical and toxicological analyses. Solid particle number
concentrations and size distributions were monitored intermittently by a condensation particle counter
(CPC 3022 A, TSI Inc., MN) and a differential mobility particle sizer (DMA, TSI 3085).
Electrical Aerosol Detector (EAD)
Several instruments are currently in use to assess PM surface related properties. In this study, a
diffusion charger, the TSI EAD 3070A, was used to characterize the transient as well as steady state

18
behavior of aerosols. The EAD consists of a unipolar diffusion charger and an electrometer. Particles are
charged by diffusion and then drawn through the electrometer which records total current (I) carried by
the aerosol stream. Studies have shown that the response of EAD is a function of Dp1.13-1.16
(Jung and
Kittelson, 2005; Wilson et al., 2007; Woo et al., 2001). This response is particularly an useful PM metric
because it corresponds to the actual particle surface area exposed to the environment and can be used
to quantify, for example, the area available for adsorption of gaseous species or for interaction with the
epithelial tissue in the lungs (Wilson et al., 2007). Because the EAD signal is closely related to aerosol
diameter (Jung and Kittelson, 2005) the manufacturer has marketed this instrument to indicate total
aerosol length in mm/cm3.
High Volume Sampler
The high volume sampler is a specially designed filter holder [Hi-Q Environmental Products Co., CA;
(Misra et al., 2002)] to collect particles on 20x25 cm filters at a relatively high flow rate (450 l/min).
Integrated PM samples from the CVS were collected using this sampler on Teflon coated glass fiber
filters (Pallflex, Fiberfilm T60A20 – 8x10 inch, Pall Corp., East Hills, NY).

19
4. Physical Characteristics of the Exhaust
Particles (Semi-volatile and Non-
volatile) from Retrofitted Vehicles
4.1 Introduction
Diesel exhaust particles (DEPs) are normally
agglomerates of hundreds of volatile/semi-volatile species
adsorbed onto its refractory carbonaceous core (Bayona
et al., 1988). Various on-road as well as dynamometer
experiments have shown that these particles are
predominantly externally mixed (except particles <20nm).
Particle volatility is strongly dependent on gas to particle
phase partitioning and is extremely sensitive to dilution
and temperature conditions (Abdul-Khalek et al., 1999;
Biswas et al., 2007; Kuhn et al., 2005a; Liu et al., 2007a;
Wei et al., 2001). Particle volatility plays key roles in
shaping the particle size spectrum and eventually
determining the level of human exposure to different
aerosol components (volatile or non-volatile) originating
from traffic emissions.
In addition to volatility, particle surface characteristics
are important physical parameters in determining PM
toxicity. Some researchers have argued that particle
surface area is a better metric to predict health endpoints than particle mass or number and should be
included as an essential element while considering new regulatory tools (Maynard, 2006; Nygaard et al.,
2004; Oberdorster et al., 2005). This is because the availability of reaction sites to cause cell damage is
more likely to be directly proportional to surface area available to lungs (Maynard, 2006). Surface
properties will also be relevant in future as the control technologies are reported to generate
considerable number of small particles (Bagley et al., 1998; Geller et al., 2005) leading to a net increase
in surface area per unit mass of PM.
In this section we focus on the PM physical properties, i.e. size distribution, volatility and surface
characteristics for diesel vehicles retrofitted with state-of-the-art after-treatment devices. Comparisons
among different vehicle types and driving cycles and also with respect to a baseline vehicle (without any
control technology) are discussed.
4.2 Data Reduction
This section reports the physical
properties, including size distribution,
volatility (in terms of number and mass),
surface diameter and agglomeration of
particles emitted from heavy-duty diesel
vehicles (HDDV) retrofitted with advanced
emission control devices. Substantial
reduction in PM mass emissions (>90%)
was accomplished for the HDDV operating
with advanced emission control
technologies. This reduction was not
observed for particle number
concentrations under cruise conditions,
with the exceptions of the Hybrid-CCRT
and EPF vehicles, which were efficient in
controlling both - mass and number
emissions. In general, significant
nucleation mode particles (<50nm) were
formed during cruise cycles in comparison
with the UDDS cycles, which emit higher
PM mass in the accumulation mode. The
nucleation mode particles (<50nm) were
mainly internally mixed, and evaporated
considerably between 150 to 230oC.
Compared to the baseline vehicle,
particles from vehicles with controls
(except of the Hybrid-CCRT) had a higher
mass specific surface area.

20
The physical properties of aerosols from the various vehicles and driving cycles were reduced to
three variables, originally introduced by Ntziachristos and Samaras (2006), intended to serve as means
to discriminate the effects of fuel, driving condition and vehicle control technology on particle emissions
in dynamometer studies. These variables are:
Reduced Variable 1: Volatility Ratio
TD
Exhaust
N
NR = (1)
Where
ExhaustN = Total dilution corrected DMS or EEPS number concentration at the CVS (Dp ≥ 7nm)
TDN = Number concentration measured by CPC after the thermodenuders (Dp ≥ 7nm).
This is a measure of particle volatility in terms of number concentration.
Reduced Variable 2: Surface Rated Diameter
The EAD electrometer current is given by
eQNNI tp= (2) (Woo et al., 2001)
Where, I = Total current measured by EAD (fA)
pN = Charge (charge/particle) attachment =13.10181.0 sD (Jung and Kittelson, 2005)
Ds = Surface rated diameter, nm
e = Elementary charge, 1.6 x 10⁻¹⁹
coulomb
Q = Aerosol flow rate through EAD, 1.5 lpm (1.5 lpm aerosol, 1 lpm sheath flow)
tN = Total exhaust particle number, 10-1000nm from DMS; 10-523nm for EEPS.
Note: Particle number in the size range of 523-1000nm is insignificant.
Now substituting in equation 2:
13.1/1)0181.0
(eQN
ID
ts = (3)
Reduced Variable 3: Mass Specific Surface Area

21
PM
SA = (4)
A = Mass specific surface area (m2 g
-1)
S = Surface concentration, in m2 km
-1
For the calculation of A, the EAD current was converted to particle surface area using the conversion
factor of 65 µm2/pA (R
2= 0.9, Alveolar deposition) reported by Wilson et al., (2007).
PM = Total particle mass collected between 10nm-2.5µm nano MOUDI stages, in mg km-1
.
The nano-MOUDI substrate mass (≤ 2.5µm) measurements were in excellent agreement with parallel
CARB reference filter measurements (R2=0.99; Slope =0.95, Intercept: 2.4 mg km
-1) and was used to
calculate mass based parameters. Filter mass was used only for V-SCRT-Cruise (nano-MOUDI data not
available)
It is a measure of particle agglomeration, which increases with decreasing A .
4.3 Results
Size Distribution
Figure 4.1 presents tunnel blank- subtracted mean size distributions for vehicles at different
operating conditions. These distributions derived from DMS/EEPS measurements are grand averages of
multiple runs for each driving cycle. The data are reported in terms of number per vehicle kilometer
traveled for cruise and UDDS cycles, and number per hour for idle.
While performing preliminary quality assurance – quality control (QA/QC) of real time data for SCRTs
(V-cruise, UDDS, Z-Cruise), we noticed that few EEPS sizes channels (10-20nm) were almost always
saturated due to particle over-loadings. These size bins were subsequently replaced with corresponding
secondary dilution-corrected DMS data (the DMS was placed downstream of the PMP secondary
dilution with the ET off) to obtain more accurate size distributions. For the rest of test fleets [except
CRT], we used data from the DMS, which was directly connected to the CVS. We have added a tunnel
blank distribution in Figure 4.1f (Baseline vehicle).

22
V-SCRT®
1.E+09
1.E+11
1.E+13
1.E+15
1.E+17
1 10 100 1000Dp (nm)
dN/d
logD
p
(Par
ticle
s km
-1)
1.E+09
1.E+11
1.E+13
1.E+15
dN/d
logD
p
(Par
ticle
s hr
-1)
V-SCRT-Cruise
V-SCRT-UDDS
V-SCRT-Idle
Z-SCRT®
1.E+07
1.E+09
1.E+11
1.E+13
1.E+15
1.E+17
1 10 100 1000Dp (nm)
dN/d
logD
p
(Par
ticle
s km
-1)
1.E+09
1.E+11
1.E+13
1.E+15
dN/d
logD
p
(Par
ticle
s hr
-1)
Z-SCRT-Cruise
Z-SCRT-UDDS
Z-SCRT-Idle
DPX®
1.E+07
1.E+09
1.E+11
1.E+13
1.E+15
1.E+17
1 10 100 1000Dp (nm)
dN/d
logD
p
(Par
ticle
s km
-1)
DPX_Cruise
DPX-UDDS
a)
b)
c)

23
Non-Nucleating Vehicles
1.E+07
1.E+09
1.E+11
1.E+13
1 10 100 1000Dp (nm)
dN/d
logD
p
(Par
ticle
s km
-1)
EPF-CruiseEPF-UDDSHybrid-CCRT-UDDS
CRT®
1.E+08
1.E+10
1.E+12
1.E+14
1.E+16
1 10 100 1000Dp (nm)
dN/d
logD
p
(Par
ticle
s km
-1)
CRT-Cruise
CRT-UDDS
Baseline
1E+11
1E+12
1E+13
1E+14
1E+15
1E+16
1 10 100 1000Dp (nm)
dN/d
logD
p
(Par
ticle
s km
-1)
1.E+10
1.E+11
1.E+12
1.E+13
1.E+14
dN/d
logD
p
(Par
ticle
s hr
-1)
Baseline-CruiseBaseline-UDDSTunnel Blank
Figure 4-1 a, b, c, d, e, f Particle number size distributions
d)
f )
e)

24
Size distribution patterns for both SCRTs are quite similar with sharp modes (Figure 4.1 a,b) at ~
10nm. The distinguishable feature is the less prominent nucleation mode for UDDS runs especially for
the Z-SCRT-UDDS cycle. This may be due to the fact that the Zeolite-SCRT requires much higher
temperature to trigger and sustain nucleation than the vanadium based SCRT catalysts (Herner et al.,
2007b). Moreover, in general the Zeolite catalysts have lot more catalytic surface area than vanadium
catalysts and the Z-SCRT system used for this study is completely new. These provide higher storage
sites for sulfate generated by the upstream DOC and DPF during transient and low temperature testing.
Although the main purpose of SCR technologies is to reduce NOx by ammonia, at elevated
temperatures, their in-built catalysts may encourage the formation of sulfate, an important component
acting potentially as seed aerosol for particle formation by condensation of semi-volatile organic vapors.
For a brief sampling period, we bypassed the SCR portion from exhaust after-treatment system (SCRT)
just to investigate the impact of the SCR catalysts. Although, this modification did not result in visible
alteration of the shape (on log scale) of the distributions (CRT, Figure 4.1e), number concentration
decreased by a factor of 2-3 from the V-SCRT and Z-SCRT cruise cycles—suggesting SCR catalysts’ role on
nucleation. Unlike cruise or UDDS cycles, idle runs are characterized with remarkably low particulate
number emission rates, coupled with broad size distributions (Figure 4.1a, b). The second test engine,
Engelherd-DPX (Figure 4.1c) displays a dominant nucleation mode, almost identical to the SCRTs/CRT. It
has been hypothesized that the catalyst wash-coat on DPF (if saturated) may be enhancing the
conversion of SO2 to SO3/sulfate and partially stimulates the nucleation process (Hansen et al., 2001).
Contrary to the general notion that particulate filters augment nucleation, the hybrid vehicles [with a
CCRT] and the school bus [with an EPF] were found to be highly efficient in suppressing if not eliminating
this PM mode. The Hybrid-CCRT vehicle (Figure 4.1d) resulted in concentrations (CVS) in the range of
~104 particles cm
-3, thus a 1,000-fold improvement over the previously tested vehicles (>10
7
particles.cm-3
). We hypothesize that the initial capacity of its relatively new trap (with only 1000 miles
on it) to store sulfur has significantly suppressed the formation of nuclei mode particles. Once all the
storage sites are saturated, nucleated sulfate particles are expected. For this vehicle only a few odd
large particles are left downstream (Figure 4.1d). The school bus (Figure 4.1d), however, was the
cleanest amongst the entire test fleet with number emissions less than 1500 particles.cm-3
measured in
the CVS. It is important to note here that this vehicle is equipped only with an uncatalyzed filter (EPF)
which is least likely to enhance the nucleation process. Thus, nucleation is not only control device
specific but also a function of age and operating conditions e.g. temperature of the catalysts.
The baseline truck, on the other hand, represents the older genre of vehicles and was found to emit
substantial amounts of larger particles (Figure 4.1f) with modes in the 60-100 nm range. Because of
their large surface area, these accumulation mode particles act as adsorption sites and thus perfect sinks
for organic vapors, leading to suppression of nucleation mode (Liu et al., 2007b).
Size Segregated Mass Emission Factors
Size fractionated mass emissions factors (in mg km-1
or mg hr-1
) are calculated based on the loadings
on the MOUDI-nano-MOUDI impaction plates (Table 4.1). The mass loadings on the individual substrates
are generally low for retrofitted vehicles and depending on size ranges, variation in the order of 20-40%
(Standard Deviation/Mean; from few duplicate measurements) are observed.
Although a direct correspondence of mobility and aerodynamic diameters is not accurate without
establishing some conversion factors, we can utilize the information from Table 4.1 to complement the
25
mobility size distributions (Figure 4.1) described before. Number and mass based size distributions are
found to be in reasonable agreement with each other in terms of their trends.
The emission factors are remarkably low (~1-12 mg km-1
) for the fleet operated with control
technologies compared to the baseline vehicle (~80-316 mg km-1
). While the majority (>95%) of PM
mass is concentrated between 100nm-2.5µm for the baseline truck, nuclei modes are clearly visible for
vehicles retrofitted with control devices. Significant reduction (>90%) of the mass is achieved for
vehicles retrofitted with control devices.
Some general trends and inferences can be drawn from Figure 4.1 and Table 4.1. Consistent with a
previous study (Vaaraslahti et al., 2004), the majority of the control technologies evaluated here have
promoted bulk production of nano-size (nucleation) particles during steady state and high speed
segment of transient running cycles. The cruise cycles on average generate higher nucleation and lesser
accumulation mode particles than the UDDS cycles. The differences between these driving cycles are
even more pronounced in mass distributions (Table 4.1): significant shifts towards larger sizes are
apparent in UDDS runs due to increased emission of accumulation mode particles during the
acceleration processes (Polidori et al., 2008). Aerosol formation mechanism, poorly understood till date,
seems to be a function of vehicle type and driving conditions and retrofit design.

26
Table 4-1 Size fractionated mass EFs (mg km -1 for Cruise and UDDS, mg hr-1 for Idle)
Size V-SCRT Z-SCRT DPX Hybrid CRT EPF Baseline
(nm) CCRT
UDDS Idle Cruise UDDS Idle Cruise UDDS Idle UDDS Cruise UDDS Cruise UDDS Idle Cruise UDDS Idle
10-18 0.73 3.18 0.90 0.17 1.06 0.65 0.56 4.91 0.26 1.35 1.25 0.04 0.05 5.92 1.02 1.39 19.363
18-32 1.44 2.48 1.48 0.34 3.54 0.29 0.46 1.89 0.12 0.86 1.52 0.22 0.08 3.48 1.96 2.54 60.241
32-56 2.46 1.77 1.60 0.32 1.42 0.30 1.25 12.45 0.22 0.98 3.19 0.12 0.16 5.92 5.96 10.7 565.83
56-100 1.36 4.25 1.15 0.17 0.35 0.11 0.60 3.40 0.33 0.49 0.55 0.14 0.10 4.53 9.98 19.6 600.26
100-180 0.86 12.03 0.53 0.62 3.54 0.27 0.41 7.92 0.17 0.57 1.52 0.07 0.05 3.13 29.4 86.8 2327.9
180-2500 1.07 7.78 0.97 0.55 0.00 0.21 0.20 3.02 0.57 1.15 2.63 0.15 0.29 8.71 31.1 192 6049.9
>2500 0.83 6.37 0.50 0.66 3.18 0.20 0.35 5.66 0.35 0.37 0.83 0.12 0.17 7.66 1.03 3.41 346.39

27
Figure 4.2 is an informative graph showing a plot of number EFs vs. Mass EFs (nano-MOUDI, except
V-SCRT-Cruise) for each vehicle and driving cycle. Each data point corresponds to a cruise or an UDDS
cycle for a given vehicle. The graph shows that for several of the after-treatment devices tested, particle
number emissions increase with reduced mass emissions. There are some outliers or exceptions
observed for Z-SCRT at UDDS cycle, Hybrid-CCRT, EPF and Idle (not shown) for which both number and
mass EFs are relatively low, possibly due to the lack of catalytic formation of sulfate: EPF has no catalyst;
the Hybrid CCRT was not yet aged, and therefore the sulfur storage sites were not fully saturated,
thereby preventing or suppressing the formation of sulfur. Moreover, the idling cycle does not lead to
high enough catalyst temperatures that would convert sulfur to sulfate. Thus, most of the new after-
treatment devices appear to be highly efficient in reducing mass emissions but some are not effective in
controlling number concentrations due to the formation of nuclei mode particles. These findings are
potentially very important if number based standards are considered in the future.
EPF
V-SCRT
Z-SCRT
DPX
CRT
Baseline
EPF
DPX
CRT
Baseline
Hybrid-CCRTZ-SCRT
V-SCRT
1.0E-01
1.0E+00
1.0E+01
1.0E+02
1.0E+03
1.0E+10 1.0E+11 1.0E+12 1.0E+13 1.0E+14 1.0E+15 1.0E+16
Number EF (Particles km -1)
Mas
s E
F (
mg
km-1
)
CruiseUDDS
Non-Nucleating Vehicles
Figure 4-2 Number (DMS) and mass emission factors (nano-MOUDI).
Particle Volatility
The extent of particle volatility in terms of total count is illustrated quantitatively by the reduced
variable 1 (R) plotted in Figure 4.3 for various vehicles and cycles. R was calculated at 150 and 230oC
except in few occasions (Hybrid-CCRT, EPF) when both the thermodenuders were operated at 150oC to
maximize our capability to collect mass of non-volatile particles. Theoretically, this ratio (R) should be
greater or equal to unity and its increase corresponds to higher particle volatility. For the majority of
the cases, R at 230oC is at least an order of magnitude higher than their counterparts at 150
oC, indicating
complete disappearance of large fraction of particles within this temperature window.
Particle volatility was also observed to be somewhat sensitive to driving conditions and type of
control technology used. For instance, cruise mode particles are extremely volatile with maximum R

28
values (~ 4000-10000) at 230oC for V-SCRT, DPX and CRT. The fact that less than ~0.1% of particles
persisted at 230oC for most of the fleet with control technologies can logically be explained by the
presence of unstable (volatile) fresh nano particles. Although the same Kenworth truck is used to
evaluate various after-treatment devices (V-SCRT, Z-SCRT, CRT), the Zeolite catalysts, especially during
UDDS runs, seem to emit particles with a slightly higher heat resilience, which is consistent with the fact
that that nucleation mode particle were in lower concentrations for that vehicle and cycle (Figure 4.1b).
As expected, the baseline vehicle had the highest fraction of non-volatile particles in all cycles. Lower
volatility is also observed during all idle runs, EPF and Hybrid-CCRT vehicles. While the baseline truck
emits large amounts of refractory elemental carbon, lower number loss for other vehicles/cycles is
attributed to their insignificant particle emission rate and/or absence of the nucleation mode particle
formation.
1.E+00
1.E+01
1.E+02
1.E+03
1.E+04
1.E+05
V-C
ruis
e
V-U
DD
S
V-I
dle
Z-C
ruis
e
Z-U
DD
S
DP
X-C
ruis
e
DP
X-U
DD
S
DP
X-I
dle
Hyb
rid-U
DD
S
EP
F-C
ruis
e
EP
F-U
DD
S
CR
T-C
ruis
e
CR
T-U
DD
S
Bas
elin
e-C
ruis
e
Bas
elin
e-U
DD
S
Bas
elin
e-Id
le
Cycle
Red
uced
Var
iabl
e 1
TD 150 TD 230
V-SCRT® Z-SCRT® DPX® Hybrid-CCRT®
EPF CRT® Baseline
Figure 4-3 Reduced Variable 1 (R): Ratio of total particle to solid or thermo-denuded particle
count.
The significant particle number loss between 150 to 230oC, especially for cruise cycles, may be
better elucidated by the evaporation profiles shown in Figure 4.4. The majority of particles in the 7-
20nm size range for DPX and CRT have disappeared as the aerosol stream is heated from 150oC to
230oC. This is in total contrast to the baseline vehicle, where no noticeable shift in size spectrum is
observed. Matter et al., (1999) reported very similar thermal desorption trends between 172 and 204oC
for particles sampled downstream of a DPF.

29
1.00E+01
1.00E+02
1.00E+03
1.00E+04
1.00E+05
1.00E+06
1.00E+07
1.00E+08
1 10 100 1000Dp (nm)
dN/d
logD
p (N
umbe
r cm
-3)
Baseline-TD 150
Baseline-TD 230
CRT-TD 150
CRT-TD 230
DPX-TD150
DPX-TD 230
Significant loss of nucleationmode particles
Figure 4-4 Size distribution of thermo denuded aerosols for cruise mode.
Note: Available only for DPX, CRT and Baseline
0
0.2
0.4
0.6
0.8
1
1.2
V-C
ruis
e
V-U
DD
S
V-I
dle
Z-C
ruis
e
Z-U
DD
S
Z-Id
le
DP
X-C
ruis
e
DP
X-U
DD
S
DP
X-I
dle
Hyb
rid-U
DD
S
EP
F-C
ruis
e
EP
F-U
DD
S
EP
F-Id
le
CR
T-C
ruis
e
CR
T-U
DD
S
Bas
elin
e-C
ruis
e
Bas
elin
e-U
DD
S
Bas
elin
e-Id
le
Cycle
Non
-Vol
atile
Mas
s F
ract
ion
TD 150
TD 230
V-SCRT® Z-SCRT® DPX® Hybrid-CCRT®
EPF CRT® Baseline
Figure 4-5 Mass fractions remaining at different thermodenuder temperature settings.
Figure 4.5 presents the amount of mass fraction retained (non-volatiles) at 150 and 230oC. We
obtained these ratios from gravimetric filter measurement of denuded and undenuded samples.
Particle number is not a good surrogate of its mass. Thus, except in the case of baseline vehicle, number

30
loss (Figure 4.3, 4.4) has not linearly translated into equivalent particle mass reduction. While more
than 99% of the particles completely disappear at 230oC for SCRTs, CRT and DPX at cruise and UDDS
runs, an appreciable fraction of mass (20-40%) remains intact. Quite a reverse trend is observed for
idling, EPF and Hybrid-CCRT (low number emission scenarios with insignificant nucleation mode)—
relatively low number volatility is accompanied with significant mass loss. A study (Biswas et al., 2007)
conducted in close proximity of a freeway with the highest percentage of diesel fleet (~18%) in the US
demonstrated that a substantial amount of particle mass could be lost from larger ultrafine particles
(>40nm) due to heating without losing a significant amount of their total counts. The mode of the size
distribution shifted to lower size ranges, as a result of the depletion of the aerosol mass, but overall
these particles simply decreased in size but did not disappear during heating, unlike the much smaller
nucleation mode PM.
Particle Surface Properties: Surface Rated Diameter (Reduced Variable 2)
The surface rated diameters (Ds) calculated from EAD surface concentrations are illustrated in Figure
4.6. Ideally, Ds should be very close, if not higher than, the arithmetic mean particle diameter. Average
surface rated diameters are calculated for all the vehicles except for school bus (EPF) where EAD signals
are below the instruments detection limit. It is evident from the plot that cruise mode Ds, irrespective
of types of control technologies, are smaller (~25-40nm) compared to the transient driving cycles (~75-
100nm). This is consistent with the increased formation of elevated level of nuclei mode particles (<
50nm) during the steady state and larger amount of accumulation mode particles in UDDS cycles.
Considering negligible variations in the accumulation modes (Harris and Maricq, 2001), also shown in
our Figure 4.1 and Table 4.1, we can thus use Ds as a good indicator for the presence or absence of
freshly nucleated particles.
0
30
60
90
120
150
V-S
CR
T
Z-S
CR
T
DP
X
Hyb
rid-
CC
RT
CR
T
Bas
elin
e
Vehicle
Sur
face
Equ
ival
ent D
iam
eter
(D
s,nm
)
Cruise UDDS
Figure 4-6 Reduced Variable 2: Surface rated diameter.
During a typical transient run (i.e. UDDS cycles), an engine experiences acceleration, deceleration,
steady state and idling phases, which result in frequent changes in exhaust particle characteristics in
terms of their size distribution, total count and surface concentration. Acceleration and high speed
cruise modes produce significant number of small particles, followed by their absence during
deceleration and idling. Thus, rapid variation in Ds coupled with higher accumulation modes (Figure 4.1,
Table 4.1) eventually translates into higher mean surface diameter for UDDS runs. This phenomenon can
31
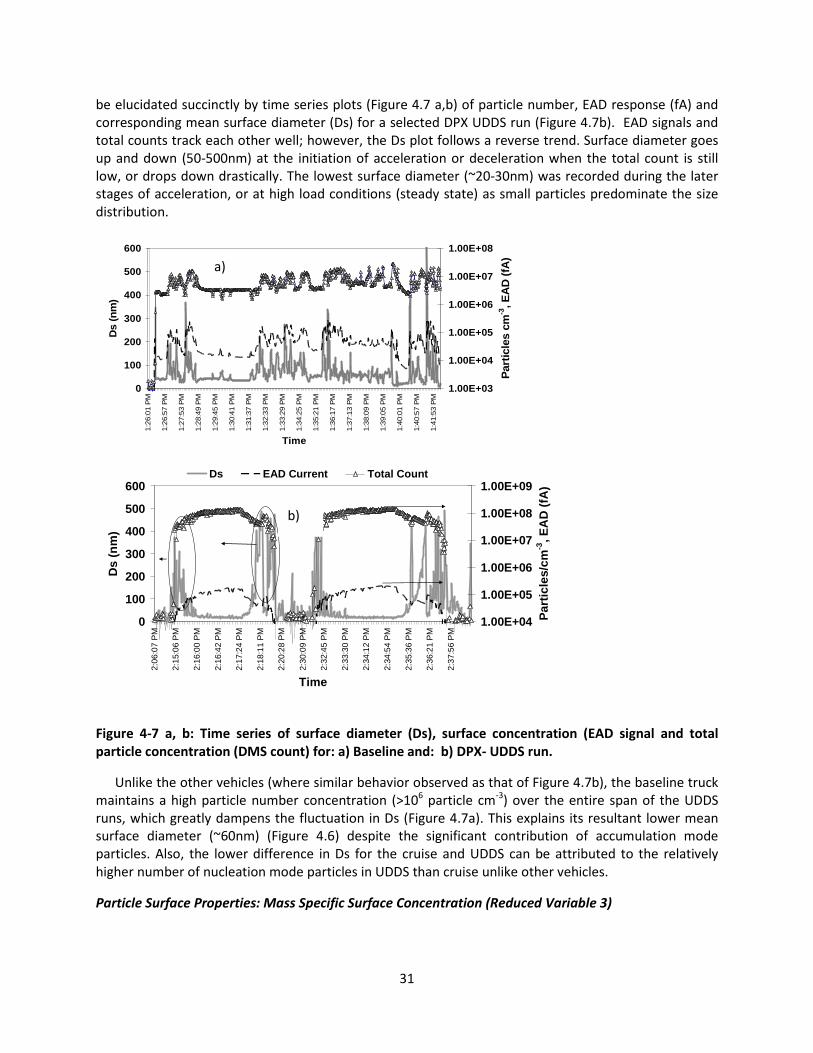
be elucidated succinctly by time series plots (Figure 4.7 a,b) of particle number, EAD response (fA) and
corresponding mean surface diameter (Ds) for a selected DPX UDDS run (Figure 4.7b). EAD signals and
total counts track each other well; however, the Ds plot follows a reverse trend. Surface diameter goes
up and down (50-500nm) at the initiation of acceleration or deceleration when the total count is still
low, or drops down drastically. The lowest surface diameter (~20-30nm) was recorded during the later
stages of acceleration, or at high load conditions (steady state) as small particles predominate the size
distribution.
0
100
200
300
400
500
600
1:26
:01
PM
1:26
:57
PM
1:27
:53
PM
1:28
:49
PM
1:29
:45
PM
1:30
:41
PM
1:31
:37
PM
1:32
:33
PM
1:33
:29
PM
1:34
:25
PM
1:35
:21
PM
1:36
:17
PM
1:37
:13
PM
1:38
:09
PM
1:39
:05
PM
1:40
:01
PM
1:40
:57
PM
1:41
:53
PM
Time
Ds
(nm
)
1.00E+03
1.00E+04
1.00E+05
1.00E+06
1.00E+07
1.00E+08
Par
ticle
s cm
-3, E
AD
(fA
)
0
100
200
300
400
500
600
2:06
:07
PM
2:15
:06
PM
2:16
:00
PM
2:16
:42
PM
2:17
:24
PM
2:18
:11
PM
2:20
:28
PM
2:30
:09
PM
2:32
:45
PM
2:33
:30
PM
2:34
:12
PM
2:34
:54
PM
2:35
:36
PM
2:36
:21
PM
2:37
:56
PM
Time
Ds
(nm
)
1.00E+04
1.00E+05
1.00E+06
1.00E+07
1.00E+08
1.00E+09
Par
ticle
s/cm
-3, E
AD
(fA
)
Ds EAD Current Total Count
Figure 4-7 a, b: Time series of surface diameter (Ds), surface concentration (EAD signal and total
particle concentration (DMS count) for: a) Baseline and: b) DPX- UDDS run.
Unlike the other vehicles (where similar behavior observed as that of Figure 4.7b), the baseline truck
maintains a high particle number concentration (>106 particle cm
-3) over the entire span of the UDDS
runs, which greatly dampens the fluctuation in Ds (Figure 4.7a). This explains its resultant lower mean
surface diameter (~60nm) (Figure 4.6) despite the significant contribution of accumulation mode
particles. Also, the lower difference in Ds for the cruise and UDDS can be attributed to the relatively
higher number of nucleation mode particles in UDDS than cruise unlike other vehicles.
Particle Surface Properties: Mass Specific Surface Concentration (Reduced Variable 3)
a)
b)

32
Figure 4.8 shows mass specific surface concentrations for the various tested vehicles and driving
cycles. This PM property is inversely proportional to the mean particle size of DEPs, thereby providing
an indirect measure of the extent of particle agglomeration. Therefore, the decrease of ‘A’ implies an
increased contribution of coagulated or accumulation mode particles. The accumulation mode particles
scavenge nucleation precursor species (Liu et al., 2007b). Thus, particle agglomeration is an important
parameter to indicate suppression of nuclei mode particles.
0
1
10
100
1000
V-S
CR
T
Z-S
CR
T
DP
X
Hyb
rid-
CC
RT
CR
T
Bas
elin
e
Vehicle
A=S
/M (
m2 /g
)
Cruise UDDS
Figure 4-8 Reduced Variable 3: Mass specific surface concentration.
Cruise cycles on average have slightly higher values (5-10%) of ‘A’ compared to their respective UDDS
cycles of a given vehicle, indicating their less agglomerated particle structures. Although the shape and
size of accumulation modes are quite similar, if not identical, for both cycles (Figure 4.1), steady state
operations are associated with higher nucleation mode. As EAD signal is weighed towards smaller
particles (Jung and Kittelson, 2005), cruise cycles are likely to trigger more EAD response than transient
cycles. On the other hand, accumulation modes prevail over nucleation modes (Figure 4.1) for Hybrid-
CCRT at UDDS runs and for the baseline vehicle, resulting in lower mass specific surface concentrations
(~1 m2g
-1). Higher fractal agglomerates emitted by the Baseline vehicle may result in a lower value of A.
4.4 Conclusions
This section presented some of the first detailed particle characterization for advanced NOx and PM
retrofits for heavy duty diesel vehicles. Remarkable reductions in PM mass emissions (>90%) were found
for the test fleet compared to the baseline vehicle. However, enhanced nucleation mode particles were
observed for some of the vehicles especially during cruise cycles. Comparing to cruise cycles, the UDDS
cycles emit higher particle mass in the accumulation mode. Idle runs are characterized with remarkably
low particle number emission rates, coupled with fairly broad size distributions. The Hybrid-CCRT and
EPF vehicles were efficient in controlling both mass and number emissions. The majority of particles by
number evaporated by heating the aerosol to 150 - 230 oC, suggesting the nucleation mode particles are
predominantly internally mixed and consist of semi-volatile compounds. Particles from the test fleet

33
(except Hybrid-CCRT) have shown about 100-fold higher active surface area per unit mass than the
baseline vehicle.
34
5. hemical Characteristics of Exhaust
Particles from Retrofitted Vehicles
5.1 Introduction
This section focuses on the chemical components (EC,
OC, WSOC, inorganic ions, and speciated organic
compounds) of PM from heavy-duty diesel vehicles
(HDDV) tested during the experimental phase.
Comparisons are made with previous studies to illustrate
the effects of control technologies on the chemical
composition of exhaust PM samples. The effect of driving
cycles is also discussed by comparing steady- state cruise
and transient driving cycles.
5.2 Sample Analysis
Aluminum substrates from MOUDI-Nano MOUDI
stages were pre and post-weighed during the sampling to
determine the mass loadings. The elemental and organic
carbon (EC, OC) content of deposited PM was analyzed by
thermal-optical method (Kleeman et al., 1999). It should
be noted here that for Al substrates, EC/OC split is not
precisely defined; only relative fractions of EC and OC can
be estimated. The ion concentrations were derived by ion
chromatography (Zhang et al., 2008) technique. The
water-soluble organic carbon (WSOC) content extracted
from Teflon coated GF filters were analyzed by Shimadzu
TOC-5000A liquid analyzer (Decesari et al., 2000).
The speciated organic compounds, including polycyclic
aromatic hydrocarbons (PAH), hopanes and steranes, n-
alkanes and organic acids, were quantified on the HiVol
PM samples by gas chromatography-mass spectrometry
(GC/MS). Methods for the quantification of individual
compounds were based on already established solvent
extraction procedures reported earlier (Schauer et al.,
1999). Samples were extracted in dichloromethane and
methanol and were combined and reduced in volume to
approximately 1 mL by rotary evaporation, followed by
This section focuses on PM chemical
characteristics [Total carbon (TC),
Elemental carbon (EC), Organic Carbon
(OC), speciated organic compounds,
inorganic ions, and water-soluble organic
carbon (WSOC) from the tested vehicles.
Significant reductions in the emission of
major chemical constituents (TC, OC, EC,
and organic compounds) were achieved
by the introduction of retrofits. V-SCRT
and Z-SCRT effectively reduced PAHs,
hopanes and steranes, n-alkanes and
acids by more than 99%, and often to
levels below detection limits for both
cruise and UDDS cycles. The CRT
technology also showed similar
reductions with SCRT for medium and
high molecular weight PAHs, acids, but
with slightly lower removal efficiencies for
other organic compounds. Sulfate
dominated the PM composition in vehicle
configurations (V-SCRT-UDDS, Z-SCRT-
Cruise, CRT, DPX) with considerable
nucleation mode and TC was dominant
for the configurations with less (ZSCRT-
UDDS) or insignificant (CCRT, Horizon)
nucleation.
The transient operation increases EC
emissions, consistent with its higher
accumulation PM mode content. In
general, solubility of organic carbon is
higher (average ~ 5 times) for retrofitted
vehicles than the baseline vehicle. The
retrofitted vehicles with catalyzed filters
(DPX, CCRT) had decreased OC solubility
(WSOC/OC: 8-25%) unlike those with un-
catalyzed filters (SCRTs, Horizon;
WSOC/OC~ 60-100%).
The particle bound organics–to-OC ratios
(μg/g) was lower for retrofitted vehicles
compared to the baseline truck. However,
the reduction in the ratio was
considerable for PAHs, while it was
insignificant for hopanes and steranes,
implying that fuel and lubricating oil have
substantially different contributions to
the total OC emitted by vehicles operating
with after-treatment control devices.

35
pure nitrogen evaporation. The underivatized samples were analyzed by auto injection into a GC/MSD
system (GC model 5890, MSD model 5973, Agilent). A 30 m × 0.25 mm DB-5MS capillary column
(Agilent) was used with a split-less injection. Along with the samples, a set of authentic quantification
standard solutions were also injected and used to determine response factors for the compounds of
interest. All the results were blank-corrected prior to data analysis and converted to mass emitted per
distance traveled.
5.3 Results
Emission Factors of Inorganic Ions and Total Carbon (TC)
Figure 5.1 shows the EFs (expressed in mg of PM species per kilometer driven) of major chemical
species integrated over the MOUDI-NanoMOUDI stages from 0.01- 2.5 µm. The low emission vehicles
pose a challenge for PM chemical analysis due to very low mass loadings on individual substrates. The
analytical uncertainties are shown by the error bars.
At both cruise and UDDS cycles, significant reductions in the emission of TC were observed for the
retrofitted vehicles compared to the baseline vehicle. However, elevated emission rates of sulfate and
ammonium were observed for vehicles and-or driving cycles that have a substantial fraction of
nucleation mode particles, i.e. CRT, V-SCRT (measurements only available for UDDS cycle), Z-SCRT-cruise
and DPX, compared to the baseline vehicle. The school bus retrofitted with an electric particulate filter
(Horizon) was consistently the cleanest vehicle with the lowest emissions of inorganic ions and TC. This
is also in agreement with the emission rates of PM based on gravimetric mass measurement (Section 3).
Cruise 50 mile Hr-1
Species
Sodium Ammonium Potassium Chloride Nitrate Sulfate TC
EF
(m
g K
m-1
)
1e-5
1e-4
1e-3
1e-2
1e-1
1e+0
1e+1
1e+2
a)

36
UDDS
Species
Sodium Ammonium Potassium Chloride Nitrate Sulfate TC
EF
(m
g K
m-1
)
1e-5
1e-4
1e-3
1e-2
1e-1
1e+0
1e+1
1e+2
1e+3
Figure 5-1 Emission factors of integrated chemical species measured by MOUDI-NanoMOUDI.
a). Cruise 50 mph b). Transient UDDS.
The emission factors of TC were further split into EC, water-soluble and water-insoluble OC (WSOC
and WIOC, respectively) and shown in Figure 5.2a, b. The baseline vehicle (shown on secondary axis) not
only emits considerable amount of EC (Cruise: 13.8 mg km-1
, UDDS: 65.9 mg km-1
) but also elevated
levels of WIOC (Cruise: 28.2 mg km-1
; UDDS: 88 mg km-1
) and WSOC (Cruise: 2.7 mg km-1
; UDDS: 14 mg
km-1
). The low EFs of WIOCs (~0.1-0.4 mg km-1
) and WSOC (0.05-0.95 mg km-1
) for the retrofitted
vehicles suggest that these control devices are also effective (65-99%) in reducing the major fraction of
organic carbon in addition to EC. However, It is important to note here that only the baseline, V-SCRT, Z-
SCRT and CRT configurations are directly comparable (same vehicle) and caution should be exercised
while comparing with other vehicle configurations (DPX, Horizon, CCRT).
b)

37
Cruise
Z-S
CR
T
DP
X
Hor
izon
Bas
elin
e
EF
(m
g km
-1)
0.0
0.2
0.4
0.6
0.8
1.0
1.2
1.4
1.6
EF
(m
g km
-1)
0
10
20
30
40
50
EC WSOC WIOC
UDDS
V-S
CR
T
Z-S
CR
T
DP
X
Hor
izon
CC
RT
N.a
.N.
Bas
elin
e
EF
(m
g km
-1)
0.0
0.2
0.4
0.6
0.8
EF
(m
g km
-1)
0
50
100
150
200
a)
b)

38
WSOC/OC
Configuration
Baseline V-SCRT Z-SCRT DPX Horizon CCRT
Fra
ctio
n
0.0
0.2
0.4
0.6
0.8
1.0
CruiseUDDS
Figure 5-2 a, b EC, WSOC and WIOC emission rates at a) Cruise 50mph and b) Transient UDDS
c) Proportion of WSOC to OC.
Note: V-SCRT cruise and CCRT-Cruise cycles are not available
In addition to the overall reduction of OC, the proportion of WSOC to OC, illustrated in Figure 5.2c
varies with vehicle configurations and running cycles. The baseline vehicle shows the lowest OC
solubility (WSOC/OC =0.08-0.13) during both cruise and UDDS cycles, suggesting freshly emitted primary
OC. By comparison, OC emitted from Horizon and SCRTs consists primarily of WSOC. DPX and CCRT
WSOC contents are intermediate between the baseline and other retrofitted vehicles. An earlier study
by Hameri et al., (2001) indicated higher water solubility of OC in the nucleation/UF mode than the
accumulation mode. This may explain, to a certain extent, the higher WSOC/OC ratio of SCRTs and
Horizon, where significant fraction of OC is observed in the nucleation mode. In contrast, OC dominates
in accumulation mode for the baseline vehicle. In addition to size distribution of OC, control
technologies seem to have major influences on the percentage of WSOC emitted by vehicles. The DPF of
Horizon and SCRTs (higher WSOC/OC) are uncatalyzed, while DPX and CCRT (lower WSOC/OC) have
catalyzed filters. Although SCRTs and CCRT both have DOCs upstream of the DPF, the results suggest
that DOCs, in comparison to DPF types (catalyzed or uncatalyzed) have a minimal effect on the
WSOC/OC ratio. This conclusion, however, does not imply that the DOCs have not contributed in
reducing OC from the total vehicle emissions.
c)

39
Emission Factors of Speciated Organic Compounds
Figures 5.3a and 5.3b present the PM organic compound mass emission factors (EF) for the UDDS
driving cycle of the baseline vehicle as well as the same vehicle equipped with the different after-
treatment technologies noted earlier (CRT, V-SCRT and Z-SCRT respectively). The emission factors of PM
bound PAHs, hopanes and steranes in UDDS range from 2.4 μg/km to 49.4 μg/km for the baseline
vehicle, with an average of 14.5 μg/km and 7.6 μg/km for PAHs and hopanes and steranes, respectively.
The emission factor of n-alkanes and organic acids range from 26.3 μg/km to 3287.2 μg/km with an
average of 745.0 μg/ km and 90.5 μg/km for n-alkanes and organic acids respectively. As shown in Figure
5.3a, low molecular weight PAHs with three to four rings are the largest contributor to the total PAH
emissions. These light PAHs account for 47.8% of the measured total PAHs mass while the contribution
of medium and high molecular weight PAHs are 33.6% and 18.6% respectively. This is consistent with
other studies, which showed that three- and four-ring PAHs are present in HDDV exhaust in very high
levels (Liu et al., 2008; Marr et al., 1999; Riddle et al., 2007). These PAHs are semi-volatile and can be
found in both gas phase and particle form.
As shown in Figure 5.3a and 5.3b, both CRT and SCRT technologies effectively reduced the particle
bound PAH, hopanes and steranes emissions compared with the baseline configuration by more than
99%. For medium and high molecular weight PAHs, the emission levels were below the detection limit of
the analytical method with the introduction of both CRT and SCRT technologies. These higher molecular
weight PAHs are often more carcinogenic according to the International Agency for Research on Cancer
(IARC). In contrast to the non-detectable heavier PAHs, the presence of particle phase light PAHs (even
in small amounts) in the exhaust of vehicles equipped with CRT and SCRT is attributed to the high
volatility of these organic species. Light PAHs have lower vapor pressure and are most likely in the vapor
phase in the hot engine exhaust. After passing through the control devices, these semi-volatile species
may nucleate to form fresh particles, or condense onto existing particles under favorable dilution and
temperature conditions (Kittelson et al., 2006; Vaaraslahti et al., 2004). These compounds may also
condense or absorb on organic particles that have already nucleated. The occurrence of this PM
formation mechanism has also been reported by Wehner et al., (2002) and Yu, (2001). In our studies,
this observation is further supported by the substantial increase in number concentrations of nucleation
mode particles for the vehicles equipped with control devices compared to the baseline truck, as
reported in Section 3. For n-alkanes, there was a higher than 99% reduction in the emission factors after
the introduction of CRT compared to baseline, whereas both V-SCRT and Z-SCRT devices effectively
reduced the n-alkanes emission factors to below the detection limits. All three devices effectively
reduced the organic acid content of the exhaust to under the detection limits.

40
Figure 5-3 (a) Emission factors of PAHs, hopanes and steranes of baseline and control device-
equipped vehicles in UDDS cycle. (b) Emission factors of n-alkanes and acids of baseline and
control device-equipped vehicles in UDDS cycle.

41
Figure 5.4a and 5.4b present the emission factors (EF) of particle bound PAHs, hopanes and steranes,
n-alkanes and organic acids for the cruise driving cycle. The EF of PAHs, hopanes and steranes range
from 0.42 μg/km to 10.17 μg/km with an average of 2.66 μg/km and 2.92 μg/km respectively for the
baseline vehicle. The average emission factors of PAHs, hopanes and steranes at UDDS are 5.5 and 2.6
times higher than those at cruise cycle, respectively. For n-alkanes and organic acids at the cruise cycle,
the emission factors range from 1.74 μg/km to 122.78 μg/km with an average of 36.6 μg/km and 23.9
μg/km for n-alkanes and organic acids respectively. The emission factors are also significantly lower than
their corresponding values at the UDDS cycle. The reduction of these organic compounds may be
attributed to possible adsorption of these species on the large surface area of the catalyst, followed by
oxidation (Heck and Farrauto, 1995; Liu et al., 2008). PAH reduction by oxidation may be more efficient
in the cruise compared to the UDDS cycle because the minimum activation temperature of the catalyst
(for both V-SCRT and Z-SCRT) is reached much faster in the cruise cycle than the UDDS (Polidori et al.,
2008). As the engine speed and load increase to a stable condition in cruise cycle, the exhaust
temperature also increases to a level that enables full function of the catalyst.
All three control devices reduced the emissions of light molecular weight PAHs by more than 99%,
while the emission factors of medium and high molecular weight PAHs after the devices were under the
detection limits for the cruise cycle. The reduction of hopanes and steranes were equally high, i.e.,
97.6%, 98.8% and 99.4% for CRT, Z-SCRT and V-SCRT, respectively. The CRT technology reduced n-
alkanes and acids EF by 96% and 44% respectively, while both SCRT technologies showed a better
performance by reducing n-alkanes and acids to levels below detection limits. Similar results were also
observed for UDDS cycles. The improved performance of the SCRT catalyst may be due to their ability to
break heavy hydrocarbons into smaller molecules (Ueno et al., 1998.).

42
Figure 5-4 (a) Emission factors of PAHs, hopanes and steranes of baseline and control device-
equipped vehicles in cruise cycle. (b) Emission factors of n-alkanes and acids of baseline and
control device-equipped vehicles in cruise cycle.

43
Figures 5.5a, b and c show the concentration ratios of selected PAHs, hopanes and steranes to
organic carbon of PM emissions from the baseline vehicle operating with and without control devices,
running on UDDS (4.5a), and cruise (4.5b) cycles, and similar ratios of recently evaluated HDDV as
reported by Riddle et al., (2007) (4.5c). As shown in these figures, the concentration ratios of the
baseline vehicle displayed very similar profiles for these compounds between UDDS and cruise cycles,
and in very similar magnitude as those observed by Riddle et al., (2007), which confirms the consistency
in the sources of these PM organic tracers in both studies.
As shown in Figure 5.5a, PAHs-to-OC ratios are greatly reduced in vehicles equipped with control
devices compared to baseline vehicle for the UDDS cycle. The average analyte mass (µg) to OC mass (g)
for the PAHs is 227.50 for baseline vehicle, and 10.0, 7.0, 2.3 for CRT, Z-SCRT, V-SCRT respectively, thus
indicating a significant reduction of PAHs contributions to OC in the emissions with the control devices.
The reduction in PAHs is very important from the perspective of public exposure because of their
carcinogenicity (Harvey, 1985; Hewstone, 1994). The significant reduction of the relative contribution of
PAHs to OC suggests that these compounds are either not formed as readily in combustion, or they are
reduced very effectively in after-treatment devices using oxidation catalysts (Liu et al., 2008).
In contrast to PAHs, the ratios of analyte mass (µg) to OC mass (g) for the hopanes and steranes are
in the same order of magnitude for baseline vehicle (102.7) and controlled vehicles (45.1, 54.9 and 89.6
for CRT, Z-SCRT and VSCRT respectively). Hopanes and steranes are exclusively found in lubricating oil.
The similar ratios between retrofitted and baseline vehicles imply that even with the after-treatment
devices, the relative contribution of the oil on the hopanes and steranes emissions are about the same
order of magnitude as the baseline vehicle emissions. It should be noted that the ratio of hopanes and
steranes to OC for the controlled vehicles is lower only by a factor of 2 or less (13%, 53% and 56% for
CRT, Z-SCRT and V-SCRT, respectively) compared to the baseline vehicle. This suggests that the relative
contribution of lubricating oil to the OC emissions in the controlled vehicles is more than half of those in
baseline vehicles, even with the reduction in OC emissions by almost two orders of magnitude (95.0%,
99.2%, 99.2% for CRT, V-SCRT, Z-SCRT, respectively). It is possible that hopanes and steranes are
oxidized at a slightly higher rate than the rest of the lubricating oil. However, a reduction by a factor of
<2 is quite small in the context of the overall OC reduction.
Similar results were also observed in the cruise driving cycle, as shown in Figure 5.5b. The average
analyte mass (µg) to OC mass (g) for the PAHs is 139.6 for baseline vehicle, 8.4 and 5.8 for CRT, Z-SCRT,
respectively. The same ratio for the hopanes and steranes is 242, 92.4 and 45.9 for baseline, CRT and Z-
SCRT, respectively. In general, the reduction efficiencies for high molecular weight PAHs, hopanes and
steranes are consistently higher for the cruise cycle than the UDDS cycle. This is consistent with the fact
that oxidation catalysts are more effectively activated to convert these organics by catalytic combustion
in the cruise than the UDDS cycle, since the activation temperature is reached faster when the vehicles
operate in the cruise cycle (Polidori et al., 2008). By comparison, low molecular weight PAHs, such as
phenanthrene and fluoranthene, are largely in the gas-phase in the hot engine exhaust due to their high
vapor pressure (Zielinska et al., 2004). Thus, their presence in the particle phase suggests that they are
formed by nucleation or (more likely) by condensation onto pre-existing solid particles with the lowering
of temperature as tailpipe emissions reach ambient conditions. Apparently, the effect of atmospheric
dilution, which would favor the partitioning of these species in the gas phase, is outweighed by the
drastic reduction in the exhaust temperature during cooling of the tailpipe (Kittelson et al., 2006;
Vaaraslahti et al., 2004).

44
Figure 5-5 Comparison of the ratios of PAHs, hopanes and steranes to organic carbon
emission factors in μg/g from baseline and controlled vehicles. (a) running on UDDS cycle. (b)
cruise cycle. (c) Ratios of PAHs, hopanes and steranes to organic carbon emission factors in
µg/g as reported by Riddle et al., (2007)

45
Size-segregated Chemical Speciation
The ion and total carbon emission data are further segregated into three size ranges (Figure 5.6), i.e.
10-56nm, 56-180nm and 180-2500nm. The V-SCRT-UDDS, Z-SCRT- cruise, CRT and DPX have displayed
the highest content of sulfate in the nucleation mode. This finding is consistent with the conclusions of
recent emission studies that nuclei mode particles from DPF equipped vehicles are predominantly
sulfates (Grose et al., 2006). However, significant levels of TC were also present in these vehicles. During
the analysis of the physical PM properties (Section 3), we observed that nucleation is suppressed in
CCRT with un-aged catalyst and Horizon equipped with non-catalyst EPF, which have both a higher mass
fraction of total carbon concentrations in all size ranges and less sulfate in nucleation mode PM. Unlike
the SCRT cruise cycles, the UDDS cycles for Z-SCRT are unique in the sense that the emission rates of TC
dominate those of sulfate. This may be again due to higher activation temperature of Zeolite catalysts,
which may impede the conversion of SO2 to sulfate during transient cycles, for which the exhaust
temperature fluctuates continuously. Herner et al., (2007b) reported the critical temperatures (post
after-treatment temperatures) required for Z-SCRT and V-SCRT to trigger nucleation were 373oC and 330
oC, respectively.
Cruise 50 mph
Particle Size Range
Em
issi
on F
acto
r (m
g km
-1)
0.0
0.5
1.0
1.5
2.0
2.5
3.0
CRT® Z-SCRT® DPX Horizon
Nuc UF Acc Nuc UF Acc Nuc UF Acc Nuc UF Acc
a)

46
UDDS
Particle Size Range
Em
issi
on F
acto
r (m
g km
-1)
0.0
1.0
2.0
3.0
4.0
5.0
6.0
7.0
8.0
9.0CRT® ZSCRT® DPX HorizonVSCRT® CCRT®
Nuc UF Acc Nuc UF Acc Nuc UF Acc Nuc UF Acc Nuc UF Acc Nuc UF Acc
Baseline
Particle Size Range
Em
issi
on F
acto
r (m
g km
-1)
0
10
20
30
40
50
60
70
80
90
100
UDDSCrusie 50 mph
Nuc UF Acc Nuc UF Acc
Sodium Ammonium Potassium Chloride
Nitrate Sulfate TC
Figure 5-6 Emission rates of size-resolved PM chemical species. a) Cruise 50 mph, b) Transient
UDDS c) Baseline vehicle.
b)
c)
47
Note: Nucleation (Nuc, 10-56 nm), UF: 56-180 nm and Acc: 180 nm – 2.5µµµµm.
Ammonium is present exclusively in ultrafine PM, and especially in the nucleation mode particles.
The formation of this species may be related to secondary mechanisms rather than being a constituent
of the vehicle exhaust. Heeb et al., (2006) demonstrated the presence of gas-phase ammonia and
particle phase ammonium in the exhaust of vehicles equipped with three way catalysts. They attributed
this formation to catalytic reduction of NO in the exhaust, coupled with the low catalyst's selectivity for
ammonia at the high temperature conditions of the exhaust.
It is interesting to note that ammonium was mainly observed for vehicles equipped with either a
diesel oxidation catalyst (DOC) or a catalyzed filter, i.e. CRT, SCRTs, DPX, whereas vehicles operating
without a DOC upstream of the DPF filter, such the Horizon, showed negligible emissions of ammonium.
The CCRT is a notable exception to this observation. The lower ammonium level for CCRT or Horizon may
also be due to their lower engine volume (5.9L), compared to SCRTs (11 L) and DPX (7.6 L). The
measured ammonium is likely in the form of ammonium sulfate produced by gas-to-particle phase
conversion processes catalyzed by the after-treatment devices. Grose and co-workers demonstrated
that the nano-particles downstream of a CRT – equipped vehicle had a volatility profile similar to
ammonium sulfate and concluded that the sulfates should be neutralized to some extent (Grose et al.,
2006). Based on the experimental observations and discussion above, the formation of fresh nano-
particles, especially for ‘nucleating’ vehicle configurations, may be attributed to a ternary nucleation
process involving sulfuric acid, water vapor and ammonia. Meyer and Ristovski, (2007) demonstrated
ternary nucleation pathway to be an important formation mechanism for diesel nanoparticles at high
engine loads.
Figure 5.6c shows the mass size distribution of the chemical components of PM emissions from the
baseline vehicle. Total carbon concentration outweighs any other species for the baseline vehicle (>99%
of total PM mass concentration). Further, the UDDS cycle of Baseline vehicle emits almost 3-fold higher
TC than the cruise cycle. This can be explained by the shift of TC peaks during cruise cycle in the 100-
180nm (25mg km-1
) size rage to the even larger accumulation mode (180-2500nm, 90mg km-1
) during
UDDS cycle. The higher emission of TC during the transient cycles, however, was not observed for Z-
SCRT and Horizon (Figure 5.6 b). The Z-SCRT-UDDS cycle emitted the least amount of PM mass among all
the retrofitted cycles of Kenworth truck (CRT; SCRT cycles). This particular cycle also lacked a
pronounced nucleation mode which was observed in CRT and other SCRT cycles. Higher activation
temperatures for the Zeolite catalysts can inhibit the nucleation process (as mentioned before)
especially during the fluctuating exhaust temperature of the UDDS cycle. Since a considerable fraction of
TC (mostly OC for retrofitted vehicles) is associated with the nucleation mode, it is likely that the lack of
nucleation can retard condensation of organics on these particles. Emissions of TC from both the
Horizon cycles are low and comparable to the analytical limits of detection; therefore caution should be
exercised in making inferences based on these data.
The size resolved total carbon (TC) is further segregated (in six size classifications of the MOUDI-nano
MOUDI) in EC and OC and is shown in Figure 5.7 a, b. Here we should again emphasize that the EC-OC
data are used to display trends, not necessarily precise values, due to the limitation of the analytical
method as we discussed earlier, related to the use of Al foils for these measurements. OC clearly
dominates EC emissions in vehicles retrofitted with diesel particulate filters, whereas by contrast, EC
(30-40%) is comparable with OC (60-70 %) for the baseline vehicle. The EC is found mostly in the 100-
180nm and 180-2500nm size ranges for the baseline vehicle. This is consistent with previous studies,

48
which also demonstrated that EC peaks in the higher size ranges of UF (> 80nm) as well as in the
accumulation mode (Kleeman et al., 1999; Rose et al., 2006). The dominance of elemental carbon for
the baseline vehicle was also inferred from our volatility analysis (Section 3), of which negligible loss of
PM mass and number during heating process was observed.
Baseline
0
4
8
12
16
20
10-1
8
18-3
2
32-5
6
56-1
00
100-
180
180-
2500
Dp (nm)
EF
(m
g km
-1)
CRT®
0
0.2
0.4
0.6
0.8
10-1
8
18-3
2
32-5
6
56-1
00
100-
180
180-
2500
Dp (nm)
Horizon
0
0.04
0.08
0.12
0.16
0.2
10-1
8
18-3
2
32-5
6
56-1
00
100-
180
180-
2500
Dp (nm)
Z-SCRT®
0
0.1
0.2
0.3
10-1
8
18-3
2
32-5
6
56-1
00
100-
180
180-
2500
Dp (nm)
EF
(m
g km
-1)
DPX
0
0.02
0.04
0.06
0.08
0.1
10-1
8
18-3
2
32-5
6
56-1
00
100-
180
180-
2500
Dp (nm)
EF
(m
g km
-1)
OC
EC
a)
i ii
iii
iv v

49
Baseline
0
20
40
60
80
100
10-1
8
18-3
2
32-5
6
56-1
00
100-
180
180-
250
0
Dp (nm)
EF
(m
g km
-1)
CRT®
0
0.5
1
1.5
2
2.5
3
10-1
8
18-3
2
32-5
6
56-1
00
100-
180
180-
2500
Dp (nm)V-SCRT®
0
0.04
0.08
0.12
0.16
0.2
10-1
8
18-3
2
32-5
6
56-1
00
100-
180
180-
2500
Dp (nm)
EF
(m
g km
-1)
Z-SCRT®
0
0.05
0.1
0.15
0.2
0.25
0.3
10-1
8
18-3
2
32-5
6
56-1
00
100-
180
180-
2500
Dp (nm)
DPX
0
0.05
0.1
0.15
0.2
0.25
0.3
10-1
8
18-3
2
32-5
6
56-1
00
100-
180
180-
2500
Dp (nm)
EF
(m
g km
-1)
EC OC
CCRT®
0
0.04
0.08
0.12
0.16
0.2
10-1
8
18-3
2
32-5
6
56-1
00
100-
180
180-
2500
Dp (nm)
EF
(m
g km
-1)
Horizon
0
0.02
0.04
0.06
0.08
0.1
0.12
10-1
8
18-3
2
32-5
6
56-1
00
100-
180
180-
2500
Dp (nm)
Figure 5-7 a, b: Size-resolved EC/OC mass distribution at a) Cruise mode b) UDDS mode.
b)
iii iv
vii
v vi
ii i
50
For the vehicles equipped with DPF, soot particles are effectively captured, resulting in significant
reduction of EC, hence a reduction in the particle surface area available for the condensation of semi-
volatile organic vapors. On the other hand, the presence of catalysts will oxidize hydrocarbon (HC) and
reduce the level of condensable semi-volatile OC. This will lead to the overall reduction in OC
concentrations in the exhaust. The elimination of larger accumulation mode soot particles favors the
formation and growth of nucleation mode particles by condensation of these organic species onto either
partially or fully neutralized sulfate nano-particles. This is consistent with our findings discussed in the
previous section regarding the increased sulfate content of nucleation mode PM in the DPF- equipped
vehicles. During the UDDS cycle, a generally bimodal distribution of EC-OC was observed. Although
insignificant in quantity, particles from UDDS cycles of DPF equipped vehicles have traces of EC,
especially for the CCRT vehicle. The relatively higher EC fraction (22%) in CCRT might be associated with
the higher accumulation mode observed in its number size distribution (Section 3). The transient cycles
of diesel vehicles are generally known to emit more elemental carbon compared to cruise cycles (Shah
et al., 2004b).
5.4 Conclusions
While comparing with a baseline vehicle, significant reduction (>90%) in EC, OC, WSOC and various
organic compounds (PAHs, hopanes, steranes, n-alkanes and organic acids) emissions is achieved for
vehicles with retrofit devices. The vehicles with significant nucleation (CRT, V-SCRT, Z-SCRT and DPX)
mode particles produced considerable amount of sulfates especially during steady state operations. On
the contrary, the non-nucleating configurations (Horizon, CCRT, and Z-SCRT-UDDS) were associated with
higher amount of total carbon in the form of OC. In general, the transient cycles were associated with
higher EC and OC. Soluble fraction of OC was highest for Horizon followed by SCRTs, DPX and baseline.
Individual ratios of speciated organic compounds to OC mass from the exhaust of baseline vehicle
suggest that PAHs can form in combustion processes or originate from diesel fuel, whereas hopanes and
steranes come from lubricating oils. With the introduction of control devices, the analyte to OC ratios
reduced significantly for PAHs, while the reduction was more modest for hopanes and steranes,
implying that fuel and lubricating oil have substantially different contributions to the OC emitted by
vehicles operating with control devices compared to the baseline vehicle.

51
6. Toxicological Characteristics of Semi-volatile and Non-volatile
Fraction of DEPs from Retrofitted Vehicles
6.1 Introduction
Exposure to DEPs has been linked with adverse health
effects, including airway inflammation (Saldiva et al.,
2002), pulmonary diseases such as asthma and bronchitis
(Rusznak et al., 1994), mitochondrial dysfunction (Hiura et
al., 2000; Seagrave et al., 2007), and lung cancer
(Castranova et al., 2001; Garshick et al., 2004). As discussed
in previous sections, that although PM mass emissions
from retrofitted vehicles are significantly reduced (>90%),
the number-based particles emissions increase under
certain conditions. The chemical composition of particles
emitted from these retrofits has also been shown to be
substantially different than that of the untreated exhaust
(Section 3). These changes in physico-chemical
characteristics of PM emitted from retrofitted vehicles
should also result in their diverse toxicity profiles, both on
per mass and per distance traveled basis, compared to PM
from unregulated vehicles, but this hypothesis remains to
be examined.
The prime focus of this section is to investigate the
oxidative activity of semi-volatile and non-volatile PM
fractions from heavy-duty vehicles operating with and
without emissions control technologies. The oxidative
activity of the collected particles was measured by two
independent assays: 1) the DTT assay, and 2) the
macrophage ROS assay. In addition to assess the toxic
potential of semi-volatile species, the role of transition
metals in inducing the cellular oxidative stress has also been examined by chelating the PM samples. For
a subset of samples, we also used the dihydroxybenzoate (DHBA) assay to measure redox activity, and
determine the ability of aqueous suspensions of PM from to generate hydroxyl radicals from hydrogen
peroxide. Details of the DHBA assay are given by Cho et al (2005)
The results reported will be useful in assessing the efficacy of these control technologies and in
establishing the future needs for additional measures to control these PM species.
This section investigates the toxicological
characteristics of PM from tested vehicles in
comparison to the baseline vehicle. The
oxidative activity was measured by two
different assays – DTT assay and macrophage
ROS assay. The DTT activity was determined for
PM samples collected at both ambient and
elevated temperature (thermally denuded of
semi-volatile species), while ROS activity was
measured only for undenuded samples.
Further, to assess the role of transition metals
in the measured ROS activity, undenuded
samples were chelated using a Chelex®
complexation method, followed by subsequent
ROS analysis.
The study demonstrates that despite an
increase in the intrinsic activity (both DTT and
ROS, per mass basis) of exhaust PM with use of
most control technologies, the overall activity
(expressed per km or per hr) was substantially
reduced for retrofitted configurations
compared to the baseline vehicle. Significant
reduction in DTT activity (by 50-100%) was
observed for thermally-denuded PM from
vehicles with retrofitted technologies (PM with
significant semi-volatile fraction). On the other
hand, Chelex treatment of undenuded PM
samples removed a substantial (≥70 %) fraction
of the ROS activity.
Correlation analysis performed between
measured activity and the chemical
constituents showed that DTT activity is
strongly associated (R=0.94) with the water
soluble organic carbon (WSOC), while the ROS
activity was mostly driven by Fe content of the
PM samples.
52
6.2 Sample Analysis
The oxidative activity of the collected particles has been measured by two independent assays: 1) the
DTT (Dithiothreitol) assay, and 2) the macrophage ROS (Reactive oxygen species) assay. As we discuss
above, we also performed the DHBA assay on a limited subset of samples. For that assay, PM samples
were collected in Biosamplers from the concentrated stream of versatile aerosol concentration
enrichment system (VACES). The PM mass collected in Biosamplers were estimated by a parallel filter
measurement from the same sampling line. Each cycle was repeated until sufficient PM mass (i.e., 3-5
mg) was collected for the analysis. Subsequently, PM collected in Biosamplers was analyzed for DHBA
formation. Given the small number of samples and the different methodology used to collect them
compared to the hi vol samples used for the DTT and ROS assays, these results are preliminary and a
more detailed and comprehensive study should be conducted in the future, if there is sufficient interest
in this assay. Some additional DHBA analysis was performed on left-over portions of the hi vol samples
from selected vehicles and driving cycles (depending on the available PM mass left on the substrates),
but as we noted earlier, these results are far too limited to be considered comprehensive and additional
analysis in a separate study should be considered if deemed necessary.
The DTT assays were performed for denuded and undenuded PM collected on 47 mm Teflon filters
and undenuded PM on HiVol (Teflon-coated glass fiber) filters. Particles deposited on these filters are
first extracted into an aqueous suspension of Milli-Q water by sonication (Ultrasonic Cleaner, Model
5510R-MTH) for 20 minutes. The particle suspension is then incubated for a period between 0-30
minutes with 100mM DTT in 0.1 M phosphate buffer. An aliquot of mixture was added with 0.4 M
TrisHCl (quench reaction), EDTA (Ethylenediaminetetraacetic acid) and 10mM DTNB (Beta dystrobrevin)
solution. The consumption rate of DTT was quantified by the formation of mercaptobenzoate at
different times during the incubation. The assay is calibrated with each experiment using a standard
diesel exhaust sample, whose overall rate varies by less than 10% among the experiments performed.
The methodological details of this assay are provided by Cho et al., (2005).
Sub-sections of the HiVol PM samples were further analyzed for ROS activity by macrophage ROS
assay. Samples were extracted with 15 mL of high purity (18 mega-ohm) water. Extractions were
performed in 20 mL acid-leached, capped, polypropylene tubes, with continuous agitation for 16 hours
at room temperature in the dark. Extracts were filtered through acid-leached 0.22 µm polypropylene
syringe filters. The ROS-activity of the PM extracts was measured by in vitro exposure to rat alveolar
macrophage (NR8383, ATCC# CRL-2192) cells using 2’,7’-dichlorofluorescin diacetate (DCFH-DA) as the
fluorescent probe. DCFH-DA, a membrane permeable compound, is de-acetylated by cellular esterases
generating 2’,7’-dichlorodihydrofluorescein (DCFH). The oxidation of DCFH by ROS within the cell yields
2’,7’-dichlorofluorescein (DCH), which is highly fluorescent and is monitored using a plate reader
method. All samples, as well as positive and negative controls were analyzed in triplicate (3-wells). A
minimum of six dilutions (each of them in triplicate) of every sample extract was run to ensure that a
linear dose-response region could be identified. Methodological procedures of this assay are described
in Landreman et al., (2008). Uncertainty in ROS method was estimated by propagating the standard
deviation of triplicate ROS measurements with standard deviation of the applied method blank. These
values ranged from 5 to 78% (median = 20%, n=24). Sub-samples of the primary water extracts (samples
and controls) were further processed by chelation with the immobilized ligand iminodiacetate (Chelex
chromatography) to remove the metal ions. For the Chelex treatment, mini-columns (1 mL
polypropylene with Teflon frits) of Chelex were prepared with 0.2 g of 18 mega-ohm water-slurried Na-
Chelex. Columns were rinsed with high purity water and buffered with 0.1 M sodium acetate. PM

53
extracts (~1.75 mL) were processed through the columns, under gravity flow, in a solid phase extraction
manifold, at a flow rate of ~1.0 mL/min. The Chelex-processed extract was collected and immediately
assayed for ROS-activity and subsequent elemental analysis by magnetic sector inductively-coupled
plasma mass spectrometry (SF-ICPMS). Control samples were processed through the Chelex columns to
ensure that the treatment did not produce ROS active species or inhibit the activity of Zymosan (a β-1,3
polysaccharide of D-glucose). Zymosan was used as a positive control as it is recognized by TLR-2 (Toll-
like receptors) on macrophage cells, activating a strong immuno-chemical and ROS response (Ciapetti et
al., 1998). Blank-corrected ROS fluorescence data were normalized to the response of a standardized
unit of Zymosan to correct for minor variations in method sensitivity between assay batches. ROS
activity is therefore reported in terms of Zymosan units to facilitate the comparison of various data sets.
None of the Chelex method blanks exhibited detectable ROS activity, and Chelex column blanks (high-
purity water eluants) produced no measurable (<5%) suppression of ROS activity in Zymosan positive
controls.
6.3 Results
DTT Activity
Blank-subtracted (filter blank DTT~0-0.0005 n-mole µg-1
min-1
) average DTT consumption rates,
normalized per unit mass of PM are reported in Figure 6.1 a,b,c for various vehicle configurations. The
vehicle with the Horizon trap (School Bus) had the highest per mass DTT activity (0.16-0.19 n-mole µg-1
min-1
for cruise and UDDS) irrespective of driving conditions. The DTT consumption rates from both
Vanadium and Zeolite-based SCRTs are on the same order of magnitude (0.01-0.02 n-mole µg-1
min-1
). It
is interesting to note that when the selective catalytic reduction (SCR) section from SCRT is removed
from the exhaust stream and the vehicle is operated with only CRT (i.e., the DOC+ uncatalyzed filter),
the DTT activity increased by a factor of almost 3, both for cruise and UDDS cycles. The CCRT (Catalyzed
filter + DOC) is the most efficient among the test fleet with DTT rates as low as 0.006 n-mole µg-1
min-1
.
Of particular note is the elevated level of DTT activity for the DPX and Horizon vehicles. The baseline
vehicle emitted PM with similar DTT activity to those of newer vehicles with control technologies.
Figure 6.1 also reports the DTT values for the thermo denuded filters. There is a significant reduction
(50-100%) in DTT activity as particles are heated to 150oC and their semi-volatile component is removed.
The baseline vehicle, however, did not show any alteration in DTT response between denuded and
undenuded exhaust stream, except while idling. This is because of the highly refractory nature (mostly
soot) of these particles (Section 4).

54
Cruise
Bas
elin
e
Bas
elin
e-T
D15
0
CR
T
CR
T-T
D15
0
V-S
CR
T
V-S
CR
T-T
D15
0
Z-S
CR
T
Z-S
CR
T-T
D15
0
CC
RT
CC
RT
-TD
150
DP
X
DP
X-T
D15
0
Hor
izon
Hor
izon
-TD
150
DT
T (
n-m
ole
µg-1
min
-1)
0.00
0.02
0.04
0.16
0.18
0.20
UDDS
Bas
elin
e
Bas
elin
e-T
D15
0
CR
T
CR
T-T
D 1
50
V-S
CR
T
V-S
CR
T-T
D15
0
Z-S
CR
T
Z-S
CR
T-T
D15
0
CC
RT
CC
RT
-TD
150
DP
X
DP
XT
D15
0
Hor
izon
Hor
izon
-TD
150
DT
T (
n-m
ole
µg-1
min
-1)
0.00
0.02
0.04
0.06
0.08
0.16
0.18
NA
a)
b)
Undenuded
Undenuded
Thermo denuded (150 oC)
Thermo denuded (150 oC)

55
Idle
Bas
elin
e-Id
le
Bas
elin
e-T
D15
0
Bas
elin
e-T
D23
0
DP
X
DP
X-T
D23
0
Hor
izon
Hor
izon
-TD
150
DT
T (
n-m
ole
µg-1
min
-1)
0.00
0.02
0.04
0.06
0.08
0.10
Figure 6-1 a, b, c: DTT consumption in n-moles min-1 μg-1 of PM of thermo-denuded and
undenuded PM. (DTT data are normalized to thermo-denuded PM and undenuded PM,
respectively)
The increased DTT activity of the semi-volatile PM fraction is further highlighted by comparing with
their corresponding semi-volatile PM mass and number fractions (Figure 6.2). For vehicles with (soot
removing) control devices, the semi-volatile fraction contributed roughly 70-100% of the net oxidative
activity compared to 20-30% for baseline vehicle. The sole exception is the CCRT vehicle, which hardly
produced any DTT activity from its semi-volatile fraction, despite emitting 45% of semi-volatile PM by
mass and 37% by number. For this vehicle (CCRT), the relatively low level of activity has originated from
its residual non-volatile fractions. In general, particle number-based volatility, which is predominantly
driven by the evaporation of the sub-50 nm, so-called nucleation mode particles (Kittelson, 1998),
followed the activity trends better than the PM mass volatility.
Undenuded
Thermo denuded (150 oC)
Thermo denuded (230 oC)
c)
Undenuded
Thermo denuded (150 oC)
Thermo denuded (230 oC)

56
Bas
elin
e-C
ruis
e
Bas
elin
e-U
DD
S
Bas
elin
e-Id
le
CR
T-C
ruis
e
CR
T-U
DD
S
V-S
CR
T-C
ruis
e
V-S
CR
T-U
DD
S
Z-S
CR
T-C
ruis
e
Z-S
CR
T-U
DD
S
CC
RT
-UD
DS
DP
X-C
ruis
e
DP
X-U
DD
S
DP
X-I
dle
(230
oC
)
Hor
izon
-Cru
ise
Hor
izon
-UD
DS
Hor
izon
-Idl
e
Oxi
dativ
e A
ctiv
ity fr
om S
emi-V
olat
ile F
ract
ion
0.0
0.2
0.4
0.6
0.8
1.0
1.2
Sem
i-Vol
atile
PM
Mas
s /N
umbe
r F
ract
ion
0.0
0.2
0.4
0.6
0.8
1.0
1.2
Oxidative Activity from Semi-Volatile Fraction Semi-Volatile PM Mass Fraction Semi-Volatile PM Number Fraction
Figure 6-2 Relationship between oxidative activity and semi-volatile PM fraction at 150◦C.
[Showing good correlation of DTT (filled circles) with particle number (hollow diamonds) and poor
correlation with PM mass (bars)]
Note:
a)DTT activity from semi-volatile fraction= [(DTT, undenuded, n-mole km-1
min-1
) - (DTT at150oC, n-mole
km-1
min-1
)] / [DTT ,Undenuded, n-mole km-1
min-1
)]
b) Semi-volatile PM mass/number fraction =[(PM undenuded, mg or number km-1
) - (PM at 150oC, mg or
number km-1
)] / [(PM undenuded, mg or number km-1
)]
DPX Idle: DTT thermo denuded at 230oC; V-SCRT-Cruise, Horizon-Idle: Number volatility data not
available
The DTT results expressed per unit vehicle distance traveled (Figure 6.3 a,b,c) provide a better idea of
the total oxidative load imparted on the environment by these vehicles. They also provide a quantitative
Total Oxidative Activity (1): Sum of oxidative activity from semi-volatile and non-
volatile fraction

57
assessment of the effectiveness of these after treatment devices. While we observed a comparable or
lower oxidative response of the baseline vehicle per unit mass of PM, its net DTT consumption (per km)
is substantially higher (>3 times) than retrofitted vehicles. This is because the baseline truck emits more
than one order of magnitude higher particulate mass than other vehicles (Section 3).
Cruise
Bas
elin
e
CR
T
V-S
CR
T
Z-S
CR
T
CC
RT
DP
X
Hor
izon
DT
T(n
-mol
e m
in-1
km
-1)
0
300
600
900
1200
1500
DT
T(n
-mol
e m
in-1
km
-1)
0
100
200
300
400
500
UDDS
Bas
elin
e
CR
T
V-S
CR
T
Z-S
CR
T
CC
RT
DP
X
Hor
izon
DT
T(n
-mol
e m
in-1
km
-1)
0
1500
3000
4500
6000
7500
DT
T(n
-mol
e m
in-1
km
-1)
0
500
1000
1500
2000
2500
a)
NA
b)

58
Idle
Bas
elin
e
DP
X
Hor
izon
DT
T(n
-mol
e m
in-1
hr-1
)
0
30000
60000
90000
120000
150000
DT
T(n
-mol
e m
in-1
hr-1
)
0
6000
12000
18000
24000
30000
Figure 6-3a,b,c: DTT consumption per unit distance ( in n-moles min-1 km-1) traveled by
vehicles for Cruise and UDDS cycles and per hour( in n-moles min-1 hr-1) for Idle.
Macrophage ROS activity
Figure 6.4 shows the results of macrophage ROS assay conducted on the water extracts of exhaust
PM samples from test vehicles. The results have been expressed both on a per mass of PM emitted basis
(µg ROS activity/mg of PM) (Figure 6.4a) as well as ROS activity per km (or per hr for idle) of vehicle
driven (Figure 6.4b). The ROS activity per mass of particles emitted from all retrofitted configurations is
higher than the baseline truck, with a sole exception of the hybrid vehicle. Again, the highest activity is
observed for the school bus, which has been shown to be one of the most efficient vehicles in
controlling both mass and number emissions (>99 %; Section 3). It is interesting to note that the hybrid
vehicle, with similar particle mass and number emissions as that of the school bus, yields the lowest ROS
activity. The DPX vehicle, which is also quite efficient in reducing PM mass emissions [up to 95 %
(Section 3)], generates particles with high ROS activity (up to ~ 4600 µg of Zymosan units/mg of PM). Of
particular note are also the elevated ROS levels observed for both vanadium and Zeolite based SCRTs
compared to the baseline vehicle. Thus, although SCRTs effectively remove the targeted pollutants for
which they were designed (i.e., hydrocarbons and NOx) in the exhaust emissions (Herner et al., 2009),
their in-built catalysts appear to increase the fraction of certain redox active species in DEPs.
c)

59
Vehicles
Baseline V-SCRT Z-SCRT DPX School Bus Hybrid
µµ µµg o
f Zym
osan
/mg
of P
M
0
400
800
1200
5000
10000
15000
20000
25000Cruise UDDS Idle
(a)
Vehicles
Baseline V-SCRT Z-SCRT DPX School Bus Hybrid
µµ µµg o
f Zym
osan
/km
(cr
uise
and
UD
DS
)
0.0
5.0e+3
1.0e+4
1.5e+4
2.0e+4
2.5e+4
3.0e+4
3.5e+4
6.0e+4
8.0e+4
1.0e+5
µµ µµg o
f Zym
osan
/hr
(Idl
e)
0
5e+3
1e+4
2e+4
2e+4
3e+4
3e+4
4e+4
4e+4Cruise UDDS Idle
(b)
Figure 6-4 Reactive Oxygen Species (ROS) activity of PM from the tested vehicles, expressed
as (a) per mass of PM, and (b) per km (or hr for idle) of vehicle driven.

60
It is of particular note that, although per PM mass activity is increased by most of the control
technologies, all of the retrofitted configurations are efficient in reducing the per km (or per hr) ROS
activity, compared to the baseline vehicle. Again, this reduction is a result of the lower particulate mass
emissions (by more than one order of magnitude) from retrofitted configurations compared to the
baseline truck (Section 3). The decrease in ROS activity is, however, not linear with the overall PM mass
reduction in retrofitted vehicles. For example, an approximate 10-times reduction in PM mass emission
achieved by Z-SCRT (cruise) lowers the ROS activity (per km) by only 3-4 times. The contrast between
distance and mass based activity is consistent with the measurements using DTT assay. These findings
have potential implications from the perspective of human exposure and risk assessment, and
underscore the importance of both the intrinsic toxicity of PM, and its mass emission rate, while
evaluating the net environmental impacts of an after-treatment technology.
Figure 6.5 shows the percent removal of ROS activity after Chelex treatment of the exhaust PM
extracts from test vehicles under different driving cycles. To emphasize the correspondence between
water-soluble metals and ROS activity, the percent removal of the sum of major metals from respective
PM samples is also shown (Figure 6.5). Chelex treatment of DEPs water extracts removed a very large
and fairly consistent fraction of ROS activity across most of the vehicles. The reduction in ROS activity
averages at 77 (±20) % (range: 36% for DPX-idle to 100 % for baseline-UDDS and hybrid vehicles). The
substantial reduction in ROS activity after metals chelation and removal highlights the dominant
contribution of water soluble metals to ROS activity of DEPs.
0
20
40
60
80
100
120
Ba
seli
ne
V-S
CR
T
Z-
SC
RT
DP
X
Sch
oo
l B
us
Ba
seli
ne
V-S
CR
T
Z-S
CR
T
DP
X
Sch
oo
l B
us
Hy
bri
d
V-S
CR
T
Z-
SC
RT
DP
X
Sch
oo
l B
us
Cruise UDDS Idle
% R
em
ov
al
ROS activity
Metals
Figure 6-5 Percent removal of ROS activity in relation to that of aggregate water soluble
metals after Chelex treatment of the exhaust PM samples from test vehicle-configurations
under different driving cycles.

61
Association between Chemical Species and Oxidative Activity
To assess the contribution of various chemical species to the PM oxidative potential, regression
analysis was conducted between the activity measured by two assays (DTT and macrophage ROS assay)
and major chemical constituents. The Pearson correlation coefficient (R) and the associated significance
levels (p-value) have been calculated and shown in Table 6.1 for the correlation of different chemical
species with DTT values. The DTT was significantly correlated with WSOC (R=0.94, p<0.01) and organic
acids (sum, R=0.91; p<0.01) and moderately correlated with organic carbon (R=0.76, P=0.02). All other
species, including inorganic ions, PAHs, EC, and alkanes either have low or negative correlation.
WSOC is a complex mixture of diverse group of species, including dicarboxylic acids, poly acidic
compounds, polyethers etc. (Decesari et al., 2000). Because of their hygroscopic nature, WSOC acts as
surrogate for cloud condensation nuclei (Hori et al., 2003). Besides the well-documented implications of
WSOC on global radiative balance, our work here indicates its relevance in health impacts, at least in the
context of PM oxidative properties. More research however, is needed to identify the organic
compounds present in water soluble components in DEPs. Only a few organic acids, constituting a small
fraction (2-5% in most cases) of WSOC, were measured. Thus, it is difficult to conclude what specific
species contribute to the overall WSOC and the related DTT consumption.
Table 6-1 Correlation coefficient (R) and significance level (P) for DTT activity and selected
chemical species
Species Correlation with DTT
R P
EC -0.35 0.37
OC 0.76 0.02
NO3- -0.09 0.77
SO42-
-0.32 0.27
NH4- -0.25 0.26
K+ 0.43 0.20
Cl- 0.34 0.15
WSOC 0.94 <0.01
Alkanes (Alk.) 0.03 0.54
PAHs -0.26 0.75
Organic Acids (OA) 0.91 <0.01
On the other hand, ROS activity was found to be reasonably correlated with several transition metals
such as Fe, Cr, Mn and Co (R>0.60; p<0.05) as shown in Table 6.2. The highest correlation was observed

62
for Fe (R=0.93; p=0.00), followed by Cr (R=0.67; p=0.00), Mn (R=0.62, p=0.01) and Co (R=0.61; p=0.04).
Other metals (Mg, Al, Ca, V, Ni and Ba), semi-metals (As) and non-metals (P and S) are not significantly
correlated with ROS activity.
Table 6-2 Correlation coefficients and associated levels of significance for the regression
between ROS activity and major water-soluble metals of PM
Elements Correlation with ROS
R P
Mg -0.19 0.36
Al 0.38 0.07
P 0.27 0.21
S 0.13 0.53
Ca -0.01 0.95
V -0.02 0.92
Cr 0.67 0.00
Mn 0.62 0.01
Fe 0.93 0.00
Co 0.61 0.04
Ni 0.22 0.31
Cu 0.47 0.02
Zn 0.46 0.02
As 0.03 0.89
Cd 0.50 0.01
Ba 0.31 0.15
Pb 0.47 0.02
Fe is among the most abundant transition metals in DEPs and is generally present in two oxidation
states, Fe (II) and Fe (III). The solubility of Fe (II) is much higher than that of Fe (III); aqueous equilibrium
concentrations of amorphous ferrous and ferric hydroxide [am-Fe(OH)2 and am-Fe(OH)3] are nearly 10–5
M and 10–10
M, respectively (Nico et al., 2009). The redox cycling of Fe, generating an array of free
radicals (e.g. OH*, O2*-, and HO2*) through Fenton reaction, is well documented (Chen and Lippmann,
2009; Rose and Waite, 2005; Valko et al., 2005; Welch et al., 2002). Although, the exact mechanism of

63
the reaction is still a matter of debate, Fe (II) catalyzed reduction of molecular oxygen to release
hydroxyl radicals [Haber Weiss reaction; (Winterbourn, 1987)] is considered to be largely responsible in
Fe mediated toxicity. The comparatively higher water solubility of Fe (II) further makes it more
bioavailable to probably participate in the reactions yielding ROS activity of DEP extracts.
6.4 Conclusions
This investigation explores the toxicological characteristics of the DEPs, emitted from retrofitted
vehicles, in comparison to the baseline vehicle (without any control technology). The oxidative activity
of the collected particles has been measured by two independent assays: 1) the DTT assay, and 2) the
macrophage ROS assay. The effect of semi-volatile species on DTT assay was determined by comparing
the DTT activity for PM samples collected at both ambient and elevated temperature. While, the
contribution of transition metals in ROS activity was assessed by chelating the PM samples using a
Chelex®
complexation method.
The study demonstrates that despite generally similar reductions in PM mass emissions from diesel
vehicles by various control technologies, the intrinsic oxidative activity (both DTT and ROS) of the
emitted particles may vary dramatically with retrofit types. Although, mass based levels (µg/mg of PM)
increased with the application of after-treatment devices, a significant reduction was observed in the
overall oxidative activity (per km for cruise and UDDS and per hr for idle) for retrofitted configurations,
compared to the baseline vehicle.
A substantial fraction of DTT activity of DEPs was associated with the semi-volatile fraction of the
particles as demonstrated by a significant reduction in the activity (by 50-100%) observed for thermally-
denuded PM. On the other hand, non-volatile transition metals drive the response of ROS assay as
indicated by a substantial removal (≥70 %) of the ROS activity after Chelex treatment of the PM samples.
A univariate regression analysis further supported that DTT activity is strongly associated (R=0.94) with
the water soluble organic carbon (WSOC), while Fe is responsible for most of the variability (R=0.93) in
ROS levels.

64
7. List of Publications from this Study
1. Biswas, S., Hu, S.H., Verma, V., Herner, J.D., Robertson, W.H., Ayala, A., Sioutas, C., 2008. Physical
properties of particulate matter (PM) from late model heavy-duty diesel vehicles operating with
advanced PM and NOx emission control technologies. Atmospheric Environment 42 (22), 5622-
5634.
2. Biswas, S., Verma, V., Schauer, J.J., Sioutas, C., 2009. Chemical speciation of PM emissions from
heavy-duty diesel vehicles equipped with diesel particulate filter (DPF) and selective catalytic
reduction (SCR) retrofits. Atmospheric Environment 43 (11), 1917-1925.
3. Pakbin, P., Ning, Z., Schauer J. J., Sioutas, C. 2009. Characterization of particle bound organic
carbon from diesel vehicles equipped with advanced emission control technologies,
Environmental Science and Technology 43 (13), 4679–4686.
4. Biswas, S., Verma, V., Schauer, J.J., Cassee, F.R., Cho, A.K., Sioutas, C., 2009. Oxidative potential of
semi-volatile and non volatile particulate matter (PM) from heavy-duty vehicles retrofitted with
emission control technologies. Environmental Science & Technology 43 (10), 3905-3912.
5. Verma, V., Shafer, M.M., Schauer, J.J. and Sioutas, C., 2010. Contribution of transition metals in
the reactive oxygen species activity of PM emissions from retrofitted heavy-duty vehicles.
Atmospheric Environment, 44 (39), 5165-5173.
65
8. Major Conclusions
This study has led to the following general conclusions.
� The newer diesel engines with emission control devices are very efficient in reducing the mass
emission of particulate matter. However, enhanced formation of nucleation mode particles is
observed in the exhausts of some retrofitted configurations. The vast majority of these nucleation
mode particles are semi-volatile in nature.
� The total emissions (per distance of vehicle traveled) of the major chemical species (e.g. elemental
and organic carbon) are substantially reduced in the retrofitted vehicles compared to the baseline
vehicle. However, sulfate emissions increase for the configurations with enhanced nucleation mode
particles in their exhaust. Although the retrofitted vehicles emit less water soluble organic carbon
(WSOC) per mile of vehicle driven, the per PM mass water soluble fraction of the organic carbon
(WSOC/OC) is increased for most configurations.
� With the introduction of retrofit control devices, the individual ratios of speciated organic
compounds to OC are reduced significantly for PAHs, while the reduction was more modest for
hopanes and steranes, implying that fuel and lubricating oil have substantially different
contributions to the OC emitted by vehicles operating with control devices compared to the
baseline vehicle. We hypothesize that PAHs can form in combustion processes and/or originate
from diesel fuel, whereas hopanes and steranes come from lubricating oils.
� Despite an increase in the intrinsic oxidative activity (both DTT and ROS, per mass basis) of exhaust
PM with the use of control technologies for most configurations, the overall activity (expressed per
km or per hr) was substantially reduced for retrofitted configurations compared to the baseline
vehicle.
� The semi-volatile fraction of the exhaust particles was observed to be highly oxidative in nature as
demonstrated by a significant reduction in DTT activity (by 50-100%) observed for thermally-
denuded PM. However, non-volatile species - particularly transition metals, are also responsible in
cellular oxidative stress, as indicated by a substantial removal (≥70 %) of the ROS activity after
Chelex treatment of the PM samples.
� The correlation analysis showed that DTT activity is strongly associated (R=0.94) with the water
soluble organic carbon (WSOC), while Fe is responsible for most of the variability (R=0.93) in ROS
levels.
� The DTT and ROS assays, used in this study are two independent and intrinsically different types of
analyses, and probably, are based on the generation of different oxidizing species by chemical PM

66
constituents. However, both of these assays provided important information for elucidating the
health risks related to DEPs exposure from heavy-duty vehicles.
� An important caveat of the toxicological findings of this study is that they are all based on molecular
or cellular assays that examine the toxicity of the PM suspension collected from a given vehicle and
driving configuration based on PM mass. By their nature and design, these investigations did not
take into account important parameters determining the toxicity and overall health effects
attributable to the inhalation of an aerosol , such as particle size. The substantial reduction in the
overall particle size distribution of newer vehicles creates an aerosol with a much higher lung
deposition fraction than the baseline vehicle, and with considerably different toxicokinetics inside
the human body once inhaled. Such important investigations can only be addressed by in vivo
inhalation exposure studies to these aerosols, whether using animal models or human volunteers
(or both), and are greatly needed in order to provide a more complete perspective to the results of
this study.
9. Acknowledgments
We would like to acknowledge the following people for their contribution and assistance to the study.
• South Coast Air Quality Management District
o Jean Ospital, Andrea Polidori
• California Air Resources Board:
o Jorn Herner, Ralph Rodas, George Gatt, William H. Robertson, Keshav Sahay.
• University of Southern California (USC)
o Vishal Verma, Subhasis Biswas, Zhi Ning, Harish Phuleria, Ehsan Arhami, Payam
Pakbin, Michael Geller
• University of Wisconsin Madison
o James Schauer, Martin, M. Shafer, Mike Olsen
• University of California Los Angeles
o John Froines, Arthur Cho ,Debra A Schmitz, Emma Di Stefano

67
10. References
Abdul-Khalek, I., Kittelson, D.B., Brear, F., 1999. The influence of dilution conditions on diesel exhaust
particle size distribution measurements. Society of Automotive Engineers Technical Paper Series No.
1999-01-1142.
Ayala, A., Kado, N.Y., Okamoto, R.A., Holmen, B.A., Kuzmicky, P.A., Kobayashi, R., Stiglitz, K.E., 2002.
Diesel and heavy-duty transit bus emissions over multiple driving schedules: regulated pollutants and
project overview. Society of Automotive Engineers Technical Paper Series No. 2002-01-1722.
Bagley, S.T., Gratz, L.D., Johnson, J.H., McDonald, J.F., 1998. Effects of an oxidation catalytic converter
and a biodiesel fuel on the chemical, mutagenic, and particle size characteristics of emissions from a
diesel engine. Environmental Science & Technology 32 (9), 1183-1191.
Bayona, J.M., Markides, K.E., Lee, M.L., 1988. Characterization of Polar Polycyclic Aromatic-Compounds
in a Heavy-Duty Diesel Exhaust Particulate by Capillary Column Gas-Chromatography and High-
Resolution Mass-Spectrometry. Environmental Science & Technology 22 (12), 1440-1447.
Biswas, S., Ntziachristos, L., Moore, K.F., Sioutas, C., 2007. Particle volatility in the vicinity of a freeway
with heavy-duty diesel traffic. Atmospheric Environment 41 (16), 3479-3493.
Burtscher, H., 2005. Physical characterization of particulate emissions from diesel engines: a review.
Journal of Aerosol Science 36 (7), 896-932.
Castranova, V., Ma, J.Y.C., Yang, H.M., Antonini, J.M., Butterworth, L., Barger, M.W., Roberts, J., Ma,
J.K.H., 2001. Effect of exposure to diesel exhaust particles on the susceptibility of the lung to
infection. Environmental Health Perspectives 109 (Supplement 4), 609-612.
Chase, R.E., Duszkiewicz, G.J., Jensen, T.E., Lewis, D., Schlaps, E.J., Weibel, A.T., Cadle, S., Mulawa, P.,
2000. Particle mass emission rates from current-technology, light-duty gasoline vehicles. Journal of
the Air & Waste Management Association 50 (6), 930-935.
Chen, L.C., Lippmann, M., 2009. Effects of metals within ambient air particulate matter (PM) on human
health. Inhalation Toxicology 21 (1), 1-31.

68
Cho, A.K., Sioutas, C., Miguel, A.H., Kumagai, Y., Schmitz, D.A., Singh, M., Eiguren-Fernandez, A., Froines,
J.R., 2005. Redox activity of airborne particulate matter at different sites in the Los Angeles Basin.
Environmental Research 99 (1), 40-47.
Ciapetti, G., Granchi, D., Verri, E., Savarino, L., Cenni, E., Savioli, F., Pizzoferrato, A., 1998. Fluorescent
microplate assay for respiratory burst of PMNs challenged in vitro with orthopedic metals. Journal of
Biomedical Materials Research 41 (3), 455-460.
Decesari, S., Facchini, M.C., Fuzzi, S., Tagliavini, E., 2000. Characterization of water-soluble organic
compounds in atmospheric aerosol: A new approach. Journal of Geophysical Research-Atmospheres
105 (D1), 1481-1489.
Fraser, M.P., Cass, G.R., Simoneit, B.R.T., 1998. Gas-phase and particle-phase organic compounds
emitted from motor vehicle traffic in a Los Angeles roadway tunnel. Environmental Science &
Technology 32 (14), 2051-2060.
Garshick, E., Laden, F., Hart, J.E., Rosner, B., Smith, T.J., Dockery, D.W., Speizer, F.E., 2004. Lung cancer in
railroad workers exposed to diesel exhaust. Environmental Health Perspectives 112 (15), 1539-1543.
Geller, V.D., Sardar, S.B., Phuleria, H., Fine, P.N., Sioutas, C., 2005. Measurements of particle number
and mass concentrations and size distributions in a tunnel environment. Environmental Science &
Technology 39 (22), 8653-8663.
Grose, M., Sakurai, H., Savstrom, J., Stolzenburg, M.R., Watts, W.F., Morgan, C.G., Murray, I.P., Twigg,
M.V., Kittelson, D.B., Mcmurry, P.H., 2006. Chemical and physical properties of ultrafine diesel
exhaust particles sampled downstream of a catalytic trap. Environmental Science & Technology 40
(17), 5502-5507.
Hameri, K., Vakeva, M., Aalto, P.P., Kulmala, M., Swietlicki, E., Zhou, J., Seidl, W., Becker, E., O'Dowd,
C.D., 2001. Hygroscopic and CCN properties of aerosol particles in boreal forests. Tellus Series B-
Chemical and Physical Meteorology 53 (4), 359-379.
Hansen, K.F., Jensen, M.G., Ezerman, N., 2001. Measurement of the ‘‘true’’ efficiency of a CRT filter.
Report to Danish Road Safety and Transport Agency /http://www.fstyr.dk/sw24048.aspS.
Harris, S.J., Maricq, M.M., 2001. Signature size distributions for diesel and gasoline engine exhaust
particulate matter. Journal of Aerosol Science 32 (6), 749-764.
Harrison, R.M., Tilling, R., Romero, M.S.C., Harrad, S., Jarvis, K., 2003. A study of trace metals and
polycyclic aromatic hydrocarbons in the roadside environment. Atmospheric Environment 37 (17),
2391-2402.
Harvey, R.D. (1985). Polycyclic Hydrocarbons and Carcinogenesis. American Chemical Society,
Washington, DC.

69
Heck, R.M., Farrauto, R.J. (1995). Catalytic Air Pollution Control: Commercial Technology. John Wiley &
Sons, New York.
Heeb, N.V., Forss, A.M., Bruhlmann, S., Luscher, R., Saxer, C.J., Hug, P., 2006. Three-way catalyst-induced
formation of ammonia-velocity- and acceleration-dependent emission factors. Atmospheric
Environment 40 (31), 5986-5997.
Herner, J.H., Robertson, W.H., Ayala, A., 2007a. Investigation of ultrafine particle number measurements
from a clean diesel truck using the European PMP protocol. Society of Automotive Engineers
Technical Paper Series No. 2007-01-1114.
Herner, J.H., Robertson, W.H., Ayala, A., Chang, O., Biswas, S., Sioutas, C., 2007b. Nucleation mode
particle emissions from in-use heavy duty vehicles equipped with DPF and SCR retrofits. American
Association for Aerosol Research. 26th Annual Aerosol Conference, September 24–18, 2007 Reno,
NV.
Herner, J.H., Hu, S., Robertson, W.H., Huai, T., Collins, J.F., Dwyer, H., Ayala, A., 2009. Effect of advanced
aftertreatment for PM and NOx control on heavy-duty diesel truck emissions. Environmental Science
& Technology 43 (15), 5928–5933.
Hewstone, R.K., 1994. Health, Safety and Environmental Aspects of Used Crankcase Lubricating Oils. Sci
Total Environ 156 (3), 255-268.
Hiura, T.S., Li, N., Kaplan, R., Horwitz, M., Seagrave, J.C., Nel, A.E., 2000. The role of a mitochondrial
pathway in the induction of apoptosis by chemicals extracted from diesel exhaust particles. Journal
of Immunology 165 (5), 2703-2711.
Holmen, B.A., Qu, Y.G., 2004. Uncertainty in particle number modal analysis during transient operation
of compressed natural gas, diesel, and trap-equipped diesel transit buses. Environmental Science &
Technology 38 (8), 2413-2423.
Hori, M., Ohta, S., Murao, N., Yamagata, S., 2003. Activation capability of water soluble organic
substances as CCN. J. Aerosol Sci. 34 (4), 419-448.
Hu SH, Herner JD, Shafer M, et al., 2009 Metals emitted from heavy-duty diesel vehicles equipped with
advanced PM and NOX emission controls. ATMOSPHERIC ENVIRONMENT.43 (18), 2950-2959
Jung, H.J., Kittelson, D.B., 2005. Characterization of aerosol surface instruments in transition regime.
Aerosol Science and Technology 39 (9), 902-911.
Kittelson, D.B., 1998. Engines and nanoparticles: A review. Journal of Aerosol Science 29 (5-6), 575-588.

70
Kittelson, D.B., Watts, W.F., Johnson, J.P., Rowntree, C., Payne, M., Goodier, S., Warrens, C., Preston, H.,
Zink, U., Ortiz, M., Goersmann, C., Twigg, M.V., Walker, A.P., Caldow, R., 2006. On-road evaluation of
two Diesel exhaust aftertreatment devices. Journal of Aerosol Science 37 (9), 1140-1151.
Kleeman, M.J., Schauer, J.J., Cass, G.R., 1999. Size and composition distribution of fine particulate matter
emitted from wood burning, meat charbroiling, and cigarettes. Environmental Science & Technology
33 (20), 3516-3523.
Kuhn, T., Biswas, S., Sioutas, C., 2005a. Diurnal and seasonal characteristics of particle volatility and
chemical composition in the vicinity of a light-duty vehicle freeway. Atmospheric Environment 39
(37), 7154-7166.
Kuhn, T., Krudysz, M., Zhu, Y.F., Fine, P.M., Hinds, W.C., Froines, J., Sioutas, C., 2005b. Volatility of indoor
and outdoor ultrafine particulate matter near a freeway. Journal of Aerosol Science 36 (3), 291-302.
Kwon, S.B., Lee, K.W., Saito, K., Shinozaki, O., Seto, T., 2003. Size-dependent volatility of diesel
nanoparticles: Chassis dynamometer experiments. Environmental Science & Technology 37 (9), 1794-
1802.
Landreman, A.P., Shafer, M.M., Hemming, J.C., Hannigan, M.P., Schauer, J.J., 2008. A macrophage-based
method for the assessment of the reactive oxygen species (ROS) activity of atmospheric particulate
matter (PM) and application to routine (daily-24 h) aerosol monitoring studies. Aerosol Science and
Technology 42 (11), 946-957.
Liu, Z.G., Vasys, V.N., Kittelson, D.B., 2007a. Nuclei-mode particulate emissions and their response to
fuel sulfur content and primary dilution during transient operations of old and modern diesel
engines. Environmental Science & Technology 41 (18), 6479-6483.
Liu, Z.G., Victoria, N.V., Swor, T., Kittelson, D.B., 2007b. Significance of fuel sulfur content and dilution
conditions on particle emissions from a heavily-used diesel engine during transient operation. Society
of Automotive Engineers Technical Paper Series No. 2007-01-0319
Liu, Z.G., Berg, D.R., Swor, T.A., Schauer, J.J., 2008. Comparative analysis on the effects of diesel
particulate filter and selective catalytic reduction systems on a wide spectrum of chemical species
emissions. Environmental Science & Technology 42 (16), 6080-6085.
Lyyranen, J., Jokiniemi, J., Kauppinen, E.I., Backman, U., Vesala, H., 2004. Comparison of different
dilution methods for measuring diesel particle emissions. Aerosol Science and Technology 38 (1), 12-
23.
Marr, L.C., Kirchstetter, T.W., Harley, R.A., Miguel, A.H., Hering, S.V., Hammond, S.K., 1999.
Characterization of polycyclic aromatic hydrocarbons in motor vehicle fuels and exhaust emissions.
Environmental Science & Technology 33 (18), 3091-3099.

71
Matter, U., Siegmann, H.C., Burtscher, H., 1999. Dynamic field measurements of submicron particles
from diesel engines. Environmental Science & Technology 33 (11), 1946-1952.
Maynard, A.D., 2006. Nanotechnology: assessing the risk Nanotoday 1 22–33.
Meyer, N.K., Ristovski, Z.D., 2007. Ternary nucleation as a mechanism for the production of diesel
nanoparticles: Experimental analysis of the volatile and hygroscopic properties of diesel exhaust
using the volatilization and humidification tandem differential mobility analyzer. Environmental
Science & Technology 41 (21), 7309-7314.
Misra, C., Kim, S., Shen, S., Sioutas, C., 2002. A high flow rate, very low pressure drop impactor for
inertial separation of ultrafine from accumulation mode particles. Journal of Aerosol Science 33 (5),
735-752.
Morawska, L., Bofinger, N.D., Kocis, L., Nwankwoala, A., 1998. Submicrometer and supermicrometer
particles from diesel vehicle emissions. Environmental Science & Technology 32 (14), 2033-2042.
Nico, P.S., Kumfer, B.M., Kennedy, I.M., Anastasio, C., 2009. Redox dynamics of mixed metal (Mn, Cr,
and Fe) ultrafine particles. Aerosol Science and Technology 43 (1), 60-70.
NRC, 2004. Research Priorities for Airborne Particulate Matter: IV. Continuing Research Progress,
National Academy Press,Washington DC.
Ntziachristos, L., Samaras, Z., 2006. Combination of aerosol instrument data into reduced variables to
study the consistency of vehicle exhaust particle measurements. Atmospheric Environment 40 (31),
6032-6042.
Nygaard, U.C., Samuelsen, M., Aase, A., Lovik, M., 2004. The capacity of particles to increase allergic
sensitization is predicted by particle number and surface area, not by particle mass. Toxicological
Sciences 82 (2), 515-524.
Oberdorster, G., Oberdorster, E., Oberdorster, J., 2005. Nanotoxicology: An emerging discipline evolving
from studies of ultrafine particles. Environmental Health Perspectives 113 (7), 823-839.
Polidori, A., Hu, S., Biswas, S., Delfino, R.J., Sioutas, C., 2008. Real-time characterization of particle-
bound polycyclic aromatic hydrocarbons in ambient aerosols and from motor-vehicle exhaust.
Atmospheric Chemistry and Physics 8 (5), 1277-1291.
Riddle, S.G., Robert, M.A., Jakober, C.A., Hannigan, M.P., Kleeman, M.J., 2007. Size distribution of trace
organic species emitted from heavy-duty diesel vehicles. Environmental Science & Technology 41 (6),
1962-1969.
Rose, A.L., Waite, T.D., 2005. Reduction of organically complexed ferric iron by superoxide in a simulated
natural water. Environmental Science & Technology 39 (8), 2645-2650.
72
Rose, D., Wehner, B., Ketzel, M., Engler, C., Voigtlander, J., Tuch, T., Wiedensohler, A., 2006.
Atmospheric number size distributions of soot particles and estimation of emission factors.
Atmospheric Chemistry and Physics 6 1021-1031.
Rusznak, C., Devalia, J.L., Davies, R.J., 1994. The impact of pollution on allergic disease. Allergy 49 (18),
21-27.
Sakurai, H., Park, K., McMurry, P.H., Zarling, D.D., Kittelson, D.B., Ziemann, P.J., 2003a. Size-dependent
mixing characteristics of volatile and nonvolatile components in diesel exhaust aerosols.
Environmental Science & Technology 37 (24), 5487-5495.
Sakurai, H., Tobias, H.J., Park, K., Zarling, D., Docherty, K.S., Kittelson, D.B., McMurry, P.H., Ziemann, P.J.,
2003b. On-line measurements of diesel nanoparticle composition and volatility. Atmospheric
Environment 37 (9-10), 1199-1210.
Saldiva, P.H.N., Clarke, R.W., Coull, B.A., Stearns, R.C., Lawrence, J., Murthy, G.G.K., Diaz, E., Koutrakis,
P., Suh, H., Tsuda, A., Godleski, J.J., 2002. Lung inflammation induced by concentrated ambient air
particles is related to particle composition. American Journal of Respiratory and Critical Care
Medicine 165 (12), 1610-1617.
Schauer, J.J., Kleeman, M.J., Cass, G.R., Simoneit, B.R.T., 1999. Measurement of emissions from air
pollution sources. 2. C-1 through C-30 organic compounds from medium duty diesel trucks.
Environmental Science & Technology 33 (10), 1578-1587.
Schauer, J.J., Fraser, M.P., Cass, G.R., Simoneit, B.R.T., 2002. Source reconciliation of atmospheric gas-
phase and particle-phase pollutants during a severe photochemical smog episode. Environmental
Science & Technology 36 (17), 3806-3814.
Seagrave, J., Dunaway, S., McDonald, J.D., Mauderly, J.L., Hayden, P., Stidley, C., 2007. Responses of
differentiated primary human lung epithelial cells to exposure to diesel exhaust at an air-liquid
interface. Experimental Lung Research 33 (1), 27-51.
Shah, M.H., Shaheen, N., Jaffar, M., 2004a. Screening of urban aerosol particulate composites for
selected metal distribution and their dependence on meteorological parameters. Annali Di Chimica
94 (11), 805-815.
Shah, S.D., Cocker, D.R., Miller, J.W., Norbeck, J.M., 2004b. Emission rates of particulate matter and
elemental and organic carbon from in-use diesel engines. Environmental Science & Technology 38
(9), 2544-2550.
Sturm, P.J., Baltensperger, U., Bacher, M., Lechner, B., Hausberger, S., Heiden, B., Imhof, D.,
Weingartner, E., Prevot, A.S.H., Kurtenbach, R., Wiesen, P., 2003. Roadside measurements of
particulate matter size distribution. Atmospheric Environment 37 (37), 5273-5281.
73
Ueno, H., Furutani, T., Nagami, T., Aono, N., Goshima, H., Kasahara, K. (1998.). Development of Catalyst
for Diesel Engine. . Society of Automotive Engineers (SAE): Warrendale, PA, Paper No. 980195.
Vaaraslahti, K., Virtanen, A., Ristimaki, J., Keskinen, J., 2004. Nucleation mode formation in heavy-duty
diesel exhaust with and without a particulate filter. Environmental Science & Technology 38 (18),
4884-4890.
Valko, M., Morris, H., Cronin, M.T.D., 2005. Metals, toxicity and oxidative stress. Current Medicinal
Chemistry 12 (10), 1161-1208.
Vogt, R., Scheer, V., Casati, R., Benter, T., 2003. On-road measurement of particle emission in the
exhaust plume of a diesel passenger car. Environmental Science & Technology 37 (18), 4070-4076.
Wehner, B., Birmili, W., Gnauk, T., Wiedensohler, A., 2002. Particle number size distributions in a street
canyon and their transformation into the urban-air background: measurements and a simple model
study. Atmos Environ 36 (13), 2215-2223.
Wei, Q., Kittelson, D.B., Watts, W.F., 2001. Single-stage dilution tunnel design. Society of Automotive
Engineers Technical Paper Series No. 2001-01-0207.
Welch, K.D., Davis, T.Z., Van Eden, M.E., Aust, S.D., 2002. Deleterious iron-mediated oxidation of
biomolecules. Free Radical Biology and Medicine 32 (7), 577-583.
Wilson, W.E., Stanek, J., Han, H.S., Johnson, T., Sakurai, H., Pui, D.Y.H., Turner, J., Chen, D.R., Duthie, S.,
2007. Use of the electrical aerosol detector as an indicator of the surface area of fine particles
deposited in the lung. Journal of the Air & Waste Management Association 57 (2), 211-220.
Winterbourn, C.C., 1987. The ability of scavengers to distinguish OH. production in the iron-catalyzed
Haber-Weiss reaction - comparison of 4 assays for OH. Free Radical Biology and Medicine 3 (1), 33-
39.
Woo, K.S., Chen, D.R., Pui, D.Y.H., Wilson, W.E., 2001. Use of continuous measurements of integral
aerosol parameters to estimate particle surface area. Aerosol Science and Technology 34 (1), 57-65.
Yu, F.Q., 2001. Chemiions and nanoparticle formation in diesel engine exhaust. Geophys Res Lett 28
(22), 4191-4194.
Zhang, K.M., Wexler, A.S., Zhu, Y.F., Hinds, W.C., Sioutas, C., 2004. Evolution of particle number
distribution near roadways. Part II: the 'road-to-ambient' process. Atmospheric Environment 38 (38),
6655-6665.
Zhang, Y.X., Schauer, J.J., Shafer, M.M., Hannigan, M.P., Dutton, S.J., 2008. Source apportionment of in
vitro reactive oxygen species bioassay activity from atmospheric particulate matter. Environmental
Science & Technology 42 (19), 7502-7509.

74
Zhu, Y.F., Hinds, W.C., Kim, S., Sioutas, C., 2002a. Concentration and size distribution of ultrafine
particles near a major highway. Journal of the Air & Waste Management Association 52 (9), 1032-
1042.
Zhu, Y.F., Hinds, W.C., Shen, S., Sioutas, C., 2004. Seasonal trends of concentration and size distribution
of ultrafine particles near major highways in Los Angeles. Aerosol Science and Technology 38 5-13.
Zhu, Y.F., Hinds, W.C., Kim, S., Shen, S., Sioutas, C., 2002b. Study of ultrafine particles near a major
highway with heavy-duty diesel traffic. Atmospheric Environment 36 (27), 4323-4335.
Zielinska, B., Sagebiel, J., McDonald, J.D., Whitney, K., Lawson, D.R., 2004. Emission rates and
comparative chemical composition from selected in-use diesel and gasoline-fueled vehicles. Journal
of the Air & Waste Management Association 54 (9), 1138-1150.


