
PinatuboJune 12, 1991
Three days before major eruption of
June 15, 1991
Dr. Alan Robock
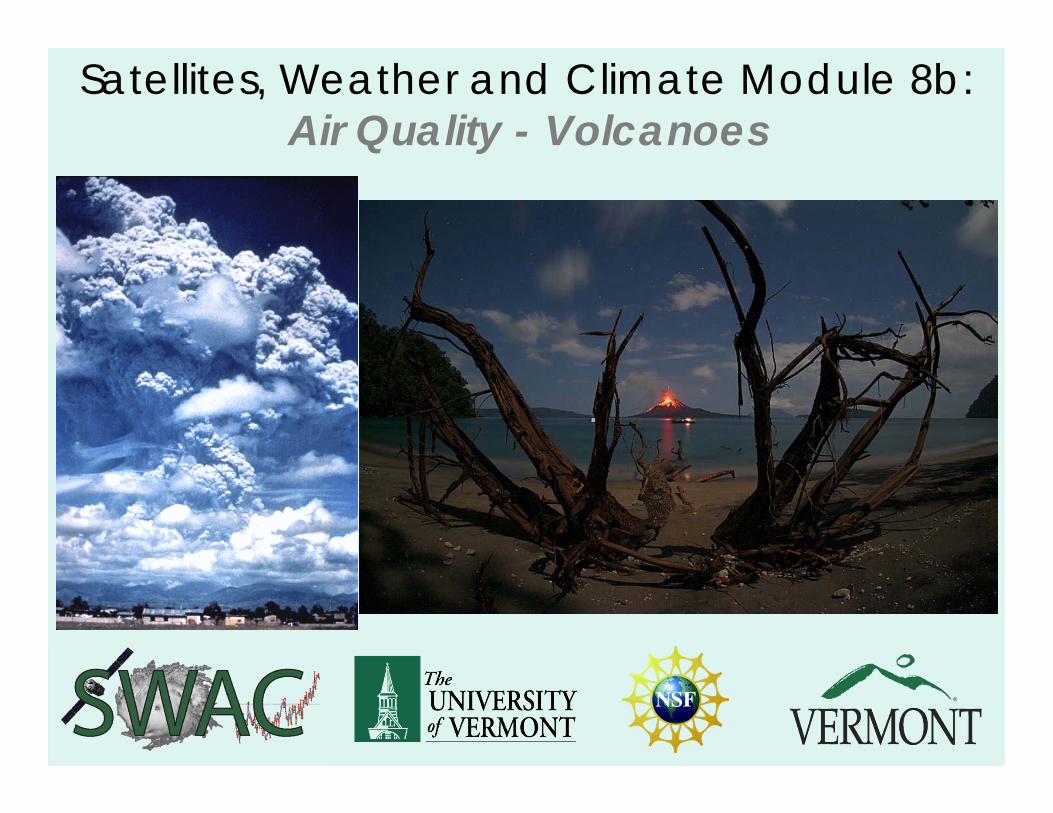
Satellites, Weather and Climate Module 8b:Air Quality - Volcanoes
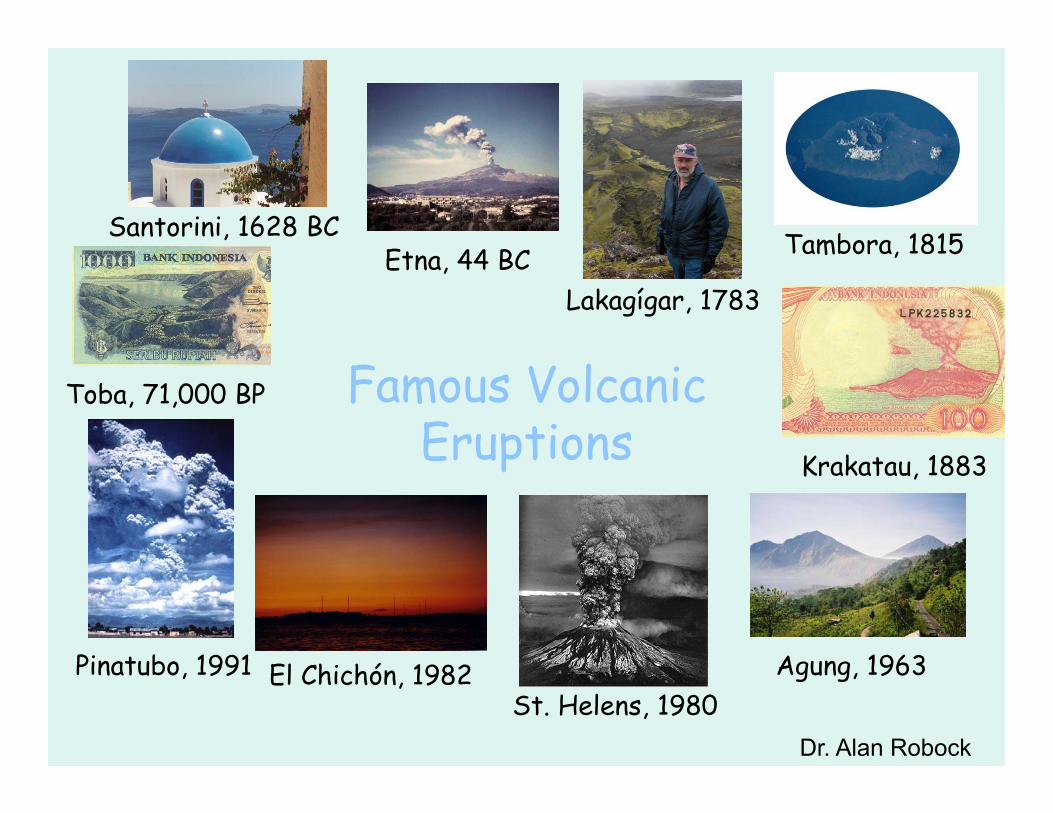
Famous Volcanic Eruptions
Tambora, 1815
Agung, 1963El Chichón, 1982
Krakatau, 1883
Toba, 71,000 BP
Pinatubo, 1991
Lakagígar, 1783
Santorini, 1628 BCEtna, 44 BC
St. Helens, 1980Dr. Alan Robock

Gaseous emissions from volcanoes
• nitrogen (1%)
• water vapour (80%)
• carbon dioxide (12%)
• sulphur dioxide & other gases (12%)
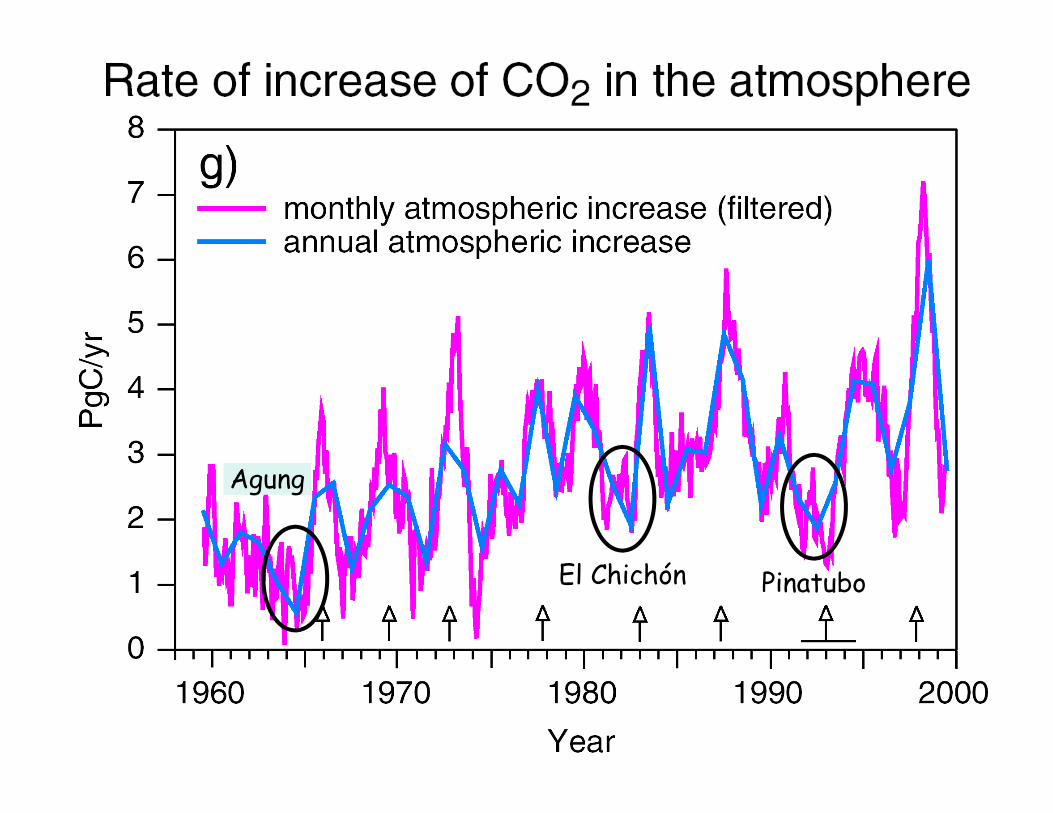
PinatuboEl Chichón
Agung

Stratospheric aerosols(Lifetime 1-3 years)
Ash
Effectson cirrusclouds
absorption (IR)
IRHeating
emission
emission
IR Cooling
MoreDownward
IR Flux
LessUpwardIR Flux
forward scatter
EnhancedDiffuse
FluxReducedDirect
Flux
Less TotalSolar Flux
Heterogeneous LessO3 depletion Solar Heating
H2SSO2
Tropospheric aerosols(Lifetime 1-3 weeks)
SO2 H2SO4
H2SO4
CO2
H2O
backscatterabsorption(near IR)
Solar Heating
More ReflectedSolar Flux
Indirect Effects on Clouds
Dr. Alan Robock
Local impact – water vapour
• cooling of water vapour → cloud of water and ash above & downwind of volcano
• decrease in daytime temperature• increase in nighttime temperature
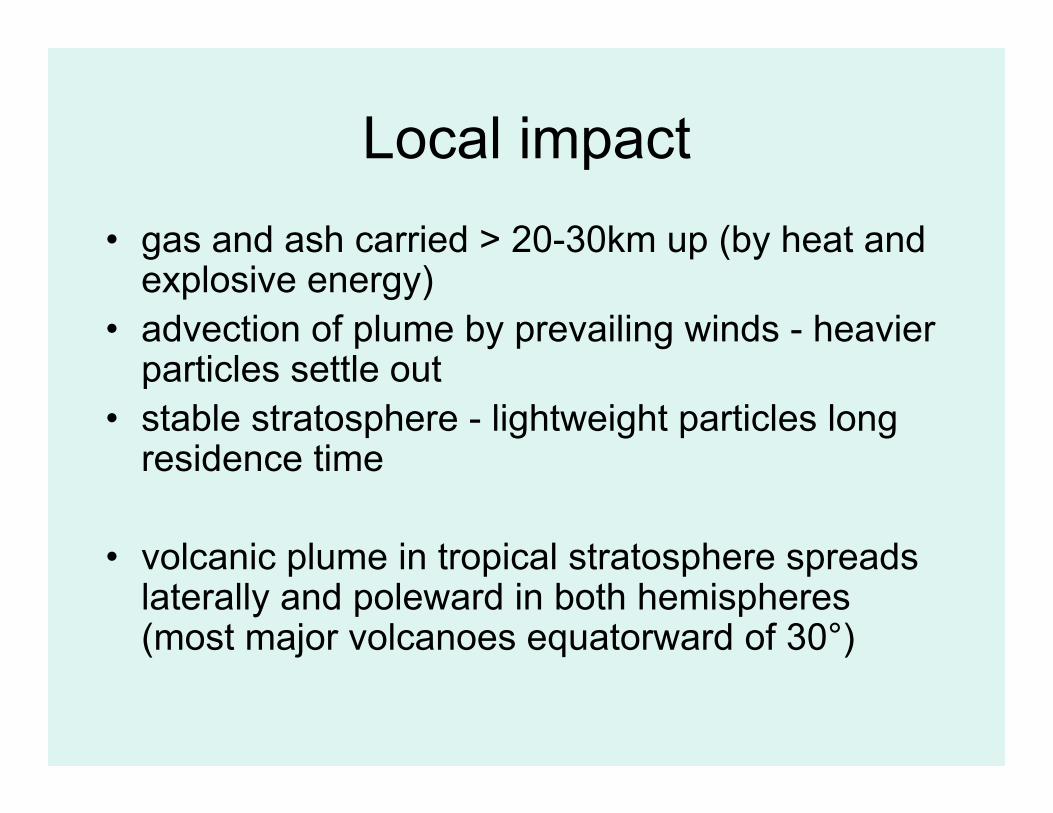
Local impact• gas and ash carried > 20-30km up (by heat and
explosive energy)• advection of plume by prevailing winds - heavier
particles settle out• stable stratosphere - lightweight particles long
residence time
• volcanic plume in tropical stratosphere spreads laterally and poleward in both hemispheres (most major volcanoes equatorward of 30°)
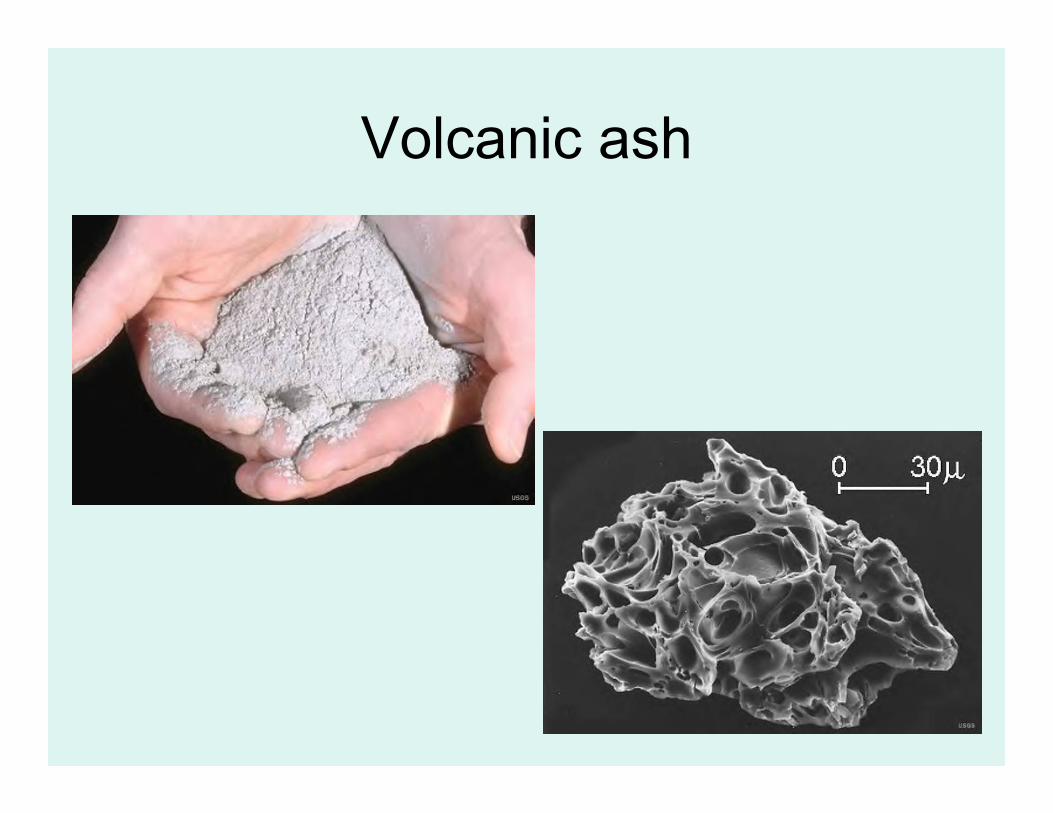
Volcanic ash

After Pinatubo, Clark Air Force Base 25 km from volcano
Photo by R. P. Hoblitt, June 15, 1991
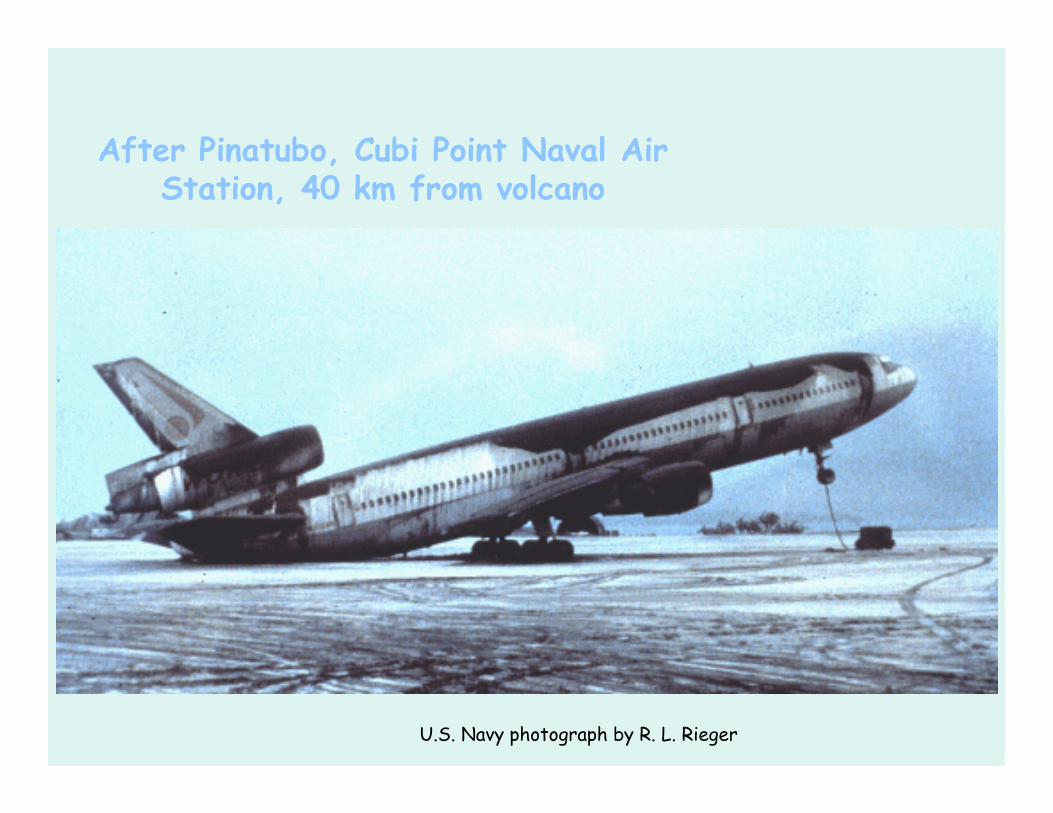
After Pinatubo, Cubi Point Naval Air Station, 40 km from volcano
U.S. Navy photograph by R. L. Rieger
Dust Veil Index
• measure of turbidity of atmosphere• reduction in radiation due to dust &
aerosols in the years after eruption
• depletion of radiation following the eruption• temperature variations following the eruption• the amount of solid material dispersed as dust
after an eruption

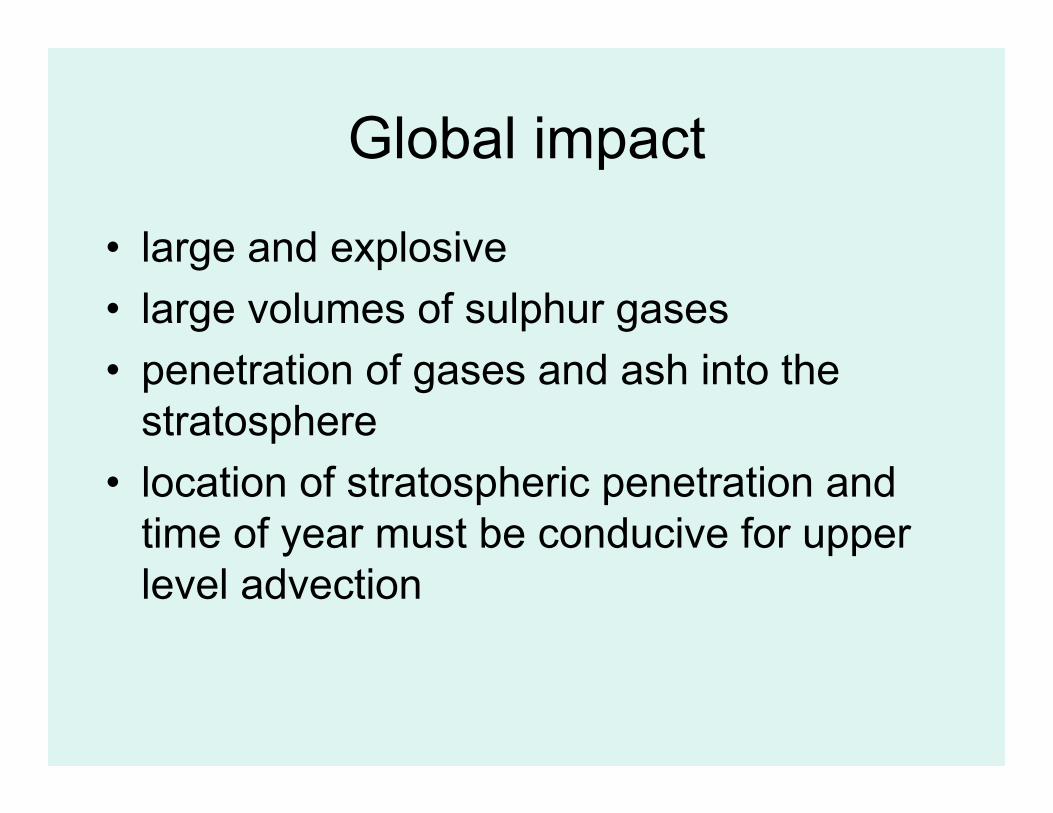
Global impact
• large and explosive• large volumes of sulphur gases• penetration of gases and ash into the
stratosphere• location of stratospheric penetration and
time of year must be conducive for upper level advection
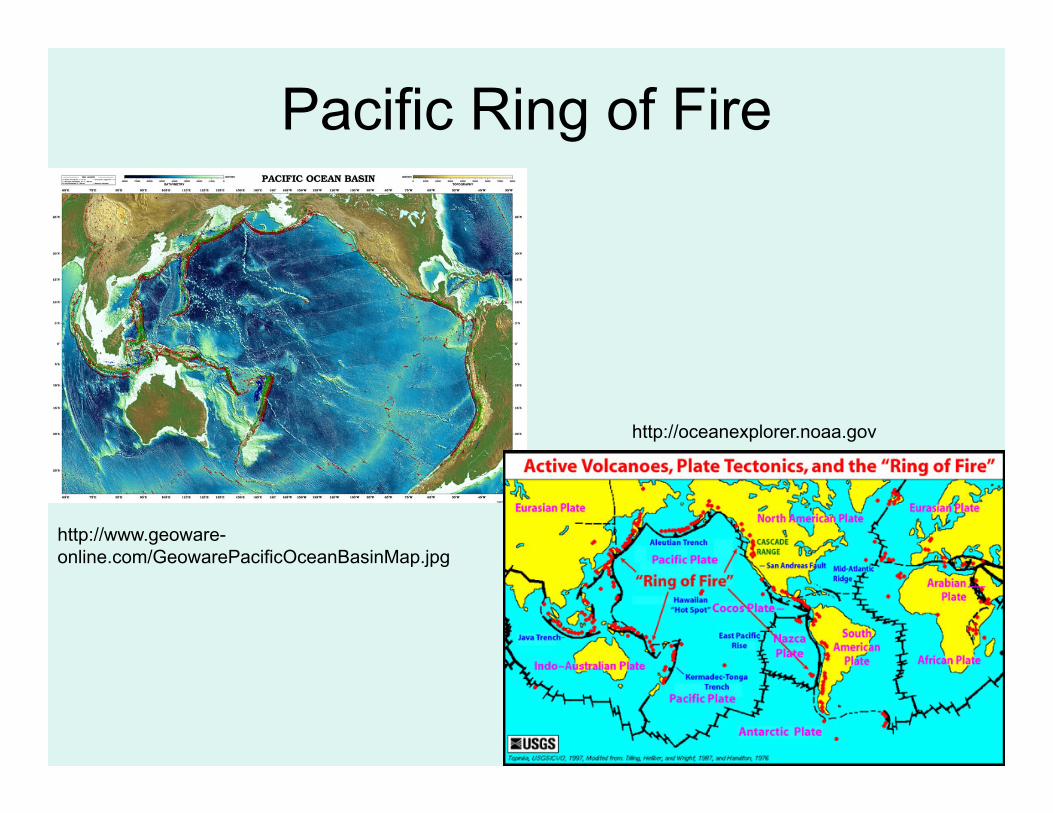
Pacific Ring of Fire
http://www.geoware-online.com/GeowarePacificOceanBasinMap.jpg
http://oceanexplorer.noaa.gov
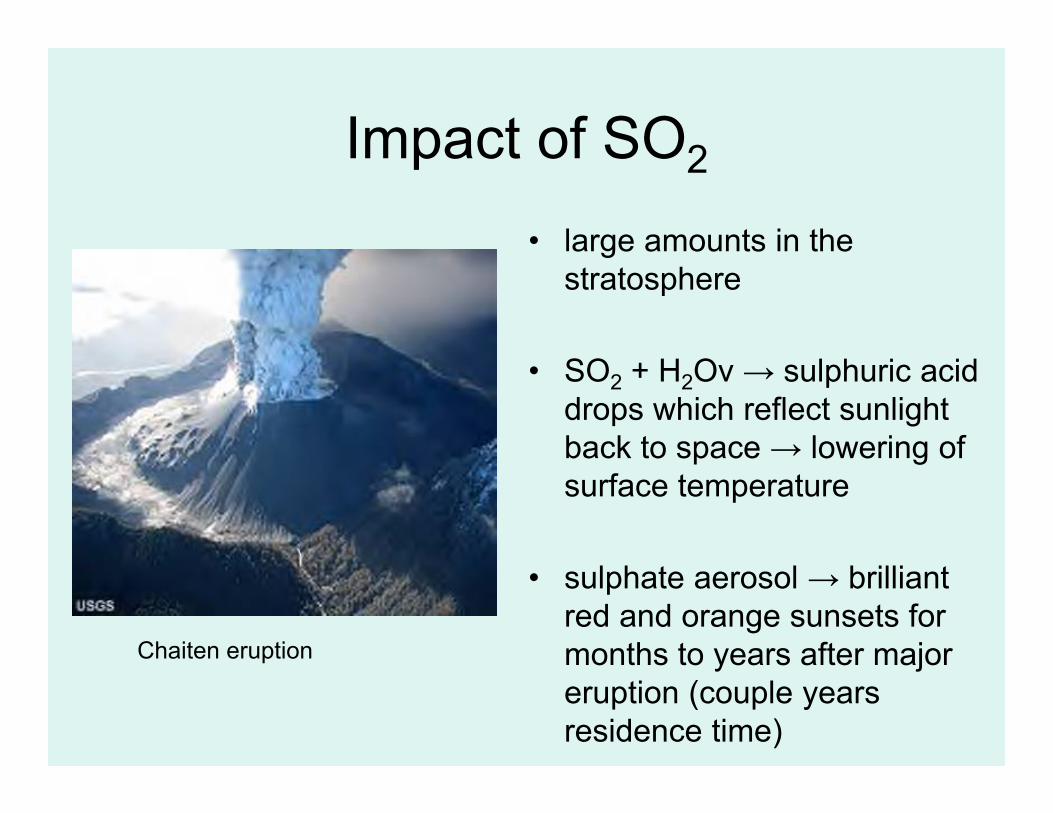
Impact of SO2
• large amounts in the stratosphere
• SO2 + H2Ov → sulphuric acid drops which reflect sunlight back to space → lowering of surface temperature
• sulphate aerosol → brilliant red and orange sunsets for months to years after major eruption (couple years residence time)
Chaiten eruption
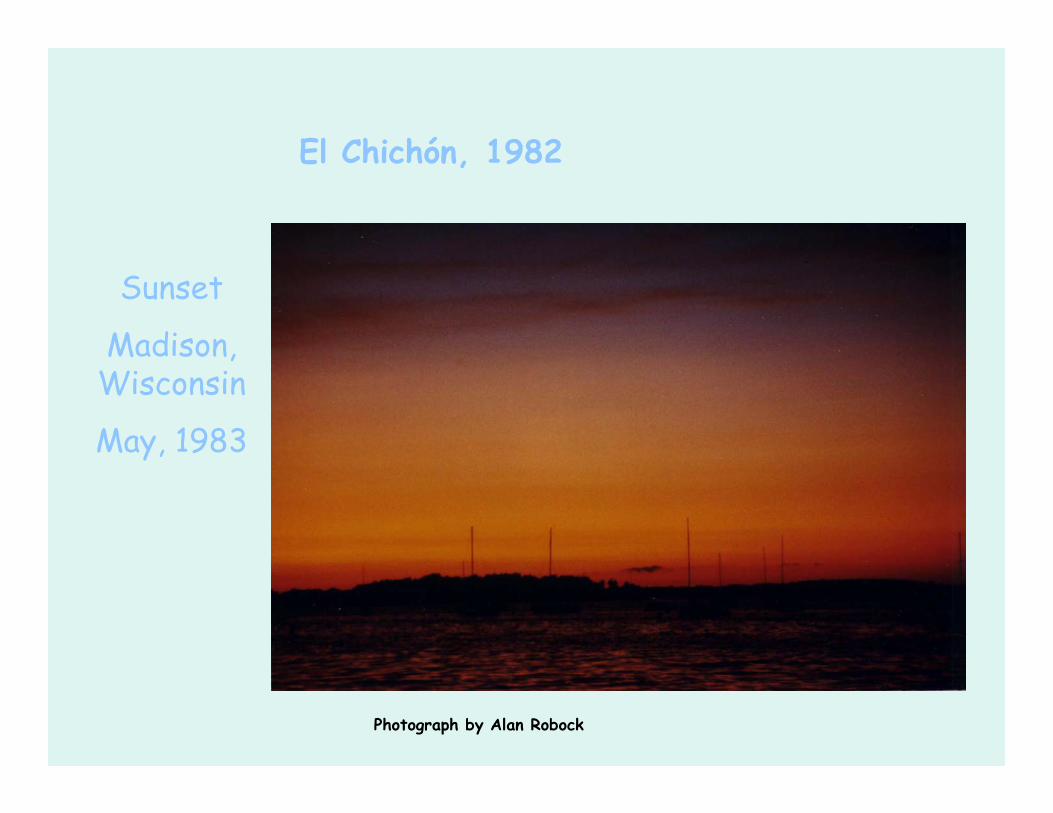
El Chichón, 1982
Sunset
Madison,Wisconsin
May, 1983
Photograph by Alan Robock
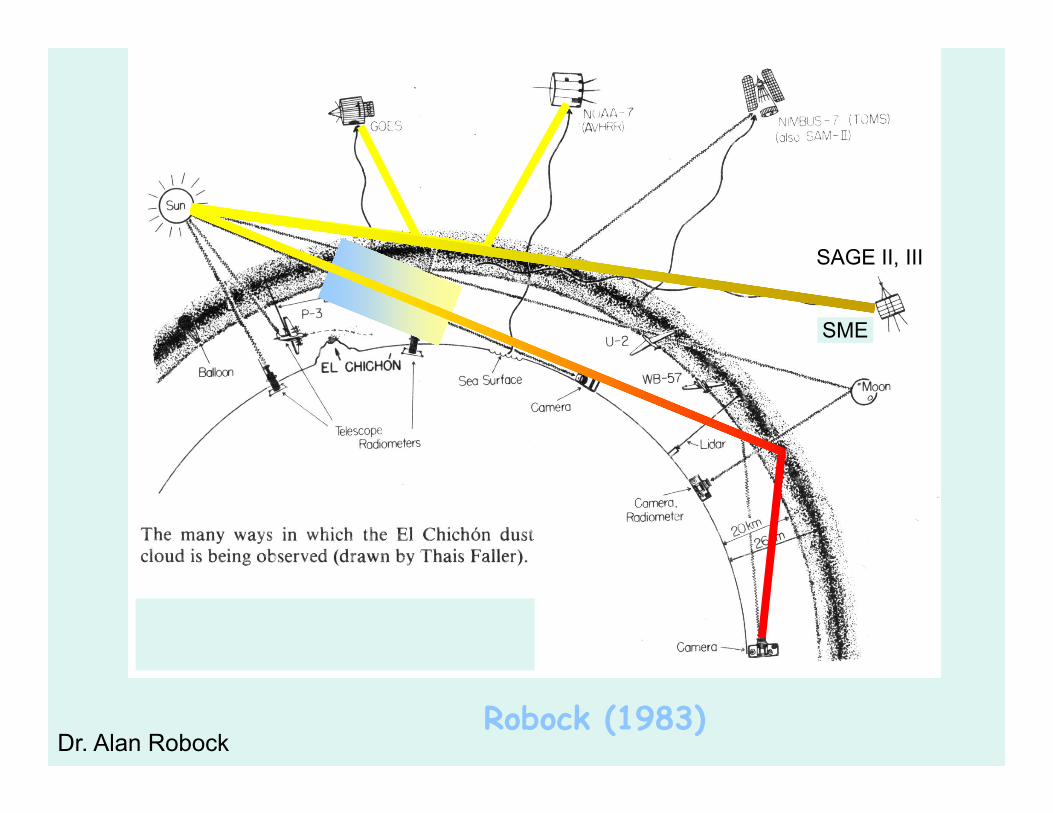
Robock (1983)
SAGE II, III
SME
Dr. Alan Robock

These two photos show the Earth’s limb at sunset before and after the Mt. Pinatubo eruption. The first view (STS41D-32-14) shows a relatively clear atmosphere, taken August 30, 1984. Astronauts were looking at the profiles of high thunderstorms topping out at the tropopause at sunset; different atmospheric layers absorbed the last rays of light from the sun as the spacecraft moved eastward.
The same type of photograph (STS043-22-23) was taken August 8, 1991, less than two months after the Pinatubo eruption. Two dark layers of aerosols make distinct boundaries in the atmosphere. The estimated altitude of aerosol layers in this view is 20 to 25 km.
http://earthobservatory.nasa.gov/Study/AstronautPinatubo/astronaut_pinatubo2.html
Types of eruptions
• explosive vs. quiet• function of gas release at eruption and
ease with which gas escapes from erupting molten rock
• gases dissolved at high pressures and temperatures deep within earth
• sudden release when molten rock reaches surface
Types of eruptions
• steam (most abundant), carbon dioxide, sulphur gases (SO2 and hydrogen sulphide), hydrochloric acid gas, nitrogen
• Hawaiian lavas low in dissolved gases• Pacific Ring of Fire volcanoes higher gas
content
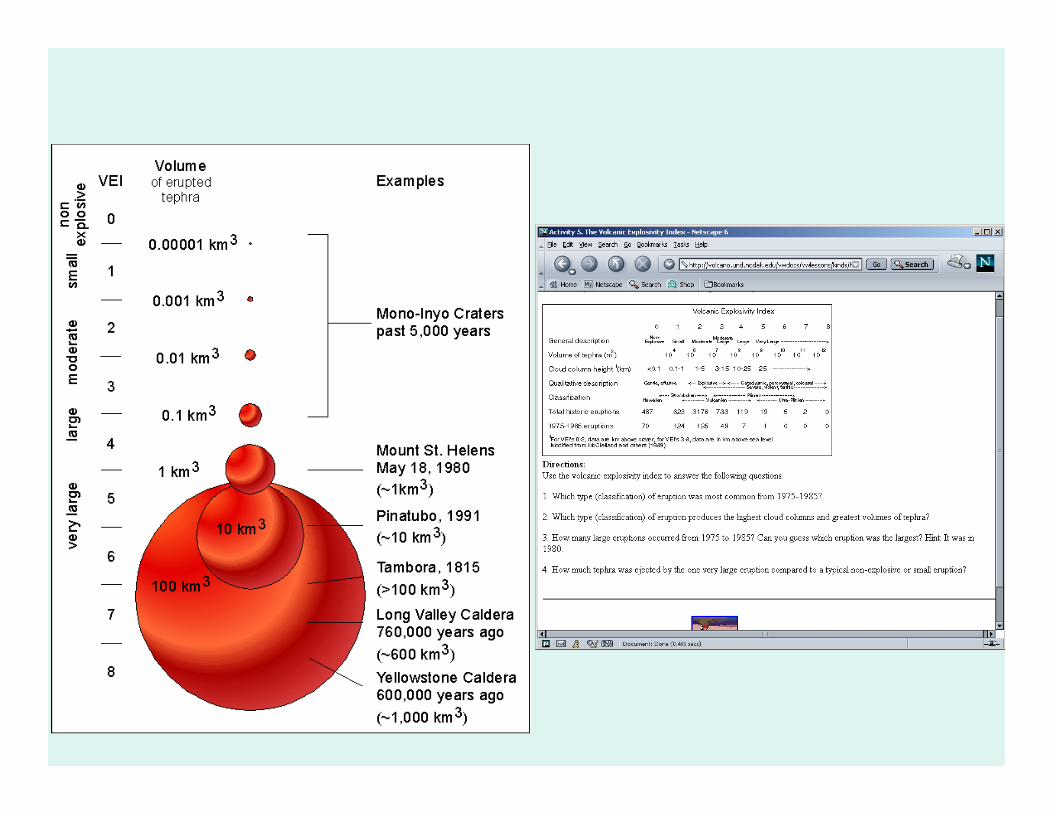
Volcanic explosivity index• measures the impact• volume of products, eruption cloud height, duration in
hours and qualitative observations • open ended scale
• 0 for non- explosive eruptions• 8 for history's largest explosive eruption• Strombolian and Vulcanian eruptions are the most common• Plinian and ultraplinian eruptions generate the greatest cloud
column heights• The volume of Hawaiian and Strombolian eruptions is 104 m3 or less• Very large eruptions produce one million m3 more tephra than non-
explosive or small eruptions.
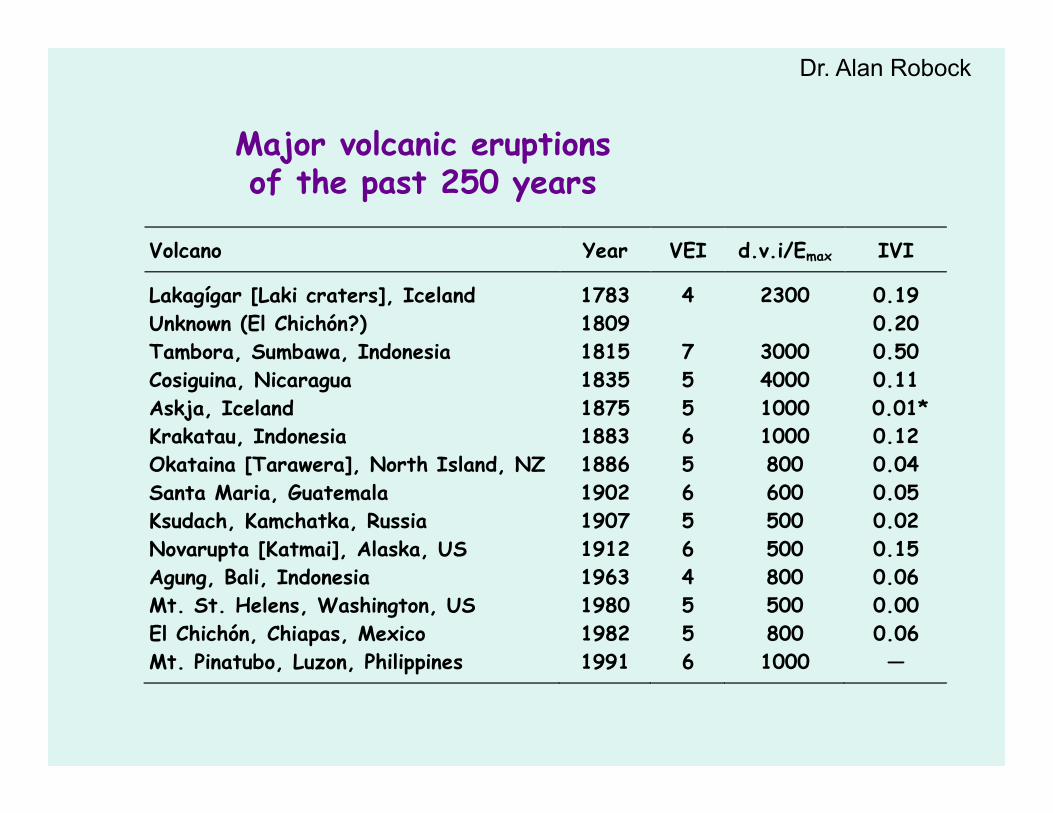
Volcano Year VEI d.v.i/Emax IVI
Lakagígar [Laki craters], Iceland 1783 4 2300 0.19 Unknown (El Chichón?) 1809 0.20 Tambora, Sumbawa, Indonesia 1815 7 3000 0.50 Cosiguina, Nicaragua 1835 5 4000 0.11 Askja, Iceland 1875 5 1000 0.01* Krakatau, Indonesia 1883 6 1000 0.12 Okataina [Tarawera], North Island, NZ 1886 5 800 0.04 Santa Maria, Guatemala 1902 6 600 0.05 Ksudach, Kamchatka, Russia 1907 5 500 0.02 Novarupta [Katmai], Alaska, US 1912 6 500 0.15 Agung, Bali, Indonesia 1963 4 800 0.06 Mt. St. Helens, Washington, US 1980 5 500 0.00 El Chichón, Chiapas, Mexico 1982 5 800 0.06 Mt. Pinatubo, Luzon, Philippines 1991 6 1000 —
Major volcanic eruptionsof the past 250 years
Dr. Alan Robock
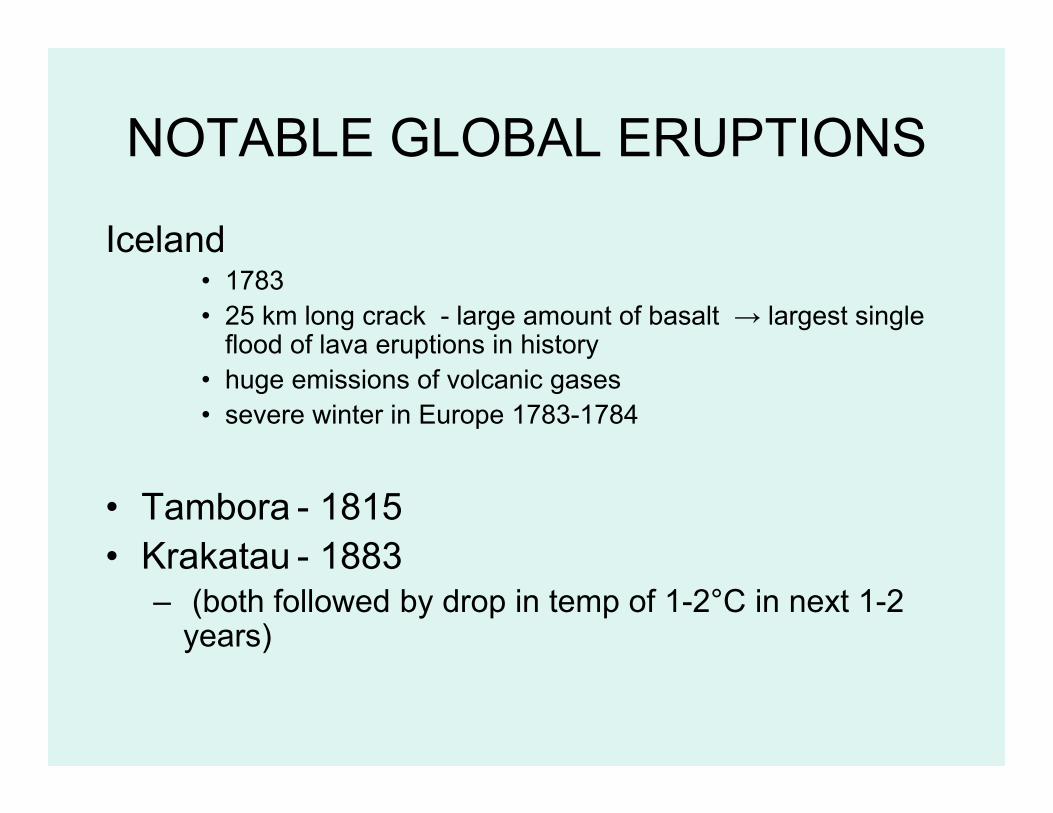
NOTABLE GLOBAL ERUPTIONS
Iceland• 1783• 25 km long crack - large amount of basalt → largest single
flood of lava eruptions in history• huge emissions of volcanic gases• severe winter in Europe 1783-1784
• Tambora - 1815• Krakatau - 1883
– (both followed by drop in temp of 1-2°C in next 1-2 years)

1783-84 Laki Eruption in Iceland(8 June 1783 – 7 February 1784)
Second largest flood lava eruption in historical time
Iceland’s biggestnatural disaster
Lava = 14.7 km3
Tephra = 0.4 km3
WVZ, EVZ, NVZ areWestern, Eastern andNorthern Volcanic Zones
Fig. 1 from Thordarson and Self (2003)
Dr. Alan Robock
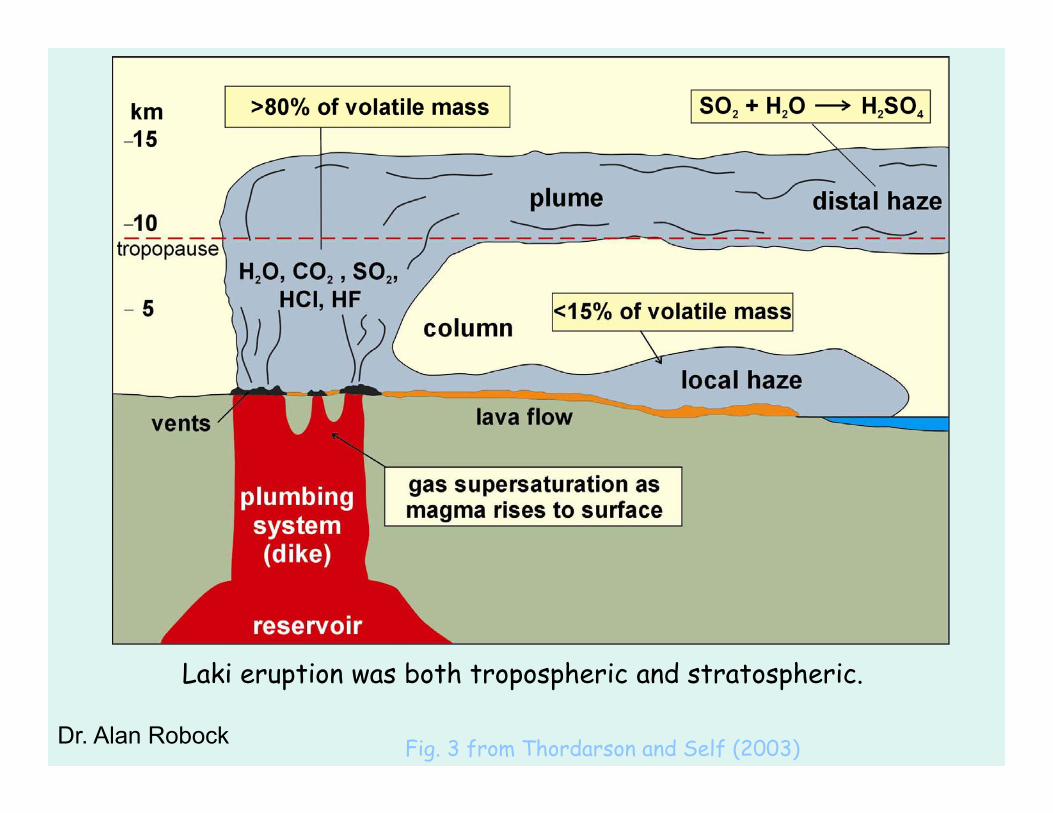
Fig. 3 from Thordarson and Self (2003)
Laki eruption was both tropospheric and stratospheric.
Dr. Alan Robock
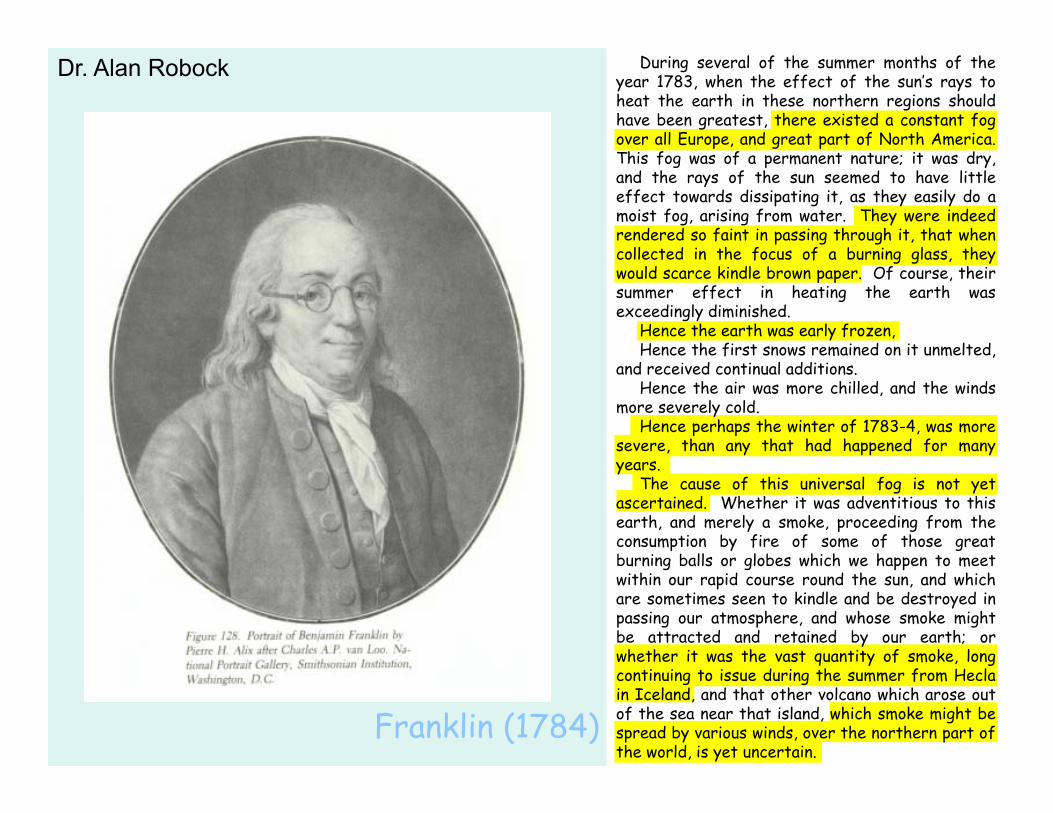
Franklin (1784)
During several of the summer months of theyear 1783, when the effect of the sun’s rays toheat the earth in these northern regions shouldhave been greatest, there existed a constant fogover all Europe, and great part of North America.This fog was of a permanent nature; it was dry,and the rays of the sun seemed to have littleeffect towards dissipating it, as they easily do amoist fog, arising from water. They were indeedrendered so faint in passing through it, that whencollected in the focus of a burning glass, theywould scarce kindle brown paper. Of course, theirsummer effect in heating the earth wasexceedingly diminished.
Hence the earth was early frozen,Hence the first snows remained on it unmelted,
and received continual additions.Hence the air was more chilled, and the winds
more severely cold.Hence perhaps the winter of 1783-4, was more
severe, than any that had happened for manyyears.
The cause of this universal fog is not yetascertained. Whether it was adventitious to thisearth, and merely a smoke, proceeding from theconsumption by fire of some of those greatburning balls or globes which we happen to meetwithin our rapid course round the sun, and whichare sometimes seen to kindle and be destroyed inpassing our atmosphere, and whose smoke mightbe attracted and retained by our earth; orwhether it was the vast quantity of smoke, longcontinuing to issue during the summer from Heclain Iceland, and that other volcano which arose outof the sea near that island, which smoke might bespread by various winds, over the northern part ofthe world, is yet uncertain.
Dr. Alan Robock

Fig. 11 from Thordarson and Self (2003)
Frequency distribution of cold summers, cold winters, and cold years in Europe and eastern United States during the period 1768 to 1798.
Laki effect?
Year 17__
Dr. Alan Robock
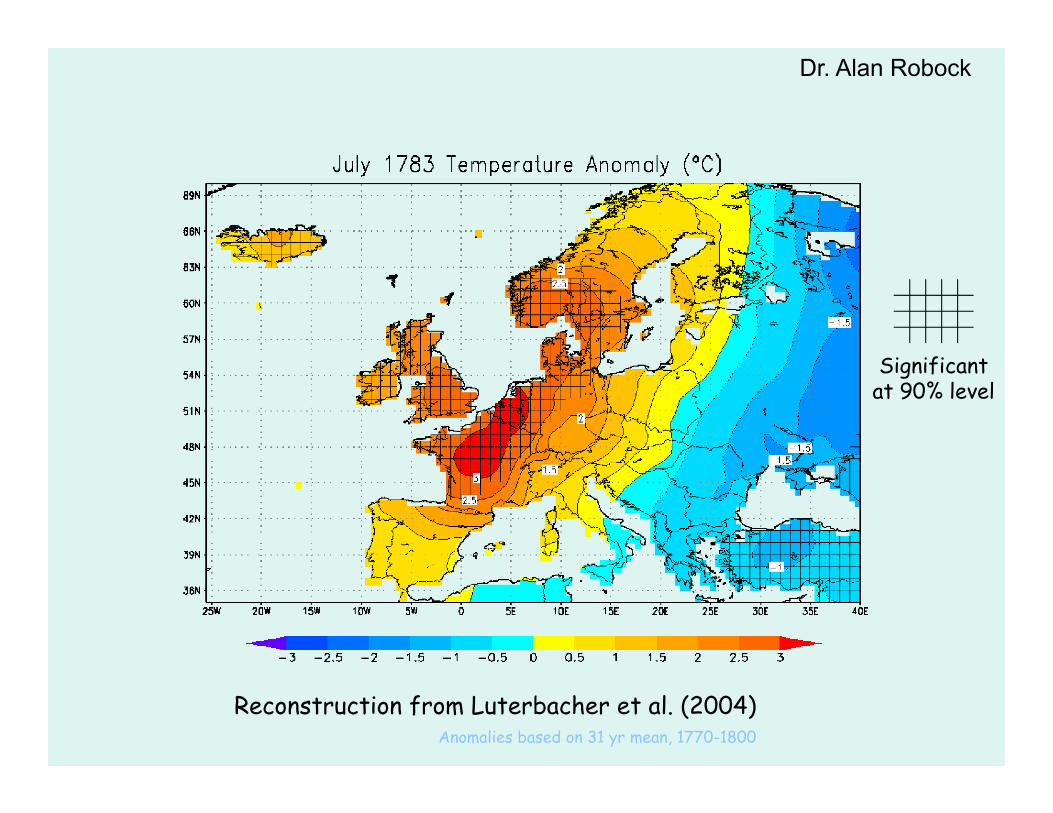
Reconstruction from Luterbacher et al. (2004)Anomalies based on 31 yr mean, 1770-1800
Significantat 90% level
Dr. Alan Robock
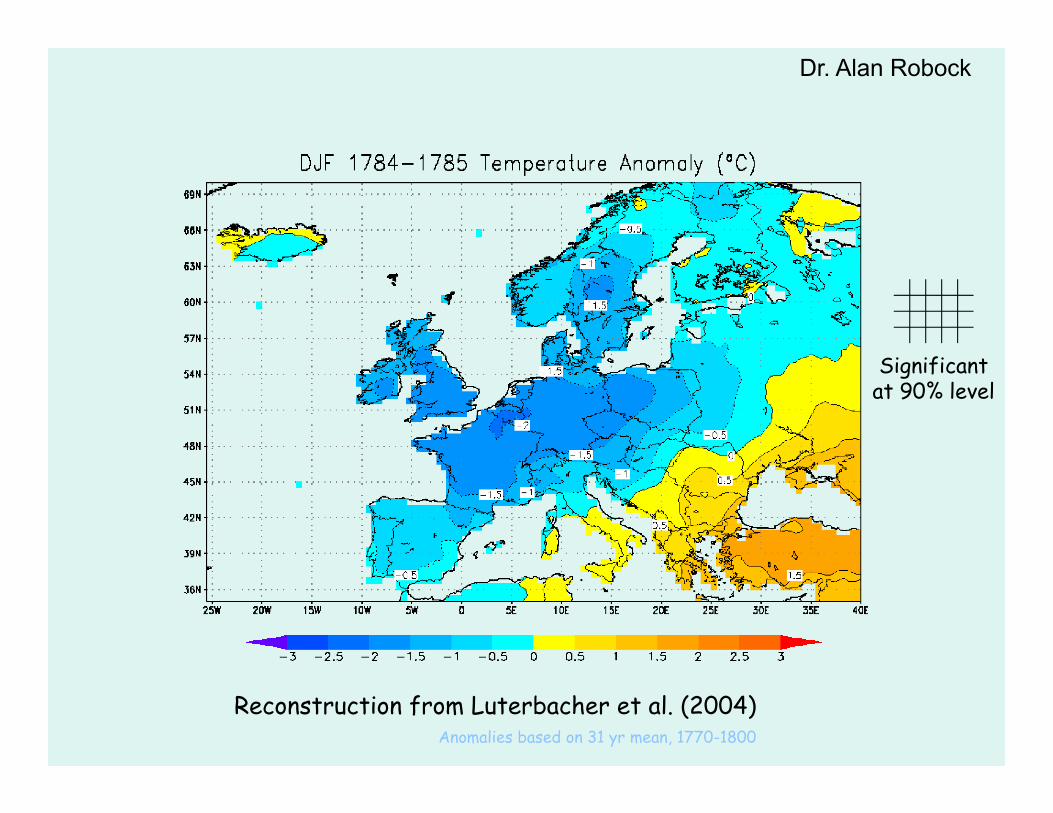
Reconstruction from Luterbacher et al. (2004)Anomalies based on 31 yr mean, 1770-1800
Significantat 90% level
Dr. Alan Robock
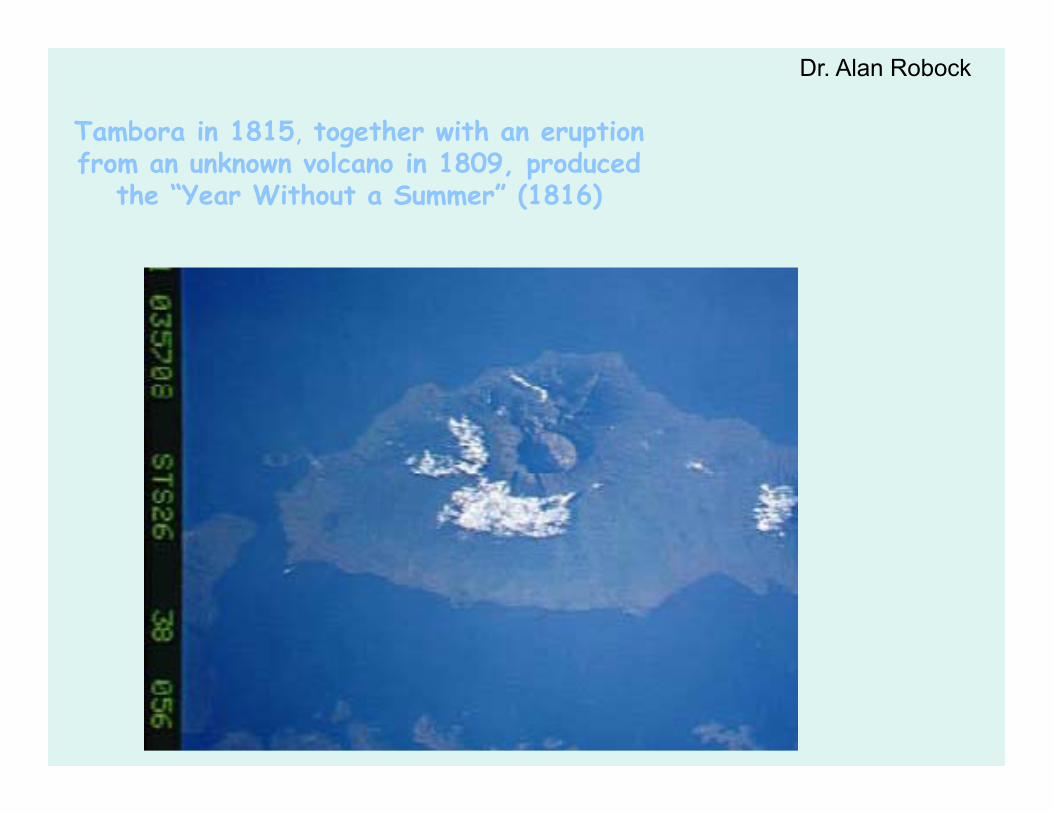
Tambora in 1815, together with an eruption from an unknown volcano in 1809, produced
the “Year Without a Summer” (1816)
Dr. Alan Robock
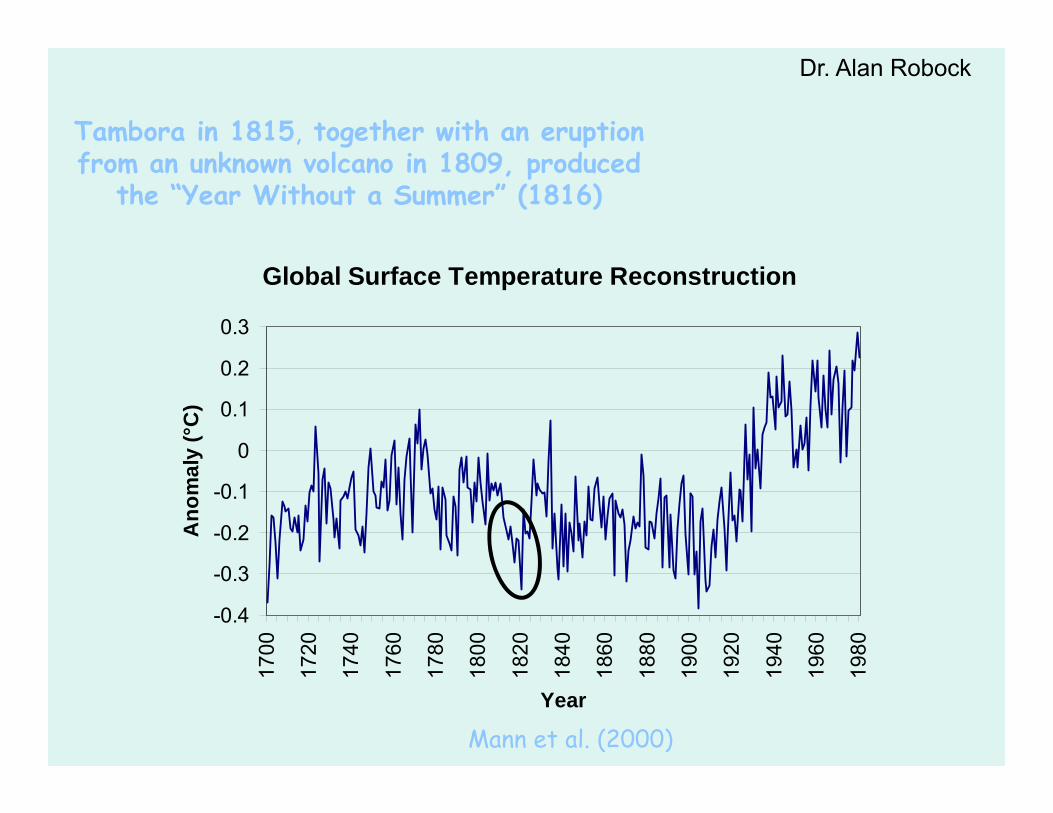
Global Surface Temperature Reconstruction
-0.4
-0.3
-0.2
-0.1
0
0.1
0.2
0.3
1700
1720
1740
1760
1780
1800
1820
1840
1860
1880
1900
1920
1940
1960
1980
Year
Ano
mal
y (°
C)
Mann et al. (2000)
Tambora in 1815, together with an eruption from an unknown volcano in 1809, produced
the “Year Without a Summer” (1816)
Dr. Alan Robock

Tambora, 1815, produced the “Year Without a Summer” (1816)
“Darkness”by Byron
I had a dream, which was not all a dream.The bright sun was extinguish'd, and the starsDid wander darkling in the eternal space,Rayless, and pathless, and the icy earthSwung blind and blackening in the moonless air;Morn came and went—and came, and brought no day,And men forgot their passions in the dreadOf this their desolation; and all heartsWere chill'd into a selfish prayer for light:And they did live by watchfires—and the thrones,The palaces of crowned kings—the huts,The habitations of all things which dwell,Were burnt for beacons; cities were consumed,And men were gather'd round their blazing homesTo look once more into each other's face; . . .
Dr. Alan Robock
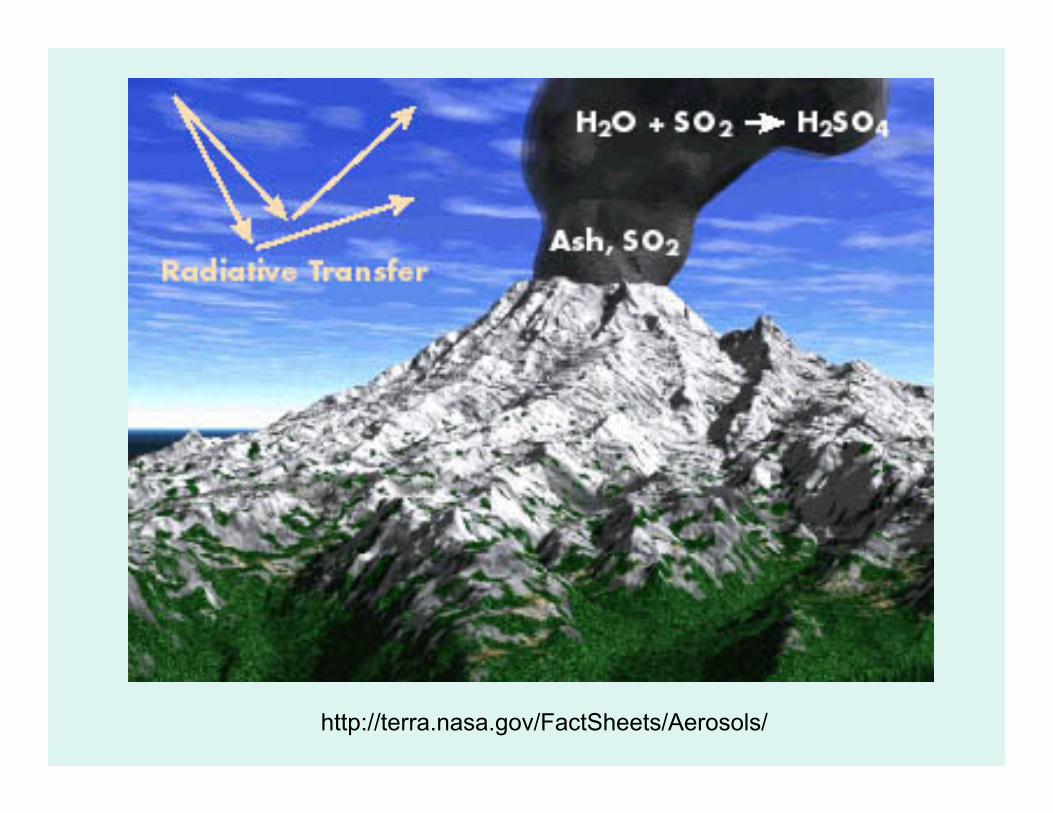
http://terra.nasa.gov/FactSheets/Aerosols/
Case study – Mt. St. Helens
• devastated 150 sq. miles of prime forest• cloud of volcanic gas and ash rose
vertically 14 miles for more than 8 hours• 2-3 inch ashfall covered central WA• dark ash cloud reached east coast within 3
days• no global impact
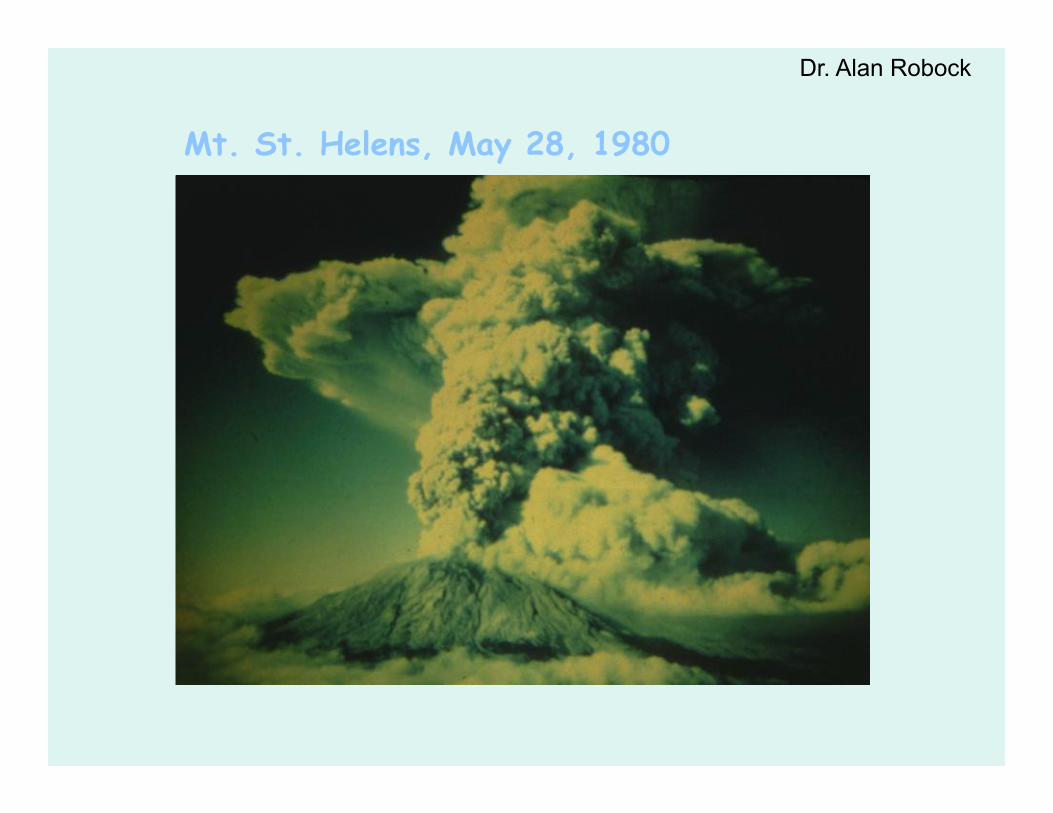
Mt. St. Helens, May 28, 1980
Dr. Alan Robock
Case study – El Chichon
• spring 1982• cold spells, heat waves, droughts, floods

El Chichón, 1982
Matson (1984)
Dr. Alan Robock
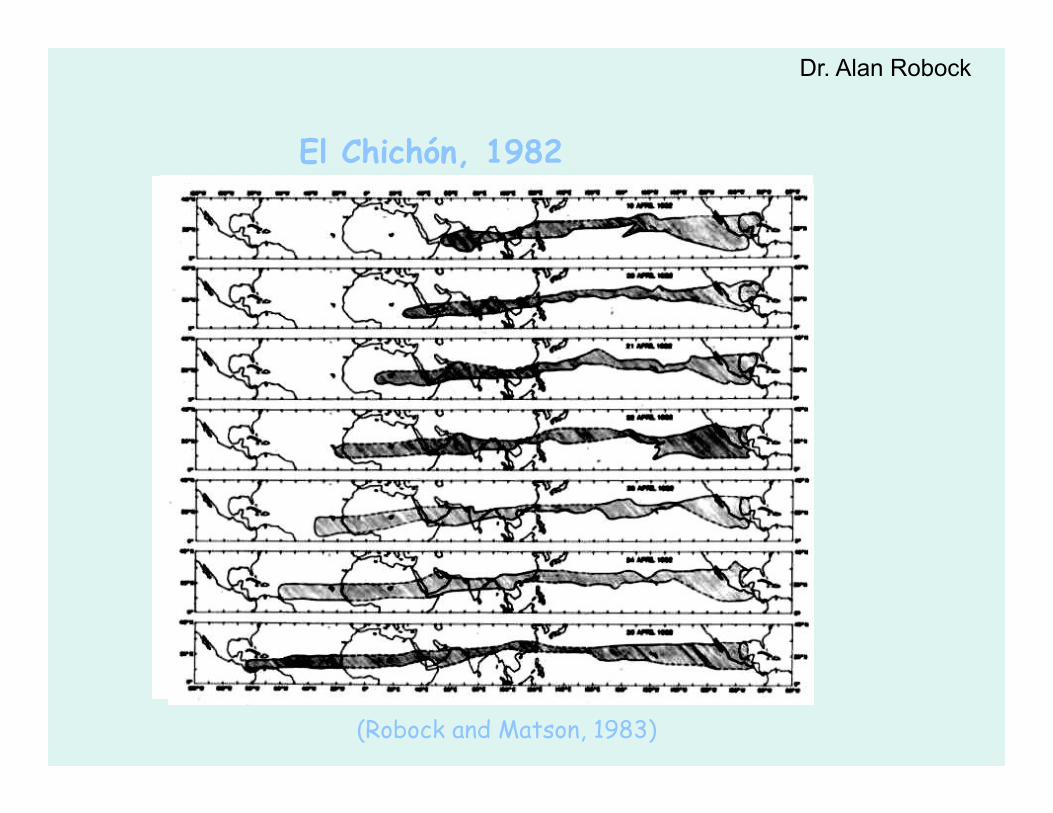
El Chichón, 1982
(Robock and Matson, 1983)
Dr. Alan Robock

Case study – Mt. Pinatubo• erupted on June 16, 1991• SO2 shot 100,000 feet into the air• SO2 emissions twice as much as El Chichón in
April 1982, 20 times Mt. St. Helens in May 1980• vivid sunset 1991 and 1992• 10% decrease in tropical oceanic rainfall for 1.5
years• 4.7% more solar radiation reflected • cool summer 1992• colder than average winter 1992-1993 in US


![Mod8 on Nuclear Energy-2 [Nuclear Power Stations] for Summer 2010-11](https://cdn.vdocument.in/doc/165x107/577d27541a28ab4e1ea3a41f/mod8-on-nuclear-energy-2-nuclear-power-stations-for-summer-2010-11.jpg)

