
1
Please note that the attached presentations contain financial projections and
other forward-looking statements that are specific to the date of the presentations
– May 17, 2017 – and should not be considered current after such date.

The world leader in serving science
2017 Analyst MeetingMay 17, 2017

3
Various remarks that we may make in the following presentations about the company’s future expectations, plans and prospects constitute forward-looking statements for purposes of the safe harbor provisions under The Private Securities Litigation Reform Act of 1995. Actual results may differ materially from those indicated by these forward-looking statements as a result of various important factors, including those discussed in our Form 10-Q for the quarter ended April 1, 2017, under the caption “Risk Factors,” which is on file with the Securities and Exchange Commission and available in the “Investors” section of our website under the heading “SEC Filings.” Important factors that could cause actual results to differ materially from those indicated by forward-looking statements include risks and uncertainties relating to: the need to develop new products and adapt to significant technological change; implementation of strategies for improving internal growth; general economic conditions and related uncertainties; dependence on customers' capital spending policies and government funding policies; the effect of exchange rate fluctuations on international operations; use and protection of intellectual property; the effect of changes in governmental regulations; and the effect of laws and regulations governing government contracts, as well as the possibility that expected benefits related to recent or pending acquisitions may not materialize as expected. While we may elect to update forward-looking statements at some point in the future, we specifically disclaim any obligation to do so, even if estimates change, therefore, you should not rely on these forward-looking statements as representing our views as of any date subsequent to today.
During these presentations, we will be referring to certain financial measures not prepared in accordance with generally accepted accounting principles, or GAAP, including adjusted EPS, adjusted operating margin, adjusted ROIC and free cash flow. The non-GAAP financial measures of Thermo Fisher’s results of operations and cash flows included in these presentations are not meant to be considered superior to or a substitute for Thermo Fisher’s results of operations prepared in accordance with GAAP. Definitions of these non-GAAP financial measures and, for historical periods, a reconciliation of the non-GAAP financial measures to the most directly comparable GAAP measures is available in the appendix to these presentations.
Please note that the attached presentations contain financial projections and other forward-looking statements that are specific to the date of the presentations – May 17, 2017 – and should not be considered current after such date.
Safe Harbor / Non-GAAP Measures

4
The tender offer referenced herein has not yet commenced. This communication is for informational purposes only and is neither an offer to purchase nor a solicitation of an offer to sell any ordinary shares of Patheon or any other securities, nor is it a substitute for the tender offer materials that Thermo Fisher and its acquisition subsidiary will file with the SEC. On the commencement date of the tender offer, a tender offer statement on Schedule TO, including an offer to purchase, a letter of transmittal and related documents, will be filed with the SEC by Thermo Fisher and/or its acquisition subsidiary and a solicitation/recommendation statement on Schedule 14D-9 will be filed with the SEC by Patheon with respect to the tender offer. The offer to purchase all of the outstanding ordinary shares of Patheon will only be made pursuant to the offer to purchase, the letter of transmittal and related documents filed as a part of the Schedule TO. Patheon will also file a proxy statement with the SEC in connection with the extraordinary general meeting of shareholders of Patheon at which the Patheon shareholders will vote on certain proposed resolutions in connection with the transaction (the "EGM Proposals"). THE TENDER OFFER MATERIALS (INCLUDING AN OFFER TO PURCHASE, A RELATED LETTER OF TRANSMITTAL AND CERTAIN OTHER TENDER OFFER DOCUMENTS), THE SOLICITATION/RECOMMENDATION STATEMENT ON SCHEDULE 14D-9 AND THE PROXY STATEMENT WILL CONTAIN IMPORTANT INFORMATION. INVESTORS AND SHAREHOLDERS OF PATHEON ARE URGED TO READ THESE DOCUMENTS CAREFULLY WHEN THEY BECOME AVAILABLE BECAUSE THEY WILL CONTAIN IMPORTANT INFORMATION THAT SUCH PERSONS SHOULD CONSIDER BEFORE MAKING ANY DECISION REGARDING TENDERING THEIR ORDINARYSHARES OR MAKING ANY VOTING DECISION. The tender offer materials (including the offer to purchase and the related letter of transmittal and certain other tender offer documents), the solicitation/recommendation statement and the proxy statement (when they become available) and other documents filed with the SEC by Thermo Fisher or Patheon, may be obtained free of charge at the SEC’s website at www.sec.gov or at Patheon’s website at www.patheon.com or by contacting Patheon’s investor relations department at 919-226-3165. In addition, investors and shareholders of Patheon may obtain free copies of the tender offer materials by contacting the information agent for the tender offer that will be named in the tender offer statement on Schedule TO.
Participants in the SolicitationPatheon, its directors and executive officers and other members of its management and employees, as well as Thermo Fisher and its directors and executive officers, may be deemed to be participants in the solicitation of proxies from Patheon’s shareholders in connection with the EGM Proposals. Information about Patheon’s directors and executive officers and their ownership of Patheon ordinary shares is set forth in the proxy statement for Patheon’s 2017 annual general meeting of shareholders, which was filed with the SEC on January 26, 2017. Information about Thermo Fisher’s directors and executive officers is set forth in the proxy statement for Thermo Fisher’s 2017 annual meeting of stockholders, which was filed with the SEC on April 4, 2017. Shareholders may obtain additional information regarding the direct and indirect interests of the participants in the solicitation of proxies in connection with the EGM Proposals, including the interests of Patheon’s directors and executive officers in the transaction, which may be different than those of Patheon’s shareholders generally, by reading the relevant documents regarding the transaction which will be filed with the SEC
Additional Information Regarding the Transaction

5
Agenda
Kenneth ApicernoVice President, Investor Relations Welcome and Safe Harbor
Marc CasperPresident and Chief Executive Officer
Extending Our Track Record of Significant Value Creation
Stephen WilliamsonSenior Vice President and Chief Financial Officer
Continuing to Deliver Exceptional Returns
Tom LoewaldSenior Vice PresidentChief Commercial Officer
Laboratory Products and Services: Our Foundation for Commercial Excellence
Mark StevensonExecutive Vice PresidentPresident, Life Sciences Solutions
Enhancing Our Leadership in Life Sciences
Patrick DurbinSenior Vice PresidentPresident, Specialty Diagnostics
Creating Value through a Differentiated Specialty Diagnostics Portfolio
Dan ShineSenior Vice PresidentPresident, Analytical Instruments Strengthening Our Leading Analytical Instrument
Platforms to Drive GrowthMichael ShaferPresident, Materials & Structural Analysis
Marc Casper Summary and Q&A

The world leader in serving science
2017 Analyst MeetingMay 17, 2017
Marc N. CasperPresident and Chief Executive Officer
Extending Our Track Record of Significant Value Creation

7
Key Takeaways
• Unrivaled leader in our industry and getting stronger• Uniquely positioned to capitalize on key market trends
• Proven strategy delivering outstanding financial performance• Organic growth driven by benefits of scale and depth of capabilities• PPI Business System drives operational excellence• Track record of effective capital deployment
• Attractive long-term financial model• 4 - 6% organic growth• 12 - 15% adjusted EPS growth• 12 - 15% free cash flow growth

8
Unmatched Depth• Leading innovative technologies
• Deep applications expertise
• Premier laboratory productivity partner
Our Mission: To enable our customers to make the world healthier, cleaner and safer
We Are The World Leader in Serving Science
Global Scale • >55,000 employees globally
• $18 billion in annual revenue
• Unparalleled commercial reach

9
Consistently Delivering Excellent Financial Performance
2012 2016
$11.6B
2012 2016
$4.16
$8.27$18.3B
10% CAGR 15% CAGR
Adjusted EPSRevenue
Leveraging our industry leadership to achieve outstanding results
2012 2016
$1.5B
$2.8B
14% CAGR
Free Cash Flow
2011 2016 2011 2016 2011 2016

10
Serving a ~$110B Market that’s Growing 3 - 5% Annually
Thermo Fisher is positioned to grow at least one point faster than the market
Academic & Government
25%
Industrial & Applied
20%
Diagnostics& Healthcare
24% Pharma & Biotech
31%$18.7B
Revenue
• Favorable demographics fuel research and better diagnostics
• Rising wealth in emerging markets
• GDP growth fueling demand• Interconnected food supply
driving increased environmental and food safety testing in emerging markets
• Rapid growth in demand for biologics and vaccines
• Strong pharma & biotech funding and drug pipelines
• Growing global focus and funding for precision medicine
• Strong investments in China’s 5-year plan priorities
NOTE: Revenue and end market percentages based on LTM through Q1 2017.

11
Complementary Segments Create Competitive AdvantageAnalytical Instruments Life Sciences Solutions
Laboratory Products and Services
Specialty Diagnostics
Microbiology
Antimicrobial SusceptibilityTesting Solutions
QuantStudioDx R qPCR
Genetic Sciences
BioPharmaServices
Laboratory Chemicals
Bioproduction
Cell Culture Reagents
Enterprise and Instrument Services
Biosciences
Life Science Reagents
Pathology
Rotary Microtome
MassSpectrometry
Fusion Lumos MS
ChromatographyVanquishUHPLC
Electron Microscopy
Titan Krios TEM
Reproductive Health
Microarrays
iCAP Triple Quad MS
ClinicalDiagnostics
PCT Biomarkers
Lab EquipmentTSX ULT Freezers
ImmunoDiagnosticsImmunoCAP Allergy andEliA Autoimmunity Tests
28%
17%
20%
35%
$18.7BRevenue
NOTE: Revenue and segment percentages based on LTM through Q1 2017.
SeqStudioCE System
Lab Consumables
E1 ClipTipPipette System
Clinical Oncology
Next-Gen Sequencing
TransplantDiagnostics
NXType High-Resolution Genotyping
Chemical AnalysisGemini Handheld Analyzer

12
Capital Deployment• Strategic M&A
• Return of capital
Organic Growth• Unique customer value proposition
• High-impact innovation
• Scale in emerging markets
PPI Business System• Productivity
• Quality
• Customer allegiance
Consistentlydelivering
strong EPS growth
Our Formula for Success Hasn’t Changed

13
Leadership in cutting-edge technology platforms and digital science capabilities2Leading presence and depth of capabilities fueling growth momentum in China3
Strong growth prospects in pharma and biotech1
Continued opportunity to drive consolidation in a fragmented industry4
• Unique customer value proposition
• High-impact innovation
• Scale in emerging markets
Organic Growth
A Proven Growth Strategy, Enhanced by Strategic M&A
• Strategic M&A
• Return of capital
Capital Deployment
Key Examples

14
Attractive Long-term Market Drivers
Unique Customer Value Proposition: Pharma & Biotech Example
• Fundamental scientific advances and global focus on precision medicine creating solid funding environment• Rapid growth in demand for biologics and vaccines• Constrained healthcare budgets lead to emphasis on productivity• Customer focus on outsourcing non-core activities
$110BAddressed
Market
Pharma & Biotech
1
2011
$2.9B
$5.6B
2016
Thermo Fisher Pharma & Biotech Revenue
9% Averageorganic growth
Opportunity Customer Value Proposition Results
Customer
Accelerate research
Support regulatory
compliance
Utilize strategic
outsourcingOptimize supply chain
Enable technical
innovation
Improve production efficiency
Improve diagnostics
Solve complex analytical
challenges
Increase lab
productivity
Partner on R&D projects

15
Pharma & Biotech: Delivering Increasing Value to Gain Share
Our leading positions across the value chain
Everything needed for the research laboratory
Industry-leading outsourcing capabilities
Rapidly growing portfolio supporting production
Research ~$3.1BRevenue
• Innovative products
• Robust software and data analytics
• Managing cost and complexity of lab supplies
• Inventory and instrument management
• On-site service and application specialists
• Low-cost, high-quality clinical packaging and logistics services
• Cold-chain solutions for biologics and to meet stringent cryo-temperature needs for cell therapy
• Partner of choice for fast-growing small-to mid-size biopharma
• Leadership in cell culture media
• Industry-leading single-use technologies
• Next-generation continuous bioprocess solutions
• Consumables, equipment and instruments for biopharmaquality control
~$1BRevenue
Clinical Trials
~$1.5BRevenue
Production
NOTE: Revenue amounts are for FY 2016.

16
High-impact Innovation: Leadership in Cutting-edge Technology Platforms
• Greater understanding of protein structure and function
• Leading cryo-electron microscopy and high-resolution mass spectrometry platforms
• Applying precision medicine approach in the real world
• Unique portfolio spanning genetic and protein analysis, biobanking, informatics and diagnostics
• Sample-to-answer solutions• Integrated chromatography and mass
spectrometry workflows combining instruments, software and consumables
• More accurate and cost-effective diagnostics
• Developing mass spectrometry-based patient sample-to-answer clinical analyzer
• Effective data management and analytics • Comprehensive digital science capabilities
Industry-leading R&D Investment Customer Needs Our Solutions
Innovation investments put us at the forefront of scientific advances
6.4% of Total Manufacturing
Revenue
$0.8B
2
NOTE: R&D and revenue based on LTM through Q1 2017.

17
Best-positioned to Help Customers Advance Precision Medicine
Genomics
ProteomicsMetabolomics
Disease Models Population Studies / Trials
DiagnosisTherapy
PrecisionTherapeutics
Response
Our Unique Depth of Capabilities Key Partner for Groundbreaking Initiatives
Genetic Analysis
Mass Spectrometry
Informatics
Biobanking
Diagnostics
Electron Microscopy
Structural Biology

18
Increasing preference for online capabilities
Storage and analysis of massive amounts of data
Improving R&D productivity and asset efficiency
Strengthening Our Capabilities to Lead in Digital Science
• Industry’s largest eBusiness footprint • >$4B eCommerce revenue • 65M annual visits• Richest technical content
• Cloud-based data storage, analytical software and bioinformatics tools
• Connected devices
• Remote monitoring and diagnostics
• Asset management software
Customer Needs Our Digital Platforms
thermofisher.com
fisherscientific.com
Thermo Fisher Cloud

19
China Market Dynamics
• Attractive fundamentals
• $9B market growing at 9% CAGR
• 13th 5-Year Plan focused on innovation, healthcare and precision medicine, environment and food safety
$18.7B Revenue
China10%
Developed Markets80%
Emerging Markets account for 20% of revenue
Capitalizing on attractive fundamentals and continuing to gain share
3
NOTE: Revenue and geographic percentages based on LTM through Q1 2017.
Scale in Emerging Markets: China Example
2011 2016
$0.6B
$1.7B
Thermo Fisher China Revenue
3
17% Average organic growth
Other Emerging Markets10%

20
China’s leading 3rd-party diagnostic services provider
Strongest Competitive Position
Commercial Leadership• Industry’s largest salesforce• Industry-leading supply chain• Leading eBusiness platform
Localization Strategy• “In China For China” products • 7 manufacturing sites; 50% of production for local market
Talent• 3,900 employees in China• 2,000 customer-facing professionals
Best-positioned to capture fast-evolving customer opportunities
Customer goal: • Adopt advanced molecular and immunodiagnostic tools
to meet emerging healthcare needs
Our response:• Expanded relationship from genetic analysis to diagnostics,
analytical instruments, lab supplies, reagents and consumables
• Leveraged eCommerce capabilities to simplify procurement
• Leveraged scale and unique value proposition to become long-term strategic supplier
Advantages of Our Scale and Depth of Capabilities in China
KingMed Diagnostics

21
Our Capital Deployment Strategy Remains Unchanged
M&A 60 - 75%
Return of Capital 25 - 40%
• M&A is the primary focus of our capitaldeployment strategy
• Fragmented industry and our proven M&A playbook create ample opportunities
• Expect share buybacks to remain the primary means of returning capital
• Capital deployment mix will vary in a given year
% of Capital we expect to deploy over next 5 years
4

22
$110B Market
100s of smaller
companies
Thermo Fisher Scientificplus top 2competitors
Our Opportunity Significant Industry Acquisitions (since 2010)
Other industry
transactions
Life Sciences Diagnostics
Since 2010:• Completed 50 transactions• Deployed $29B on M&A
Continued Opportunity to Drive Consolidation in a Fragmented Industry

23
Identifying the Right Opportunities to Create Long-term ValueStrategic Rationale Accomplishments
• Scaling the cryo-electron microscopy platform for life sciences applications
• Great core business and the industry leader
• Acquired at bottom of semiconductor and material science cycle
• Accelerated organic growth to mid-single digits
• Realized $350M in synergies
• Still capturing additional synergies
• Great core business and the industry leader
• Bought at bottom of the funding cycle
• Built a scale chromatography player• Leverage Dionex’s chromatography
position to propel Thermo Fisher to a top-tier chromatography player
Analytical Instruments
Life Sciences Solutions
Specialty Diagnostics
(2011)
(2016)
• Successfully expanding in the U.S. market
• Expanded EBITA margin by >1,000 bps
• Leading European allergy businessand autoimmunity platform that couldbe scaled globally(2011)
(2013)
Examples

24
Acquisition of Patheon – Creating Customer & Shareholder Value
• Patheon – a leading Contract Development & Manufacturing Organization (CDMO)
• Excellent complementary capabilities that strengthen our unique value proposition for biopharma customers
• Net purchase price of $7.2B in cash, which includes the assumption of $2.0B of net debt1
• Financially compelling and expected to be immediately and significantly accretive to adjusted EPS in first full year after close
• Expected to close by the end of 2017
1Net debt as of Jan 31, 2017

25
CDMO: A Large and High-Growth Market
• A $40B global market growing mid-single to high-single digits
• Biotech companies typically require a broad set of outsourced development and manufacturing capabilities
• Larger biopharma players are increasing outsourcing and consolidating to fewer, trusted suppliers
• Highly fragmented, with top 10 players comprising ~35% of market
Development Services Active Pharmaceutical Ingredient Manufacturing Finished Dosage Form Manufacturing
• $24B market
• Manufacturing of active pharmaceutical ingredients (APIs):• Biologics: large molecules expressed in mammalian
and microbial cells
• Chemical: small molecules
• $15B market
• Commercial manufacturing and packaging of finished dosage forms:• Complex formulations of tablets, capsules, powders
• Soft gel products
• Injectables
• $2B market
• Development services include:• Drug pre-formulation / formulation
• Regulatory consulting services
Strong leader offering full spectrum of services
Focused player with flexible solutions for biologics and expertise with complex chemistries
Strong leader covering wide range of finished dosage forms

26
Patheon Overview
St. Louis, MO
Manati, Puerto Rico
Florence, SC
Greenville, NC
Linz, Austria
Ferentino and Monza, Italy
Locations
Drug Substance Services - BiologicsDrug Substance Services - API
Drug Product ServicesPharma Development Services
4%
28%68%
EuropeNorth
America
ROW
Revenue by Geography
12%
27%Revenue by Business / Capability
61%
Pharmaceutical Development Services
• Leading global provider of CDMO services• Revenue: $1.9B• Adjusted operating margin of 17%• ~9,000 employees globally • 26 manufacturing and development locations
Drug Substance Services
Serves API Manufacturing Segment
Drug Product Services
Serves Finished Dosage Form
Manufacturing Segment
Note: Financials reflect LTM as of Jan 31, 2017

27
Strategic Rationale for Acquisition of Patheon
• Provides entry into the attractive, high-growth, fragmented CDMO market
• Enhances Thermo Fisher Scientific’s unique customer value proposition for biopharma customers
• Thermo Fisher’s unmatched global commercial reach opens new opportunities for Patheon
• Delivers attractive financial benefits to create shareholder value

28
Key Takeaways
• Unrivaled leader in our industry and getting stronger• Uniquely positioned to capitalize on key market trends
• Proven strategy delivering outstanding financial performance• Organic growth driven by benefits of scale and depth of capabilities• PPI Business System drives operational excellence• Track record of effective capital deployment
• Attractive long-term financial model• 4 - 6% organic growth• 12 - 15% adjusted EPS growth• 12 - 15% free cash flow growth

The world leader in serving science
2017 Analyst MeetingMay 17, 2017
Stephen WilliamsonSenior Vice President and Chief Financial Officer
Continuing to Deliver Exceptional Returns

30
Agenda
• PPI Business System
• 2016 Financial Performance Review
• 2017 Full-year Guidance Review
• 2018 - 2020 Financial Model

31
Capital Deployment• Strategic M&A
• Return of capital
Organic Growth• Unique customer value proposition
• High-impact innovation
• Scale in emerging markets
PPI Business System• Productivity
• Quality
• Customer allegiance
Consistentlydelivering
strong EPS growth
Our Formula for Success Hasn’t Changed

32
Practical Process Improvement (PPI) Business System Drives Operational Excellence
Quality
Productivity
CustomerAllegiance
Consistently deliver world-class products and services
Exceed expectations to maximize customer success
Improve operating and process efficiency
to strengthen our competitive
advantage
• Accelerate organic growth
• Expand margins
• Enhance cash flow
Impact of PPI:

33
PPI Business System in Action: TSX Freezers Example
Organic growth
• 50% reduction in energy consumption for our customers
• Ultra-low temperature freezer sales growing 3x faster
Margin expansion
• Improved reliability • Fewer warranty calls and returns
Cash flow
• Lower inventory carrying costs• Lower capital investments

34
Customer Allegiance
Score
2014 2016
Measure 2014 2015 2016
Kaizen Events 704 1,357 1,610
Gemba Walks 5,610 23,233 29,641
“Just-do-its” Implemented 11,684 30,737 40,550
Actions Impact
PPI Productivity
($M)
2014 2016
Inventory Days of Supply
2014 2016
PPI Business System in Action: Life Technologies Acquisition Example

35
Attractive Revenue Profile Positions Us for Growth
Balanced and DiverseCustomer Base
Growing Presence in Emerging Markets
Strong RecurringRevenue Mix
NOTE: Revenue and percentages based on LTM through Q1 2017.
Total Revenue: $18.7B
Consumables
60%
Services
14%
Instruments
26%Industrial& Applied
20%
Diagnostics& Healthcare
24%Pharma
& Biotech
31%
Academic &Government
25%
Europe
24%
Asia-Pacific
21%
ROW
3%
52%
North America

36
2016 Review: Ongoing Strong Performance
Very strong tactical and strategic execution
2014 2015
Adjusted Operating Margin
60 bps Expansion
23.1%
22.5%
Revenue
4% Organic Growth
$17.0B
$18.3B
2014 2015
Adjusted EPS
12% Growth
$7.39
$8.27
2015 20162015 20162015 2016 2015 2016 2015 2016
Free Cash Flow
12% Growth
$2.5B
$2.8B

37
2017 Full-year Guidance: Key Assumptions (as provided on April 26, 2017)
Organic Revenue Growth
• Total company organic growth: 4%
M&A Contribution• Revenue contribution: just over +4.5%
• Adjusted EPS contribution: +$0.31 (~4%)
FX Impact• Revenue headwind: just under -1.5%
• Adjusted EPS headwind: just over -2%
Adjusted Operating Margin Expansion
• Adjusted operating margin expansion: +40 to 60 bps
Capital Deployment• Acquisitions: Includes impact of Finesse Solutions and Core Informatics acquired in February 2017 in March 2017
respectively. Does not include any potential impact from the announced acquisition of Patheon
• Share Buybacks: Completed $750M of share buybacks
• Dividends: $240M of dividend payments for the full year

38
2017 Full-year Guidance: Summary
Another year of very strong financial performance
* 2017 Guidance as provided on April 26, 2017.
2017Guidance*
2016Actual
YOYChange
Revenue $19.51 - $19.71B $18.27B 7% - 8%
Organic Growth 4% 4%
Adj. Operating Margin 23.5 - 23.7% 23.1% 40 - 60 bps
Adjusted EPS $9.12 - $9.28 $8.27 10 - 12%
Free Cash Flow $3.15B $2.8B 11%

39
Balance Sheet Leverage
NOTE: Leverage ratio = total debt to trailing twelve months adjusted EBITDA.
Guiding Principles
• Maintain investment-grade rating
• Appropriately manage debt maturity timeline
• Preserve financial flexibility
Q3'16 Q1'17
Total Debt
3.6x
$18.9B
Leverage Ratio
Q1 2017Q3 2016
$17.1B
4.2x

40
2018 - 2020 Financial Model
A combination of strong operational execution and disciplined capital deployment generate very strong shareholder returns
2017 (G) 2020 (M) 3-yr CAGR
Adjusted EPS $9.20 $12.90 - 13.90 12 - 15%
(G) = Mid-point of guidance as provided on April 26, 2017. (M) = 2018 - 2020 financial model.
Generating very strong shareholder returns

41
2018 - 2020 Financial Model: Operational Performance Before Capital Deployment
Operational assumptions before future capital deployment:• Annual organic revenue growth: 4 - 6%
• Adjusted operating margin expansion: 40 - 50 bps from operations plus impact of completed acquisitions
• Free cash flow conversion: 90% of adjusted net income
(G) = Mid-point of guidance as provided on April 26, 2017. (M) = 2018 - 2020 financial model.
Expected Operational Outlook Excluding Impact of Capital Deployment
2017 (G) 2020 (M) 3-yr CAGR
Revenue $19.6B $22.0 - 23.1B 4 - 6% organic
Adj. Operating Margin 23.6% 25 - 26% 60 - 70 bps
Adjusted Operating Income $4.6B $5.6 - 6.0B 6 - 9% growth
Adjusted ROIC ~10% 13 - 14% 90 - 120 bps
A very strong operational outlook

42
2018 - 2020 Financial Model: Including Capital Deployment
Below-the-line and capital deployment assumptions:• Includes the acquisition of Patheon assuming a 12/31/17 close date
• Deploy $12B of capital 2018-2020:
• 65% for bolt-on M&A and 35% on share buybacks/dividends
• Dividends increasing modestly
• Leverage: 2.75x average year end leverage 2017-2020
• Tax rate of 13.5% in 2020: Does not incorporate potential benefit of U.S. tax reform
Generating very strong shareholder returns
2017 (G) 2020 (M) 3-yr CAGR
Adjusted EPS $9.20 $12.90 - 13.90 12 - 15%
(G) = Mid-point of guidance as provided on April 26, 2017. (M) = 2018 - 2020 financial model.

43
Generating solid returns while investing for the future
Q1'13 Q1'14
NOTE: Adjusted ROIC = annual adjusted net income excluding net interest expense, net of tax benefit, divided by trailing five quarter average invested capital.
Focused on Return on Invested Capital
10.0%
Adjusted ROIC
2020 (M)Q1 2017
• Expanding adjusted ROIC by 90-120 bps annually without M&A
• Timing and scale of M&A will impact actual ROIC
13.5% Without M&A
11.6% With M&A Assumptions

44
$4.16$4.94 $5.42
$6.96 $7.39$8.27
Adjusted EPS
A Great Track Record and a Bright Future
$12.90 - $13.90
20152014201320122011 2016 2020 (M)
(M) = 2018 - 2020 financial model.
Continuing to deliver exceptional returns

The world leader in serving science
2017 Analyst MeetingMay 17, 2017
Tom LoewaldSenior Vice PresidentChief Commercial Officer
Laboratory Products and Services: Our Foundation for Commercial Excellence

46
Agenda
• Laboratory Products and Services Segment• Laboratory Products
• Research and Safety Market Channel
• BioPharma Services
• Our Unique Customer Value Proposition• Leveraging Corporate Accounts
• Comprehensive Services Portfolio
• Digital Platform for Science

47
Laboratory Products and Services Overview
Industry-leading capabilities enhance our leadership position
$6.7B Revenue
• Best-in-class global clinical trials supply-chain partner
• Logistics, packaging and biorepository storage
BioPharmaServices
• Industry-leading portfolio• World-class supply chain• Leading eBusiness platform• Differentiated services offering
Research and Safety Market Channel
• Sample preparation and storage• Centrifugation• Cold storage• Liquid handling• Laboratory chemicals
Laboratory Products
NOTE: 2016 total revenue before inter-company eliminations.

48
Instruments
23%
Services
19%
Consumables
58%
Laboratory Products and Services Profile
5%2016
Organic Growth
14.4%Adj. Operating
Margin
Key Market Trends
• Global investments in life sciences and healthcare driven by scientific advances and changing demographics
• Growth of targeted therapies and biologic drugs
• Constrained budgets lead to greater emphasis on lab productivity
• Customer focus on outsourcing non-core lab operations
• Digital technologies driving greater connectivity and powerful analytics
NOTE: 2016 total revenue before inter-company eliminations.
$6.7B2016 TotalRevenue
Laboratory Products
28%
BioPharmaServices
15%Research
and Safety Market Channel
57%
20%Europe
Asia-Pacific
12%
ROW
3%
65%
North America

49
Our Offering• Industry leader with a
comprehensive portfolio of lab equipment, chemicals and consumables
• Deep applications expertise
• Low-cost global manufacturing network
• Unmatched commercial reach
Laboratory Products: In Every Lab, Every Day
Customer Needs
• Enhanced lab productivity via high-quality, reliable and cost-efficient products
• Increased energy efficiency
• Remote monitoring and smart diagnostics
• High purity and conveniently packaged chemicals and reagents

50
Option 1
Broadest Product Offering Transactional Efficiency Differentiated Services
Enabling customer choice and convenience
Streamlined transaction processes
Value-added services are difficult for competitors
to replicate at scale
The Ultimate Channel Partner
• Industry-leading portfolio of >1M products from ThermoFisher and external brands
• Seamless eCommerce customer experience
• Purchasing/supplier aggregation services
• >65% of transactions are conducted online
• Deep technical expertise• Rich scientific content on
fishersci.com• Access to technical support
specialists
• Specialized supply chain• Cold-chain logistics• Handling of chemicals and other
hazardous materials• 2,000 on-site stocking locations
• On-site inventory management services that are tightly integrated with Fisher Scientific capabilities
• Conveniently accessing broad portfolio of lab products
• Consolidating purchasesto leverage scale
• Increasing efficiency of purchasing processes
• Linking on-site lab and inventory management processes
Customer Needs

51
BioPharma Services: Enhancing Clinical Trials Productivity
We are the leading clinical trials supply chain provider
• Accelerating time-to-market for new drugs
• Reducing costs of clinical trials
• Ensuring quality and regulatory compliance
• Single source for a full range of packaging, distribution and logistics services
AdministerDrug to Patient
Distribution & LogisticsStoragePackage
& LabelDevelop &
Manufacture
BioPharma Services Offering
Clinical Trials Workflow
Majority of top 500 biopharma companies
worldwide are our customers
Large global footprint:3M+ sq. ft. dedicated to
clinical drug supply
25+ yearsof experience with
clinical trials
Customer Needs

52
Agenda
• Laboratory Products and Services Segment• Laboratory Products
• Research and Safety Market Channel
• BioPharma Services
• Our Unique Customer Value Proposition• Leveraging Corporate Accounts
• Comprehensive Services Portfolio
• Digital Platform for Science

53
1 Leveraging Corporate Accounts
2 Comprehensive Services Portfolio
Digital Platform for Science3
Delivering Our Unique Customer Value Proposition
Global Commercial Scale
• Laboratory Products
• Life Sciences Solutions
• Speciality Diagnostics
• Analytical Instruments
Customer
Accelerate research
Support regulatory
compliance
Utilize strategic
outsourcingOptimize
supply chain
Enable technical
innovation
Improve production efficiency
Improve diagnostics
Solve complex analytical
challenges
Increase lab
productivity
Partner on R&D projects

54
Corporate Accounts: Enabling Superior Access and Value Creation
Thermo Fisher Scientific Capabilities
Customer SegmentsAcademic andGovernment
BioPharma
Healthcare
Industrial
Corporate Accounts Team
• Represent completeportfolio
• Simplify access to and coordinate support from our business teams
Clinical TrialsServices
Unity Lab Services
AnalyticalInstruments
LaboratoryProducts
Life Sciences Solutions
Specialty Diagnostics
C-suite engagement
Impact of Corporate Accounts Program on Biotech Customer Segments
3xincrease
7xincrease
Accounts
Revenue
Change 2014 to 2016
1

55
3,200 global service employees
• World-class expert repair and servicing capabilities
• Scalable solutions for asset management, onsite inventory management and other services
• Full process ownership and lab management
55
Total Lab Solutions
Enterprise-wide Services
Instrument Support
Evolving scope and sophistication of customer needs
• Maximizing uptime for technically complex instruments
• One-stop access to a portfolio of lab services
• Outsourcing of non-core lab management functions
• Greater productivity in lab operations
Most Comprehensive Services Offering2
Customer Needs

56
Leading Scientific eCommerce Engine
100K+accounts
10M contacts
850Kregisteredusers
34Mstorefront visits
$4B+annual revenue
65Mvisitors
Digital ScalePremier Web Properties
3

57
Extending Our Digital Impact
Customer Needs
• Delivering premier scientific content
• Online choice and convenience with seamless transactions, order tracking and B2B aggregation
• Accelerating scientific collaboration with cloud-enabled informatics and specialized analytical software
• Improving R&D productivity and asset efficiency through connected devices, mobile applications and real-time monitoring
Thermo Fisher Cloud
Cloud-enabled Platform for Science
Downloadable scientific methods and application libraries
Real-time remote monitoring of experiments
Asset management Desktop and mobile applications
Microarrays
Next-gen sequencing
Consumables

58
• Premier laboratory productivity partner for our customers
• Unparalleled commercial reach, customer access and impact
• Industry-leading capabilities and commercial scale allow us to grow faster than the market
Laboratory Products and Services: Our Foundation for Commercial Excellence

The world leader in serving science
2017 Analyst MeetingMay 17, 2017
Mark StevensonExecutive Vice PresidentPresident, Life Sciences Solutions
Enhancing Our Leadership in Life Sciences

60
Life Sciences Solutions Overview
Genetic Sciences
• Genetic analysis (sequencing, arrays and qPCR)
• Clinical applications• Human identification• Agbio and animal health
Biosciences
• Molecular biology• Synthetic biology• Cell biology• Protein biology• Cell analysis
Bioproduction
• Media• Single-use technologies• Purification• Analytics, control automation
and systems software
Unrivaled portfolio to accelerate life science research, discovery and bioproduction
$5.3B Revenue
NOTE: 2016 total revenue before inter-company eliminations.

61
Instruments
12%
5%
Consumables
83%
GeneticSciences
36%
Bioproduction
21%
Biosciences
43%
Life Sciences Solutions Profile
NOTE: 2016 total revenue before inter-company eliminations.
7%2016
Organic Growth
30.0%Adj. Operating
Margin
6.5%R&D as % of
Manufacturing Revenue
Key Market Trends
• Fundamental scientific advances driving demand for innovative life science tools
• Robust growth prospects for biotherapeutics and cell therapy
• Growth in clinical applications for genetic sciences
• Strong growth in Asia-Pacific, particularly China, Korea, India
• Customers seeking to drive productivity by purchasing more on line and through corporate programs
$5.3B2016 TotalRevenue
Services
27%Europe
Asia-Pacific
25%
ROW
4%
44%
North America

62
Accelerated Organic Growth
• Strategic investments to fuel growth• Revitalized core Biosciences capabilities• Expanded Bioproduction capabilities and capacity• Focused Next-Gen Sequencing on clinical
applications
• Leveraging the company’s global scale and industry-leading commercial reach• Extensive corporate account relationships• Unparalleled reach of Fisher Scientific channel
Key Levers
2%
2013 2014 - 2016
5%*Average
Organic Growth
* Pro forma, as if Life Technologies was owned for the entire period. 2014 organic growth has not been recast to reflect product line movements that were effective 1/1/2017.
Strong foundation for long-term growth
Life Sciences Solutions: Our Growth Transformation
Life Sciences Solutions Segment

63
Harnessing the company’s channel and eBusiness capabilities to drive strong incremental growth4
Extending our leadership position in Biosciences1
Expanding our strong position in Bioproduction3
Strengthening our Genetic Analysis portfolio 2
Capitalize on opportunities to extend our leadership
• Investing in high-impact innovation
• Executing strategic bolt-on M&A to enhance our depth of capabilities
Life Sciences Solutions: Our Growth Strategy
Leverage the company’s industry-leading global scale and commercial reach

64
Biosciences: Extending Our Leadership Position1
Opportunity
High-impact Innovation
• Investments in high-growth segments• Cell Biology: Stem cells
and cell therapy• Molecular Biology: Gene
editing with CRISPR
Enhancing Capabilities
• Bolt-on M&A to strengthen portfolio• eBiosciences (Affymetrix)• MTI-GlobalStem
Focused Growth Strategy
Commercial Approach
• Leveraging our scale and channel strength
• Continue to enhance our online presence with industry-leading eBusiness capabilities
ü Well-positioned for continued strong growth
$14B+Market
$2B+Revenue
Strong leadership position in life science reagents and
consumables
Large market with focused opportunities for growth

65
Strengthening our industry leadership with revenue growing high-single digits
Future Outlook
• Innovative products for high-growth segments• Protein expression reagents• Gibco media to optimize stem cell workflow
(for gene editing)
• Adding new capabilities• Expertise in transfection, neuroscience and
stem cell biology (MTI-GlobalStem)• Integrating our Nalgene/Nunc cell culture plastics
at every stage of the workflow
• Utilizing digital content and marketing to drive demand generation on eBusiness platforms
$2.5B+Market
• Growing mid-single digits
• Driven by demand for biologics and cell therapies
Our Strategy
Extending Our Leadership in Biosciences: Cell Biology Example
Opportunity

66
Genetic Analysis: Right Tool for the Job
• Innovation across multiple platforms
• QuantStudio 3 and 5 Real-Time PCR Systems
• Ion Torrent S5/Chef for high-quality gene panel sequencing
• SeqStudio Genetic Analyzer for easy-to-use Sanger sequencing
• All our Genetic Analysis platforms are connected to the Thermo Fisher Cloud
Multi-platform Portfolio High-impact Innovation Commercial Approach
• Portfolio encompasses:
• Next-Gen Sequencing (NGS)
• Quantitative Polymerase Chain Reaction (qPCR)
• Capillary Electrophoresis (CE)
• Microarrays
• Positioning the right platform for specific needs
• Leveraging company’s channel strength and corporate accounts
• Pharma and diagnostic company partnerships to advance companion diagnostics
$15B+Market
• Mix of segments with distinct growth profiles
• Very fast-growing clinical NGS segment
• Traditional techniques are the gold standard for certain key applications
$2BRevenue
Focused Growth Strategy
2
Opportunity
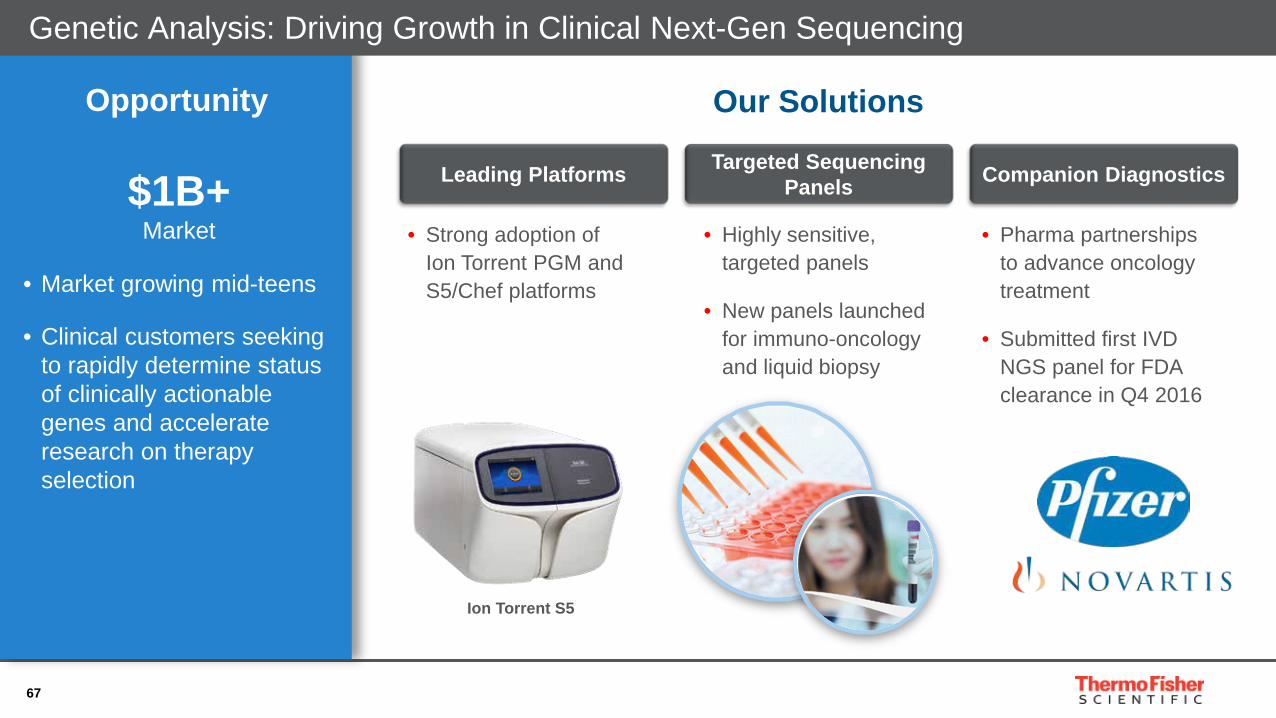
67
Ion Torrent S5
Leading Platforms Targeted Sequencing Panels
• Strong adoption of Ion Torrent PGM and S5/Chef platforms
• Highly sensitive, targeted panels
• New panels launched for immuno-oncology and liquid biopsy
Our Solutions
Companion Diagnostics
• Pharma partnerships to advance oncology treatment
• Submitted first IVD NGS panel for FDA clearance in Q4 2016
$1B+Market
• Market growing mid-teens
• Clinical customers seeking to rapidly determine status of clinically actionable genes and accelerate research on therapy selection
Genetic Analysis: Driving Growth in Clinical Next-Gen Sequencing
Opportunity

68
Clinical NGS Example: Enabling Precision Medicine Approach in Oncology
Oncomine NGSpanels
• National Cancer Institute’s MATCH project
• High sample success rate (96.98% sensitivity and 99.99% specificity)
Immune Response Assay: targeted gene expression panels
• Successfully measures changes in tumor micro-environment in response to immunotherapies
Liquid Biopsy Assay for circulating free DNA
• Oncomine Lung cfDNA assay tested by 11 institutions in Europe, Canada and Japan
• Detected low-level mutations in circulating free DNA control samples
Our Answer: Ampliseq
• Gold standard underlying amplification chemistry
• Used in our Oncominetargeted sequencing panels
Customer Need
Higher sensitivity and specificity of results from limited sample amounts
Case Studies

69
• Affordable solution for lower-throughput capillary electrophoresis
• Easy to use: Multiple components contained in a single cartridge to simplify workflows
• Thermo Fisher Cloud: enables collaboration, remote setup/monitoring and data management
“You make it easier for us and streamline the process so we can focus on the science.”
- Early Access Hospital User
• Sanger sequencing is the gold standard for certain key research applications
• Large and loyal customer base using our Sanger sequencers
SeqStudio Genetic AnalyzerOpportunity
Genetic Analysis Innovation Example: SeqStudio Launch

70
QC & Analytics
Control Systems and Software
Cell CultureSingle-use
Bioreaction,Fermentation
Media Formulation
Harvest &Collection Separation
Transport, Bulk Storage
& Final Fill
While investing in manufacturing and other capabilities in the U.S., Europe and APAC
Bioproduction: Strengthening Our Position Across the Workflow
Well-positioned to continue strong double-digit growth momentum
Leading positions in cell culture media and
single-use technologies
Expanded single-use offering via acquisition of Advanced Scientifics
2013 2015 2017
• Acquired control systems and software via Finesse Solutions ($50M+ revenues)
• Integrated existing capabilities (production chemicals, single-use storage)
$5BSegment
• Growing double-digits
• Driven by strong growth of biologics, emergence of biosimilars and immunotherapies
$1B+Revenue
3
Opportunity

71
Our Strategy
Leveraging Total Company Scale and Commercial Reach
InvitrogenEnd-Point PCR
Gibco Sera and Media
Applied BiosystemsThermal Cyclers
2015: 14,000 SKUs added to the Fisher Scientific channel
2016: Expanded offering with additional 18,000 SKUs
Achieved 3x increase in organic growth rate for offered products
• Further leverage commercial reach of our Fisher Scientific channel and corporate accounts
• Utilize eBusiness and digital marketing capabilities to increase cross-selling opportunities
4

72
Our Strategy
• Further leverage commercial reach of our Fisher Scientific channel and corporate accounts
• Utilize eBusiness and digital marketing capabilities to increase cross-selling opportunities
• Harnessed existing life sciences online customer base to cross-sell complementary laboratory products
• Utilized powerful data analytics and digital marketing to drive eBusiness and demand generation across the total portfolio
4.6M+ website visits per year
$150M+ eCommerce revenue in 2016
65%Revenue CAGR from 2013-16
Industry-leading eBusiness platform in China drives incremental growth
Our Strategy Strong Results
Leveraging Total Company Scale and Commercial Reach: China Example
Key Growth Initiatives

73
• Capitalizing on opportunities in high-growth segments through targeted innovation and strategic bolt-on M&A
• Leveraging company’s industry-leading global scale and commercial reach to drive growth
• Exceptionally positioned to extend our strong leadership positions
Enhancing Our Leadership in Life Sciences

The world leader in serving science
2017 Analyst MeetingMay 17, 2017
Patrick DurbinSenior Vice President President, Specialty Diagnostics
Creating Value through a Differentiated Specialty Diagnostics Portfolio

75
Specialty Diagnostics Overview
• Comprehensive offering of diagnostic laboratory products
• Serving U.S. hospitals and reference labs
HealthcareMarket Channel
• Novel biomarkers • Drugs of abuse • OEM and contract
manufacturing services
ClinicalDiagnostics
• Allergy and autoimmunity diagnostics
Immuno-Diagnostics
• Microbial and food safety testing
Microbiology
• Cancer diagnostics sample preparation
• High-grade specialty glass slides
AnatomicalPathology
TransplantDiagnostics
• Tissue typing and matching
• Antibody screening and post-transplant monitoring
$3.3B Revenue
NOTE: 2016 total revenue before inter-company eliminations.
Leading positions in attractive niche diagnostic segments

76
Instruments
7%
Consumables
91%
Services
2%
Specialty Diagnostics Profile
4%2016
Organic Growth
27.2%Adj. Operating
Margin
4.9%R&D as % of
Manufacturing Revenue
Key Market Trends
• Rising demand for diagnostics
• Increasing prevalence of cancer and infectious disease
• Heightened need for antibiotic stewardship
• Increasing food safety risks due to globalization of food supply chain
• Increasing use of illicit drugs
• Better diagnostics improving strategies to prevent, manage and treat disease
• Pressure to control healthcare costs
$3.3B2016 TotalRevenue
NOTE: 2016 total revenue before inter-company eliminations.
Immuno-Diagnostics
17% 20%
Microbiology
Clinical Diagnostics
15%
AnatomicalPathology
10%
Transplant Diagnostics
7%Healthcare
MarketChannel
31%
Europe
27%
Asia-Pacific
11%
ROW
3%
59%
North America

77
Food Safety
Specialty Diagnostics Businesses: Our Differentiated Portfolio
Sepsis
Autoimmunity
• Niche diagnostic segments• Typically ordered by physician specialists• Dedicated lab workflows and instruments
• Strong positions with differentiated, proprietary solutions• Benefitting from total company capabilities
• Life science technologies and expertise• Comprehensive suite of laboratory products• Commercial scale
Allergy
Microbiology
Cancer Sample Prep
Transplant
Drugs of Abuse

78
1 Improving clinicians’ abilities to diagnose disease and enabling labs to increase productivity
2Capitalizing on total company capabilities in molecular technologies and mass spectrometry to improve patient diagnostics
3 Strengthening our presence in underpenetrated geographies
• Offering superior value to clinicians and labs
• Solving customer challenges with innovative life science tools
• Pursuing opportunities to leverage global scale
Specialty Diagnostics: Our Growth Strategy

79
Improving Diagnosis and Increasing Productivity1
Greater Diagnostic Value Improved Lab Productivity
Customer Needs
• Clinicians seeking more accurate information to better diagnose
• Labs under pressure to increase productivity
• Labs seeking convenience of working with fewer suppliers
Our Solution
• Higher accuracy• Fewer misdiagnoses and
reduced false-positives• Stronger evidence
• Optimized workflows• Reduced complexity• Reduced labor requirements• Increased throughput
• Full suite of Thermo Fisher laboratory offerings
• Easy access via Fisher Healthcare channel
Comprehensive portfolio creates better patient outcomes
Complete Solution

80
Improving Diagnosis: Celiac Example
Customer ChallengesCeliac Patients: • Lack of diagnosis can lead to painful symptoms
and higher rate of complications• Misdiagnosis leads to highly restrictive diets, such
as gluten free
Providers and Laboratories: • Limited availability of assays and high cost of
biopsies constrain usage
Our SolutionProprietary Celiac Assay: Celikey (anti-tTG) Gliadin test• High quality• Fewer biopsies necessary• Automated via our proprietary platform
Opportunity• ~1% of global population has Celiac disease• 80% of people with Celiac disease have
not yet been diagnosed

81
Unique understanding of customer challenges
Broadest portfolio of life science technologies
Customer Needs
• Cutting-edge technologies are yielding powerful insights in life science research
• Diagnostic customers seeking to leverage these technologies in their labs to improve patient outcomes
Our Differentiated Approach
• Strong relationships with customers in specialty diagnostics
• Deep understanding of customer needs
• Strong technology leadership• Ability to drive adoption of life
science tools for specific diagnostic applications
Broad portfolio creates unrivaled ability to solve healthcare challenges
Capitalizing on Total Company Capabilities2

82
Innovative Life Science Tools in the Clinical Lab: Transplant Example
Customer Challenges Our Solution*
Opportunity• 50,000 bone marrow transplants performed
worldwide every year
Bone Marrow Transplant Patients: • Suboptimal donor matches increase likelihood
of infection, complications and death
Providers and Laboratories:• High cost of poor matches• Information lacks quality or takes too long
(e.g. existing NGS solution)
Complete Transplant NGS Workflow• Highest-quality information yielding greatest transplant
success rate
• Fastest time to result
• Now available with our most advanced next-generation sequencing platform: Ion Torrent S5
NxType
Ion Chef
Ion Chef
S5
Ion TorrentS5
Software
Typestream
* For research use only, not for use in diagnostic procedures.

83
Targeting 2018 launch
Innovative Life Science Tools in the Clinical Lab: Mass Spectrometry Example
• Healthcare providers are seeking more powerful diagnostic information
• Complicated diagnostic workflow requires sophisticated technical expertise
Our Solution
Proprietary walkaway mass spectrometry-based clinical analyzer
• Focused on offering superior medical information relative to immunoassays
• Simple workflow, minimal technical expertise required
• Provides hospitals access to mass spectrometry for diagnostics
• Significantly reduced turnaround times
Customer Challenges

84
Growing Our Businesses in Underpenetrated Geographies
FoodSafety
Sepsis
Allergy Allergy
TransplantCancerSample
Prep CancerSample
Prep
Auto-immunity
Micro-biology
TransplantFoodSafety
Auto-immunity
3
Significant growth opportunities exist in multiple geographies

85
Pursuing Opportunities in Underpenetrated Regions: Allergy Testing Example
U.S.• Secured core lab contracts• Authorities changing unfavorable
reimbursement policies given strong clinical and health economic evidence
Asia-Pacific• Captured screening volume with proprietary
solution (ViewAllergy) in Japan• 30+ tests recently registered in China• Steady growth in Taiwan and South Korea
Opportunity
• ~25% of the global population has allergies
• Allergy blood testing is underpenetrated in the U.S. and Asia-Pacific
• Capitalizing on our leadership in Europe to pursue greater penetration in other regions
Building on our success around the world

86
• Niche specialty diagnostics businesses with strong defensible positions
• Providing critical information for patients, clinicians and laboratories
• Leveraging capabilities, commercial access and total company global presence
Creating Value through a Differentiated Specialty Diagnostics Portfolio

The world leader in serving science
2017 Analyst MeetingMay 17, 2017
Dan ShineSenior Vice PresidentPresident, Analytical Instruments
Mike ShaferPresident, Materials and Structural Analysis
Strengthening Our Leading Analytical Instrument Platforms to Drive Growth

88
Analytical Instruments Overview
Industry-leading technologies to solve a broad range of complex challenges
Chromatography & Mass Spectrometry
Chemical AnalysisInstruments
Materials & Structural Analysis
• Life sciences mass spectrometry• Liquid, ion, gas chromatography• Inorganic/trace elemental analysis• Laboratory informatics
• Electron microscopy• Molecular and elemental
spectroscopy• 2D/3D imaging software
• Portable analytical instruments• Air-quality monitoring• Radiation safety and security• Process instruments
Corp. Fin. to update to LTM Revenue ending in Q1 2017$3.7B Revenue
NOTE: 2016 total revenue before inter-company eliminations.

89
Services
26%
8%
Instruments
66%
Europe
25%
Asia-Pacific
40%
ROW
5%
30%
North America
Analytical Instruments Profile
NOTE: 2016 total revenue before inter-company eliminations.
$3.7B2016 TotalRevenue
3%2016
Organic Growth
20.3%Adj. Operating
Margin
8.3%R&D as % of
Manufacturing Revenue
Key Market Trends
• Strong funding for precision medicine and structural biology
• Global regulations driving new opportunities in applied markets, especially in Asia-Pacific
• Breakthroughs in nanotechnology for new materials development
• Commodity-driven industrials beginning to rebound following strong headwinds in recent years
Consumables
Chromatography& Mass Spec
59%
ChemicalAnalysis
19%
22%
Materials &Structural Analysis

90
Chromatography& Mass Spec
50%
ChemicalAnalysis
16%
Materials &Structural Analysis
34%
Services
27%
7%
Instruments
66%
Analytical Instruments Profile: Including Pro forma FEI Revenue
Key Market Trends
Europe
25%
Asia-Pacific
39%
ROW
4%
32%
North America
Consumables
$4.3B*2016 Pro formaTotal Revenue
NOTE: 2016 total pro forma revenue before inter-company eliminations.* Pro forma revenue for Analytical Instruments segment as if FEI was owned for all of 2016.
• Strong funding for precision medicine and structural biology
• Global regulations driving new opportunities in applied markets, especially in Asia-Pacific
• Breakthroughs in nanotechnology for new materials development
• Commodity-driven industrials beginning to rebound following strong headwinds in recent years

91
Analytical Instruments: Our Growth Strategy
Continue strong growth trajectory in China and capitalize on new growth opportunities in Asia3
Continue to gain share in chromatography and strengthen mass spectrometry leadership1
Further integrate portfolio to deliver tailored workflows for pharma and applied markets2
Execute proven playbook to meet synergy targets and unlock structural biology potential4
• Leverage proven innovation track record
• Deliver complete application-based solutions and powerful analytics through our digital platform
• Capitalize on global scale in emerging markets
• Create new growth engine through FEI acquisition

92
Chromatography: We Have a Top-tier Market Position
• Developed highly innovative technologies across liquid, gas and ion chromatography
• Leveraged mass spec leadership and customer relationships to drive growth à Increased connect rate from 30% to 70%
• Enabled more powerful analytics by integrating gold-standard Chromeleon software and LIMS capabilities
• Leveraged Thermo Fisher eBusiness platform to deliver superior customer experience and accelerate consumables growth
Well-positioned to continue achieving above-market growth
• Built a scale chromatography player
• Comprehensive portfolio with technology leadership
• High single-digit growth business
Our Position TodayOur Position in 2011
• Before Dionex, we had niche positions in HPLC and GC
• Dionex had strength in IC and limited position in HPLC
• Low-growth business
1
High-Performance Liquid Chromatography (HPLC)
Ion Chromatography (IC)
Chromatography Consumables
ChromeleonCDS
Gas Chromatography (GC)

93
Mass Spectrometry: Evolution of Our Orbitrap Franchise
>5,000Instruments
Sold
>2,000Orbitrap-basedPublications1
1) Includes only major Nature and Science journals.
Introduced OrbitrapHigh Resolution Accurate Mass to market
Launched first Orbitrap benchtop instrument
Enabled first MS-based mapping of human proteome
Launched Fusion Lumosplatform, setting new standards for sensitivityand processing power
Orbitrap emerging as MS technology of choice for Precision Medicine
2005
2011
2014
2015
2016
2017
Exciting innovations for both research and applied markets
Continuing our long history of advancing scientific discovery

94
• Complete end-to-end workflow with integrated hardware and software
• Enables increased accuracy to reduce cost of quality
• Quality control method replaces many standalone assays, enabling faster structure validation
• Full software analytics to support customer requirements
ü Enabling highly differentiated workflows for a range of industries
ChromeleonCDS
Biopharma Finder Software
++• Rapid and accurate
identification of Critical Quality Attributes (CQAs) such as modifications and impurities
• Quality Control analytics to ensure proper bioproduction
Our SolutionCustomer Need
Integrated Workflows: Biopharma QA/QC Case Study2
Data Management and Analysis

95
Emerging Markets: Scaling APAC Presence with Significant Growth in China
IndiaSignificant market for analytical instruments with exciting growth opportunities in pharma and CRO/CMO
• Continuing to expand leadership in China and capitalizing on opportunities across rest of APAC
• Leveraging in-region infrastructure including the Singapore Manufacturing Center of Excellence
• Total company scale supports targeted investments in emerging regions with high growth potential
$1.7BAPAC
Revenue*
China Uniquely positioned to capitalize on growth in Precision Medicine and Chinese pharma
Strong presence across life sciences and material science, complemented by FEI relationships
S. Korea and Japan
3
* Pro forma revenue for Analytical Instruments segment as if FEI was owned for all of 2016.

96
FEI: The World Leader in Electron Microscopy 4
Is now part ofLife Sciences Material Science

97
FEI: New Platform for Growth
Leveraging total company capabilities to accelerate growth
• Titan Krios is the structural biology platform of choice
• Comprehensive portfolio of material science platforms
• $80M cost and revenue synergies by 2019
Future2016• Acquired FEI, the
leader in Electron Microscopy, in September 2016
• Cryo-EM technology in early stages of adoption
• $1B business growing in low single digits
• Leverage Thermo Fisher leadership to enable sustained double-digit Life Sciences growth:• Utilize commercial reach to accelerate Cryo-EM adoption,
particularly in pharma• Integrate structural biology workflows to connect Cryo-EM
and mass spectrometry
• Capitalize on combined Material Science portfolio to gain share
• R&D teams creating new opportunitiesthrough best practice sharing
• Expand world-class operationsin Brno, Czech Republic, for use by broader company
Titan KriosCryogenic-Electron Microscopy Platform (Cryo-EM)

98
• Established new organizational structure
• Following best practices from prior integrations and applying PPI Business System
• Scaling infrastructure to accelerate base business growth
• Synergies are on track:• 2019 cost synergies of $55M• Revenue synergy planning complete and on track to deliver $25M adjusted operating income in 2019
FEI: Integration Update

99
Zika Virus - Purdue Univ.
• Proteins are the driving machinery of life; understanding their properties is key to developing effective therapies
• Most proteins of interest are large, asymmetric and act in complexes
• Traditional X-ray crystallography (XRD) and Nuclear magnetic resonance (NMR) techniques are limited to proteins that are small or that can crystallize
• Titan Krios platform enables high-resolution imaging of large protein complexes without need for crystallization
“This represents a new era in imaging of proteins in humans with immense
implications for drug design.”
Francis Collins, MD, NIH Director
The Power of Cryo-EM
Our Titan Krios platform holds the key to unlocking new biological insights
FEI: Unsolved Challenges in the World of Structural Biology

100
Unlocking New Possibilities in Protein Analysis• Titan Krios offers unprecedented imaging capabilities for structural biology
• Enabled by complete workflow solution from sample screening to 2D/3D imaging
• Game-changing potential to combine with complementary mass spec technology to enable new insights
FEI: Breakthrough Technology in Structural Biology
FEI Titan Krios
FEI Vitrobot
Thousands of 2D images of SARS protein
3D reconstruction of SARS protein1
Analysis & 2D/3D Image RenderingHigh-resolution ImagingScreening & Sample Prep
3D visualization and analysis software
1) SARS corona virus. Courtesy of Daniel Beniac
Q Exactive Plusmass spectrometer
Biochemical Screening

101
Key Titan Krios AdoptersAnnual Publications
FEI: Accelerated Adoption in Structural Biology
Titan Krios is following the trend of our blockbuster Orbitrap platform
20
114
255
474
26
65
106
Launch Year 4 Year 10
OrbitrapPublications2
Titan KriosPublications2
Nature Methods namesCryo-Electron Microscopy
“Method of the Year”1
1) Nature Methods, 12/30/2015 2) Based on Nature and Science publishing journals

102
PrecisionMedicine Clinical Nanotechnology Structural
Biology
Accelerating development of new advanced
targeted therapies
Delivering deeper understanding of
biological processes
Unlocking the potentialof new materials
Adapting analytical technologies for clinical
diagnostics
Analytical Instruments: Well-positioned to Capitalize on Exciting Trends

103
Key Takeaways
• Unrivaled leader in our industry and getting stronger• Uniquely positioned to capitalize on key market trends
• Proven strategy delivering outstanding financial performance• Organic growth driven by benefits of scale and depth of capabilities• PPI Business System drives operational excellence• Track record of effective capital deployment
• Attractive long-term financial model• 4 - 6% organic growth• 12 - 15% adjusted EPS growth• 12 - 15% free cash flow growth


