Download - POLICE USE OF FORCE IN ONTARIO

1 Professor Wortley can be reached at the Centre of Criminology, University of Toronto,130 St. George Street, Toronto, Ontario, M5S-3H1. Email: [email protected].
POLICE USE OF FORCE IN ONTARIO:An Examination of Data from the Special Investigations Unit
FINAL REPORT
Scot Wortley, Ph.D, Associate ProfessorCentre of Criminology, University of Toronto
Justice and Law Domain Leader – Centre for Excellence on Immigration and Settlement1
Research Project Conducted on behalf of the African Canadian Legal Clinicfor Submission to the Ipperwash Inquiry

2 I would like to thank the Ipperwash Inquiry for the funding used to conduct thisresearch project. I would also like to thank the Special Investigations Unit (SIU) for providingaccess to their records. Thanks also to the African Canadian Legal Clinic (ACLC) – especiallyMarie Chen – for all their assistance with this research project. I would like to acknowledge theresearch assistance of both Paula Viola and Steve Cook. Paula Viola read through over 1,000detailed SIU case files and coded them for data analysis. Steve Cook took the coded data andcreated a SPSS dataset, entered all the data into this dataset, cleaned the data and conducted thepreliminary analysis. Finally, I would like to thank Terry Roswell for helping to facilitate thefocus group with members of the black community. Terry also prepared a literature review onpolice use of force that aided in the development of the final report.
2
PART A: INTRODUCTION2
Police use of force against racial minorities has emerged as one of the most controversial
issues facing the law enforcement community in North America. In the United States, high
profile incidents involving police use of force – including the Rodney King, Abner Louima and
Amadou Diallo cases – often serve to increase tensions between racial minority communities and
the police and solidify the public perception that the police are racially biassed (Walker 2005;
Walker et al. 2004; Joseph et al. 2003). The negative impact of police violence on community
cohesion can be profound. For example, over the past twenty years, specific incidents of police
violence against racial minorities have sparked major urban riots in several cities including
Miami, Cinncinati and Los Angeles.
Police use of force against racial minorities has also emerged as an important issue in
Canada. As in the United States, well publicized police shootings in Ontario and Quebec –
including the cases of Dudley George, Jeffrey Roedica, Lester Donaldson, Allen Gosset, Sophia
Cook, Buddy Evans, Wade Lawson and Marlon Neal – have led to community allegations of
police discrimination. Unfortunately, unlike the United States, very little empirical research has
actually addressed the question of whether the police are more likely to use physical force
against racial minorities than Whites (see discussion in Forcese 1999: 181-184).
The following report attempts to address the gap in Canadian research by: 1) Providing a
detailed literature review on police use of force against minorities in Canada and the United
States; 2) Describing the results of a focus group with leaders from Toronto’s Black community
3
on the issue of police use of force; and 3) providing the results of a new study on police use of
force in Ontario using data from the province’s Special Investigations Unit. The report
concludes with a discussion of different explanatory models that might help explain the over-
representation of African Canadians and Aboriginals in police use of force statistics.
Recommendations for reducing the illegitimate use of force by the police are provided.
Particular emphasis is placed on reducing police use of force against racial minority
communities.

4
PART B: LITERATURE REVIEW
A number of Canadian scholars have argued that the number and circumstances
surrounding police shootings in Canada have served to convince many Black and Aboriginal
citizens that they are disproportionately vulnerable to police violence (Henry et al. 2006;
Pedicelli 1998; Forcese 1999; Commission on Systemic Racism in the Ontario Criminal Justice
System 1996).
A 1994 general population survey, conducted by York University’s Institute for Survey
Research, confirms that perceptions of police bias are widespread in the Black community. This
survey examined the attitudes of a random sample of Black, Chinese and White respondents
from the Toronto area. Over 400 respondents were interviewed from each racial group. Random
samples of this size produce population estimates that are accurate – plus or minus 5% – 95
times out of 100. All respondents were asked the following question: “Sometimes the police
must use PHYSICAL FORCE when arresting a person who might have committed a crime or to
keep that person from escaping. In general, do you think the police are more likely to use
physical force against Black people, against White people, or do you think there is no
difference?” The results indicate that the majority of Toronto’s Black community (55%) believe
that the police are more likely to use force against Black people than White people. Only 33%
feel that there is no difference. By contrast, only 26% of White respondents feel that the police
are more likely to use force against Blacks and 61% feel that there is no difference. Multivariate
analysis reveals that these racial differences in perceptions of police bias remain after controlling
for racial differences in age, education, employment status, income and immigration history (see
Wortley 1996; Wortley et al. 1997). In other words, racial differences in perceptions of police
bias cannot be explained by racial differences in social class position. Indeed, the survey results
suggest that well-educated, high income Black citizens actually perceive more police
discrimination than those who come from more disadvantaged backgrounds. Neither can

3 Some have argued that Black people are more likely to distrust the police because theyhave often immigrated from countries where the police are violent and/or corrupt. Our researchdoes not support this hypothesis.
5
perceptions of bias be explained by racial differences in place of birth.3 In fact, Black people
born in Canada are more likely to perceive a problem with police discrimination than recent
immigrants (Wortley et al. 1997).
Despite growing public concern and allegations of police bias with respect to the use of
physical force, very little Canadian research has actually addressed this issue. Although a
growing number of studies have documented possible discrimination in other areas of the
criminal justice process – including racial differences in police surveillance practices (racial
profiling), racial differences in arrest decisions, racial differences in pre-trial outcomes and racial
differences in criminal sentencing – detailed research has yet to be conducted on racial
differences in the police use of force (see Tator and Henry 2006; Tanovich 2006; Wortley and
Marshall 2005; Wortley 2004).
The few Canadian studies that have been conducted have been plagued by
methodological issues including small sample size and a reliance on newspaper coverage of
police shooting incidents. For example, using media sources, Gabriella Pedicelli (1998)
examined police shootings in Toronto and Montreal between 1994 and 1997. She found that
although African Canadians represented less than 2 percent of Montreal’s Black population in
1991, 5 of the 11 people shot and killed by the police during the study period (45%) were Black
males. Similarly, although African Canadians represented only 3.3 percent of Toronto’s
population in 1991, 6 of the 12 civilians (50%) shot and killed by the police during the study
period were Black males (Pedicelli 1998: 63). A case by case analysis of particularly
controversial cases led Pedicelli to conclude that police officials are oftentimes able to legitimize
police violence by claiming that it is a normal reaction when dealing with ethnic groups that are
prone to ‘criminality’ and ‘violence.’ Furthermore, police officer claims that they had to make
‘split-second decisions’ during violent, ‘life and death’ confrontations with civilians is usually
4A number of recent studies have also found that Hispanics are over-represented in policeuse of force statistics. Interestingly, we could not find a single American study that discussedthe representation of Aboriginal Americans in use of force statistics.
6
enough to have the incident deemed a ‘justifiable homicide.’ Police versions of shooting
incidents are rarely challenged by the media or government officials.
Phillip Stenning (1994) further explored the issue of police violence by interviewing 150
inmates from three provincial detention centers in the Toronto area. Unlike Pedicelli, Stenning
found little evidence of racial differences in experiences with police use of force. While Black
inmates were much more likely to report verbal abuse and racial insults during arrest situations,
they were not more likely to report police brutality. However, the author cautions that these
findings are far from conclusive because they are based on interviews with a small, nonrandom
sample of prison inmates. Indeed, only 51 Black inmates were interviewed as part of this study.
Furthermore, this study did not examine racial differences in the use of deadly force or police
violence that led to serious injury.
Canadian research on police violence has been greatly hindered by the fact that police
services in this country do not routinely release official statistics on police shootings or other use
of force incidents. Moreover, research on racial differences in police use of force is almost
impossible to conduct because there is an informal ban on the release of any type of information
that breaks down criminal justice statistics – including police shootings – by civilian racial
background (see Wortley 1999).
American Research
Research on racial differences in the police use of force is much more prevalent in the
United States. The results of these studies are not in dispute. Study after study, conducted in
different regions of the country, have found that African Americans are grossly over-represented
in police shootings and other cases involving police use of force (see reviews in Geller and Toch
1995; Rahtz 2003; Walker et al. 2004; Lersch and Mieczkowski 2005).4
7
Research also suggests that the over-representation of African Americans in use of force
cases has declined significantly over the past thirty years. For example, in the 1970s, American
police shot and killed 8 Black citizens for every one White person. By 1998 that ratio had been
reduced to 4:1 (see Walker 2005; Walker et al 2004).
Although there is no debate in the U.S about the fact that Black people are greatly over-
represented in police use of force statistics, there is considerable debate among criminologists
about the reasons for that over-representation. In summarizing the American research on deadly
force by police, Locke (1996: 135) observes that : “What every single study of police use of fatal
force has found is that persons of color (principally Black males) are a disproportionally high
number of the persons shot by the police compared to their representation in the general
population. Where the studies diverge are the reasons for that disproportionality.”
Some scholars and social critics have argued that both overt and systemic racism explains
the fact that Black people are more likely to be the victim of police violence than members of the
White majority. In order to support this argument, these authors frequently highlight specific
cases in which the police have clearly used excessive force when dealing with Black citizens (the
Rodney King case, the Abner Louima case, the Amadou Diallo case, etc). They note that almost
all of the “questionable” police shooting deaths in the United States have involved African
American males. Others focus on the fact that Black males are particularly over-represented in
official statistics that document unarmed citizens who have been shot and killed by the police.
Support for the racism hypothesis is further supported by survey results which suggest that the
majority of Black police officers in the United States feel that White officers are more likely to
use physical force against Black citizens than White citizens (Mann 1993; Sparger and
Glacopassi 1992; Locke 1995; Tagagi 1978; Locke 1996; Walker et al. 2004).
Recently, some scholars have argued that the over-representation of Black people in use
of force statistics is strongly associated with racial bias at earlier stages of the policing process.
Racial profiling research, for instance, indicates that young Black males are much more likely to
be stopped and searched by the police than their White counterparts (Tanovich 2006; Tator and
Henry; Wortley and Mcalla 2003; Wortley and Marshall 2005; Wortley and Tanner 2005). In

8
other words, Black youth have many more street encounters or confrontations with the police
than Whites. This fact alone increases the probability that, compared to Whites, Black people
may eventually become involved in a police encounter that will escalate into a use of force
incident.
Despite the strong bivariate correlation between race and police violence, some critical
criminologists have argued that the over-representation of African Americans and Hispanics in
use of force incidents is more about social class than about race (Walker et al. 2004). They
maintain that, regardless of race, police tactics of control and coercion are focussed on the poor
and socially disadvantaged segments of society. As Klockars (1996: 13) notes, when it comes to
police abuse, lower class people are “the persons who are the least likely to complain and the
least likely to be believed if they do.” Thus, the over-representation of African Americans in use
of force cases could be partially explained by their over-representation in poor, socially
disadvantaged communities. This explanation is far from comforting. In theory, police
discrimination against poor people is just as upsetting – and unethical – as police discrimination
against racial minorities.
Police scholars have also argued that the demeanor of civilians may have a major impact
on police decision making – including the decision to use force. Some studies have observed
that the police are more likely to use excessive force against citizens who are argumentative,
belligerent or defy their authority (Garner and Maxwell 2003; Macdonald et al. 2003; Terrill
2003). It has been suggested that some police officers react negatively to even legitimate
questions from civilians. In other words, civilians who “flunk the attitude test” or display
“contempt of cop” may be more vulnerable to police violence than those who are passive or
compliant (see Worden 1995). Other research has suggested that young Black males are more
likely to be rude and disrespectful towards the police than Whites (see Walker 2000). This has
led some to hypothesize that the poor or disrespectful demeanor some Black youth display
towards the police may partially explain their over-representation in police use of force statistics.
However, as with the social class hypothesis, the demeanor explanation does not validate the
9
over-representation of minorities in cases of police violence. Poor civilian demeanour towards
the police is not a legal justification for police use of physical force.
It should be further noted that some critics have suggested that researchers have focussed
far too much on citizen demeanor towards the police and not enough on police demeanor
towards civilians (see Walker 1992; Walker 2000). Indeed, civilians may sometimes display
disrespectful or defiant attitudes towards the police as a response to police mistreatment, verbal
abuse or incivility. Is it the demeanor of citizens that leads to violent police encounters, or does
the initial demeanor of the police officer set the tone for the entire interaction?
The fourth major explanation for the over-representation of Black people in police use of
force statistics draws a direct link to minority criminality. Proponents of this position argue that
the over-representation of African Americans in police shootings can largely be explained by
their over-representation in violent crime (see Blumberg 1999). Studies using aggregate
statistics, for example, have frequently shown that the size of a given municipality’s Black
population is a strong predictor of both the total number of police shootings and the proportion
of all police shootings that involve racial minorities. However, these studies have also shown
that this “race effect” is either significantly diminished or eliminated once multivariate analyses
have statistically controlled for the Black crime rate (see Jacobs and O’Brien 1998). Other
American studies have found that, after statistically controlling for racial differences in “at risk”
status, defined as arrest rates for violent crimes (murder, rape, armed robbery, aggravated
assault, etc.), racial disparities in police shootings disappear. It should be noted, however, that
some critics have charged that it is problematic to use aggregate arrest statistics to explain
minority involvement in police violence. For example, they often argue that systemic
discrimination may cause both minority over-representation in use of force statistics and
minority over-representation in police arrest figures. If bias in the justice system exists, Black
people will be more likely to be arrested for crimes than their White counterparts.
In addition to studies that use aggregate statistics, observational studies and detailed
analyses of police shooting investigations reveal that, regardless of race, most civilians shot by
the police were either in possession of a weapon, engaged in a criminal act, fleeing the police or
10
resisting arrest. Furthermore, in the majority of cases, the civilian had either assaulted or
threatened the police officers involved. In other words, official accounts of shooting incidents
rarely indicate that civilian victims were “innocent bystanders.” After reviewing the available
research, Geller and Karales (1981: 56) made the following observation: “The most common
shooting of a civilian by a police officer in urban America is one on which an on-duty,
uniformed officer shoots an armed, Black male between the ages of 17 and 30, at night in a
public location, in connection with an armed robbery. Typically, the shooting is subsequently
deemed justifiable by the police department following an internal investigation. Even if the
officer is criminally prosecuted, the jury is unlikely to convict.” Such research findings bolster
the argument that, in most cases, police use of force is “legitimate.” However, critics have
argued that relying on official accounts of police shootings can be problematic. Indeed, official
investigations into police shootings tend to rely heavily on the testimony provided by police
officers. Police officers who are often trying to provide post-hoc justifications for their actions.
The Impact of the Police Subculture
A number of scholars have examined the impact that the police subculture may have on
the nature and extent of police violence (see reviews in Kappeler et al. 1997; Kelling and
Kliesmet 1996). The literature reveals that the police subculture may increase the likelihood of
police violence for the following five reasons:
1) The militaristic “war on crime” orientation that permeates most modern policeservices creates an “us against them” mentality among police officers. To thepolice officer every citizen becomes a potential “enemy” or “symbolic assailant.” This ideology can create tensions with minority communities – particularly indepartments with few minority officers. These tensions are further aggravatedwhen officers do not live in the same communities that they police.
2) The police culture can further reinforce racial stereotypes through the telling of “war stories” that depict racial minorities as dangerous. This may increase thelevel of fear or apprehension officers experience when they encounter minoritieson the street.
3) The police subculture puts emphasis on “toughness” and “courage.” New officersare often not accepted until they have proven that they can handle a violent or

11
dangerous civilian encounter. This increases the likelihood that officers will wantto prove their courage and demonstrate their willingness to resort to physicalforce. It also reduces the probability that officers will try to diffuse citizenconfrontations through non-violent methods.
4) The police subculture places an emphasis on respect. A good officer demandsrespect and is able to quickly establish their legal authority when dealing withcivilians. The subculture also reinforces the belief that it is sometimes okay forofficers to respond to citizen hostility, disrespect or disobedience with violence.Within the police subculture, “contempt of cop” is an offence that deservespunishment.
5) Finally, the police subculture creates a code of silence among police officers. It isa general subcultural dictate that a police officer should never “snitch” or “rat” ona fellow officer. Officers who violate this general rule are often chastised byfellow officers. They frequently become socially isolated, fear that they won’treceive proper backup on the street and fear that their chances for promotion willbe damaged. This makes investigations into the illegitimate use of force difficultif not impossible to conduct. In other words, the code of silence protects officerswho may use force in an illegitimate fashion and thus ensures that this type ofbehaviour will continue.
Summary
American research reveals that Black people are greatly over-represented in police
shooting and use of force statistics. Although survey research suggests that a high proportion of
African Canadians perceive that the police are more likely to use force against Black people than
White people in this country, the issue has yet to be adequately addressed by Canadian
researchers.
There are two major explanations that may help account for Black over-representation in
American use of force statistics: 1) racial discrimination; and 2) Black over-representation in
violent criminal activity. It is possible that both explanations are valid. For example, it is
possible that some use of force incidents are caused by violent, blatantly racist police officers. It
is also possible that many other incidents are precipitated by the violent, criminal behaviour of
minority civilians. These incidents, in turn, may serve to reinforce racial stereotypes among the
police and contribute to the belief that all Black people are potentially violent or dangerous.
12
These stereotypes may subsequently increase the amount of fear or apprehension that police
officers experience when they come into contact with racial minorities and ultimately increase
the likelihood that force will be used during such encounters.
Although police scholars and academics continue to debate the fundamental reasons
behind the over-representation of minorities in use of force incidents, the research literature on
controlling police violence is much less controversial. A number of studies have identified that
specific use of force regulations and training regimes can significantly reduce the frequency that
the police resort to physical force. We will return to a discussion of this research in the final
section of the report. In the next two sections we present new data on police use of force in the
Canadian context.

13
PART C: FOCUS GROUP WITH COMMUNITY REPRESENTATIVES
In order to better understand the Black community’s views concerning police use of
force, the research team conducted a focus group with twenty Black community leaders on July
13th, 2005. Community representatives were drawn from a wide variety of organizations and
professions representing a broad spectrum of special interest groups. Respondents were
guaranteed confidentiality and are thus not identified by name in the following analysis. The
focus group discussion lasted approximately three and a half hours. Despite the length of the
focus group, participants were still passionately discussing the issues when the session was
concluded. The entire focus group discussion was tape-recorded and transcribed for analysis.
Defining Police Use of Force
We began by asking our respondents to define what is meant by the term “police use of
force.” Although respondents acknowledged that any definition of police use of force should
include police shootings, police assaults and other forms of brutality, most felt that the definition
should be expanded to include other behaviours including police threats, racial profiling, police
corruption, police abuse of power and verbal abuse. Some speakers felt that the threat of police
violence, in the long run, had a greater psychological impact on the Black community than actual
use of force incidents. Many claimed that the police use threats of violence to dominate minority
communities and ensure compliance to their requests. The following quotes illustrate that the
Black community’s general understanding of police violence is much broader than police use of
physical force:
If you can lay your hands on that video of the Somali boy who was beaten by thepolice, then arrested and then he was supposed to be deported. That was a typicalexample of police abuse of power. The boy was going to be charged anddeported because he was a landed immigrant and had no power. And thensomebody video-taped the cop beating him and took it to the news and it got outthere. That they were -- you know, the police had beat him for no reason andcharged him for no reason. Now we don't know where that case went. All thecharges were dropped against him. And now the cops were charged. That’spolice violence. But the scary thing is, what the community knows, is that if there

14
was no video, if the news had not played it, had not played the tape, people wouldnot know that cop was a violent jerk. It would just be the police officer’s word,his lies against the kid’s words. The Black community know who the courtswould believe. They would believe whatever story the cops told them and theywould not believe the kid. As a result, that poor Black kid would have a boguscriminal record. He would be in jail and then he would have been deported. Onecorrupt, violent cop could have ruined his entire life. That is police power. Thatis police abuse and violence and force. We in the Black community know thisstuff happens all the time. That type of corruption. In this case, we just got luckycause there was a video. Just like Rodney King, we got lucky. But that type ofluck only happens ponce in a long while. Most time the Black person gets theworst of it. Most of the time nobody cares.
In my community the police use of force is the physical force as well as the verbalforce because a lot of times there's no need for police to talk to youth in a certainway and disrespect them and instill fear within them, within their community,even turning maybe family members against them maybe, I mean, instilling acertain fear on them. Usually, in our communities, the cultural respect for policeis a factor because the whole force around that is that they know that culturalfactor is, like, they see them and they respect them, they (the police) are lookedup to. Youth see that as force in the sense that they know this. And then if theygo to your parents and tell them, okay, you do this and that, chances are yourparents are going to believe the police. They're not going to just ask you whatyou were you doing. You know what I mean? So police know that, and they justabuse that. That's what I think police, like, "use of force" means.
So the threat of physical force, because members of racialized communities inToronto and I guess in other cities in Canada, know - either they have personallyexperienced or witnessed it or they know people who have been brutalized bypolice. So just the threat of that force is enough to traumatize people because forthose few minutes that the police confront you, you are traumatized and scared oftheir power to use force. So that's where it begins.
The reason why I'm here is because of my concern of racial profiling of African-Canadian male youth especially, although our female youth are also raciallyprofiled, harassed, brutalized, whatever, by police. We have had occasion in St.Jamestown, where I live, which is a lower-income neighbourhood, where we are'housed'; there's no other word for it. Our youth live in a glass bowl, in apoisoned environment, where they are continually and continuously harassed andbrutalized by security forces - not just the police, but by security guards also. Sothe reason why I'm here is because of my concern, my alarm about what happensto our youth. And not just by police, even though that's what we're here for, as faras I understand, but also in the education system, in the housing system. Andthat's not just the youth. Parents also are treated with horrific disrespect by staff

15
because not only are we African, we're also living in poverty, and people seem toequate the skin colour combined with poverty to mean stupidity, and so it seemslike they don't think we know when we're being disrespected and racially profiled. It is all police violence and abuse.
I think one of the things that I have been observing is that within police brutalityand abuse of power, within the Black communities that I serve, there are twolevels: There is the Continental (African) level and there is the Caribbean level.They (the police) physically beat, kick and punch the Caribbean youth a lot morethan the Continental youth. They play a lot to the Continental youth's mind. Oneof the things that we have realized is that, coming from war-torn areas, the mindsof these Continental youths is, you know what, the police have the power. Theyknow that the youth probably would not get as much support from parents, sothey prey on that. They take advantage of youth that are here as refugees, andthey remind them that 'You're here as a refugee, and I can do this, which will getyou back to your country.' As a result, no complaints. With the Caribbean youthnow, a good percentage of them are very mouthy. So what they do, they beatthem. And then they come together as officers, they form an alliance with theirpartners. And when they (the police) get to lie, I mean, they lie and they liesweet. I mean, at the end of the day you would believe them. ..So half of theamount of police brutality that happens goes untold because of fears of the policeand because people feel, you know what, I am here in this country, I have beenhelped; you know, if I get sent back to where I'm coming from, I'm going to bedead. So what do you do? Most times you have to take it.
I guess the police should have power. But police violence, when I think of it rightnow is like the misuse of power, illegal power; you know. That power that theyhave is being misused to threaten people or otherwise. It is the use of power thatis not justified. That is violence.
For those of us who are new to this country, when it comes to police, the nameitself creates a fear because we came from places where the police are thegovernment; therefore, they harass and they beat you. What we see of the police-- quite frankly, I am allergic to them when I saw one coming down the road. Butin Canada, through the Somali community that I'm serving, there's also a lot ofpolice abuse of their power. They walk into apartments of single mothers withouta search warrant and confiscate money and go and never report it. These arepolice who are not in uniform, but they have the badge. They go into apartmentsin the pretense of searching for the drugs, especially the Somali drug Khat, andthey collect everything the family owns. That gold and that money doesn't go tothe police station, it just disappears. Because of the history and understanding ofthe police power, the community won't talk. We are hearing, you know, familieswho lost their whole gold. Even though these families are poor, when it comes togold they are very rich; you know, it's a traditional thing. And we are hearing

16
stories that they collect cash, sometimes 20,000 cash, from somebody's apartment,and it disappears. So that's an abuse of power or force.
They (the police) seem to try to undermine their dignity. They do and say thingsthat are not only -- that are directly aimed at undermining their (young Blackmales) dignity. So if they're going to strip them or search them or whateverthey're doing, they are likely to do it really out in the public, and I think thesecondary purpose for that is to undermine their dignity and then -- you know,then from there they can get them to do what they want. That is abuse.
What I wanted to look at was the -- because we're talking about police use offorce and the empowerment of police. I think the empowerment that comes frombeing the police reinforces whatever authority they have in terms of the amount offorce they use. My reference is to when these events occur and it affects let's saya minority community or a Black community in particular, there's racial profilingfor example, when we hear recordings you soon find out the people who supportthe police. It doesn't matter what their discretion is. Rodney King is an example,and then many others -- there have been others that have happened locally. Andyou can tell who are Black and who are White generally. And it becomes thehistorical legacy of what was perceived to be the amount of power that wasdiscretionary or not, how much you need to keep people in their place. And Ithink that's what we still are dealing with the legacy of. Even over 40 years inthis country, and I have gone into police stations where it was all White, in mostinstances anyway, and just going in there was a threat in itself, whether you weregoing to make complaints or to find out some information. It didn't even have tocome to any violence or anything like that. And right away they treat you withdisrespect and so on and so forth. So I think it was the relationship. It's anhistorical relationship that we're trying to moderate.
Racial Bias in the Police Use of Force
We next asked our focus group respondents whether they thought the police were more
likely to use excessive force against members of the Black community than members of other
racial groups. Consistent with the results of survey research (discussed above), all of our focus
group participants felt that the police were much more likely to use force, particularly deadly
force, against Black people than White people. Indeed, all of our respondents felt that the police
deal with Black offenders much more violently than White offenders and that Black citizens
were much more likely to be the victim of police brutality than their White counterparts. For
example, some expressed the belief that while the police would shoot to kill during a threatening
17
encounter with a Black civilian, they would use less-than-lethal force when dealing with a White
person. The following quote illustrates this general belief:
But I think we also have to look at the stats and look at how much young Blackmen were shot to death by police and how much young Caucasian males wereshot and survived, and are you telling me it's a coincidence that, you know,they're able to -- they see the White man's leg so they can break it but they see theBlack man's chest so they can kill him? I mean, I think the stats are before usthat, you know what. It's too glib for it to be a coincidence. We know that whenthey're shooting young males -- especially young Black males, they're shooting tokill. To kill. Because they've dehumanized that Black body. They don't see themas human. It's a Black body, and it's okay to kill them. Whenever I hear thatsomebody has been in a stand-off with the police and they were arrested, I knowthat's not an African person; I know right away that was a White person. There isno way an African man, woman, or child would be in a stand-off with the policeand live to tell the tale.
A couple of speakers stated that the police often verbally abuse or harass innocent Black
youth in order elicit a reaction. When young Black people respond with hostility or defiance, the
police use this as an excuse or justification to use physical force. The following statement id
typical of this perspective:
The kinds of threats that I saw (from the police). It was a kind of a psychologicalwarfare that they (the police) engage in, particularly -- well, whoever it is thatthey're profiling. So the psychological warfare is where they use -- they use theirauthority, they begin with their authority, and then they interpret that to theperson they're harassing. So sometimes they do it through taunts, you know. Sothey may say to a person "I'm the boss here" or "I don't need any warrant," inwhich case they use what they think is ignorance. So they engage in thispsychological warfare that taunts people, and then sometimes, in some cases, itsort of taunts people into reacting to them. Then they strike.
Explaining Racial Bias in Police Use of Force
Participants were then asked why they thought the police were more likely to use
physical force against the Black community than the White community. All of our respondents
agreed that the primary cause was racism – both overt and institutional. Respondents agreed
this racism has deep historical roots – that the police have traditionally been used by the White
majority to control what it perceives to be a “dangerous” or “threatening” Black population.

18
Many participants noted that, throughout North American history, the police have been used to
maintain profound racial inequalities and protect the status quo. As one respondent stated: “It's
historical. Anti-Black racism is historic in this country. Everybody knows that there was
slavery, African people were disenfranchised. There is an image of Africans as 'less than'.
We're part of what is popularly known as a minority, but there are model minorities, and we are
sure not the model. So it's historical.” Another respondent reiterated the role of history when
she stated that: “And with us living so close to the United States, we know that history also
impacts here, where we know about all the lynchings that happened in the United States over a
period of time where African men, women, and children were hung from trees. They were
burnt alive. And we have seen photographs of White people posing with these dead bodies. So
there is this dehumanizing of African people, and especially African men, even if there's got to
be a concoction of -- maybe it might not be blatant, but a hint of overt sexuality, something like
that, but something that would make it okay that police have to shoot this person.”
Other respondents felt that racial stereotypes – often disseminated through the popular
media – have created a general fear of Black males among White people in general and among
the police in particular. Several respondents felt that the media always defends the police in
cases of police violence – and thus serves to reinforce negative stereotypes of Black males as
violent. It was felt that White fear of Black crime often translates into the use of force on the
street. In other words, because Black males are more feared by the police than Whites, they are
much more likely to become the victim of police abuse and violence. The following quotes are
typical of this sentiment.
I was just going to say it is related to media, I think they (the police) -- becauseof media images of Blacks, they anticipate violence, and so when they're actuallyencountering someone who is a regular person it's so ingrained in their mindsthat Blacks are violent that the anticipation of violence, they act out inaccordance with what is not necessarily there.
Yeah, I'm talking about the contemporary media, and what messages the mediasends White people about Black people. What messages the media sends to thepolice. The contemporary media promote negative images of Black people ascriminal and violent, the police then use those negative images of Black peopleto justify the harsh treatment that they give to them. In any encounter with a
19
Black person they (the police) are anticipating violence, you know, so they actproactively in their mind to head that off.
There's also the issue of the media because whenever police brutalize or even killan African person the media jumps into defence mode. They always defend thepolice. It is always the Black person’s fault. They were always violent first anddeserved what they got. That is what the police and the media always say.
They (the media) would delve into the Black person's background if they wereshot by the police, and even if there is nothing criminal in that person'sbackground they will go to things like African-Canadian men have committedthis amount of crime, so many crimes, this kind of thing. So even if they havefound nothing criminal in this person's background, they might even go torelatives: okay, maybe the father committed a crime at some point, maybe themother's grandfather committed a crime at some point. So there is this trying toferret out something that can say to the White public and to other people we haveto protect our country, our culture from these people, so the fact that the policekilled a Black person is no big thing.
And a lot of the media capture it in such a way that, you know, they create fearand discrimination. When a Black person gets murdered it's, you know, it’s adrug deal gone bad. And they – both the media and the police – come up with allthese excuses that creates a certain amount of fear within a certain segment ofthe public – especially among White people. So they're, like, "Oh, thank God. You know what? This person could have attacked me." So it also creates fearwithin the public and then they think it is okay if the police are using youngBlack males as their prime target. It is okay if the police shoot them or kill them.
One participant expressed the opinion that social class must also be considered when
discussing police violence. This participant felt that much police violence and racism is
concentrated in poorer communities and that middle and upper-class Blacks are less vulnerable
to use of force incidents. He stated that: “I mean, if Black people could change the area they
live in they would actually get the same treatment like the White people who live in those better
communities. But if they go on the other side, the poor side, you get treated as the poor people
that are stigmatized on that side. It’s like, oh, you're low-income, you're poor, and you're
hungry? Well, we don't need to serve you because we have nothing to gain from you. That's
the way they (the police) look at it.”

20
This comment generated considerable debate. Other participants felt that higher social
class does not protect Black people from police abuse – that Black males living in wealthy areas
are still subject to high levels of police surveillance and distrust and are still at high risk of
becoming a victim of police violence. As another respondent stated:
What happens when a lot of Black people move into upper, middle-classneighbourhoods? It's not that they get treated better by the police. They areaccosted as to why they are in that neighbourhood. If they're in their house andthey call the police, maybe they will get better treatment. But if they're walkingthrough the streets of that community, if their children are driving through thestreets of that community, they get treated just like any Black person who livesin a lower-income neighbourhood because they're accosted: What are you doinghere, you don't look like you belong, you don't belong in that car, maybe youstole it. If you own it, maybe you bought it with drug money. Social class willmake the police treat Black people better? Please.
When asked if the police were less likely to shoot a Black person walking through a nice
neighbourhood than an economically disadvantaged neighbourhood, one respondent replied:
“An African person walking through Richmond Hill? Oh, yeah. They would shoot him just as
quick as they would shoot him in Regent Park.”
A number of respondents felt that the police subculture – a subculture that is often
reinforced by the politics of police unions – is a major cause of violence against minority
communities. It was felt that the police have an “us against them” mentality and often act as an
“occupying army” within minority communities. The paramilitary structure of Canadian police
services reinforces the idea among police officers that they are involved in a “war against
crime” that often equates to a “war against Blacks.” Most respondents felt that the “code of
silence” within the police subculture protects violent and racist police officers and is a major
obstacle to meaningful reform.
Although participants acknowledged that there is a crime problem within some segments
of the Black community, all felt that minority crime could not explain police bias and violence
against Black people. Most felt, however, that both the police and the media use minority crime
as a justification for such racism. In describing her discussions with the police officer about

21
police use of force incidents in her community, one participant stated that the police alway
always invoke the image of Black crime. She states:
The language, the language that's used, "Black-on-Black crime". We don't hearabout "White-on-White crime". When a White man murders a whole lot of Whitepeople ...we do not hear about White-on-White crime. There are gangs in othercommunities that kill each other. We don't see that in the media. The policedon’t talk about that. So if a police officer tells me about Black-on-Black crime,I will tell him to his face he's a racist just bringing that up. That that is thereason why he would go into a community like mine looking for criminals. Because that is where Black people are. That is criminalizing of African bodies. That is not about policing. That is racist. And whether it's his racism or it issystemic racism, it's still racist.
Overall, our participants felt that the police were more likely to use force against racial
minorities, particularly members of the Black community, for a variety of historical and
contemporary reasons. One speakers tried to sum up the focus group conversation with the
following statement.
First of all, the reason for this is racism, and racism is manifested in many ways. It could be something in terms of individual hatred of police officers who justhave that kind of profound, you know, hatred for Black people. I’m talkingabout the kind of easily-understood racism with respect to 'I don't like thesepeople, and I'm going to use whatever force I have under my authority.' Butthere's also more institutional racism and historical racism in terms of preservingthe status quo in terms of police perhaps seeing themselves as the protectors ofthe White majority or whatever. There's also a kind of a dehumanization themethat's come through, that it's just not officers not having a value for Black lives tothe same extent that they have a value for other communities. Related to thedehumanization is also a kind of lack of deterrents, that, well, this is acommunity I can abuse my power against because they're helpless and powerlessand what are they going to do, so -- as opposed to abusing power in kind of aWhite, middle-class community where the repercussions might be moreprofound. Finally, there seems to be also a theme of fear. That there may befear of the Black community created through the media and through historicalimagery of the Black community. The fact that some police officers may justphysically and psychologically have more fear for the Black community thanothers might be something that triggers violence against Black people. Get thembefore they get you. Fear.
Reducing Racial Bias in Police Use of Force
22
Finally, respondents were asked about strategies for reducing violence against the
community and police racism. To begin with, many of our participants thought that we need to
dramatically increase the representation of Blacks and other racial minorities within policing.
Several speakers stressed that in order to create meaningful change, in order to change the
police subculture, we must also increase minority representation within police management
(i.e., among police supervisors, etc.). Others cautioned that marginal increases in minority
representation will do little to change the current situation. Minority officers, they argue, are
often coopted into the police subculture and subsequently behave no differently than their White
counterparts. As one respondent noted:
Sometimes, when Blacks go into policing -- of course, some of them can be co-opted. They will act just like the White officers. Because if there's any evidencein the research that says there are Black officers, whether because of self-protection, or career advancement, or just to get along with their Whitecolleagues, whether they are just co-opted, they often act similarly. I mean, theBlack youth I interviewed, they had negative experiences with Black policeofficers as well as -- as a matter of fact, they talk about the fact that sometimesthe worst experience they ever had was with Black police because they are tryingto prove they are a cop first. They want to look good to the White officers.
Several respondents felt that racial minority officers are most likely to be “co-opted”
when there are only a few minority officers on the force. On the other hand, when minority
officers come to represent a significant proportion of all officers, they can rely each other for
support, educate their White peers about minority communities and ultimately change the police
subculture for the better.
In addition to increasing minority recruitment, a number of respondents felt that new
police recruits should be screened for racist attitudes as well – as their propensity for violence.
It was felt that new recruits who have had previous positive experiences with racial minority
communities (i.e., those high on cultural capital) are much less likely to develop the negative
racial stereotypes than can sometimes contribute to the illegitimate use of force by police
officers. Several respondents felt that hiring recruits with a university education may also
reduce racial discrimination and the excessive use of force.

23
Many participants felt that, although good in theory, race relations training has been less
than effective in practice. Several speakers suggested that the current system of race-relations
training is nothing more than a public relations ploy designed to convince the general public
that the police are doing something productive to prevent racism. A few speakers suggested
that little is known about the content of current race relations programs and that the
effectiveness of such programs has never been evaluated. As one respondent states: “We
continue with all this training stuff. The police say, okay, we're going to do the – you know, the
accent is on training and...What do they do? They bring in a couple White guys or a couple
brain-washed people that look like us, and they say, 'Oh, they now we are trained.’ Now they've
received their anti-racism training so every thing is supposed to be cool. They've gone through
it. But they walk out there, and they (the police) they just laugh. What good has it done –
really?”
Others suggested that any benefit of the race relations training received in Police
College is quicky erased once officers enter the field and are exposed to older, more
experienced officers and the true police subculture. As one participant stated:
Well, I was just thinking about -- you were talking about changing the systemand the police school and all that stuff. I'm thinking about -- there's a foundationthat has been laid with the whole of police in the system, right, and they're theones who bring in all this stuff to the younger ones. So if we're going to educatethe younger ones, it won't make no difference because the older ones are there tocorrupt the younger ones. So what we need to do is to make sure these olderones are not there to corrupt these younger ones, and that's the only way we canchange, because our young person, all right, are willing to learn, but if the olderperson did get the chance to influence me, to teach me, he's going to be tellingme what to do, and I'm going to listen to that person because they've been there. But if we have a system where we get rid of those older persons and get theyounger people who have the empowerment to sit with racial minority peopleand try to work with them, that would make a big difference to our society.
In general, participants felt that “race relations training” should be replaced with “anti-
racist” training and that such programs should be closely evaluated. It was also suggested that
field training officers be specially selected for their cultural sensitivity and expertise in anti-
racism. As one respondent stated: “It should be an anti-racist model, in my opinion. Not a race

24
relations training model. It's anti-racism training. Because if you start off with the wrong model
you're going to end up with the wrong results, you know. So I believe that when we're looking
at the Police College, for example...you need anti-racism training. That's a tough thing to sell
though. Cops will resist cause they think it means their all racists.” Another respondent felt
that the police need to consult extensively with the Black community in order to develop an
effective training strategy. She states:
I'd like to suggest regarding that with respect to training community input isimportant, so if the system says okay, you know, we want to change, I thinkthere needs to be some kind of joint community or community advisor body or agroup that can provide direction to the people who are going to be, say,designing anti-racism training or designing this, you know...whatever it is, youknow, their training and education. So community input is really needed. Rightnow we don’t even really know what their training is. So how can we know if itworks?
All speakers felt that, in order to reduce police violence and racism, public
accountability mechanisms must be expanded and strengthened. All felt that Ontario needs an
independent public complaints commission that is responsible for both the investigation and
adjudication of complaints against the police. All felt that internal police investigations are
often compromised and that they do nothing to improve public confidence in policing. As one
respondent stated: “You cannot have the police policing the police. It doesn't work.”
Participants felt that such a public police commission is particularly important for the
investigation of complaints about police brutality. All felt that in order for such a commission
to be effective, punishments for police racism and misconduct must be severe. It was felt that
police associations will strongly resist such proposals and are thus a major obstacle to
meaningful reform.
Most speakers felt that Ontario’s Special Investigation’s Unit (SIU) is a step in the right
direction. They felt that such an organization is necessary to investigate police actions that
result in the death or serious injury of civilians. However, a number of participants felt that the
mandate of the SIU should be expanded to include less serious injuries. Furthermore, some
participants were uncomfortable with the fact that most SIU investigators are former police

25
officers. It was felt that ex-police officers are still strongly influenced by the police subculture
(once a cop, always a cop) and that their personal histories in law enforcement will compromise
their objectivity. For example, it was felt that, because of their police backgrounds, SIU
investigators are much more likely to believe the statements of police officers than the
statements of civilian victims and witnesses. In fairness to the SIU, it should be noted that, at
the time of the writing of this report, 6 of their 10 full-time investigators (60%) actually come
from non-police backgrounds. Nonetheless, some participants felt that the presence of ex-
police officers on the SIU compromised the integrity and credibility of the entire organization.
As one respondent stated:
I think the problem with the SIU is it's supposed to be independent, right, butthey use a lot of former police officers. So, you know, it's still a pool of policeinvestigating themselves. Those who investigate serious offences or whateverare all former police officers. They, the ex-police, just reaffirm and validatewhat the police do. They just validate the actions of police officers. It’s like afake process because they are saying ‘we're responsible people, we areindependent, and we validate what the police did was right and that what you'vedone meets the standard that is accepted. It's not true. It's a smoke screen thatworks to perpetuate 'Let's keep them in their place.' That's what it does.
Most respondents felt that police violence needs to be closely monitored through the
collection and dissemination of race-based statistics. It was expressed by a number of
respondents that there is no other way to determine the extent to which minorities are over-
represented in police use of force incidents, convince the general public and police
administrators that there might be a problem, and evaluate whether programs designed to reduce
police violence and racism are working. One participant stated that:
The one thing is needed to break down the house of racism is police informationon how they treat minority groups. And so there will be a great reluctance of thepolice to display those stats because it incriminates them at some point in timedown the road. I mean, you saw that very clearly in terms of what the police didafter the Toronto Star released their data on racial profiling and arrests. Thepolice were angry cause they don’t want us to see that information. But thereality is that we haven't pushed for it because some of us think that whatevercould be used or measured to show racism could also be used to make us looklike criminals. But the media and cops make us look like criminals anyway – sowhat’s the difference. But if we had access to those numbers, those quantifiable

26
numbers that says, look, you know, there's no coincidence wheredemographically the percentage of African-Canadians who live in this city ascompared to the percentage of males of European decent is disproportionate inthe results when it comes to shootings or crimes with police involvement, and wecan prove that very quantifiably, statistically based on those numbers. Getting ahold of them is the key. And you may want to look at a sidebar of keeping trackof numbers oneself in terms of organization as to what happens, because, youknow -- I mean, you can do the same thing; like, they do it in Chicago, youknow, looking at males, looking at African-American community, you can lookat tracking cases, make sure that you have quantifiable numbers where you cango to the powers that be and say, look, you're in positions of power and privilege,you know, you're charged with the responsibility to serve and protect. So protectus as well. Okay, there's a problem here. And our tax dollars are going towardspaying you guys, yes we are tax payers too, so protect us. You need the numbersto get that message across and get people to take you seriously.
Another respondent expressed the view that statistics on how Black people are treated in
the justice system are required to convince the general public that there is a problem with racial
discrimination in this country. He felt that such quantitative information, particularly if
delivered by a White academic, are interpreted as more credible than complaints that emerge
from the Black community. He states:
One of the things that troubles me, and I know particularly within the Blackcommunity, we say, well, let's not keep this racial data, these racial statistics,because, after all, we are all Canadians. Right? The reality is that every time wehear the complaints, when you see the prisons, when you go to courts, what yousee is a lot of Black people arrested disproportionately, right? When you go tothe jails, that's what you see. So whether you want to count the numbers or not,the reality is that it has happened. And all we are talking about, well, let's havethe numbers because that's all White people understand. Now, if a White guyputs in a report and he sanctions that this is so, they think of it more highly thanif a Black guy with similar credentials puts it in. You have to understand how thesystem works. It's worked like this over the years, right?
Finally, although most respondents felt that there are various strategies that can perhaps
reduce police violence and racism in this province, the majority of participants were pessimistic
about the chances that effective programs will be instituted. It was felt that the power and
influence of the police unions, the strength of the police subculture, and the general apathy
towards issues of police violence and systemic racism among the White electorate, will result in
27
a lack of political will to institute meaningful reform. It was also felt that major change is
required if the current situation is going to change for the better. It was felt that minor
programs, programs that fail to challenge the police organizational culture, programs that fail to
challenge the status quo, are doomed to failure. One respondent summarized this position when
he stated that:
If you have a piece of land and it's not producing, it's contaminated, okay, youadd fertilizer to it. For the first two, three months the plant's going to look green,and fresh, and nice. Give it six months. The soil is going to still becontaminated. But if you put that soil through fire it's going to change. Youhave to...And the system that we have, they have to be -- whatever we do, wehave to weed out a lot of the culprits, we have to weed out a lot of the racists. And, I mean, you know what? There could be systems that could be put in placeto weed them out. So it's fire, that when you going through this, if we're going tomake any change with the police force as it is we cannot go there with nothingbut fire to purify the entire thing. That's the only thing that can work.
In the next section of this report we examine empirical data from the Special
Investigations Unit (SIU) in order to determine whether the police are actually more likely to
use physical force against Black people in Ontario than people from other racial groups. As the
results of our focus group suggest, the perception that police force is more likely to be used
against African Canadians is quite widespread in the Black community. We now investigate
whether this perception has any validity.

28
PART D: THE SPECIAL INVESTIGATIONS UNIT USE OF FORCE STUDY
At the outset, it must be noted that this report generally and, more specifically, the part
dealing with data from the Special Investigations Unit, is the sole product of the research team
and is in no way approved or endorsed by the Special Investigations Unit (SIU). Thus, while
the SIU provided access to its raw data, it in no way contributed to this report’s conclusions,
commentary, interpretations or data analysis. It should also be noted that security measures
were instituted to ensure that the data collected was not connected to any identified or
identifiable individuals. What the research team was concerned with was the aggregate data
throughout the study period, which could then be dis-aggregated by the variables set out in the
analysis below (i.e., race, age, gender, type of injury, etc.).
The Mandate of the Special Investigations Unit
The Special Investigations Unit (SIU) is a civilian law enforcement agency that
conducts independent investigations into circumstances surrounding serious injury or death to
civilians involving police in the province of Ontario. The SIU was created by legislative
amendments to the Police Services Act, which came into force on August 8th, 1990. The primary
purpose of the SIU is to enhance police accountability and community confidence in policing
through independent investigations.
The SIU is led by a Director and comprised of approximately 40 civilian investigators.
According to legislative regulations, the Director of the SIU cannot be a present or former
police officer. SIU investigators cannot be current police officers, and are legally prohibited
from participating in the investigation of any police service in which they formerly served.
There are 3 Investigative Supervisors and 10 full-time Investigators who work out of the
SIU’s headquarters in Mississauga, Ontario, with the remainder stationed across the province
and deployed on an as-needed basis. Currently, six of the ten full-time investigators come from
non-police backgrounds. However, the majority of the 30 or more part-time (as needed)
investigators do have a police background. The SIU also has its own in-house Forensic

29
Identification Section, with the capacity to assist in all manner of forensic identification work.
The team is led by 2 full-time Forensic Identification Supervisors and 7 as-needed Forensic
Identification Technicians.
The SIU reports to the Attorney General of Ontario, and is provincially regulated.
However, the SIU is independent, both in terms of its investigations and its decisions, of
government and police services. Under the Police Services Act, the Director of the SIU has the
authority to cause criminal charges to be laid against police officers where evidence uncovered
during the investigation warrants a criminal charge. In this way, the SIU is the only civilian law
enforcement agency in Canada with the authority to both investigate and charge police officers
with a criminal offence. Police officers at the municipal (Community Police Services), regional
(Toronto Police) and provincial (Ontario Provincial Police) levels are all equally subject to the
independent scrutiny of the SIU, with the exception of Aboriginal Police Services.
History
Section 113 of the Police Services Act, which provides the framework for the creation of
a special investigations unit, emerged from racially charged controversy in the late 1980s over
several high profile shootings of criminal suspects by police, and the ways in which these
incidents were being investigated. Prior to the formation of the SIU, police services investigated
complaints against their own officers, and in rare situations, another police service conducted
the investigation. Critics of this regime argued, during hearings at the Task Force on Race
Relations and Policing in 1988, that police services lacked the necessary objectivity to conduct
investigations of their own officers. According to the Task Force’s recommendations, an
independent arms-length agency of the government led by a Director and composed of civilian
investigators would provide the necessary objectivity that police services lacked, and was
required to restore community confidence in policing.
The early years of the SIU, encompassing most of the 1990s, witnessed increasing
tensions between the SIU and police. Police services and their officers were unclear of the SIU
mandate, and their corresponding duties and responsibilities both to report incidents and to

30
cooperate with SIU investigations. Throughout this time period, it was not uncommon for
police services to avoid the SIU entirely, usually because the officer in charge did not deem the
civilian injury “serious” enough to warrant an SIU investigation. In addition to legislative
ambiguities were claims that the SIU was severely under funded, and lacked the resources to
conduct adequate investigations.
Subsequently, in 1997, the Honourable George W. Adams Q.C. was appointed by the
Ontario provincial government to make recommendations aimed at facilitating SIU
investigations and increasing cooperation between police and the SIU. After extensive
consultation with community and police organizations, Adams reported that the SIU required a
sharp increase in funding in order to properly conduct investigations. More importantly,
Adams’s recommendations became the basis for a new regulatory framework which created
more stringent duties on police services to report incidents within SIU jurisdiction, and on
police officers to cooperate with SIU investigations. Adams recognized that it was not practical
for a police service to attempt to determine the SIU’s jurisdiction in a strict legal sense before
notification; rather, Adams argued, “the issue of notification must be treated more like that of
calling an ambulance – when in doubt, call.” With this pronouncement, it became the SIU’s
prerogative to determine whether harm to civilians was serious in nature, and not that of the
involved police service.
Another important outcome of the new regulations was that the SIU gained priority over
police forces to conduct criminal investigations. Specifically, if both a civilian and a police
officer are the subjects of criminal investigation arising from the same incident, the SIU has
priority to conduct a full investigation -- of the scene, the involved officers and witnesses --
before the police service commences its investigation. In addition, involved officers are now
legally obliged to refrain from communicating with each other prior to their interviews with the
SIU. Although subject officers, or the officers alleged to have caused the harm to civilians, have
the right to remain silent, to refuse an interview with the SIU and to disclose copies of their
notes, all other involved police officers have a legal duty to cooperate with SIU investigations.

31
This includes submitting copies of their notes and providing an interview to an SIU
investigator.
SIU Investigations
An SIU investigation begins with the reporting of an incident or a “complaint”. There
are several ways in which complaints become known to the SIU. Every police service is
required, under the new regulations, to have an SIU liaison, or an employee who reports all
incidents involving officers in that police force to the SIU. Failing reporting by police services,
incidents may be reported by civilians, doctors, lawyers or family members of aggrieved
civilians, and even reporters. Anyone can make a complaint to the SIU, and there is no
limitation period for reporting. The SIU has been known to investigate historical sexual assault
cases, where incident is alleged to have occurred decades prior to reporting. In the vast majority
of cases, incidents are reported by the involved police service.
Sometimes complaints are reported to the SIU that do not involve serious injury or
death, and therefore do not fall within the SIU’s mandate. In these cases, the SIU refers the
incident either to the appropriate police service for internal investigation, or other non police
agencies such as OCCOPS (Ontario Civilian Commission on Police Services) for investigation.
In certain situations, it may not be clear at the time of the report whether the incident is
serious in nature, or whether it involves police at all. In these situations, a review is done of the
reported facts, and a preliminary investigation begins. If the preliminary investigation reveals
that the injury is not serious, or does not involve the police, the Director of the SIU is notified,
and may exercise his or her discretion to terminate the investigation, and close the investigative
file. When files are closed, the SIU provides as much information as possible, within limits
imposed by law and policy, to both the involved parties and the public. In addition, the SIU
Director notifies the Attorney General in the form of a memorandum, which briefly summarizes
the incident and explains why the investigation was terminated. Terminated investigations –
those closed by memo – comprise about one third of all reported incidents to the SIU in a given
year.

32
If the preliminary investigation confirms serious injury or death involving police, a full-
scale investigation commences. SIU investigators are dispatched to the scene of the incident
where they examine and secure all physical evidence, seek out and secure the cooperation of
police and civilian witnesses, and seize police equipment and other evidence for forensic
examination. The SIU also monitors the medical condition of any injured parties, and notifies
and updates family members or next of kin of the deceased or injured parties informed.
After preliminary evidence is gathered, the SIU makes important determinations as to
the involvement of particular officers in relation to the incident. The officer(s) whose conduct
appears, in the opinion of the SIU Director, to have caused the death or serious injury under
investigation is deemed a “subject officer”, and is conferred with corresponding rights and
obligations (such as the right to remain silent). An officer who, in the opinion of the SIU
Director, is involved in the incident, but is not a subject officer is deemed a “witness officer”,
and is obliged to disclose his or her notes, provide an interview, and cooperate fully with the
SIU. Witness officers do not have the right to remain silent, although they do have the right to a
lawyer during the interview. In some circumstances, the investigation reveals a different
involvement on the part of the officers than originally believed. In this case, the Director has the
power to re-designate officers, as he or she sees fit.
Following a thorough investigation, the entire file is reviewed by the SIU Director. The
Director must ascertain whether, based upon the investigation, there are reasonable and probable
grounds to believe that a criminal offence was committed by the subject officer(s). This may
entail a legal examination of whether the subject officer breached a standard of care (by driving
dangerously or carelessly discharging his weapon, for example) or a simple evaluation of the
facts to determine whether the legal requirements for a criminal code offence (assault causing
bodily harm, for example) are satisfied. In the vast majority of cases, officers are cleared of
criminal wrongdoing, usually because they acted within their capacity, the force they used was
legally justified, or the harm or death to the civilian was self-inflicted. In a small percentage of
cases however, where the SIU Director finds evidence of criminal wrongdoing, he or she will
cause informations to be laid against the subject officer(s) and will refer them to the Crown
33
Attorney for prosecution. In 2005, the Special Investigations Unit investigated 195 incidents and
laid three criminal charges.
Defining Seriousness
The SIU’s jurisdiction is largely dependant upon whether one accepts a narrow or broad
definition of the term “serious” harm or injury. Precisely what constitutes “serious” harm is the
subject of much debate, but usually encompasses injuries ranging from broken bones and
fractures to sexual assault to shootings, with the most serious case being, of course, death.
Pursuant to the current definition of “serious injury”, the injury must be characterized as
“serious”, rather than simply “transient” or “minor” in nature.”
The SIU’s first Director, the Honourable John Osler, in consultation with the Ministry of
the Solicitor General and the Ontario Association of Chiefs of Police published the following
definition of serious injury, based on the definition of “assault causing bodily harm” as described
in the Criminal Code of Canada: “Serious injuries” shall include those that are likely to interfere
with the health or comfort of the victim and are more than merely transient or trifling in nature
and will include serious injury resulting from sexual assault. “Serious injury” shall initially be
presumed when the victim is admitted to hospital, suffers a fracture to a limb, rib or vertebrae or
to the skull, suffers burns to a major portion of the body or loses any portion of the body or
suffers loss of vision or hearing, or alleges sexual assault. Where a prolonged delay is likely
before the seriousness of the injury can be assessed, the Unit should be notified so that it can
monitor the situation and decide on the extent of its involvement.
Research Methodology
The current study is based on the examination of data from SIU Director’s Reports. A
Director’s report provides detailed information on each SIU investigation, including the time,
date and location of the incident, the personal characteristics of the civilian or civilians involved,

5 We have included 12 cases (1.5% of the final sample) that were actually opened beforeJanuary 1st, 2000. These investigations were included because they were completed or closedduring the study period.
6 Since memo cases did not involve a full SIU investigation, missing data is a majorproblem. For example, civilian race could not be identified in 61% of all cases closed by memo. This is further justification for dropping them from the balance of our analysis.
34
the cause of civilian injury or death, a description of the circumstances surrounding the incident,
and the justification behind the Director’s decision to either charge subject officers with a
criminal offence or clear them of any criminal wrongdoing.
The research team collected information on each SIU investigation that was completed
between January 1st, 2000 and June 6th, 2006 (a five and a half year period).5 During the study
period the SIU completed 1,060 investigations involving 1,113 civilians (53 cases involved more
than one civilian victim). The unit of analysis in the current study is the individual civilian
(N=1,113), not the number of opened files (N=1,060). In other words, we completed one data
record for each civilian involved in an SIU investigation.
Closer inspection of SIU records revealed that 329 of the original 1,113 investigations
(29.6%) had been closed “by memo” shortly after the file had been opened. Most of these
“memo” cases were closed because preliminary examination had revealed that the incident was
outside of the SIU’s jurisdiction. For example, over half of the 329 “memo” cases (57%) were
closed because the civilian’s injury was not serious enough to warrant a full SIU investigation.
An additional 33% were closed because the civilian’s injury or death had clearly not been caused
by police activity. Finally, 6% of “memo” cases were closed because of a lack of cooperation
from the civilian and 4% were closed because a victim could not be located. Since “memo”
cases were generally outside of the SIU’s jurisdiction, they have been dropped from the balance
of our analysis.6
The following analysis therefore excludes “memo” cases and is based on a final sample
of 784 full SIU investigations completed between January 1st, 2000 and June 6th, 2006. The data
template used to collect information about each investigation is provided in Appendix A.

35
Important variables include the time, date and location of the incident, the cause of civilian death
or injury, the nature of the injury, civilian characteristics (including age, gender, race, mental
health, criminal record, etc.), number of subject officers, number of witness officers, the
characteristics of subject and witness officers, the actions of the civilian at the time of the
incident, weapons use by civilians and case outcome.
It should be noted that the racial background of civilians is not regularly recorded by SIU
investigators. That is, there was no intentional or organized effort by the SIU to collect racial
statistics per se as they were not necessary in the discharge of the SIU’s mandate. We therefore
had to rely on a variety of other methods to make this determination, including: 1) case
photographs; 2) interviews with the SIU investigators assigned to the case; and 3) photographs of
the civilian that appeared in newspaper coverage of the incident. Using these methods we were
able to identify the civilian’s racial background in 84% of the cases included in our sample. The
possible impact of the missing racial data is discussed further in our results section.
Data entry collection for this project was completed by the end of June 2006. Data entry
and cleaning was completed by August 8th, 2006. Thus, at the time of the writing of this report,
we have only been working with the data for a couple of weeks. Thus, readers should view these
findings as preliminary. Additional findings should emerge as after we have had more time to
work with the data.
Results – The Representation of Minorities in SIU Cases
Tables 1 through 7 compare the representation of different racial groups in Ontario with
their representation in SIU investigations. The population estimates for Ontario are derived from
the 2001 Canadian Census. Estimates for the White population were calculated by taking the
total population estimate and deducting the total visible minority population and the total
aboriginal population. The Asian population includes those who identified as Chinese, Korean,
Japanese, Southeast Asian and Filipino. The South Asian population includes people of Indian,
Pakistani, Tamil and Sri Lankan descent. The West Asian population includes those who
36
identified as West Asian or Arab. The “other” category includes those who identified as a
multiple visible minority, Latin American or visible minority group not included elsewhere.
Odds ratios and SIU case rates were calculated to determine the over-representation or
under representation of specific racial groups in SIU investigations. Odds ratios were calculated
by dividing the % of all SIU cases involving a particular racial group by their % representation
in the general population. An odds ratio approaching 1.00 indicates that a racial group is neither
over or under-represented in SIU cases. An odds ratio less than 1.00 indicates that the group is
under-represented in SIU cases. An odds ratio greater than 1.00 indicates that the group is over-
represented. For example, an odds ratio of 2.00 indicates that a group is twice as prevalent in
SIU cases as they are in the general population. By contrast, an odds ratio of 0.50 indicates that
a group is 50% less represented in SIU investigations as their proportion of the general
population would predict.
The SIU case rate (per 100,000) was calculated by dividing the total number of SIU cases
per group by their population estimate and multiplying that figure by 100,000. The rate indicates
the number of people, per 100,000 population, that were involved in an SIU investigation during
the study period. This case rate allows us to directly compare the experiences of racial groups of
varying size. For example, if Group A has a case rate of 10 per 100,000 and Group B has a rate
of 5 per 100,000, we can accurately state that members of Group A are twice as likely to become
involved in an SIU investigation as the members of Group B.
We must stress that the figures presented in these tables are based on Census projections
and the total population of SIU investigations over the five and a half year study period. These
are not figures based on a random sample and therefore are not subjected to the rules of
probability theory. In other words, the observed racial differences do not have to be tested for
statistical significance. All the racial differences documented in these tables should therefore be
interpreted as “real” differences. Nonetheless. it should be noted that our population estimates
were based on 2001 population estimates. However, we use SIU case data up to 2005. It is thus
possible that the population size of some racial groups in Ontario may have increased slightly
since 2001. This might mean that the rates for some racial groups may be slightly inflated.
37
However, we strongly believe that any increase in population size over the study period would
have very little impact on the magnitude of the racial differences observed below.
Overall, the results suggest that both Aboriginal Canadians and African Canadians are
highly over-represented in SIU investigations (see Table 1). For example, while Blacks are only
3.6% of the Ontario population, they represent 12.0% of civilians involved in SIU investigations.
The odds ratio indicates that Blacks are 3.3 times more likely to appear in an SIU investigation
than their representation in the general population would predict. Furthermore, the Black SIU
case rate (22.9 per 100,000) is more than three times greater than the overall provincial rate
(6.95) and is 4.5 times higher than the White rate (5.11).
Similarly, while Aboriginals are only 1.7% of the provincial population, they represent
7.1% of all civilians involved in SIU investigations. The odds ratio indicates that Aboriginals
are 4.2 times more likely to appear in an SIU investigation than their representation in the
general population would predict. Furthermore, the Aboriginal SIU case rate (29.7) is 4.3 times
greater than the overall rate for the province and is 5.8 times greater than the White rate.
It should be stressed, however, that not all racial minority groups are over-represented in
SIU statistics. Asians, South Asians, West Asians and people from other racial minority
backgrounds appear to significantly under-represented. In fact, the SIU case rate for White
Ontario residents is more than twice the rate for Asians and South Asians. Interestingly, these
results mirror the findings of racial profiling research in Ontario. While Black people and
Aboriginal Canadians are more likely to be stopped and searched by the police than White
people, White people are actually more likely to be stopped and searched than Asians or South
Asians (see Wortley and Tanner 2005; Wortley and Tanner 2003).
At this point we would like to make a point about the missing racial data. As discussed
above, we could not identify the race of the civilian in 128 of our 784 cases (16.3%). If any of
these 128 cases involved Black or Aboriginal civilians, the SIU case rate for these groups would
increase and the racial disparities observed in the data would become even more pronounced. In
other words, the current estimates of Black and Aboriginal over-involvement in use of force
statistics may be quite conservative. Furthermore, it must be stressed that even if all of the cases

38
with missing racial data involve White citizens, profound racial differences will remain. For
example, if all the missing cases actually involve Whites, the number of White civilians in SIU
investigations would rise from 457 to 585 and the White SIU case rate would increase from 5.11
to 6.54 per 100,000. However, even with a White rate of 6.54 per 100,000, Aboriginals are still
4.5 times more likely than Whites to be involved in a SIU investigations. Furthermore, the
current Black SIU case rate of 22.87 per 100,000 is still 3.5 greater than a hypothetical White
rate of 6.54 per 100,000.
The Impact of Gender
Overall, the results suggest that the vast majority of the civilians who became involved in
SIU investigations during the study period are male (82%). On the other hand, less than one in
five SIU investigations (18%) involve a female victim of police use of force. Importantly, the
results also suggest that Aboriginal and Black males are more likely to become involved in
police use of force incidents than any other demographic group (see Tables 1A and 1B).
Furthermore, racial differences in the SIU case rate, in general, appear to be greater within the
male population than within the female population. For example, the Black male SIU rate (44.5
per 100,00) is approximately 5.2 times greater than the White male SIU rate (8.6 per 100,000 –
see Table 1A). By contrast, the Black female SIU rate (3.7 per 100,000) is only 2.1 times greater
than the White female SIU rate (1.7 per 100,000 – see Table 1B). The only exception to this
general rule involves Aboriginal females. For example, the Aboriginal female SIU rate (12.4 per
100,000) is 7.1 times greater than the White female rate (1.7 per 100,000 – see Table 1B). By
contrast, the Aboriginal male SIU rate (48.1 per 100,000) is only 5.6 times greater than the
White rate (8.6 per 100,000 – see Table 1A). Interestingly, it appears that the police in Ontario
are somewhat more likely to use physical force against Aboriginal women (SIU case rate=12.4
per 100,000) than against White males (SIU case rate=8.6 per 100,000). Overall, the date
suggest that Aboriginal males in Ontario are the demographic group who are the most likely to
become involved in an SIU investigation (SIU case rate=48.1 per 100,000), followed closely by
Black males (44.5 per 100,000), Aboriginal females (12.4 per 100,000), West Asian males (9.7
7 In such cases it was difficult to determine whether the motive of the civilian was suicideor escape.
39
per 100,000), White Males (8.6 per 100,000), Asian males (4.4 per 100,000), Black females (3.7
per 100,000), South Asian males (2.8 per 100,000), South Asian females (1.5 per 100,000), West
Asian females (1.4 per 100,000) and Asian females (0.7 per 100,000).
Cause of Harm to Civilian
Further analysis suggests that the SIU ultimately concluded that the police did not
directly cause the civilian injury or death in 371 (47.3%) of the 784 cases reviewed for this
study. It is important to note that harm was slightly more likely to be directly caused by police
actions in cases involving African Canadian civilians (64%) than cases involving Aboriginals
(57%), Whites (54%), South Asians (33%) or Asians (30%).
Within the sample of cases (N=371) in which the SIU determined that harm was not
directly caused by the police, car accidents were the main cause of injury or death (31%),
followed by suicides (12%), self-inflicted injuries (10%), accidents (10%), drug or alcohol abuse
(8%), jumping from balconies or bridges to elude police or attempt suicide (7%),7 accidents that
occurred while the civilian was fleeing from the police (5%), pre-existing health issues –
including heart problems (5%), and injuries caused by the actions of other civilians (3%). Few
racial differences exist – although Black civilians are somewhat less involved in suicides and
suicide attempts than their White counterparts and are slightly more involved in cases involving
drug or alcohol abuse.
Table 2 examines all investigations in which SIU investigators determined that the
civilian injury was the direct result of police actions (N=413). The findings indicate that the
over-representation of Aboriginals and African Canadians in SIU cases becomes even more
pronounced when we limit our analysis to these cases. For example, although Blacks represent
12.0% of all SIU investigations, they represent 14.5% of all investigations in which injury or
death was directly caused by police actions. Similarly, although Aboriginals represent 7.1% of

40
all SIU investigations, they represent 7.7% of all investigations in which injury or death was
directly caused by the police.
When we only consider cases in which harm was directly caused by the police, the Black
SIU case rate becomes 4 times greater than the overall provincial rate and 5.3 times the White
rate. Similarly, the rate for Aboriginal Canadians is 4.7 times the provincial rate and 6.1 times
the White rate.
Additional analysis reveals that 86 of the 413 cases (21%) in which civilian harm was
directly caused by the police involved the use of physical restraints at the time of arrest. An
additional 19% involved physical assault (punching, kicking, etc.), 18% involved police
shootings, 15% involved allegations of sexual assault, 13% involved assaults with other weapons
(batons, tasers, pepper spray, etc.) and 15% involved car accidents that resulted from police
pursuits.
It was felt that although injuries or deaths caused by police vehicle pursuits are an
important issue, in the traditional sense, these cases do not really involve police use of force.
Thus, in Table 3, we deleted vehicle pursuits from the sample and focussed exclusively on deaths
or injuries that resulted from police use of force. The results suggest that the over-representation
of Blacks and Aboriginals in SIU statistics becomes even more pronounced when we focus only
on those cases that involved police use of force. For example, while Black civilians are involved
in 12.0% of all SIU cases, they represent almost 16% of cases that involve police use of force.
Similarly, while aboriginals are involved in 7.1% of all SIU investigations, they represent 8.3%
of all use of force incidents.
Additional analysis indicates that the police use of force rate for Black Ontario residents
(13.38 per 100,000) is 4.3 times higher than the provincial rate. Furthermore, a comparison of
the Black rate (13.38) with the White rate (2.48) suggests that Black civilians are 5.4 times more
likely to become involved in a SIU use of force investigation than their White counterparts.
Similarly, the police use of force rate for Aboriginals (15.40 per 100,000) is 5.0 times the
provincial rate. Furthermore, a comparison of the Aboriginal rate (15.40) with the White rate

41
(2.48) suggests that Aboriginal civilians are 6.2 times more likely to become involved in a SIU
use of force investigation than their White counterparts.
Police shootings are perhaps the most extreme example of police use of force. Thus, we
decided to look at all SIU investigations involving police shootings in isolation (Table 4). It is
important to note that missing racial data has become less of an issue as we have moved towards
more “serious” SIU cases. For example, race of civilian could not be identified in 128 of the 784
cases (16.3%) in the original sample. However, this figure drops to 29 cases (8.3%) when we
focus on the 349 police use of force incidents. Finally, race of civilian could not be identified in
only 2 of the 73 cases (2.7%) that involved a police shooting.
The results, once again, suggest that the over-representation of African Canadians in SIU
statistics becomes most pronounced when we focus on the more serious cases. For example,
Black people represent only 3.6% of the provincial population, 12.0% of all SIU cases, 15.8% of
investigations into police use of force and 27.4% of investigations into police shootings.
Additional analysis indicates that the police shooting rate for Black Ontario residents
(4.87 per 100,000) is 7.5 times higher than the overall provincial rate. Furthermore, a
comparison of the Black police shooting rate (4.87) with the White police shooting rate (0.48)
suggests that the Black residents of Ontario are 10.1 times more likely to become involved in a
police shooting than their White counterparts. In other words, over the five and a half year study
period, the police in Ontario shot one White person for every 208,333 White people in the
general population. By contrast, the police in Ontario shot one Black person for every 20,534
Black people in the general population.
According to the SIU data, the Aboriginal residents of Ontario are also over-represented
in police shootings – although not to the same extent as African Canadians. Although
Aboriginal people represent only 1.7% of the provincial population, they represent 6.8% of all
civilians involved in SIU shooting investigations. The Aboriginal police shooting rate of 2.66 per
100,000 is 4.1 times greater than the White rate (0.48). Over the study period, the police shot
one Aboriginal civilian for every 37,593 Aboriginals in the general population.
42
Of the 784 SIU investigations in our sample, 206 cases (26.3%) involved the death of a
civilian. Consistent with our previous analysis, an examination of all death cases reveals the
over-representation of both Aboriginals and African Canadians. Although Blacks are only 3.6%
of the population, they are 13.6% of all SIU investigations that involved the death of a citizen
(see Table 5). The Black SIU death rate (6.81 per 100,000) is 3.7 times the provincial average
(1.85) and 5 times greater than the White rate. Although Aboriginals are only 1.7% of the
provincial population, they represent 5.8% of all SIU investigations into civilian deaths. The
Aboriginal SIU death rate is 3.4 times the provincial rate and 4.6 times the White rate.
Of the 206 investigations involving civilian deaths, SIU investigators determined that
only 37 (18%) were caused by police use of force (see Table 6). Although Black people
represent 13.6% of all deaths investigated by the SIU, this figure rises to 27.0% when we
consider deaths caused by police use of force. The Black rate of death by police use of force
(2.43 per 100,000) is 7.4 times higher than the provincial average (0.33) and 11 times greater
than the White rate (0.22). Similarly, although Aboriginals are only 1.7% of the provincial
population, they represent 8.1% of all deaths caused by police use of force The Aboriginal rate
of death by police use of force (1.59) is 4.8 times the provincial rate and 7.2 times greater than
the White rate.
Finally, Table 7 examines cases where the death of a civilian was caused by a police
shooting. The results indicate that 8 of the 23 shooting deaths recorded by the SIU during the
study period involved African Canadians. Thus, while Black people represent only 3.6% of the
population, they represent 27.0% of all deaths caused by police use of force and 34.5% of all
deaths caused by police shootings. The Black rate of police shooting deaths (1.95) is 9.7 times
greater than the provincial rate (0.20) and 16 times greater than the rate for White people (0.12).
Overall, over the study period, the police shot and killed one Black person for every 51, 282
Black people in the general population. By contrast, the police shot and killed one White person
for every 833,333 White people in the general population.
Results – The Representation of Minorities in Toronto-Area SIU Cases
43
Census figures indicate that the vast majority of Ontario’s Black population – 75.5% –
resides in the Toronto Census Metropolitan Area (CMA). This area includes the City of
Toronto, Mississauga, Markham, Richmond Hill, Brampton, Oakville, Pickering, Whitby,
Oshawa and a number of other municipalities. Since the Black population is particularly large in
this area of the province, we felt that it was important to examine the SIU data for this region.
The Canadian Centre for Justice Statistics (2005) reports that the Toronto CMA is policed by a
number of different police services including the Toronto Police Service, Peel Regional Police,
York Regional Police, Durham Regional Police and the Halton Regional Police Service. Thus,
we produced use of force data for the Toronto CMA by combining all SIU investigations that
involved officers from these police services.
Overall, the pattern of results for the Toronto CMA are very similar to the provincial
results discussed above. However, when we restrict use of force incidents to the Toronto CMA,
African Canadians become even more highly over-represented in SIU investigations (see Table
8). For example, while Blacks are only 6.7% of the population in the Toronto CMA, they
represent more than a fourth (25.9%) of the civilians involved in SIU investigations. The odds
ratio indicates that Blacks in the region are 3.9 times more likely to appear in an SIU
investigation than their representation in the general population would predict. Furthermore, the
Black SIU case rate (24.1 per 100,000) is almost four times greater than the overall CMA rate
(6.24) and is 5.1 times higher than the White rate (4.77).
The Aboriginal population in the greater Toronto region is quite small (20,300
individuals). Nonetheless, this group remains over-represented in SIU investigations. While
Aboriginals are only 0.4% of the population in the Toronto CMA, they represent 1.7% of all
civilians involved in SIU investigations. The odds ratio indicates that Aboriginals are 4.3 times
more likely to appear in an SIU investigation than their representation in the general population
would predict. Furthermore, the Aboriginal SIU case rate (24.6 per 100,000) is 3.9 times greater
than the rate for the Toronto CMA and is 5.2 times greater than the White rate.
Table 9 examines all Toronto area investigations in which SIU investigators determined
that civilian injury was the direct result of police actions (N=171). The findings indicate that the

44
over-representation of African Canadians in SIU cases becomes even more pronounced when we
limit our analysis to these cases. For example, although Blacks represent 25.6% of all SIU
investigations from the Toronto CMA, they represent 29.2% of all investigations in which the
civilian’s injury or death was directly caused by police actions. Similarly, although Aboriginals
represent 0.4% of all SIU investigations, they represent 1.8% of all investigations in which
injury or death was directly caused by the police.
When we only consider cases in which harm was directly caused by the police, the Black
SIU case rate for the greater Toronto region becomes 4.4 times greater than the CMA rate and
5.4 times the White rate. Similarly, the rate for Aboriginal Canadians is 4.0 times greater than
the provincial rate and 5.0 times greater than the White rate.
The results suggest that the over-representation of Black people in SIU statistics for the
Toronto region becomes even more pronounced when we focus only on those cases that involved
police use of force (see Table 10). For example, while Black civilians are involved in 25.9% of
all SIU cases from the Toronto CMA, they represent a third (32.6%) of cases that involve police
use of force.
Additional analysis indicates that the police use of force rate for Black people (14.81 per
100,000) is 4.9 times higher than the overall rate for the Toronto CMA. Furthermore, a
comparison of the Black rate (14.81) with the White rate (2.57) suggests that Black civilians are
5.8 times more likely to become involved in a SIU use of force investigation than their White
counterparts.
Similarly, the police use of force rate for Aboriginals (14.78 per 100,000) is 4.9 times the
rate for the greater Toronto area. Furthermore, a comparison of the Aboriginal rate (14.78) with
the White rate (2.57) suggests that Aboriginal civilians are 5.7 times more likely to become
involved in a SIU use of force investigation than their White counterparts.
The results with respect to police shootings once again suggest that the over-
representation of African Canadians in SIU statistics becomes most pronounced when we focus
on the more serious cases (Table 11). For example, Black people represent 6.7% of the
45
population in the Toronto CMA, 25.9% of all SIU investigations in the region, 32.6% of all use
of force investigations and a half (50.0%) of all investigations into police shootings.
Additional analysis indicates that the police shooting rate for Black people in the region
(5.15 per 100,000) is 7.5 times higher than the overall rate for the Toronto CMA. Furthermore, a
comparison of the Black police shooting rate (5.15) with the White police shooting rate (0.41)
suggests that the Black residents of the Toronto CMA are 12.6 times more likely to become
involved in a police shooting than their White counterparts. In other words, over the five and a
half year study period, the police in the greater Toronto region shot one White person for every
243,902 White people in the general population. By contrast, the police in Ontario shot one
Black person for every 19,417 Black people in the general population.
Consistent with our previous analysis of the provincial data, an examination of all SIU
death cases from the Toronto CMA reveals an over-representation of African Canadians.
Although Blacks are only 6.7% of the population, they are 27.8% of all SIU investigations that
involved the death of a citizen from the Toronto CMA (see Table 12). The Black SIU death rate
(7.09 per 100,000) is 4.2 times greater than the overall rate for the greater Toronto region (1.69)
and 5.5 times greater than the White rate (1.30).
Of the 79 SIU investigations involving civilian deaths in the Toronto CMA, SIU
investigators determined that only 21 (26.6%) were caused by police use of force (see Table 13).
Although Black people represent 27.8% of all deaths investigated by the SIU from the Toronto
area, this figure rises to 47.6% when we consider deaths caused by police use of force. The
Black rate of death by police use of force (3.22 per 100,000) is 7.2 times higher than the rate for
the Toronto CMA (0.45) and 13.4 times greater than the White rate (0.24) for this region.
Finally, Table 14 examines cases from the Toronto CMA where the death of a civilian
was caused by a police shooting. The results indicate that 8 of the 12 shooting deaths in the
Toronto region involved African Canadians. Thus, while Black people represent only 6.7% of
the population in the Toronto CMA, they represent almost 50% of all deaths caused by police
use of force and two-thirds (66.7%) of all deaths caused by police shootings. The Black rate of
police shooting deaths (2.58 per 100,000) is 9.9 times greater than the rate for the Toronto CMA
46
(0.26) and 36.9 times greater than the rate for White people in the region. Over the five and a
half year study period, police in the greater Toronto region shot and killed one Black person for
every 38,760 Black people in the general population. By contrast, the police shot and killed one
White person for every 1,428,571 White people in the Toronto CMA.
Summary: The Numbers in Context
In sum, the results presented in the above section strongly indicate that African
Canadians and Aboriginals are grossly over-represented in police use of force statistics in
general – and police shooting incidents in particular. For African Canadians, this over-
representation is especially high in the Toronto CMA.
These numbers are disturbing. However, we should also note that police use of force in
Ontario, particularly compared to our American neighbours, appears to be quite infrequent.
Some police scholars, for example, might think it remarkable that, over a five and a half year
period, the police in Ontario (population over 11 million people) were only involved in 73
civilian shootings and that only 23 of these shootings were fatal. That works out to a provincial
average of only 13.3 police shooting incidents per year. The average for fatal police shootings
drops to only 4.2 incidents per year.
By contrast, during a 10 year period between 1987 and 1997, the police in Chicago
(population approximately 3 million people) were involved in 372 fatal shootings and 100 non-
fatal shootings (total shootings=472). This works out to an average of 47.2 shootings per year in
Chicago (compared to an average of 13.2 shootings in Ontario). With respect to fatal shootings,
the Chicago average is 37.2 per year (compared to only 4.2 incidents per year in Ontario).
Nonetheless, as in the United States, it appears that when the police in Ontario do decide to use
force, they use it much more frequently against African Canadians and Aboriginals than any
other racial groups.
Racial Differences in the Characteristics of SIU Investigations

47
In the above section, we concluded that Aboriginals and African Canadians are greatly
over-represented in police use of force incidents. In this section we examine whether SIU
investigations involving racial minorities are similar or different than investigations involving
White civilians.
We remind the reader that the SIU data we analyse in this section is represents the entire
population of SIU investigations that took place over the study period. This information is not
based on a random sample. Thus, the Chi-Square statistics provided at the bottom of Tables 15
through 40 should be used to illustrate the magnitude of racial differences not to determine
statistical significance. When using data from total populations all differences are statistically
significant.
Gender and Age of Civilians
The data indicate that the vast majority of civilians involved in SIU investigations are
male (see Tables 15 and 16). However, males make up an even larger proportion of
investigations involving Black civilians (90.4%) than investigations involving Whites (82.5%) or
Aboriginals (78.6%). By contrast, women represent almost one out of every four investigations
involving Aboriginal civilians.
The data also indicate that the Black people involved in SIU investigations tend to be
somewhat younger than their White and Aboriginal counterparts (see Tables 17 and 18). For
example, almost 60% of Black civilians are 29 years of age or younger, compared to only 35%
of Whites and 47% of Aboriginals.
In sum, compared to people from other racial groups, Black victims of police use of force
are more likely to be young and male. This finding is consistent will allegations from the Black
community that the police frequently target young Black males. However, this finding is also
consistent with the argument that young Black males are more involved in criminal activity than
others.

48
Criminal History
SIU records documented whether civilians who became involved with the police had a
criminal record or not. The results suggest that, regardless of race, the majority of civilians
involved in SIU investigations have some kind of criminal record (see Tables 19 through 21).
However, it should be noted that, in cases involving police use of force, Black civilians are
somewhat less likely to have a criminal record than Whites or Aboriginals. For example, in
police shooting investigations, only 45% of the Black civilians had a criminal record, compared
to 72% of Whites and 80% of Aboriginals. This provides limited support to the argument that,
regardless of their criminal history, Black males are more vulnerable to violent confrontations
with the police than people from other racial backgrounds.
Intoxication at the Time of the Incident
The SIU data indicate that a high proportion of civilians who came into violent contact
with the police were intoxicated (on drugs or alcohol) at the time of the incident (see Tables 22
through 24). However, the results also suggest that Black civilians were much less likely to be
intoxicated than Whites or Aboriginals. For example, only 13% of Black civilians involved in
police use of force incidents were intoxicated, compared to 40% of Whites and 66% of
Aboriginals (Table 23). Similarly, only 10% of Blacks involved in police shootings were
intoxicated, compared to 33% of Whites and 40% of Aboriginals. In sum, sobriety does not
seem to protect Black civilians from contact with the police to the same extent that it protects
Whites and Aboriginals.
Mental Health at the Time of the Incident
The results also suggest that Black civilians involved in SIU investigations were much
less likely to be manifesting mental health problems at the time of the incident (Tables 25
through 27). For example, in use of force cases (Table 26), 78% of Black civilians showed no
signs of mental health problems, compared to 62% of White and Aboriginal civilians. Similarly,
in police shooting cases, only 30% of Black civilians displayed a mental health problem,
49
compared to 72% of Whites and 60% of Aboriginals. Indeed, 37% of the White civilians and
40% of the Aboriginals involved in police shootings were classified as “suicidal.” By contrast,
only 10% of the African Canadians involved in police shootings were given such an assessment
(Table 27). In sum, mental health issues seem to draw a relatively high proportion of Whites and
Aboriginals into violent contact with the police. The same cannot be said for African Canadians.
Civilian Behaviour at the Time of the Incident
According to the data, regardless of race, the majority of civilians who came into violent
contact with the police during the study period were involved in some kind of criminal or violent
activity at the time of the incident. For example, in over a third of all use of force cases, it was
reported that the civilian victim had either assaulted or threatened the police or civilian
bystanders (see Table 29). Another 25% of all use of force cases involved civilians who were
actively resisting arrest – at least according to the Director’s conclusions.
Overall, racial differences in civilian actions at the time of the incident appear to be
minimal. However, there is some evidence to suggest that, in police shootings cases, Black
civilians were somewhat less likely to have assaulted or threatened the police or civilian
bystanders. For example, according to SIU records, 79% of White civilians and 80% of
Aboriginal civilians had actually assaulted or threatened the police (or civilian bystanders)
before being shot, compared to only 60% of Black civilians (Table 30).
Weapon Use During the Incident
The data suggest that the majority of civilians involved in SIU investigations were
unarmed at the time of the incident. However, the data also suggest that the more serious the
level of force used by the police, the more likely it was that the civilian involved had some kind
of weapon with them during the incident (see Tables 31 through 33). There is also evidence to
suggest that Black civilians were somewhat more likely to be armed, and armed with a firearm,
than civilians from other racial backgrounds. For example, in use of force cases, the Director’s
reports suggested that only 58% of Black civilians were unarmed, compared to 76% of

50
Aboriginals and 79% of Whites. In addition, the data suggest that 22% of Black civilians were
in possession of a firearm at the time of the incident, compared to 14% of Aboriginals and 7% of
Whites (see Table 32).
The presence of weapons was particularly pronounced in police shooting cases (Table
33). Only 3 of the 20 Black civilians shot by the police during the study period were unarmed
(15%). Similarly, only 6 of the 43 White civilians shot by the police were unarmed (14%). All 5
of the Aboriginals shot by the police had a weapon. The data further indicate that the Black and
Aboriginal civilians involved in police shootings were more likely to be in the possession of a
gun than their White counterparts. Overall, 80% of the Aboriginals involved in police shootings
had a firearm in their possession at the time of the incident, compared to 45% of Blacks and 35%
of Whites.
Finally, it is interesting to note that Black and Aboriginal civilians were somewhat more
involved in cases where a motor vehicle had been used as a weapon. Such cases are often
controversial. Critics often charge that the civilians involved in such cases were merely trying to
flee the police and not trying to use the vehicle as a weapon.
Case Outcomes
If the police are more likely to use excessive or illegitimate force against racial
minorities, we might expect that SIU investigations would be more likely to result in charges in
cases involving minority civilians than cases involving Whites. The results of our analysis do
not support this hypothesis.
The data indicate that, regardless of the racial background of the civilians involved, the
SIU rarely charges police officers involved in their investigations. For example, the SIU laid
charges in only 4 of the 94 cases involving Black civilians (4.3%), 16 of the 457 cases involving
White civilians (3.5%), 1 of the 56 cases involving Aboriginal civilians (1.8%) and 2 of the 49
investigations involving civilians from other racial backgrounds (4.1%).
The low SIU charge rate is likely to be interpreted in two different ways. On the one
hand, the low charge rate can be viewed as strong evidence that the police in Ontario rarely use
51
illegitimate force against Whites or racial minority civilians. In other words, when the police in
Ontario resort to physical force it is almost always justified. However, it is possible that some
critics may charge that SIU investigations are biassed because they frequently involve
investigators with a policing background and because investigators tend to accept the testimony
of subject and witness officers and reject the testimony of civilian victims and witnesses. This is
a difficult debate to address at this time.
Police Cooperation in SIU Investigations
Many community members have expressed great concern that the police often do not
cooperate with SIU investigators. They have argued that this lack of cooperation has seriously
damaged the ability of the SIU to conduct complete, objective investigations into police use of
force incidents. These community members further argue that a good measure of police
cooperation is whether or not subject officers gave a statement about the incident to the SIU.
Before continuing with the analysis, it must be stressed that the SIU does not share this opinion.
It is the opinion of the SIU that subject officers have the legal right to refuse to provide a
statement. Therefore, it is the SIU’s strong position that whether or not a subject officer
provides a statement is NO indication of their cooperation. The SIU believes that subject
officers have the legal right to remain silent and that no adverse inference can be drawn in law,
nor is it drawn in practice by the SIU, when the subject officer exercises that right. In fact, no
adverse inference can be drawn from anyone, civilian or police, when subject officers exercise
that right.
Notwithstanding the debate over this issue, it has been argued that, if racial bias exists,
subject officers should be less cooperative in SIU investigations that involve minority civilians
than investigations that involve Whites. Our data do not support this hypothesis.
While it is clear that subject officers fail to provide statements to the SIU in a high
proportion of cases, there is little evidence to suggest that the race of the civilian matters (see
Tables 36 through 38). If anything, there is some evidence to suggest that subject officers are
52
actually more likely to provide statements in cases involving African Canadians. For example,
in use of force cases, subject officers refused to give statements in 55% of the cases involving
White civilians, 52% of the cases involving Aboriginals, 57% of the cases involving other racial
minorities, and only 40% of the cases involving Blacks (Table 37).
Finally, during data collection, we created a variable to note if the Director had
commented on problems with police cooperation during the investigation. The Director noted
problems with cooperation in about 10% of the cases documented during the study period.
However, as with the findings on police stsatements, there is no evidence to suggest that the
police are less cooperative in cases involving racial minority civilians than cases involving
Whites (see Tables 39 and 40).

53
PART E:EXPLAINING BLACK AND ABORIGINAL OVER-REPRESENTATION IN POLICE
USE OF FORCE STATISTICS
The results of our focus group discussions are completely consistent with the results of
previous survey research. Both strongly suggest that a large segment of Canada’s Black
community believes that the police are much more likely to use physical force against Black
people than people from other racial groups. The results of our research on SIU records suggest
that such concerns are warranted. Indeed, in Ontario, African Canadians and Aboriginal
Canadians are greatly over-represented in police use of force incidents. Hopefully, this data can
close the debate over whether Aboriginal and Black residents are more exposed to police use of
force than White people. They are. We must now turn our efforts to explaining why this over-
representation exists.
To begin with, we clearly cannot discount the possibility that the results of this study
provide evidence of racial bias within Ontario police services. As stated in a document entitled
Policy and Guidelines on Racism and Racial Discrimination, the Ontario Human Rights
Commission (OHRC) maintains that:
Numerical data that demonstrated that members of racialized groups aredisproportionately represented may be an indicator of systemic or institutionalracism. Numerical data can be evidence of the consequences of a discriminatorysystem in the following ways: 1) Under-representation in an organization relativeto the availability of qualified individuals in the population or in the applicantpool suggests systemic racism in hiring practices or may be indicative of on-the-job discrimination resulting in a failure to retain racialized persons; 2) Unequaldistribution of racialized persons in an organization, for example, highconcentration in entry-level positions and low representation in managerialpositions, may demonstrate inequitable training and promotion practices; and 3)Over-representation of racialized persons in police stops, jails and other areas ofthe justice system may be indicative of the practice of racial profiling or otherforms of racial discrimination (OHRC 2005: 32).
However, the OHRC cautions that: “Except in the most obvious circumstances, for
example, where data show gross disparities in treatment that are unlikely to be the result of

8 It is somewhat difficult to determine whether the huge racial disparities observed in thecurrent SIU study reach the “gross disparity” standard highlighted by the Ontario Human RightsCommission. At what level do racial disparities become large enough to indicatediscrimination?
54
random selection, numerical data alone will not be proof of systemic discrimination.8 However,
it will constitute strong circumstantial evidence of the existence of inequitable practices. An
organization can challenge the statistics and their validity or can demonstrate a non-
discriminatory reason for disproportional representation” (OHRC 2005: 32).
It is almost certain that police organizations in Ontario will vigorously dispute the idea
that the gross racial disparities in use of force statistics documented by this study are evidence of
overt or systemic racial bias. It will likely be argued, for example, that minority criminality or
aggressiveness during police encounters can explain this over-representation. This argument is
bolstered somewhat by the finding, presented above, that indicates that the Special Investigations
Unit rarely lays criminal charges against the police in use of force cases. In other words, the data
clearly indicate that SIU officials, as a result of their intensive and detailed investigations, almost
always conclude that the police are justified when they resort to the use of force. Furthermore,
the data also show that SIU Director is not more likely to lay criminal charges against the police
in cases involving racial minority civilians – a finding that suggests that police use of force
against minorities is just as ‘rational’ or ‘legitimate’ as the use of force against White people. Of
course, this finding will not necessarily convince members of racial minority communities that
racial bias does not exist. Indeed, some of our focus group participants felt that SIU
investigations are compromised by the fact that many SIU investigators are ex-police officers.
Furthermore, community members have frequently expressed the belief that, during any formal
inquiry into police misconduct, investigators and adjudicators are much more likely to believe
the statements of police officers over the statements of civilian victims and witnesses (especially
minority victims and witnesses). In other words, inquiries often develop into “our word against
their word” scenarios, and in such cases, civilians are often viewed as having less credibility than
sworn police officers.

55
Unfortunately, the current study can do little more to address this fundamental debate.
To our knowledge, this is the first study of it’s kind in Canada. Thus, as is the case with most
“first studies,” certain data limitations emerged. First of all, unlike most American research, we
were unable to statistically control for race-specific crime rates. To date such” race-crime data”
are not publically available to Canadian researchers (see Wortley 1996; Wortley and McCalla
2003). It was also very difficult to determine from the SIU Director’s files, the exact location of
many police use of force incidents. Thus, we were unable to accurately measure the impact that
certain neighbourhood characteristics (including local crime rates, neighbourhood poverty levels,
proportion of the community from different racial groups, etc.) have on police use of force
incidents. Finally, although we made an attempt (see Appendix B), we were often unable to
gather information on other important case characteristics (including the age, gender, race,
education, rank and experience of the subject officers, the number of police and civilian witness,
whether the statements of civilians conflicted with the statements of police officers, etc.). Such
information would have permitted a more detailed analysis of SIU cases.
Nonetheless, we do feel that this is a landmark study in the Canadian context. For the
first time, community allegations that certain racial groups are more vulnerable to police
violence than others has received empirical validation. Now we must try to explain this
vulnerability. We hope, therefore, that this study will be used as a catalyst and justification for
future research. Research that will be help address the issues, debates and questions that still
remain. We will discuss the issue of future research in more detail in the next section (Part F) of
this report. In the meantime, we must first consider the various explanations that might account
for why Black and Aboriginal people in Ontario are so greatly over-represented in police use of
force incidents.
EXPLANATORY MODELS
Below we outline a number of different explanatory models that might account for the
over-representation of Black and Aboriginal people in police use of force cases. Each of these
explanatory models has very different policy implications. In our opinion, the relative validity or

56
strength of any particular model cannot be established with the current data. This must be
determined by future studies. However, we do believe that each model may have validity under
certain circumstances. In other words, the appropriateness of each model may vary from case to
case, situation to situation. Thus, we strongly believe that it is the responsibility of police
supervisors and policy-makers to acknowledge that each of these models may hold some value
and subsequently develop programs, procedures and regulations that will provide an integrated
approach to the issue of police use of force.
The Racial Animus Model
The Racial Animus Model proposes that blatantly racist police officers (often referred to
as bad apples) sometimes deliberately abuse their legal authority and illegitimately use coercive
force against racial minority civilians – often as a an act of racial hatred or animus. In other
words, the overtly racist attitudes and beliefs of a relatively small number of police officers may
directly contribute to the over-representation of racial minority civilians in police use of force
incidents. Removing these officers from policing will dramatically reduce observed racial
disparities.
The Devaluation Model
The Devaluation Model maintains that, in general, racial minority citizens are devalued
by mainstream society. The roots of such devaluation are deeply rooted in our shared history of
colonialism and slavery. As a result, police use of force against racial minorities is less likely to
be questioned or come under State scrutiny. This devaluation ultimately puts minorities at
greater risk of becoming a victim of police violence. In other words, the police may be more
reluctant to use physical force against White people because they feel that the legitimacy of such
actions are more likely to be questioned by the White power structure. Furthermore, White
victims, or their family members, may have the power and resources needed to successfully
challenge the legal authority of the police. On the other hand, the police may be more likely to
use violence against certain racial minorities because they view them as less valued, and less

9 Interestingly, several personal conversations with police officers have suggested that, ifthey had to be involved in a police shooting, they would prefer that the shooting involve a Whitecivilian than a minority civilian. Several officers felt that, because of concerns over racism,incidents involving minority civilians actually come under more public scrutiny than casesinvolving Whites. They argued that the “White community” rarely questions the legitimacy ofpolice actions against White civilians. White people, they claimed, generally feel that the personmust have done something to deserve it. On the other hand, it was felt that racial minoritycommunity organizations, the media and civil rights groups will attempt to make a “race issue”in cases where police force is used against minorities.
57
powerful, members of society. This is particularly true when racial minorities are more likely to
occupy positions of economic or social disadvantage.9
The Racial Stereotype Model
The Racial Stereotype Model proposes that racial stereotypes may lead to a belief among
some police officers that racial minorities, particularly racial minority males, are more dangerous
or violent than other members of society. Such racial stereotypes could develop as a result of
exposure to negative media images of racial minorities or through negative contact with racial
minority criminals in the course of a policing career (especially if such negative contacts are not
balanced with more positive interactions with non-criminals). Negative racial stereotypes, in
turn, may cause some police officers to become more fearful or apprehensive when they
encounter racial minority males on the street. This fear or apprehension, in turn, may increase
the probability that the police will use physical force against racial minority males compared to
other groups. The stereotyping of other groups as “dangerous,” including the mentally ill, may
similarly increase their vulnerability to police use of force.
The Minority Crime Model:
The Minority Crime Model proposes that racial minority males are over-represented in
police use of force statistics because they are actually more involved in crime and violence than
other groups. In other words, racial minorities are more involved in the types of violent or
aggressive behaviors (carrying firearms, threatening police, shooting at police, threatening or

58
shooting at other civilians, etc) that ultimately result in the legitimate use of force by police. In
sum, this model maintains that the over-representation of racial minorities in police use of force
incidents has nothing to do with police racism. The blame must placed on the actions or
behaviours of racial minority citizens themselves.
The Neighbourhood Model
The Neighbourhood Model proposes that people who live in poor, socially disorganized,
high-crime neighbourhoods are at greater risk of police violence than those who live in more
affluent, low-crime communities. The idea is that some police officers may be more wary or
fearful when working in such neighbourhoods and thus quicker to resort to the use of physical
force. To the extent that racial minorities are over-represented in such socially disadvantaged
communities, they will be at significantly greater risk of becoming over-represented in police use
of force statistics.
The Demeanor Model
The Demeanor Model proposes that those who are aggressive, belligerent or demonstrate
blatant disrespect to police authority are more vulnerable to police use of force than those who
are polite and complaint (Macdonald et al. 2003; Terrill 2003). This model is completely
consistent with the results of a recent American study, sponsored by the National Institute of
Justice, which found that, holding other legally-relevant factors constant, the police are much
more likely to use physical force when arresting verbally abusive suspects than compliant, non-
abusive suspects (see Garner and Maxwell 2003). This model therefore anticipates that the over-
representation of racial minorities in police use of force statistics may – at least partially – be
explained by the fact that some racial minority citizens may less likely to show respect to police
than White civilians. In sum, this model assumes that police violence is sometimes used to
punish civilians who do not demonstrate appropriate deference (the Contempt of Cop
phenomena).
59
An Integrated “Fear” Model
The Integrated Fear Model combines elements of the Stereotype, Neighbourhood, Crime
and Demeanor Models. This perspective maintains that the police are most likely to use force
when they fear for their own safety, the safety of fellow officers, or the safety of civilians. The
greater the level of fear, the higher the probability that physical force will be used. For example,
a civilian carrying a gun may legitimately create “fear” among responding police officers.
However, if racial stereotypes exist, this fear may be greater if it is a Black man carrying a gun
rather than a White man. Similarly, fear may be even greater if it is a Black man carrying a gun
in a poor, high-crime neighbourhood and yelling insults at the police. Fear may be higher still if
it is a Black man, displaying signs of mental illness, yelling insults at the police and carrying a
gun in a high crime area. The idea is that police use of force is most likely to occur when a high
number of fear-generating factors – some of them legitimate (violent behaviour, weapons
possession, etc), some of them illegitimate (racial stereotypes, disrespectful civilian demeanor,
etc.) – converge at the same place and time. Use of force incidents, in other words, must be seen
as part of a fear quotient or equation. The higher the fear “score” attributed to a particular
police-civilian encounter, the higher the probability that physical force – particularly deadly
force – will be used.
The Police Subculture Model:
Finally, the Police Subculture Model argues that the police subculture may increase the
likelihood of police violence because it: 1) Reinforces racial stereotypes through the telling of
“war stories” that depict minorities as dangerous; 2) Increases the likelihood that young officers
will want to prove their courage and toughness on the street. This may reduce the probability
that officers will try to diffuse confrontations with citizens through non-violent methods; 3)
Reinforces the belief that the police should respond to citizen hostility, disrespect or
disobedience with violence; and 4) Creates a code of silence among police officers that makes
investigations into the illegitimate use of force difficult if not impossible. This code of silence
serves to protect those police officers who may use force in an illegitimate fashion.

60
PART F:STRATEGIES FOR CONTROLLING POLICE USE OF FORCE
AND REDUCING RACIAL BIAS IN POLICE DECISION-MAKING
There is considerable research evidence to suggest that certain policies and regulations
can reduce police use of force in general – and violence against racial minorities in particular. In
the United States, for example, the rate at which citizens were shot and killed by the police
reached a peak in the early 1970s. Then, after the introduction of various use of force regulations
and programs (discussed below), the rate declined each year until the mid-1990s. Furthermore,
these policies and regulations have been credited with dramatically reducing the over-
representation of African Americans in police shooting statistics over the past thirty years. For
example, in the 1970s, American police shot and killed approximately 8 Black citizens for every
one White person. By 1998 that ratio had been reduced to 4:1 (see Walker 2005; Walker et al
2004). Unfortunately, we could not locate police use of force statistics for Canada that would
allow us to track changes in the frequency of police shooting incidents in the past 30 years. In
fact, besides the data reported as part of the current study, we could not locate any Canadian data
on police shootings whatsoever.
It is important to note that many of the use of force regulations and programs that were
introduced in the 1970s were initially resisted by many rank-in-file police officers, police
managers and police unions. The argument was that, by restricting police use of force, these
policy changes were going to empower criminals, increase crime and social disorder and
ultimately compromise the safety of police officers on the street. Fortunately, none of these fears
materialized. In fact, both the overall crime rate and the number of police officers killed or
injured on the job declined significantly over the same period that police shootings were
decreasing (Geller and Toch 1995; Peak 2006).
In the section below, below we briefly discuss two major program categories that could
reduce the over-representation of racial minorities in police use of force statistics: 1) Programs
designed to reduce or control police use of force; and 2) Programs designed to reduce racial bias
within policing. Many of the strategies outlined below are consistent with the recommendations

10 It is possible that some programs have been subject to “internal” evaluations. Unfortunately, the results of these evaluations have not been made available to outsideresearchers or the general public.
61
presented to the Ipperwash Inquiry by the African Canadian Legal Clinic in August 2006 (see
Appendix C). It should be noted that a number of these programs, in one form or another, have
already been instituted by police services in Ontario. However, unlike our American
counterparts, few (if any) of these initiatives have been systematically evaluated.10
USE OF FORCE STRATEGIES
Over the past three decades, researchers and policy-makers have explored a number of
police use of force regulations that might contribute to a reduction of police violence in general,
and a reduction of violence towards minorities in general. A number of these programs and
initiatives are discussed below.
Administrative Policies and Regulations
The idea that police officers should be subjected to detailed rules or regulations about
when they can use physical force (including firearms) is relatively new to modern policing. By
today’s standards, the lack of controls that characterized public policing up until the 1970s is
quite remarkable. Prior to the 1970s, for example, police were often sent out into the streets after
being trained on how to use firearms, but without any training on the when it was appropriate to
use such physical force. A recent report quoted veteran police officers as remembering the 1970s
as the “wild west” where it was “open season” and a “free for al” (Philadelphia Police Service
1999). As Walker (2005: 42) notes: “Warning shots and shots at fleeing suspects (two actions
now prohibited by all departments) occurred with alarming frequency.”
Many police historians believe that the turning point in use of force regulation occurred
in 1972 with the deadly force policy developed by New York City Police Commissioner Patrick
Murphy. The 1972 NYPD policy included two principles that have formed the basis of police use
of force policies over the past 30 years. First of all, the policy controlled police officer discretion
11 In the United States, a 1985 Supreme Court decision in Tennessee v. Garnerestablished that police shootings of fleeing felons were unconstitutional. This decision furtherlimited police use of force under the 4th Amendment. Nonetheless, as Walker (2005) notes, bythe mid-1980s most major police services had already established deadly force policies that wereeven more detailed and restrictive than the Court’s decision.
62
by clearly indicating when force can be used and when it is inappropriate. The new NYPD
policy, for example, replaced the very permissive “fleeing felon rule” with the restrictive
“defense of life rule.” In other words, police officers could no longer fire their weapon at
suspects who were trying to escape custody – unless their escape presented an immediate threat
to the police or other citizens.11 Secondly, the NYPD policy required that officers complete a
written report after each use of force incident and mandated a review of each report by police
supervisors. An empirical evaluation of the NYPD pilot project produced encouraging results.
James Fyfe (1979) found that the 1972 NYPD rules reduced total firearm discharges by 30%
over each of the next 3 years.
Since 1972, all other major police services in North America have instituted policies that
have prohibited the shooting of fleeing felons. Most departments have also prohibited the firing
of warning shots. Use of force policies have also greatly restricted police shootings at moving
vehicles and the amount of force that can be used during arrest situations. It is generally
accepted that the imposition of strict use of force policies in the United States greatly reduced the
number of civilians killed or injured by the police over the next two decades (see Peak 2006;
Walker 2005; Lersch and Mieczkowski 2005; Rahtz 2003; White 2001; Geller and Toch 1999;
Palmiotto 2001 . It is quite probable that the same downward trend has occurred in Canada –
although we can not locate Canadian time series data that would empirically support that
hypothesis.
Most experts agree that, in order to be effective, use of force policies must: 1) be clearly
written and communicated to police personnel; 2) must clearly outline use of force review
processes; and 3) must clearly define the consequences or penalties for violating departmental
63
policies. However, many experts feel that use of force policies must have the support of the
organizational culture before they can truly be deemed effective. As Rahtz (2003: 91) states:
It is likely that the effectiveness of administrative policy is less related to thepolicy itself than to the organizational context surrounding it. A use of forcepolicy, no matter how elegantly crafted, that is implemented without significantorganizational support is unlikely to have much impact on officer behaviour. Conversely, a sound policy, supported by ongoing training, enforced by effectivesupervision and communicated by a committed management team will not onlycontrol officer use of force but enhance officer safety and tactical practices aswell.
Reporting and Review Requirements
The contemporary standard for most modern police services is that officers are required
to complete a report after any use of force incident. Most often these reports must be subject to a
detailed review by immediate supervisors. .Research suggests that these reporting requirements
may reduce overall use of force incidents – especially those incidents that involve the use of
excessive or illegitimate force. After all, under what circumstances are corrupt or violent
officers most likely to operate? Situations in which they must document and justify their actions
towards the public or under circumstances in which they can act on their own discretion without
justification? Research further suggests that reporting requirements might be particularly
effective when: 1) police supervisors must thoroughly review use of force reports immediately
after incidents takes place; 2) when supervisors use these reports to strictly enforce departmental
polices regarding the use of force; and 3) when supervisors must write their own reports
accounting for the actions of the officers under their command. The idea is that when police
supervisors are held accountable for the actions of those in their command, they are more likely
to closely monitor the behaviour of their officers, enforce departmental rules and ultimately
prevent illegitimate activities (see Walker 2005; Rahtz 2003).
One major problem with reporting systems is that some departments only require the
reporting of “serious” use of force incidents. This can lead to debate over what is a “serious”
64
case and what is non-serious. For example, in the United States, many departments only require
reports for firearms use or the use of chemical sprays. Others only require reports for firearms
use or for incidents in which a civilian has been killed or seriously injured. In other words, when
using such a narrow definition, it is quite possible that many (if not most) cases of police use of
force – including cases of blatant police brutality – go undocumented (Walker 2005).
Recruiting and Screening Procedures
The theory behind this strategy is quite logical. Police who use excessive force are “bad
apples” who never should have been hired as police officers to begin with. Thus, we should try
to improve our police recruiting and selection procedures – including psychological testing – in
order to eliminate poor, potentially violent candidates from the job pool. This position is
supported by research which suggests that when employment standards are relaxed – often
during hiring crises – police corruption and incidents of excessive force can increase. For
example, an internal review of the Rampart incident by the Los Angeles police department found
serious problems in the recruiting of some of the officers involved in the corruption scandal. For
instance, pre-employment investigation of the corrupt officers had found evidence of criminal
involvement, histories of violence and drug use. These recruits were hired despite these
problems. The report notes: “While it is impossible to substantiate completely, it appears that the
application of our hiring standards was compromised when these officers were hired during
periods of accelerated hiring in the late 1980 and early 1990s” (LAPD 2000: 114). The message
is that high quality screening standards must be maintained, especially screening procedures that
can effectively identify mentally ill or violent individuals.
Unfortunately, research on the actual effectiveness of psychological testing and other
screening techniques on police violence have been less optimistic. Following their extensive
review of the research literature, Grant and Grant (1999: 161-162) concluded that:
Efforts to improve the quality of police officer performance by screening outthose recruits who will not make good police officers have generally been
65
unsuccessful. Most of those efforts, following the recommendation of the KernerCommission, have focused on weeding out those recruits that are, one way oranother, psychologically impaired. The failure of these efforts has several causes. One is the inability of the tests to predict behavior, particularly several years inthe future. Another is the difficulty of coming up with measures of good policeperformance. A third is the assumption that good police performance can beexplained by pre-existing personality traits. Although there is very little evidenceon this point, what is true for the prediction of good officer performance is alsotrue for the prediction of the tendency to use abusive force.
Critics of screening strategies argue further that psychological problems, including the
types of problems that sometimes lead to excessive use of force, often develop among police
officers after they have been exposed to the stresses of the policing occupation for several years.
Others maintain that, regardless of pre-existing personality traits, some officers develop
aggressive tendencies after extensive exposure and to the police subculture. These critics argue
that the “bad apples” explanation does not account for systemic issues that might be endemic to
police organizations (Grant and Grant 1999).
In sum, there is no existing set of selection procedures that provides a perfect method for
hiring police officers. Furthermore, written tests, a mainstay of the traditional screening process,
appear to be of questionable validity. That is why many departments are de-emphasizing written
tests in favor of more complex assessment procedures. These new assessment procedures are
designed to measure other personal characteristics including problem solving abilities,
communication skills, interpersonal skills, attitudes towards the use of force, decision-making
abilities, emotional stability and the ability to exercise good judgement under pressure. A
process that combines these new assessment procedures with a rigorous background
investigation, standard psychological testing and a thorough assessment by a mental health
professional, would seem to offer the best odds of success (Grant and Grant 1999; Rahtz 2003).
Unfortunately, to our knowledge, the efficacy of police recruiting and selection strategies in
Ontario have yet to be evaluated.
66
Increasing Diversity
Skolnick and Fyfe (1993) are among those police scholars who strongly believe that
increasing the numbers of women and racial minorities in policing might reduce the illegitimate
police use of force. They summarize their argument in the following way
It is more difficult to treat women and ethnic minorities badly when one is sharinga patrol car with a female or minority officer. A second reason for increasingpolice representativeness is to introduce views and values to the police ranks thatmay very from those characteristics of White males who have long dominatedpolicing. Here, the hope is that the presumably kinder and gentler policing stylesof women and non-White officers will rub off on the entire organization,producing a less aggressive police agency.
With respect to gender, a number of studies have indicated that female officers are less
likely to resort to physical force than their male counterparts, are more likely to use verbal
negotiation skills to diffuse potentially violent citizen encounters and are less likely to generate
citizen complaints (see Lersch and Mieczkowski 2005; Joseph et al. 2003; Lersch 1996; Hale and
Wyland 1997; Garner et al. 1995; McDowell 1992). On the other hand, Terrill (2001), in his
large-scale observational study of police use of force, found no gender difference in the
willingness to use force. Nonetheless, most academics and police administrators believe that
increasing the representation of female officers could reduce overall rates of police violence.
Research on the impact of racial diversity is less clear. A number of American studies,
for example, have found that Black officers who work in large urban areas are more likely to be
involved in police shootings than their White counterparts. This result, however, may be
attributed to the fact that Black officers are much more likely to be assigned to – or actually
reside in – high crime neighbourhoods. Other studies have found that although Black officers are
more likely to be involved in “legitimate” use of force incidents, White officers are actually more
likely to be involved in cases that involve excessive force (see Wortman 1995). Other studies
have found no relationship at all between officer race and forceful behaviour (Terrill 2001).
Interestingly, an Ohio survey of officer attitudes towards the use of force found that White
officers were significantly more likely to view high levels of force as both necessary and

67
appropriate than Black or Hispanic officers (Holmes 1997). Unfortunately, we could locate no
Canadian research that has investigated this issue. The variability in research results has caused
some to doubt whether diversification – in and of itself – will reduce police violence. As Rahtz
(2003: 93) notes: “Diversity in American police agencies is a business necessity and is essential
to the police mission. There may be many benefits that accompany racial and gender diversity in
policing, but the claim that diversity will have a significant impact on the incidence of police use
of force is closer to wishful thinking than proven fact.”
Training
There is wide agreement among both police administrators and criminologists that high
quality training is a key element in minimizing police use of force. Indeed, the failure to provide
proper training can have severe consequences for both the community and the police. The
literature on police training is massive and far too extensive to cover in this report. However,
there are a number of common themes or principles that seem to emerge when discussing
appropriate training procedures (see the excellent review in Fyfe 1995). These principles are
briefly outlined below:
1) Officers need to develop technical proficiency in the use and maintenanceof firearms and other weaponry (batons, tasers, pepper spray, etc.). Policeshould also develop proficiency in the use of physical restraints and otheruse of force techniques that do not involve weapons.
2) Officers need to be taught the “use of force continuum.” They need to be taughtverbal communication skills that will help them diffuse confrontations withcivilians without resorting to violence. If verbal communication skills do notwork, officers should be taught to use non-lethal tactics before proceeding to theuse of firearms or other weapons. Lethal force should only be used as a lastresort.
3) Officers need to be taught to tolerate verbal abuse and disrespect from civilianswithout resorting to physical force. Officers need to learn how to suppressaggressive impulses in the face of insults or verbal challenges.

68
4) Officers need to be taught to recognize and deal with fears and or anxietiesthat may contribute to their use of force decisions. Officers need to learnhow to distinguish between “real” threats and irrational fears.
4) The goals of training should, however, go well beyond the transmission ofskills and techniques. Police training should also have an attitudinalcomponent: it should socialize officers into their department and teachthem their employer’s values, ethics and expectations. In short, policeorganizations vary in their tolerance of the use of force, and, to the extentthat formal training reflects these variations, it will affect officers’decisions to engage in force.
5) Use of force training needs to be realistic and scenario-based. Policeorganizations need to first identify the predictable crises that characterize theircommunities. They should then develop policies and tactics to help officersresolve these types of crises with as little violence as possible. After they havebeen fully developed, policies and tactics need to be carefully communicated toofficers during training sessions. Specific tactics need to be perfected throughrepetition under realistic conditions.
6) Police organizations need to carefully review officers’ actions during trainingregimes to determine whether they are able to behave in accord to departmentalpolicies and standards.
7) Training should be used as an opportunity to “de-select” candidates who areunable to meet departmental standards with respect to the use of force. It is betterto remove incompetent candidates before they enter the field than deal with themafter problems have emerged on the job.
8) Police organizations need to take corrective action when required. They mustdiscipline officers who have unreasonably deviated from policy and training. They also need to “non-punitively” guide and retrain officers whose deviationsfrom departmental standards are not wilful.
9) Police organizations need to constantly evaluate training procedures and modifypolicy and training strategies when they have proven to be inadequate orinappropriate.
10) Training should continue throughout policing careers. Older officers need to betrained in new policy developments and use of force tactics. Officers need toperiodically engage in firearms re-certification.
69
Early Warning Systems
The premise of early warning systems (EWSs) is that a small number of officers are
responsible for a large number of use of force incidents. For example, the Christopher
Commission in Los Angeles found that 5% of LAPD officers were responsible for over 30% of
reported use of force incidents (Walker et al. 2001). In theory, by focusing a variety of
interventions on a small number of high risk officers, a police services use of force rate can be
reduced. It is unclear how many police organizations in Canada have implemented early
warning systems. To our knowledge, information on Canadian early warning systems, and
details about how they work, have yet to be released to the public. However, in the United
States, by 1999, approximately 40% of all police agencies either had an early warning system in
place or were planning to implement one (Walker et al. 2001). Indeed, growth in this area is
likely to continue, especially since the 2001 Commission on Law Enforcement Accreditation
(CALEA) mandated early warning systems for all police agencies with over 300 sworn officers
(Walker et al. 2001).
The key issue posed by early warning systems is the difficulty of identifying what “risk
factors” to include in the system, how to weight these factors, determining the point at which an
individual officer should be “flagged” or “targetted” for intervention and developing options for
those officers who are identified. CALEA lists several potential factors for use in early warning
systems. These variables include performance evaluations, number of citizen complaints, the
number and nature of disciplinary actions, the number of use of force incidents, supervisory
reports, internal investigations reports, traffic accidents and workman compensation claims
(Rahtz 2003). Quantifying these factors into a numerical score is a difficult process. For
example, imagine two police officers who work for the same organization. Officer A works the
night shift in an inner-city, high crime neighbourhood. Over the course of a year, she generates
250 arrests, 5 use of force reports and 7 citizen complaints. By contrast, Officer B works the day
shift in a low-crime, suburban neighbourhood. Over the course of the year he produces 70

70
arrests, 2 use of force reports and 3 citizen complaints. Which of these officers (if any) should be
flagged by an early warning system? How should police services make such a determination.
After an officer has been identified by an early warning system, an individualized
intervention could be implemented by police management. Remedial actions might include
additional training, reassignment, counselling for personal problems, stress reduction programs
or heightened supervision. Importantly, evaluation research indicates that early warning systems
may be working. In general, public complaints against the police and police use of force
incidents have declined significantly in American jurisdictions that have implemented such
programs. Furthermore, officers who are flagged by early warning systems seem to respond to
targetted interventions. For example, in New Orleans and Minneapolis, citizen complaints
against participating officers dropped over 60% in the year after the officers completed the
program. In Miami-Dade, the percentage of officers with zero use of force complaints went from
4% to 50% after program intervention (see reviews in Walker 2005; Rahtz 2003). Walker and
his colleagues (2001: 3) summarize the evaluation research to date by stating that: “Early
warning systems appear to have a dramatic effect on reducing citizen complaints and other
indicators of problematic police performance among those officers subject to intervention.”
Civilian Oversight
Civilian review agencies, including public complaints commissions, represent another
strategy for controlling police misconduct and reducing the illegitimate use of force. Civilian
agencies are thought to have two major advantages: 1) Civilian review agencies are potentially
more thorough and impartial when investigating and adjudicating allegations of police
misconduct; and 2) Investigations conducted by and civilian review agencies are perceived to be
more valid or legitimate than investigations conducted by the police themselves. Research
indicates that many citizens believe that the police are simply incapable of effectively policing
themselves. Thus, the implementation of civilian review procedures could potentially increase
public confidence in the criminal justice system. Unfortunately, civilian review initiatives are
71
often resisted by the police and police unions. Police officers frequently argue that civilians
simply cannot understand the complexity of the policing profession and the stresses and
challenges that officers must face on the street. Police officers often feel that the only people
capable of fairly judging their activities are those who have also worn the badge. Other critics
have argued that civilian review serves to undermine the authority of police supervisors.
Research suggests that civilian review agencies in Canada vary dramatically with respect
to their mandate and powers. Many civilian agencies in this country appear to serve little more
than a symbolic function. For example, a number of agencies can only review how the police
have investigated and adjudicated citizen complaints and make recommendations with respect to
disciplinary outcomes. They have absolutely no power or resources to conduct their own
investigations and their disciplinary recommendations do not have to be honoured by police
managers (see Wortley 2003).
An exception to this general rule is Ontario’s Special Investigation’s Unit (discussed
extensively above). The SIU does conduct its own investigations and the SIU Director does have
the authority to recommend criminal charges against police officers who have used physical
force in an inappropriate manner. Unfortunately, very little research has evaluated the impact of
the SIU or other civilian review agencies in North America (see Wortley 2003). Have such
agencies reduced police use of force and increased public confidence in the criminal justice
system? We tried to examine this question by gathering information on the number of civilians
killed by police in Ontario before and after the implementation of the SIU in 1990.
Unfortunately, police services in this province do not release statistics on the numbers of
civilians killed or injured by police activity. In other words, although annual police reports
typically provide the public with such mundane information as the cost of maintaining patrol
vehicles, we were unable to obtain data on police shootings for the period before the SIU was
established. Nor could we locate data on public perceptions of the SIU and other civilian review
agencies.
72
In sum, although people generally view the establishment of civilian review agencies,
including the SIU, as a positive development, very little is known about their actual impact or
effectiveness (see Wortley 2003; Walker 2005; Rahtz 2003; Palmiotta 2001; Peak 2006). This
gap in our knowledge, however, has not prevented citizens from making recommendations. For
example, critics have argued that the operation of the SIU could be improved by: 1) increasing
the number of SIU investigators who come from non-police backgrounds; 2) increasing the
number of female and racial minority investigators on the SIU; 3) expanding the mandate of the
SIU to include less serious injuries (i.e., give the SIU the power to investigate allegations of
police violence that do not result in death or serious physical injury); and 4) changing the law
and/or policing regulations in order to compel subject officers into making a statements to SIU
investigators (see Appendix C for the full recommendations of the African Canadian Legal
Clinic). The last recommendation is very controversial. Many feel that police officers should
have the same civil and due process rights as all other citizens. In other words, during official
investigations, they have the right to remain silent and do not have to make statements that might
incriminate them. Others charge that, because police officers have been given the legal authority
by the State to use coercive force against fellow citizens, they should have to forfeit certain rights
when acting in an official capacity. Clearly, this debate is far from being solved.
In conclusion, the above section has outlined a number of strategies that might help
control or reduce police use of force. The list of strategies discussed in this report, however, is
far from exhaustive. Other strategies for reducing police violence that have been proposed by
police scholars include: 1) community policing initiatives; 2) police residency requirements; 3)
civil liability; 4) strategies for dealing with mentally ill or suicidal civilians (Engel and Silver
2001; Homant et al. 2000); 5) programs for reducing officer stress; and 6) efforts to increase the
strength of police internal affairs departments. In the next section we turn away from strategies
for controlling police use of force and towards strategies for reducing racial bias in policing. It is
thought that such strategies can further reduce observed racial disparities in police use of force
statistics.

73
ANTI-RACISM STRATEGIES
Racism is an extremely complex social issue. As such, policies to reduce racism in
policing – including racial profiling and the excessive use of force against racial minority
civilians – should be equally complex and multi-faceted. Below, we have identified a number of
strategies that might reduce racial bias in general, and bias with respect to the police use of force
in particular. However, it must be recognized that any effort to reduce racism in general may
help reduce racial disparities in use of force statistics.
Criminal Justice Screening Processes
As discussed above, it is possible that some incidents of police racial bias may be
motivated by overt racism, prejudice or hatred. It is therefore imperative that criminal justice
and security organizations screen individual recruits for prejudicial attitudes and racial
animosity. Currently, the police and other organizations screen recruits for a number of
important characteristics – including educational background, criminal record, family
background and various personality attributes. In order to reduce racism, therefore, it is only
logical to develop screening techniques that will help identify racist individuals before they
become part of criminal justice or security organizations. Such efforts may weed out some of the
racist “bad apples” and thus dramatically reduce racial bias in the criminal justice system –
including the illegitimate use of physical force.
Along with screening recruits for possible racist predispositions, police and other security
organizations could also try to actively recruit individuals who demonstrate high cultural capital
with respect to issues of race, ethnicity and religion. Indeed, individuals who can demonstrate a
previous history of positive contact with various minority groups, an understanding of cultural
differences and a sensitivity to issues of race and racism, should be given an advantage in the
recruitment process. In sum, recruitment standards need to be changed in order to: 1) eliminate
74
individuals with racist tendencies; and 2) encourage applicants who can demonstrate a sensitivity
to diversity issues.
Minority Recruitment
Police organizations should be encouraged (if not mandated) to increase their
racial/ethnic minority recruits. Research suggests that, in Canada, the vast majority of police
officers and other security personnel are White males. This is in stark contrast to a society that is
becoming more and more ethnically diverse. Ensuring that criminal justice organizations reflect
the racial and ethnic diversity of the community may reduce the level of racial bias in the system
by directly reducing racist attitudes, reducing racial stereotypes and increasing the level of
understanding between different racial groups. Importantly, increasing the number or racial
minority officers may also reduce community perceptions that the system is racially biassed.
Finally, increasing the number of racial minority personnel may serve an important educative
function. In other words, minority colleagues may reduce racial stereotyping among Whites by
providing positive contacts with the racial minority community. Such positive contacts may help
to balance or offset the negative perceptions of minority communities that often develop through
frequent exposure to minority criminals and other security risks.
Anti-Racism Training
The idea that “race relations” or “cultural sensitivity” training should be part of any anti-
racism policy agenda is not new. Indeed, race-relations training has been an integral part of
criminal justice training in Canada for at least the past two decades. Unfortunately, very little of
this training has been discussed publically or been subject to systematic, objective evaluation
(see Stenning 2003). Thus, it is very difficult to determine which race relations or anti-racism
programs are effective and which programs are not. Thus, any new anti-racism initiatives should
include an inventory of current race relations training programs along with a strong evaluation
component (see discussion below).
75
With respect to racial profiling and use of force, race relations training must first provide
recruits with: 1) a firm definition of the phenomena; 2) practical advice on how to distinguish
racial profiling practices from legitimate policing activities; and 3) insight into how racial
profiling activities can negatively impact racial minority communities and contribute to their
over-representation in police use of force statistics.
Race relations training also needs to provide recruits with a balanced view of racial
minority communities – a view that can offset the often negative stereotypes of minority
communities that can develop as a result of police and security work. Sociological research
indicates that most people spend their personal time with people from similar racial and/or ethnic
backgrounds. Thus, outside of the job, police officers and other security agents are unlikely to
come into intimate contact with people from other racial or ethnic backgrounds. However, the
nature of police and security work often brings criminal justice professionals into contact with
the worst elements of minority communities. After all, police officers are often asked to respond
to criminal activity, public disturbances and other incidents of social disorder. In other words, the
policing profession often involves frequent exposure to the ugliest aspects of human existence.
Thus, if the only exposure police officers have to racial and ethic communities is through their
job, it is likely that they may develop strong negative stereotypes and fears about the members of
these groups. These stereotypes can ultimately lead to racial profiling and increase the likelihood
that the police will result to use of force. Effective race relations training, therefore, needs to
communicate to criminal justice personnel that the racial minority citizens they frequently
encounter as part of the job (i.e., criminals) are not at all representative of the racial minority
communities they serve. Such training may help criminal justice agents understand that they
must approach members of racial minority communities with sensitivity and respect and not
make assumptions about their criminality.
Training on Citizen Encounters
76
Over the past decade we have literally conducted thousands of interviews with racial
minority citizens on the topic of racial profiling and discrimination within the criminal justice
system. What has repeatedly struck me, is that minority citizens often complain more about how
they were treated during police encounters (or encounters with Customs officials) than they do
about the frequency of police contact. Innocent, law-abiding minority citizens frequently
complain that they were treated rudely or with “disrespect” by the police, that they were made to
feel like criminals, that the police refused to explain to them why they were stopped and/or
detained and that, at the end of the encounter, the police refused to apologize for the
inconvenience, fear and discomfort that they had caused. One Black youth we interviewed was
particularly effective at capturing the frustration and hopelessness many minorities feel after
being interrogated by the police. He had been working late as a dishwasher at a local restaurant.
He was walking home from this job when he was stopped by the police. According to this
subject, the police officers in question detained him, asked for identification and searched his
gym bag and clothing. When they found nothing, the officers quickly got back into their patrol
car and sped off. According to this youth, the officers never explained the reason for the stop or
apologized for their actions. The subject was left frightened, bewildered and angry. As he
states:
Maybe they was just doing their jobs. Maybe I fit the description of some crimethat just went down. But they shoulda told me why they scared the shit out of me.They shoulda told me what was up. But what bugged me most was I could tellthat they really wanted to find something on me. Like they was real disappointedwhen I turned up clean. It made me feel dirty. Like maybe I had done somethinganyway. It was like they was saying we know you are a criminal, we just didn’tget you this time. We’ll be back. Man I was pissed, but scared at the same time. I don’t like the feeling that the police wished I was a criminal.
Police officers frequently respond to such allegations by stating that they are not in the
public relations business, that they do not want to give away valuable information to citizens
during criminal investigations, and that they do not want to compromise their legal authority by
apologizing for their actions. In my opinion, “customer service” training is required to reverse

77
this trend. Officers need to be taught how innocent citizens – of all racial backgrounds – feel
when they have been stopped, questioned and searched by the police or other security agents.
They need to be taught that it is appropriate to explain the reason for the stop. Officers also need
to be taught that – although they are just doing their job – it is okay to apologize for any
inconvenience or discomfort that they have caused. Such actions serve to restore the dignity of
citizens that have been caught up in police investigations and erode the perception that the justice
system is racially motivated. Officers need to be taught that being polite to law-abiding citizens
does not compromise their authority – it only enhances their reputation in the community. Such
skills may also help police officers deal with minority civilians who are displaying a poor or
disrespectful demeanor. This, as discussed above, could help reduce the likelihood of police use
of force.
Anti-Racism Regulations
Any policy designed to reduce racial profiling and racism within policing should demand
that all Police Services develop explicit regulations against racist behaviours. Such regulations
should provide a clear definition of racism, explain how racial bias will be monitored within the
organization and describe the consequences for engaging in racial profiling and other racially
biassed activities. We should stress that the disciplinary consequences for engaging in racial
profiling or other forms of racial bias need to be made explicit and that these regulations need to
be strictly enforced. Regulation without teeth will prove useless. We believe that, in addition to
reducing racial profiling among criminal justice personnel, such regulations will be of significant
symbolic value. The implementation of such regulations will help reduce perceptions of racial
bias within the criminal justice system and improve the relationship between the police and
minority communities.
Data Collection
78
In my opinion, police services should be mandated to collect data on the citizens they
decide to stop and/or search, the citizens the arrest and the citizens upon which they use physical
force. At the very least, data collection efforts should specify the racial background, gender and
age of the people they deal with, along with their home address, the location of the incident, the
reason for the encounter and an explanation of how the situation was resolved (i.e., did the
encounter result in an arrest, a ticket, a warning, the use of force, etc.). Data on serious police
use of force incidents should also be systematically collected by the Special Investigations Unit
(see Appendix B for an example of the types of variables that should be recorded for each use of
force incident).
In my opinion, there are three important arguments in favour of the collection of race-
based data. First of all, from a social science perspective, such information would be valuable
with respect to determining whether racial bias exists within policing or not. Secondly, the
collection and dissemination of such data would demonstrate to the public that the police are
transparent in their operations – that they have nothing to hide. Ultimately, such transparency
could help improve relationships with minority communities and increase confidence in the
criminal justice system. Finally, the official monitoring of police activities may actually reduce
or eliminate racial profiling and racial bias in the police use of physical force. If police officers
know that they must record and justify their decisions – they may be less likely to engage in
racially-biassed “fishing expeditions.” For example, one of the most common racial profiling
complaints involve Black men who claim that they were stopped and investigated by the police
simply because they were driving a nice car. These men often complain that they were targeted
because the police felt that their car might be stolen or that they fit the profile of a drug dealer. It
could be argued, however, that these types of stops would be largely eliminated if officers had to
officially record the encounter and justify their reasons for making the stop. In other words,
rather than an exercise to determine the mere existence or non-existence of racial profiling, data
collection should be seen as an effective monitoring strategy that may reduce racial profiling in
and of itself. We should stress that in order for monitoring to be effective, data collection needs

79
to be on-going. Special studies that collect on police activities over a limited time period are of
dubious value. For example, it is possible that some criminal justice agents may refrain from
stopping and searching racial minority citizens during the identified study period, but return to
normal racial profiling practices after the study has been completed. Without longitudinal
designs, the long term impact of data collection efforts will be impossible to determine.
Arguments against the official collection of race-criminal justice data range from
methodological difficulties (including issues related to the measurement of race and the
establishment of meaningful baseline population estimates) and how race-based research might
impact police effectiveness. For example, opponents of data collection maintain that, if police
officers are required to record the race of people that they stop and question, many officers will
refrain from initiating contact with minority citizens out of fear of being labelled a racist.
Indeed, the Toronto Police Union announced that they would encourage their officers to adopt a
“no contact, no complaint” philosophy if required to collect data on stop and search encounters.
Critics argue, therefore, that data collection initiatives would permit minority criminals to roam
free and that crime rates would ultimately soar. Interestingly, there is no evidence to suggest that
crime rates have increased or that police productivity has diminished in American or British
jurisdictions that have adopted data collection procedures. Nonetheless, we do agree that such
concerns should be a focus of future research.
Accountability Measures
As discussed above, we believe that any anti-racism policy is doomed to failure unless
specific accountability mechanisms are put into place. These accountability measures might
include: 1) data collection; 2) specific disciplinary consequences for criminal justice personnel
found guilty of racial bias; and 3) a public complaints system that will encourage and empower
citizens to report racial bias in police encounters. We would also encourage a policy that would
hold supervisors accountable for the racially biassed behaviour of those under their supervision.

80
Such efforts would ensure that supervisors take racial profiling and anti-racism regulations
seriously and subsequently increase the monitoring of criminal justice personnel in the field.
The Need for Evaluation
Finally, we strongly believe that any effective anti-racism policy must include a strong
evaluation component. Without objective evaluation research, how are we to determine whether
specific policy initiatives are effective or not? Research designed to evaluate anti-profiling or
anti-racism policies might include: 1) studies that examine police attitudes towards racial
minorities before and after race relations training; 2) studies that examine official data on racial
differences in stop and search activities and police use of force; 3) data on public complaints
about racial profiling and police brutality; 4) general population surveys that measure public
perceptions of discrimination within the criminal justice system and minority attitudes towards
the police and other criminal justice agents; and 5) surveys of police officers, Customs officers
and other security agents that examine how race-related issues are impacting job performance
and job satisfaction. We strongly believe that without a strong evaluation effort, policies and
programs designed to eliminate racism within the criminal justice system are reduced to nothing
more than public relations endeavours. Unfortunately, racial minority groups can easily identify
“window dressing” when they see it. Without collecting information on police stop and search
activities how can we really determine whether efforts to reduce racial profiling are working?
Without collecting data on civilians killed or injured by the police, how can we really determine
the effectiveness of programs designed to reduce racial bias in the police use of force? Clearly
the time to face these issues in a transparent and honest manner has arrived.

81
REFERENCES
Abraham, J., J. Field, R. Harding and S. Skura. 1981. “Police Use of Lethal Force: A TorontoPerspective.” Osgoode Hall Law Journal 19(2): 200-36.
Alpert, G. P. 1989. “Police Use of Deadly Force: The Miami Experience.” In R. G. Dunham, &G. P. Alpert (Eds.), Critical Issues In Policing. Prospect Heights: Waveland Press.
Andrews, A. 1992. Review of Race Relations Practices of the Metropolitan Toronto PoliceService. Toronto: Metropolitan Toronto Audit Department.
Binder, A. & P. Scharf. 1982. “Deadly Force in Law Enforcement.” Crime and Delinquency 28(7): 1-23.
Bowling, Ben, and Phillips, Coretta. 2002. Racism, Crime and Justice. Britain: PearsonEducation Ltd.
Bureau of Justice Statistics. 1999. Police Use of Force, 1976-98. Washington, D.C.: U.S.Governmental Printing Office.
Commission on Systemic Racism in the Ontario Criminal Justice System. 1996. Final Report ofthe Commission on Systemic Racism in the Ontario Criminal Justice System. Toronto: Queen’sPrinter.
Davis, Peter. 1994. “Rodney King and the Recriminalization of Police Brutality in America:Direct and Judicial Access to the Grand Jury as Remedies for Victims of Police Brutality Whenthe Prosecution Declines to Prosecute.” Maryland Law Review 53: 281-83.
Engel, R.S. and E. Silver. 2001. “Policing Mentally Disordered Suspects: A Re-examination ofthe Criminalization Hyphothesis.” Criminology 39: 225-52.
Forcese, Dennis. 1999. Policing Canadian Society: 2nd Edition. Toronto: Prentice-Hall.
Fyfe, James. 1995. “Training to Reduce Police-Civilian Violence.” In Geller, William and HansToch (Eds). And Justice for All: Understanding and Controlling Police Abuse of Force. Washington, DC: Police Executive Research Forum: 163-176.
Fyfe, James. 1988. “Police Use of Deadly Force: Research and Reform.” Justice Quarterly 5:165-205.
Fyfe, James. 1982. “Blind Justice: Police shootings in Memphis.” Journal of Criminal Law andCriminology 73(2): 707-22.

82
Fyfe, James. 1979. Administrative Interventions on Police Shooting Discretion.” Journal ofCriminal Justice 7: 309-23.
Gabbidon, Shaun and Helen Taylor Greene. 2005. Race and Crime. Thousand Oaks, CA: Sage.
Garner, J. and C. Maxwell. 2003. “Study Links Use of Force to Suspect’s Back Talk.” LawEnforcement News. January: 15-31.
Garner, J., Schade, T., Hepburn, J., & Buchanan, J. 1995. “Measuring The Continuum of ForceUsed By and Against The Police.” Criminal Justice Review 20, 146– 168.
Geller, William and Hans Toch. 1995. And Justice for All: Understanding and ControllingPolice Abuse of Force. Washington, DC: Police Executive Research Forum.
Goldkamp, John. 1976. “Minorities as Victims of Police Shootings: Interpretations of RacialDisproportionality and Police Use of Deadly Force.” Justice System Journal 2: 169-83.
Hale, D.C. and S. Wyland. 1997. “Dragons and Dinosaurs: The Plight of Patrol Women.” In P.Comwell and R. Dunham (Eds). Crime and Justice in America. Upper Saddle River: Prentice-Hall: 124-134.
Henry, Frances, Carol Tator, and Todd Mettis. 2006. The Colour of Democracy: Racism inCanadian Society. Toronto: Nelson Thomson Publishing.
Independent Commission on the Los Angeles Police Department (Christopher Commission).(1991). Report of the Independent Commission on the Los Angeles Police Department. LosAngeles: Independent Commission of the Los Angeles Police Department.
Jacobs, David and Robert O’Brien. 1998. “The Determinants of Deadly Force: A StructuralAnalysis of Police Violence.” American Journal of Sociology 103 (4): 837-862.
Joseph, Janice, Dorothy Taylor and Roslyn Muraskin. 2003. With Justice for All: Minoritiesand Women in Criminal Justice. Upper Saddle River: Prentice-Hall..
Kennedy, Randall. 1997. Race, Crime and the Law. New York: Pantheon Books.
Lersch, K.M. and T. Mieczkowski. 2005. “Violent Police Behaviour: Past, Present, and FutureDirections.” Aggression and Violent Behaviour 10: 552-568.
Lersch, K.M and Mieczkowski. 1996. “Who Are The Problem Prone Officers? An Analysis ofCitizen Complaints.” American Journal of Police 15: 23-44.
83
Lewis, C. 1992. Report of the Task Force on Race Relations and Policing. Toronto: Queen’sPrinter.
Locke, Hubert. 1995. “The Color of Law and the Issue of Color: Race and the Abuse of PolicePower.” In Geller, William and Hans Toch (Eds). And Justice for All: Understanding andControlling Police Abuse of Force. Washington, DC: Police Executive Research Forum: 133-148.
Mann, C. R. 1993. Unequal Justice: A Question of Color. Bloomington: Indiana UniversityPress.
McDowell, J. 1992. “Are Women Better Cops.” Time 139 (7): 70-72.
Ogletree, Charles, M. Prosser, Abbe Smith and William Talley. 1995. Beyond the Rodney KingStory: An Investigation of Police Misconduct in Minority Communities. 1995. Boston:Northeastern University Press.
Ontario Human Rights Commission. 2005. Policy and Guidelines on Racism and RacialDiscrimination. Toronto: Ontario Human Rights Commission.
Palmiotto, M. 2001. Police Misconduct: Reader for the 21st Century. Upper Saddle River:Prentice-Hall.
Peak, K. 2006. Policing America: Methods, Issues, Challenges. Upper Saddle river: Prentice-Hall.
Pedicelli, Gabriella. 1998. When Police Kill: Police Use of Force in Montreal and Toronto. Montreal: Vehicule Press.
Rahtz, H. 2003. Understanding Police Use of Force. Monsey, NY: Criminal Justice Press.
Rikaheim, E. and S.M. Chermack. 1993. “Causes of Police Behaviour Revisited.” Journal ofCriminal Justice 21: 353-82.
Sherman, Lawrence W., and Mark Blumberg. (1981). “Higher Education and Police Use ofDeadly Force.” Journal of Criminal Justice 9: 317-31.
Skolnick, J. H. 2002. “Corruption and the Blue Code of Silence.” Police Practice and Research3(1): 7-19.
Skolnick, J. H., & Fyfe, J. J. 1993. Above the Law: Police and the excessive use of force. NewYork: Free Press.
84
Stenning, P. 2003. “Policing the Cultural Kaleidoscope: Recent Canadian Experience”. Police &Society 7:21-87.
Stenning, Phillip. 1994. Police Use of Force and Violence Against Members of Visible MinorityGroups in Canada. Ottawa: Centre for Police Race Relations.
Tanovich, David. 2006. The Colour of Justice: Policing Race in Canada. Toronto: Irwin Law.
Tator, Carol and Frances Henry. 2006. Racial Profiling in Canada: Challenging the Myth of aFew Bad Apples. Toronto: University of Toronto Press.
Terrill, William. 2000. “Police Use of Force: A Transactional Approach.” Justice Quarterly 22(1): 107-38.
Terrill, William. 2003. “Police Use of Force and Suspect Resistance: The Micro-Process of thePolice-Suspect Encounter.” Police Quarterly 6: 51-83.
Terrill, Willianm. 2001. Police Coercion: The Application of the Force Continuum. New York:LFB Scholarly Publishing.
Terrill, W., Alpert, G.P., Dunham, R.D., and Smith, M.R. 2003. “A Management ToolEvaluation Police Use of Force: An Application of the Force Factor.” Police Quarterly 5: 150-71.
Terrill, W. and S. Mastrofski. 2002. “Situational and Officer Based Determinants of PoliceCoercion.” Justice Quarterly 19: 215-48.
Walker, Samuel. 2005. The New World of Police Accountability. Thousand Oaks, CA: Sage.
Walker, Samuel, Cassia Spohn and Miriam Delone. 2004. The Color of Justice: Race, Ethnicityand Crime in America. Toronto: Wadsworth.
Walker, Samuel, G. Alpert and D. Kenney. 2001. Early Warning Systems: Responding to theProblem Police Officer. Washington, DC: U.S. National Institute of Justice.
White, Michael. 2001. “Controlling Police Decisions to Use Deadly Force: Re-examining theImportance of Administrative Policy. Crime and Delinquency 47: 131-151.
Worden, A. P. 1993. “The Attitudes of Women and Men In Policing: Testing Conventional andContemporary Wisdom.” Criminology 31: 203– 237.
Wortley, Scot. 2004. “Hidden Intersections: Research on Race, Crime and Criminal Justice inCanada” Canadian Ethnic Studies Journal 35 (3): 99-117.

85
Wortley, Scot. 2003. The Illusion of Accountability: Civilian Governance of the Police in aMulti-cultural Society. Ottawa: Ministry of Citizenship and Immigration – Heritage Canada.
Wortley, Scot. 1999. “A Northern Taboo: Research on race, crime, and criminal justice inCanada”. Canadian Journal of Criminology 41(2): 261-274.
Wortley, Scot. 1996. “Justice for All? Race and Perceptions of Bias in the OntarioCriminal Justice System -- A Toronto Survey”. Canadian Journal of Criminology 38: 439-467.
Wortley, Scot and Lysandra Marshall. 2005. Police Stop Search Activities in Kingston, Ontario. Kingston: Kingston Police Services Board.
Wortley, Scot and Julian Tanner. 2005. “Inflammatory Rhetoric? Baseless Accusations?Responding to Gabor’s Critique of Racial Profiling Research in Canada.” Canadian Journal ofCriminology and Criminal Justice 47 (3): 581-609.
Wortley, Scot and Julian Tanner. 2003. “Data, Denials and Confusion: The Racial ProfilingDebate in Toronto.” Canadian Journal of Criminology and Criminal Justice 45 (3): 367-389.
Wortley, Scot and Andrea McCalla. 2003. “The Debate Continues: Evidence of Bias AgainstBlack People in the Canadian Criminal Justice System. Pp. 212-228 in Julian Roberts (Ed.). Criminal Justice in Canada: 2nd Edition. Toronto: Harcourt-Brace.
Wortley, Scot, Macmillan Ross, and Hagan, John. 1997. “Just Des(s)erts? The RacialPolarization of Perceptions of Criminal Injustice”. Law and Society Review 31: 637-676.

86
APPENDIX A:
TABLES
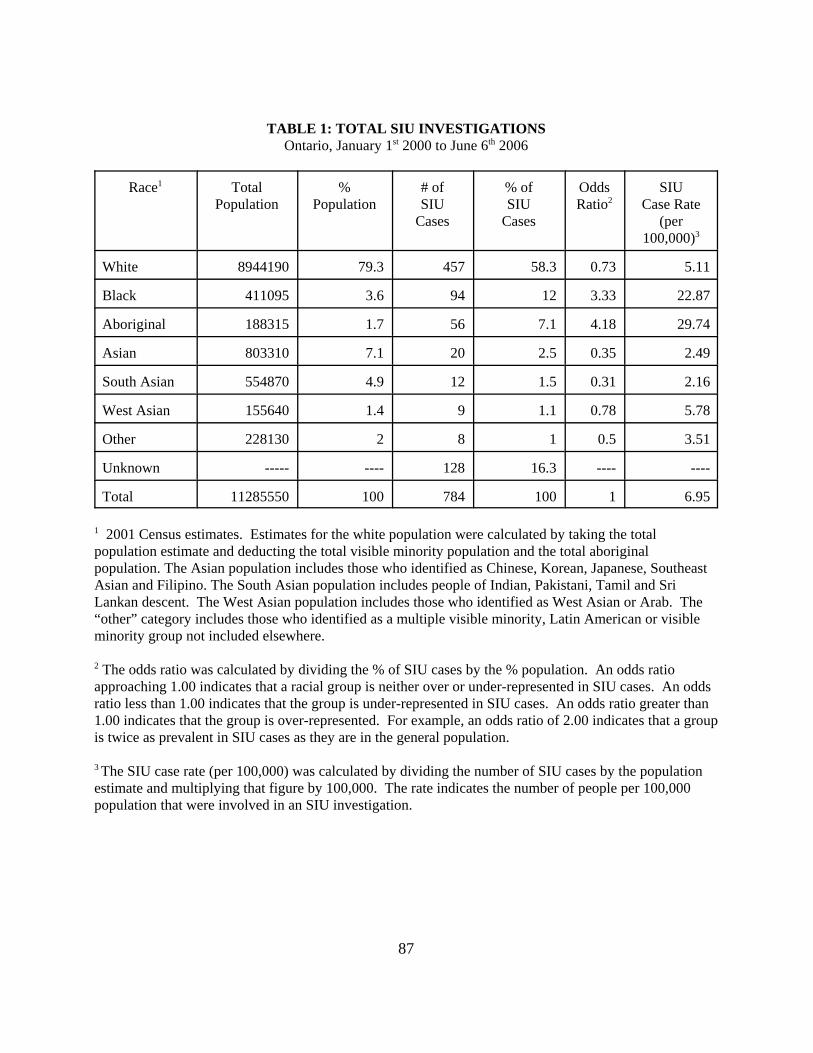
87
TABLE 1: TOTAL SIU INVESTIGATIONSOntario, January 1st 2000 to June 6th 2006
Race1 TotalPopulation
%Population
# ofSIU
Cases
% ofSIU
Cases
OddsRatio2
SIUCase Rate
(per100,000)3
White 8944190 79.3 457 58.3 0.73 5.11
Black 411095 3.6 94 12 3.33 22.87
Aboriginal 188315 1.7 56 7.1 4.18 29.74
Asian 803310 7.1 20 2.5 0.35 2.49
South Asian 554870 4.9 12 1.5 0.31 2.16
West Asian 155640 1.4 9 1.1 0.78 5.78
Other 228130 2 8 1 0.5 3.51
Unknown ----- ---- 128 16.3 ---- ----
Total 11285550 100 784 100 1 6.95
1 2001 Census estimates. Estimates for the white population were calculated by taking the totalpopulation estimate and deducting the total visible minority population and the total aboriginalpopulation. The Asian population includes those who identified as Chinese, Korean, Japanese, SoutheastAsian and Filipino. The South Asian population includes people of Indian, Pakistani, Tamil and SriLankan descent. The West Asian population includes those who identified as West Asian or Arab. The“other” category includes those who identified as a multiple visible minority, Latin American or visibleminority group not included elsewhere.
2 The odds ratio was calculated by dividing the % of SIU cases by the % population. An odds ratioapproaching 1.00 indicates that a racial group is neither over or under-represented in SIU cases. An oddsratio less than 1.00 indicates that the group is under-represented in SIU cases. An odds ratio greater than1.00 indicates that the group is over-represented. For example, an odds ratio of 2.00 indicates that a groupis twice as prevalent in SIU cases as they are in the general population.
3 The SIU case rate (per 100,000) was calculated by dividing the number of SIU cases by the populationestimate and multiplying that figure by 100,000. The rate indicates the number of people per 100,000population that were involved in an SIU investigation.

88
TABLE 1A: TOTAL SIU INVESTIGATIONS INVOLVING MALE CIVILIANSOntario, January 1st 2000 to June 6th 2006
Race TotalPopulation
%Population
# ofSIU
Cases
% ofSIU
Cases
OddsRatio
SIUCase Rate
(per100,000)
White 4387845 79.3 377 58.9 0.73 8.59
Black 193115 3.5 86 13.4 3.83 44.5
Aboriginal 91405 1.7 44 6.9 4.06 48.1
Asian 382600 6.9 17 2.7 0.39 4.44
South Asian 281360 5.1 8 1.3 0.25 2.84
West Asian 82830 1.5 8 1.3 0.86 9.66
Other 109995 2 7 1.1 0.55 6.36
Unknown ----- ---- 93 14.5 ---- -----
Total 5529150 100 640 100 1 11.57

89
TABLE 1B: TOTAL SIU INVESTIGATIONS INVOLVING FEMALE CIVILIANSOntario, January 1st 2000 to June 6th 2006
Race TotalPopulation
%Population
# ofSIU
Cases
% ofSIU
Cases
OddsRatio
SIUCase Rate
(per100,000)
White 4556345 79.1 80 55.6 0.7 1.75
Black 217980 3.8 8 5.6 1.47 3.67
Aboriginal 96910 1.7 12 8.3 4.88 12.38
Asian 420710 7.3 3 2.1 0.29 0.71
South Asian 273510 4.7 4 2.8 0.59 1.46
West Asian 72810 1.3 1 0.7 0.54 1.37
Other 118135 2.1 1 0.7 0.33 0.85
Unknown ---- ---- 35 24.3 ---- -----
Total 5756400 100 144 100 1 2.49
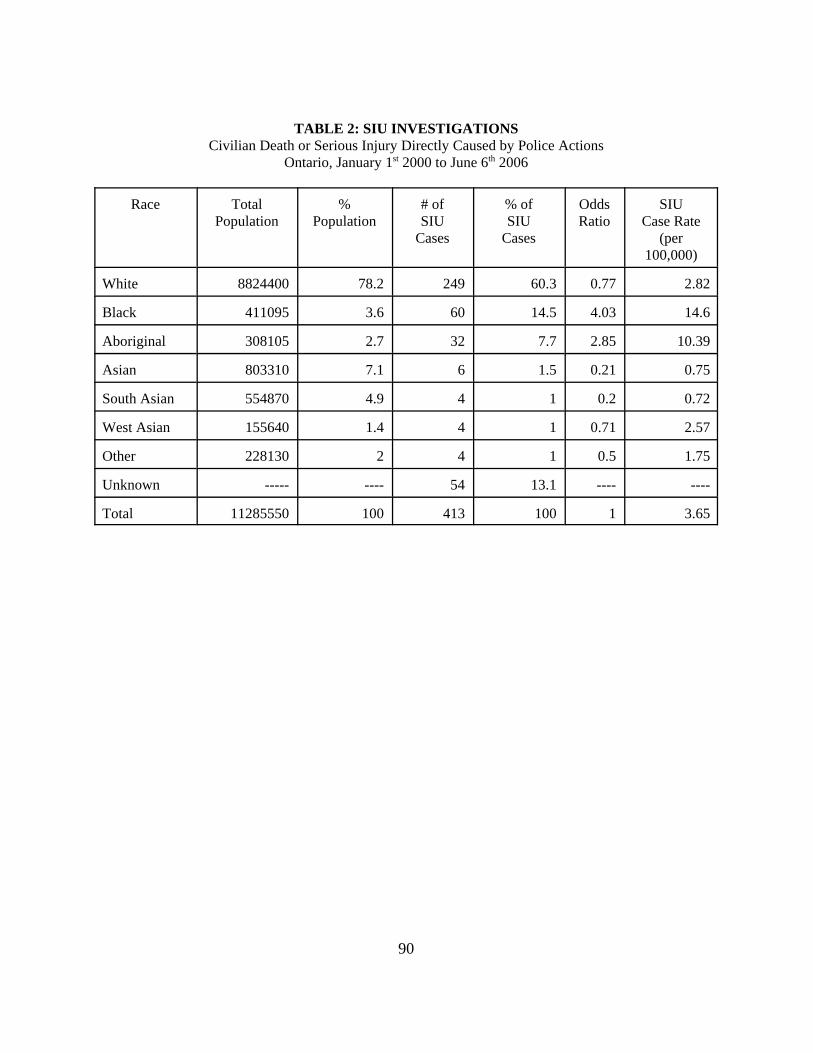
90
TABLE 2: SIU INVESTIGATIONSCivilian Death or Serious Injury Directly Caused by Police Actions
Ontario, January 1st 2000 to June 6th 2006
Race TotalPopulation
%Population
# ofSIU
Cases
% ofSIU
Cases
OddsRatio
SIUCase Rate
(per100,000)
White 8824400 78.2 249 60.3 0.77 2.82
Black 411095 3.6 60 14.5 4.03 14.6
Aboriginal 308105 2.7 32 7.7 2.85 10.39
Asian 803310 7.1 6 1.5 0.21 0.75
South Asian 554870 4.9 4 1 0.2 0.72
West Asian 155640 1.4 4 1 0.71 2.57
Other 228130 2 4 1 0.5 1.75
Unknown ----- ---- 54 13.1 ---- ----
Total 11285550 100 413 100 1 3.65

91
TABLE 3: SIU INVESTIGATIONSCivilian Death or Serious Injury Directly Caused by Police Use of Force
Ontario, January 1st 2000 to June 6th 2006
Race TotalPopulation
%Population
# ofSIU
Cases
% ofSIU
Cases
OddsRatio
SIUCase Rate
(per100,000)
White 8944190 79.3 222 63.6 0.8 2.48
Black 411095 3.6 55 15.8 4.39 13.38
Aboriginal 188315 1.7 29 8.3 4.88 15.4
Asian 803310 7.1 6 1.7 0.24 0.75
South Asian 554870 4.9 3 0.9 0.18 0.54
West Asian 155640 1.4 2 0.6 0.43 1.28
Other 228130 2 3 0.9 0.45 1.31
Unknown ----- ---- 29 8.3 ---- ----
Total 11285550 100 349 100 1 3.09

92
TABLE 4: SIU INVESTIGATIONSDeath or Serious Injury Directly Caused by Police Shootings
Ontario, January 1st 2000 to June 6th 2006
Race TotalPopulation
%Population
# ofSIU
Cases
% ofSIU
Cases
OddsRatio
SIUCase Rate
(per100,000)
White 8944190 79.3 43 58.9 0.74 0.48
Black 411095 3.6 20 27.4 7.61 4.87
Aboriginal 188315 1.7 5 6.8 4 2.66
Asian 803310 7.1 1 1.4 0.2 0.12
South Asian 554870 4.9 1 1.4 0.29 0.18
West Asian 155640 1.4 1 1.4 1 0.64
Other 228130 2 0 0 ---- 0
Unknown ----- ---- 2 2.7 ---- ----
Total 11285550 100 73 100 1 0.65

93
TABLE 5: SIU INVESTIGATIONSAll Civilian Deaths
Ontario, January 1st 2000 to June 6th 2006
Race TotalPopulation
%Population
# ofSIU
Cases
% ofSIU
Cases
OddsRatio
SIUCase Rate
(per 100,000)
White 8994190 79.3 123 59.7 0.75 1.37
Black 411095 3.6 28 13.6 3.77 6.81
Aboriginal 188315 1.7 12 5.8 3.41 6.37
Asian 803310 7.1 8 3.9 0.55 0.99
South Asian 554870 4.9 4 1.9 0.39 0.72
West Asian 155640 1.4 4 1.9 1.36 2.57
Other 228130 2 2 1 0.5 0.88
Unknown ----- ---- 25 12.1 ---- ----
Total 11285550 100 206 100 1 1.85

94
TABLE 6: SIU INVESTIGATIONSAll Civilian Deaths Directly Caused by Police Use of Force
Ontario, January 1st 2000 to June 6th 2006
Race TotalPopulation
%Population
# ofSIU
Cases
% ofSIU
Cases
OddsRatio
SIUCase Rate
(per 100,000)
White 8994190 79.3 20 54.1 0.68 0.22
Black 411095 3.6 10 27 7.5 2.43
Aboriginal 188315 1.7 3 8.1 4.76 1.59
Asian 803310 7.1 1 2.7 0.38 0.12
South Asian 554870 4.9 1 2.7 0.55 0.18
West Asian 155640 1.4 1 2.7 1.93 0.64
Other 228130 2 1 2.7 1.35 0.44
Unknown ----- ---- 0 0 ---- ----
Total 11285550 100 37 100 1 0.33

95
TABLE 7: SIU INVESTIGATIONSAll Civilian Deaths Directly Caused by Police Shootings
Ontario, January 1st 2000 to June 6th 2006
Race TotalPopulation
%Population
# ofSIU
Cases
% ofSIU
Cases
OddsRatio
SIUCase Rate
(per 100,000)
White 8994190 79.3 11 47.8 0.6 0.12
Black 411095 3.6 8 34.8 9.67 1.95
Aboriginal 188315 1.7 2 8.7 5.12 1.06
Asian 803310 7.1 1 4.3 0.61 0.12
South Asian 554870 4.9 0 0 ---- 0
West Asian 155640 1.4 1 4.3 3.07 0.64
Other 228130 2 0 0 ---- 0
Unknown ----- ---- 0 0 ---- ----
Total 11285550 100 23 100 1 0.2

96
TABLE 8: TOTAL SIU INVESTIGATIONSToronto CMA, January 1st 2000 to June 6th 2006
Race1 TotalPopulation
%Population
# ofSIU
Cases
% ofSIU
Cases
OddsRatio
SIUCase Rate
(per100,000)
White 2915125 62.7 139 47.9 0.76 4.77
Black 310500 6.7 75 25.9 3.87 24.15
Aboriginal 20300 0.4 5 1.7 4.25 24.63
Asian 656805 14.1 11 3.8 0.26 1.67
South Asian 473805 10.2 11 3.8 0.37 2.32
West Asian 95820 2.1 6 2.1 1 6.26
Other 175605 3.8 5 1.7 0.45 2.85
Unknown ---- ---- 38 13.1 ---- ----
Total 4647960 100 290 100 1 6.24
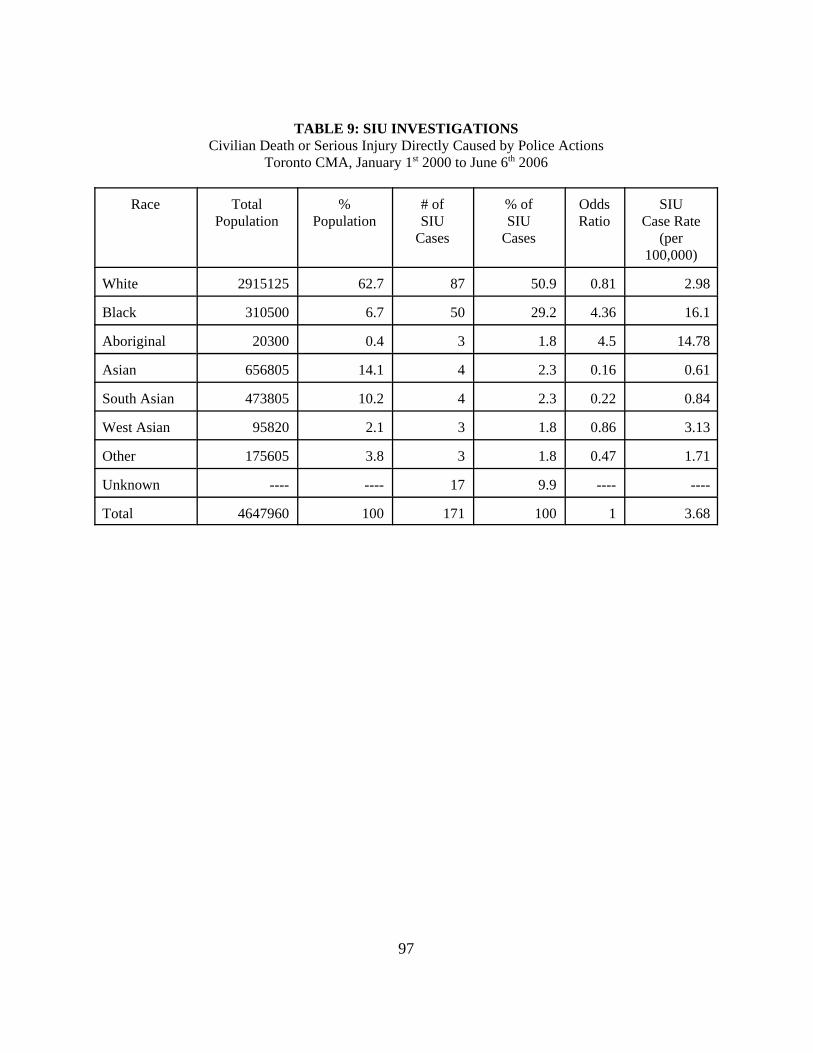
97
TABLE 9: SIU INVESTIGATIONSCivilian Death or Serious Injury Directly Caused by Police Actions
Toronto CMA, January 1st 2000 to June 6th 2006
Race TotalPopulation
%Population
# ofSIU
Cases
% ofSIU
Cases
OddsRatio
SIUCase Rate
(per100,000)
White 2915125 62.7 87 50.9 0.81 2.98
Black 310500 6.7 50 29.2 4.36 16.1
Aboriginal 20300 0.4 3 1.8 4.5 14.78
Asian 656805 14.1 4 2.3 0.16 0.61
South Asian 473805 10.2 4 2.3 0.22 0.84
West Asian 95820 2.1 3 1.8 0.86 3.13
Other 175605 3.8 3 1.8 0.47 1.71
Unknown ---- ---- 17 9.9 ---- ----
Total 4647960 100 171 100 1 3.68

98
TABLE 10: SIU INVESTIGATIONSCivilian Death or Serious Injury Directly Caused by Police Use of Force
Toronto CMA, January 1st 2000 to June 6th 2006
Race TotalPopulation
%Population
# ofSIU
Cases
% ofSIU
Cases
OddsRatio
SIUCase Rate
(per100,000)
White 2915125 62.7 75 53.2 0.85 2.57
Black 310500 6.7 46 32.6 4.87 14.81
Aboriginal 20300 0.4 3 2.1 5.25 14.78
Asian 656805 14.1 4 2.8 0.2 0.61
South Asian 473805 10.2 3 2.1 0.21 0.63
West Asian 95820 2.1 1 0.7 0.33 1.04
Other 175605 3.8 2 1.4 0.37 1.14
Unknown ---- ---- 7 5 ---- ----
Total 4647960 100 141 100 1 3.03

99
TABLE 11: SIU INVESTIGATIONSCivilian Deaths or Serious Injury Directly Caused by Police Shooting
Toronto CMA, January 1st 2000 to June 6th 2006
Race TotalPopulation
%Population
# ofSIU
Cases
% ofSIU
Cases
OddsRatio
SIUCase Rate
(per100,000)
White 2915125 62.7 12 37.5 0.6 0.41
Black 310500 6.7 16 50 7.46 5.15
Aboriginal 20300 0.4 1 3.1 7.75 4.93
Asian 656805 14.1 1 3.1 0.22 0.15
South Asian 473805 10.2 1 3.1 0.3 0.21
West Asian 95820 2.1 1 3.1 1.48 1.04
Other 175605 3.8 0 0 ---- 0
Unknown ---- ---- 0 0 ---- ----
Total 4647960 100 32 100 1 0.69

100
TABLE 12: SIU INVESTIGATIONSAll Civilian Deaths
Toronto CMA, January 1st 2000 to June 6th 2006
Race TotalPopulation
%Population
# ofSIU
Cases
% ofSIU
Cases
OddsRatio
SIUCase Rate
(per100,000)
White 2915125 62.7 38 48.1 0.77 1.3
Black 310500 6.7 22 27.8 4.15 7.09
Aboriginal 20300 0.4 0 0 0 0
Asian 656805 14.1 5 6.3 0.45 0.76
South Asian 473805 10.2 4 5.1 0.5 0.84
West Asian 95820 2.1 3 3.8 1.81 3.13
Other 175605 3.8 2 2.5 0.66 1.14
Unknown ---- ---- 5 6.3 ---- ----
Total 4647960 100 79 100 1 1.69
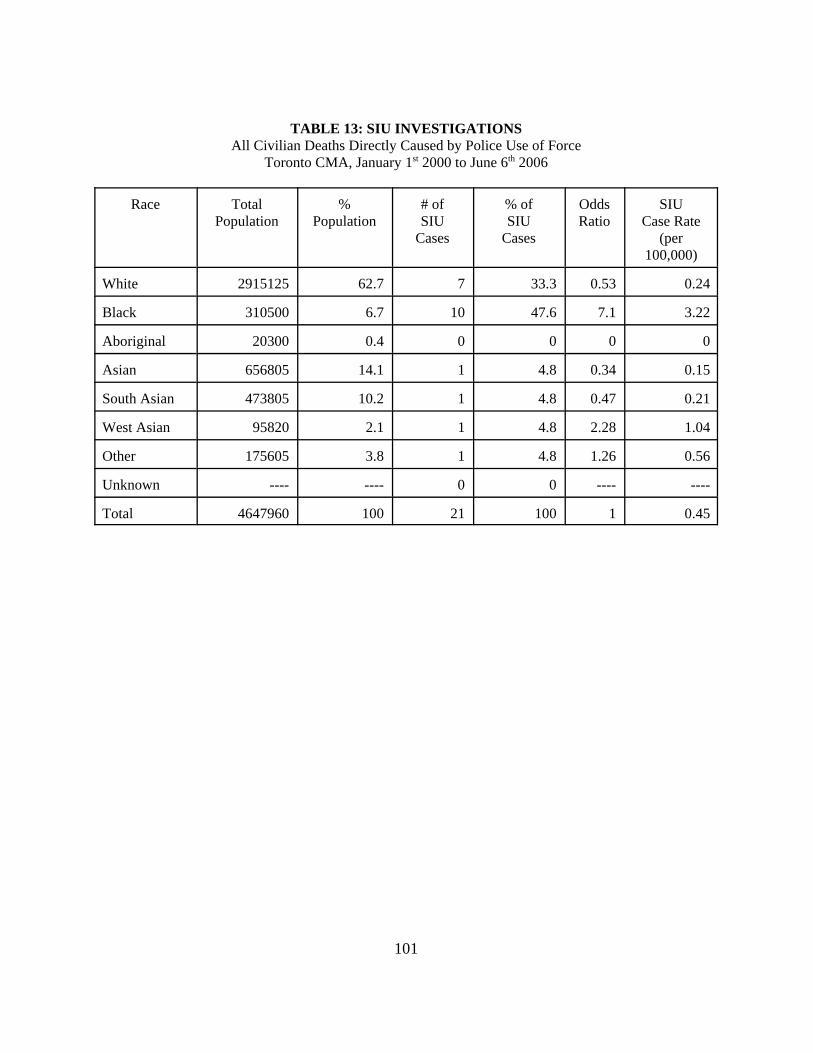
101
TABLE 13: SIU INVESTIGATIONSAll Civilian Deaths Directly Caused by Police Use of Force
Toronto CMA, January 1st 2000 to June 6th 2006
Race TotalPopulation
%Population
# ofSIU
Cases
% ofSIU
Cases
OddsRatio
SIUCase Rate
(per100,000)
White 2915125 62.7 7 33.3 0.53 0.24
Black 310500 6.7 10 47.6 7.1 3.22
Aboriginal 20300 0.4 0 0 0 0
Asian 656805 14.1 1 4.8 0.34 0.15
South Asian 473805 10.2 1 4.8 0.47 0.21
West Asian 95820 2.1 1 4.8 2.28 1.04
Other 175605 3.8 1 4.8 1.26 0.56
Unknown ---- ---- 0 0 ---- ----
Total 4647960 100 21 100 1 0.45

102
TABLE 14: SIU INVESTIGATIONSAll Civilian Deaths Directly Caused by Police Shootings
Toronto CMA, January 1st 2000 to June 6th 2006
Race TotalPopulation
%Population
# ofSIU
Cases
% ofSIU
Cases
OddsRatio
SIUCase Rate
(per100,000)
White 2915125 62.7 2 16.7 0.27 0.07
Black 310500 6.7 8 66.7 9.95 2.58
Aboriginal 20300 0.4 0 0 0 0
Asian 656805 14.1 1 8.3 0.59 0.15
South Asian 473805 10.2 0 0 0 0
West Asian 95820 2.1 1 8.3 3.95 1.04
Other 175605 3.8 0 0 0 0
Unknown ---- ---- 0 0 0 0
Total 4647960 100 12 100 1 0.26

103
TABLE 15: TOTAL SIU INVESTIGATIONSPercent of Civilians, by Civilian Gender and Race
Age Group White Black Aboriginal OtherMinority
Missing
Male 82.5 90.4 78.6 81.6 72.7
Female 17.5 8.5 21.4 18.4 27.3
Trans-gendered 0 1.1 0 0 0
Sample Size 457 94 56 49 128
Pearson Chi-square: 20.660; df=8; p <.01.
TABLE 16: TOTAL SIU INVESTIGATIONSPercent of Civilians, by Civilian Gender and Race
Serious Injury or Death Directly Caused by Police Use of Force
Age Group White Black Aboriginal OtherMinority
Missing
Male 80.6 90.9 75.9 85.7 79.3
Female 19.4 9.1 24.1 14.3 20.7
Sample Size 222 55 29 14 29
Pearson Chi-square: 4.243; df=4; p <.37.
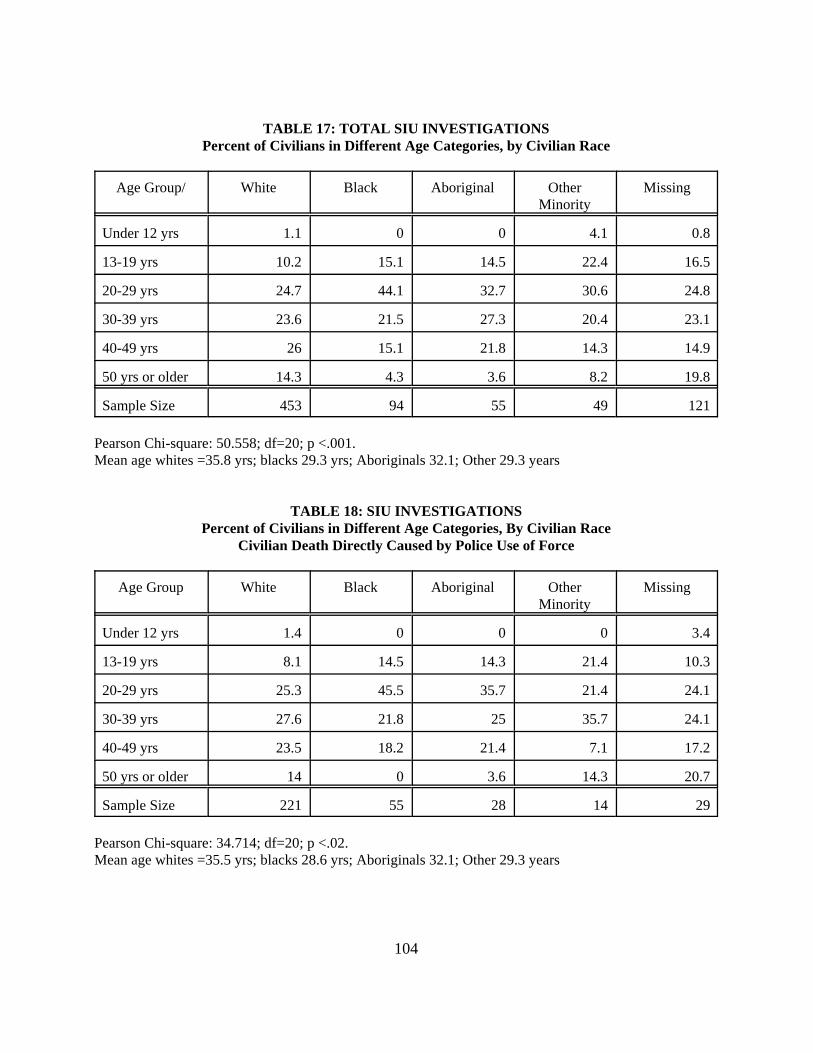
104
TABLE 17: TOTAL SIU INVESTIGATIONSPercent of Civilians in Different Age Categories, by Civilian Race
Age Group/ White Black Aboriginal OtherMinority
Missing
Under 12 yrs 1.1 0 0 4.1 0.8
13-19 yrs 10.2 15.1 14.5 22.4 16.5
20-29 yrs 24.7 44.1 32.7 30.6 24.8
30-39 yrs 23.6 21.5 27.3 20.4 23.1
40-49 yrs 26 15.1 21.8 14.3 14.9
50 yrs or older 14.3 4.3 3.6 8.2 19.8
Sample Size 453 94 55 49 121
Pearson Chi-square: 50.558; df=20; p <.001.Mean age whites =35.8 yrs; blacks 29.3 yrs; Aboriginals 32.1; Other 29.3 years
TABLE 18: SIU INVESTIGATIONSPercent of Civilians in Different Age Categories, By Civilian Race
Civilian Death Directly Caused by Police Use of Force
Age Group White Black Aboriginal OtherMinority
Missing
Under 12 yrs 1.4 0 0 0 3.4
13-19 yrs 8.1 14.5 14.3 21.4 10.3
20-29 yrs 25.3 45.5 35.7 21.4 24.1
30-39 yrs 27.6 21.8 25 35.7 24.1
40-49 yrs 23.5 18.2 21.4 7.1 17.2
50 yrs or older 14 0 3.6 14.3 20.7
Sample Size 221 55 28 14 29
Pearson Chi-square: 34.714; df=20; p <.02.Mean age whites =35.5 yrs; blacks 28.6 yrs; Aboriginals 32.1; Other 29.3 years
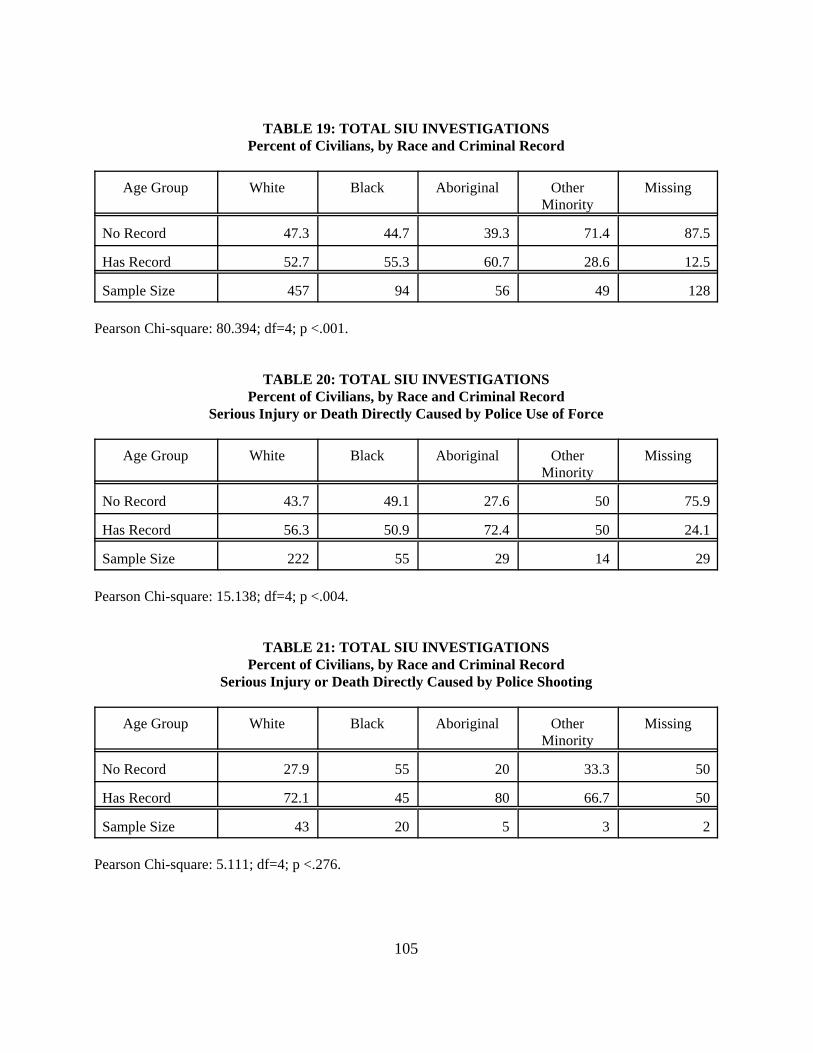
105
TABLE 19: TOTAL SIU INVESTIGATIONSPercent of Civilians, by Race and Criminal Record
Age Group White Black Aboriginal OtherMinority
Missing
No Record 47.3 44.7 39.3 71.4 87.5
Has Record 52.7 55.3 60.7 28.6 12.5
Sample Size 457 94 56 49 128
Pearson Chi-square: 80.394; df=4; p <.001.
TABLE 20: TOTAL SIU INVESTIGATIONSPercent of Civilians, by Race and Criminal Record
Serious Injury or Death Directly Caused by Police Use of Force
Age Group White Black Aboriginal OtherMinority
Missing
No Record 43.7 49.1 27.6 50 75.9
Has Record 56.3 50.9 72.4 50 24.1
Sample Size 222 55 29 14 29
Pearson Chi-square: 15.138; df=4; p <.004.
TABLE 21: TOTAL SIU INVESTIGATIONSPercent of Civilians, by Race and Criminal Record
Serious Injury or Death Directly Caused by Police Shooting
Age Group White Black Aboriginal OtherMinority
Missing
No Record 27.9 55 20 33.3 50
Has Record 72.1 45 80 66.7 50
Sample Size 43 20 5 3 2
Pearson Chi-square: 5.111; df=4; p <.276.

106
TABLE 22: TOTAL SIU INVESTIGATIONSPercent of Civilians, by Civilian Race and Reported Intoxication at Time of Incident
Age Group White Black Aboriginal OtherMinority
Missing
Not Intoxicated 64.6 81.9 35.7 89.5 76.6
Intoxicated 35.5 18.1 64.3 10.2 23.4
Sample Size 457 94 56 49 128
Pearson Chi-square: 52.792; df=4; p <.001.
TABLE 23: TOTAL SIU INVESTIGATIONSPercent of Civilians, by Civilian Race and Reported Intoxication at the Time of Incident
Serious Injury or Death Directly Caused by Police Use of Force
Age Group White Black Aboriginal OtherMinority
Missing
Not Intoxicated 59.9 87.3 34.5 85.7 65.5
Intoxicated 40.1 12.7 65.5 14.3 34.5
Sample Size 222 55 29 14 29
Pearson Chi-square: 28.247; df=4; p <.001.
TABLE 24: TOTAL SIU INVESTIGATIONSPercent of Civilians, by Civilian Race and Reported Intoxication at Time of Incident
Serious Injury or Death Directly Caused by Police Shooting
Age Group White Black Aboriginal OtherMinority
Missing
Not Intoxicated 67.4 90 60 66.7 100
Intoxicated 32.6 10 40 33.3 0
Sample Size 43 20 5 3 2
Pearson Chi-square: 4.915; df=4; p <.296.

107
TABLE 25: TOTAL SIU INVESTIGATIONSPercent of Civilians, by Civilian Race and Reported Mental Health at Time of Incident
Age Group White Black Aboriginal OtherMinority
Missing
No Mental HealthIssue 60.8 76.6 64.3 67.3 82.8
Had a MentalHealth Issue 21.9 12.8 23.3 18.4 10.2
Suicidal 17.3 10.6 12.5 14.3 7
Sample Size 457 94 56 49 128
Pearson Chi-square: 27.154; df=8; p <.001.
TABLE 26: TOTAL SIU INVESTIGATIONSPercent of Civilians, by Civilian Race and Reported Mental Health at Time of Incident
Serious Injury or Death Directly Caused by Police Use of Force
Age Group White Black Aboriginal OtherMinority
Missing
No Mental HealthIssue 61.7 78.2 62.1 57.1 69
Had a MentalHealth Issue 27.9 14.5 24.1 35.7 20.7
Suicidal 10.4 7.3 13.8 7.1 10.3
Sample Size 222 55 29 14 29
Pearson Chi-square: 7.048; df=8; p <.532.

108
TABLE 27: TOTAL SIU INVESTIGATIONSPercent of Civilians, by Civilian Race and Reported Mental Health at Time of Incident
Serious Injury or Death Directly Caused by Police Shooting
Age Group White Black Aboriginal OtherMinority
Missing
No Mental HealthIssue 27.9 70 40 33 100
Had a MentalHealth Issue 34.9 20 20 66.7 0
Suicidal 37.2 10 40 0 0
Sample Size 43 20 5 3 2
Pearson Chi-square: 15.827; df=8; p <.05
TABLE 28: TOTAL SIU INVESTIGATIONSPercent of Civilians, by Civilian Race and Reported Actions at Time of Incident
Age Group White Black Aboriginal OtherMinority
Missing
Committing a Crime10.1 8.5 14.3 14.3 5.5
Threatened orAssaulted Police orCivilians
20.1 26.6 19.6 8.2 7
Fleeing Police 19.3 25.5 19.6 20.4 29.7
Resisting Arrest 16.2 17 14.3 10.2 7.8
Other 3.5 0 3.6 2 3.1
Missing 30.9 22.3 28.6 44.9 46.9
Sample Size 457 94 56 49 128
Pearson Chi-square: 50.020; df=20; p <.001.
TABLE 29: TOTAL SIU INVESTIGATIONS
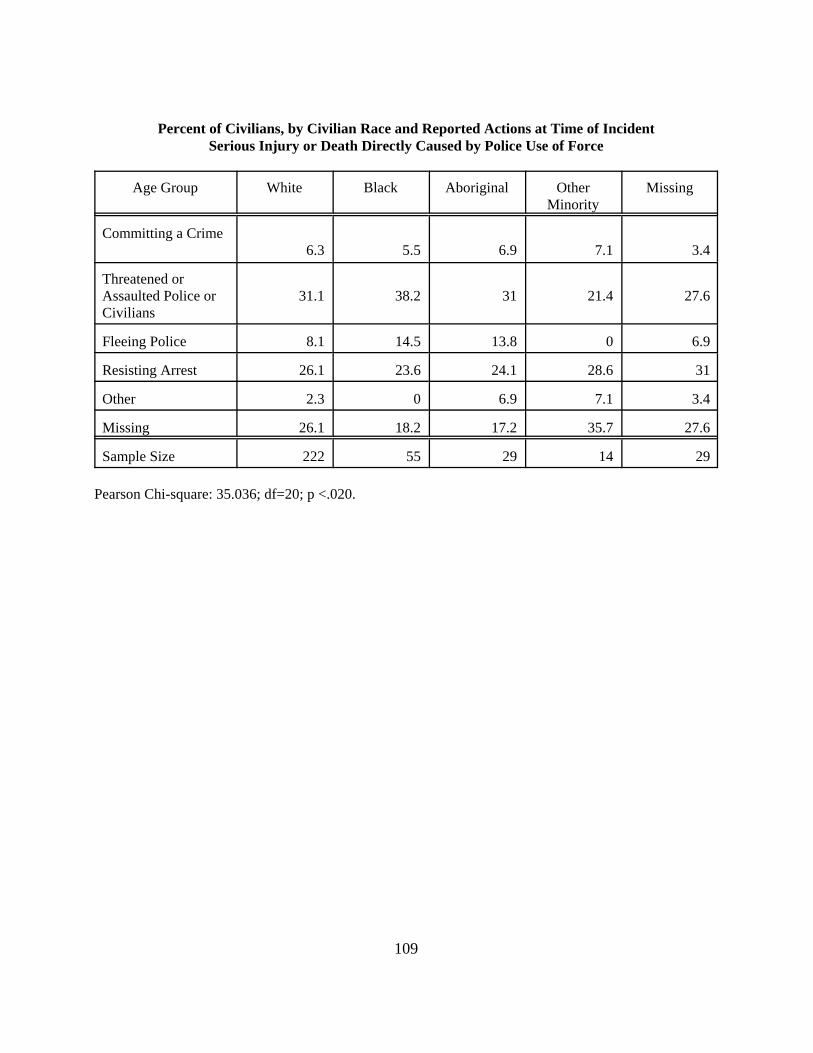
109
Percent of Civilians, by Civilian Race and Reported Actions at Time of IncidentSerious Injury or Death Directly Caused by Police Use of Force
Age Group White Black Aboriginal OtherMinority
Missing
Committing a Crime6.3 5.5 6.9 7.1 3.4
Threatened orAssaulted Police orCivilians
31.1 38.2 31 21.4 27.6
Fleeing Police 8.1 14.5 13.8 0 6.9
Resisting Arrest 26.1 23.6 24.1 28.6 31
Other 2.3 0 6.9 7.1 3.4
Missing 26.1 18.2 17.2 35.7 27.6
Sample Size 222 55 29 14 29
Pearson Chi-square: 35.036; df=20; p <.020.

110
TABLE 30: TOTAL SIU INVESTIGATIONSPercent of Civilians, by Civilian Race and Reported Actions at Time of Incident
Serious Injury or Death Directly Caused by Police Shooting
Age Group White Black Aboriginal OtherMinority
Missing
Committing a Crime4.7 10 0 0 0
Threatened orAssaulted Police orCivilians
79.1 60 80 100 0
Fleeing Police 4.7 15 20 0 0
Resisting Arrest 2.3 10 0 0 0
Other 0 0 0 0 0
Missing 9.3 5 0 0 100
Sample Size 43 20 5 3 2
Pearson Chi-square: 27.564; df=20; p <.036.
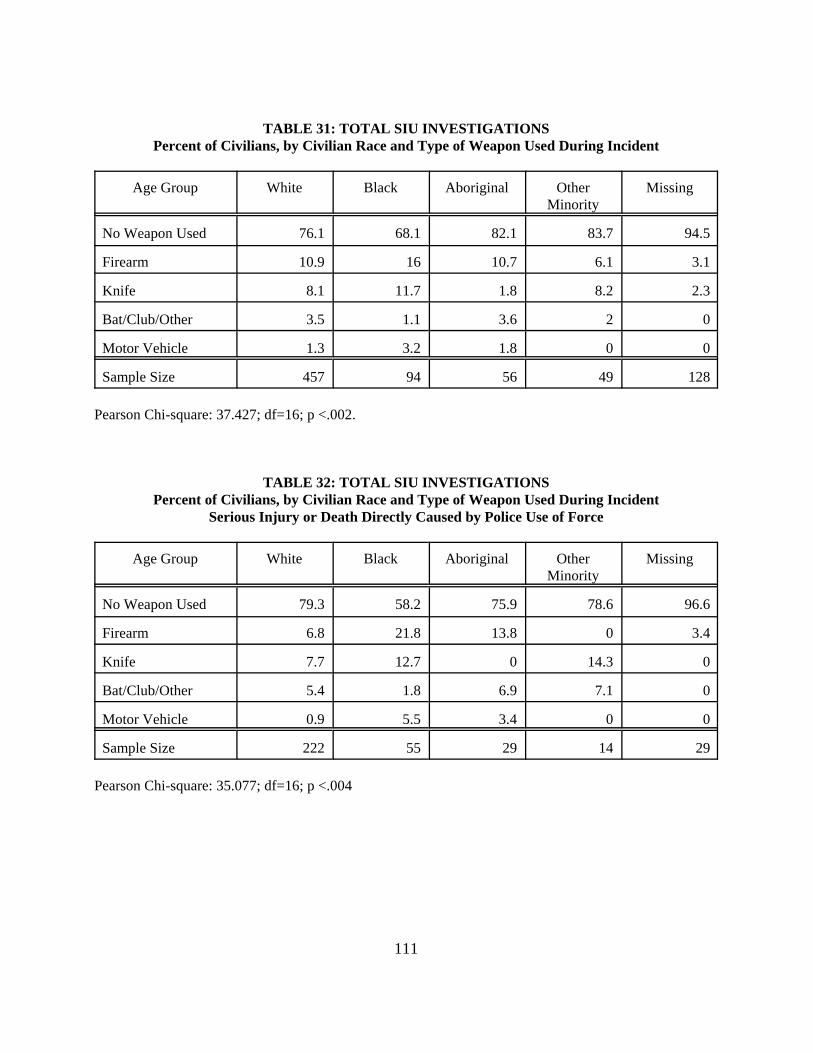
111
TABLE 31: TOTAL SIU INVESTIGATIONSPercent of Civilians, by Civilian Race and Type of Weapon Used During Incident
Age Group White Black Aboriginal OtherMinority
Missing
No Weapon Used 76.1 68.1 82.1 83.7 94.5
Firearm 10.9 16 10.7 6.1 3.1
Knife 8.1 11.7 1.8 8.2 2.3
Bat/Club/Other 3.5 1.1 3.6 2 0
Motor Vehicle 1.3 3.2 1.8 0 0
Sample Size 457 94 56 49 128
Pearson Chi-square: 37.427; df=16; p <.002.
TABLE 32: TOTAL SIU INVESTIGATIONSPercent of Civilians, by Civilian Race and Type of Weapon Used During Incident
Serious Injury or Death Directly Caused by Police Use of Force
Age Group White Black Aboriginal OtherMinority
Missing
No Weapon Used 79.3 58.2 75.9 78.6 96.6
Firearm 6.8 21.8 13.8 0 3.4
Knife 7.7 12.7 0 14.3 0
Bat/Club/Other 5.4 1.8 6.9 7.1 0
Motor Vehicle 0.9 5.5 3.4 0 0
Sample Size 222 55 29 14 29
Pearson Chi-square: 35.077; df=16; p <.004
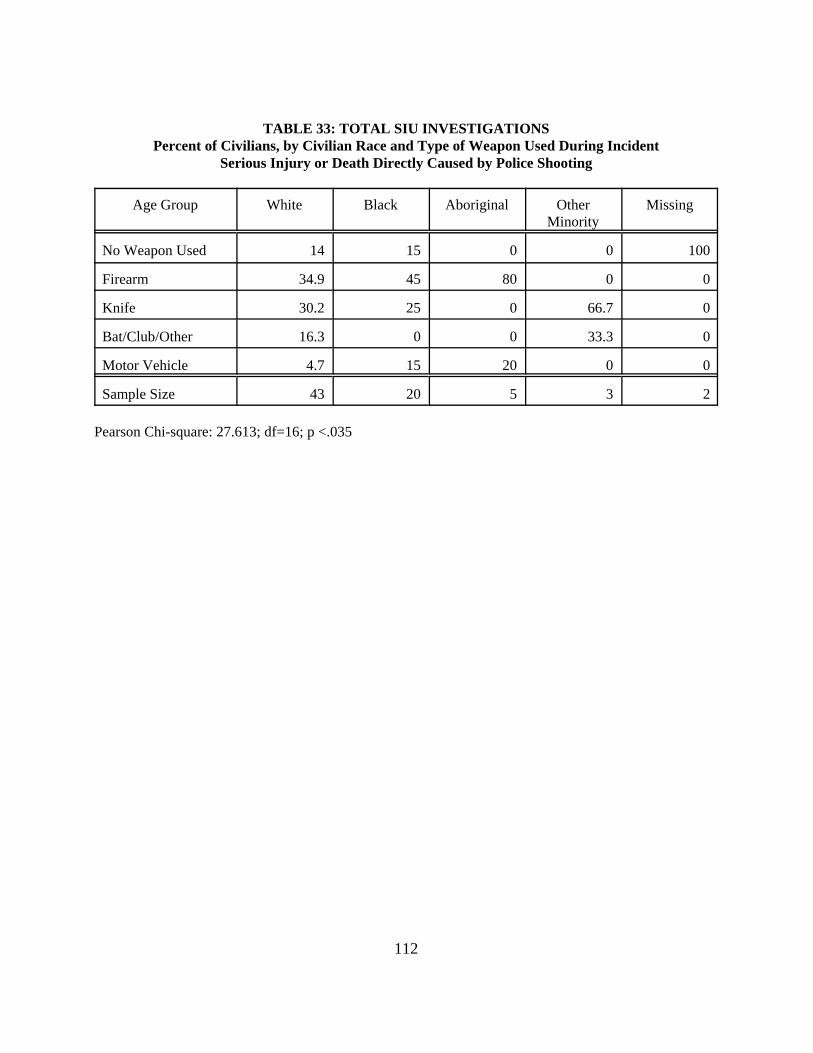
112
TABLE 33: TOTAL SIU INVESTIGATIONSPercent of Civilians, by Civilian Race and Type of Weapon Used During Incident
Serious Injury or Death Directly Caused by Police Shooting
Age Group White Black Aboriginal OtherMinority
Missing
No Weapon Used 14 15 0 0 100
Firearm 34.9 45 80 0 0
Knife 30.2 25 0 66.7 0
Bat/Club/Other 16.3 0 0 33.3 0
Motor Vehicle 4.7 15 20 0 0
Sample Size 43 20 5 3 2
Pearson Chi-square: 27.613; df=16; p <.035

113
TABLE 34: TOTAL SIU INVESTIGATIONSPercent of Civilians, by Civilian Race and Case Outcome
Age Group White Black Aboriginal OtherMinority
Missing
Officer(s) Cleared 96.5 95.7 98.2 95.9 0
Officer(s) Charged 3.5 4.3 1.8 4.1 0
Sample Size 457 94 56 49 128
Pearson Chi-square: 5.448; df=4; p <.244.
TABLE 35: TOTAL SIU INVESTIGATIONSPercent of Civilians, by Civilian Race and Case Outcome
Civilian Death or Injury Directly Caused by Police Use of Force
Age Group White Black Aboriginal OtherMinority
Missing
Officer(s) Cleared 93.2 94.5 96.6 92.6 100
Officer(s) Charged 6.8 5.5 3.4 7.1 0
Sample Size 222 55 29 14 29
Pearson Chi-square: 5.516; df=4; p <.238.
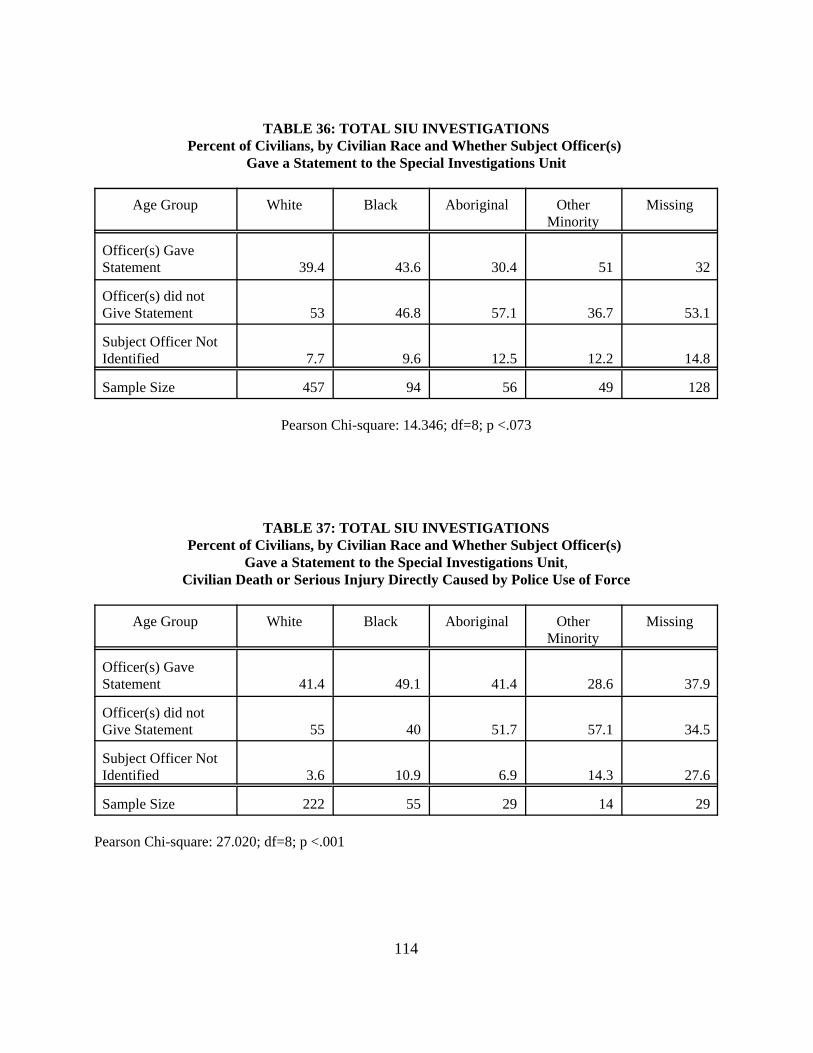
114
TABLE 36: TOTAL SIU INVESTIGATIONSPercent of Civilians, by Civilian Race and Whether Subject Officer(s)
Gave a Statement to the Special Investigations Unit
Age Group White Black Aboriginal OtherMinority
Missing
Officer(s) GaveStatement 39.4 43.6 30.4 51 32
Officer(s) did notGive Statement 53 46.8 57.1 36.7 53.1
Subject Officer NotIdentified 7.7 9.6 12.5 12.2 14.8
Sample Size 457 94 56 49 128
Pearson Chi-square: 14.346; df=8; p <.073
TABLE 37: TOTAL SIU INVESTIGATIONSPercent of Civilians, by Civilian Race and Whether Subject Officer(s)
Gave a Statement to the Special Investigations Unit,Civilian Death or Serious Injury Directly Caused by Police Use of Force
Age Group White Black Aboriginal OtherMinority
Missing
Officer(s) GaveStatement 41.4 49.1 41.4 28.6 37.9
Officer(s) did notGive Statement 55 40 51.7 57.1 34.5
Subject Officer NotIdentified 3.6 10.9 6.9 14.3 27.6
Sample Size 222 55 29 14 29
Pearson Chi-square: 27.020; df=8; p <.001

115
TABLE 38: TOTAL SIU INVESTIGATIONSPercent of Civilians, by Civilian Race and Whether Subject Officer(s)
Gave a Statement to the Special Investigations Unit,Civilian Death or Serious Injury Directly Caused by Police Shootings
Age Group White Black Aboriginal OtherMinority
Missing
Officer(s) GaveStatement 41.9 65 40 33.3 50
Officer(s) did notGive Statement 58.1 35 60 66.7 0
Subject Officer NotIdentified 0 0 0 0 50
Sample Size 43 20 5 3 2
Pearson Chi-square: 39.939; df=8; p <.001
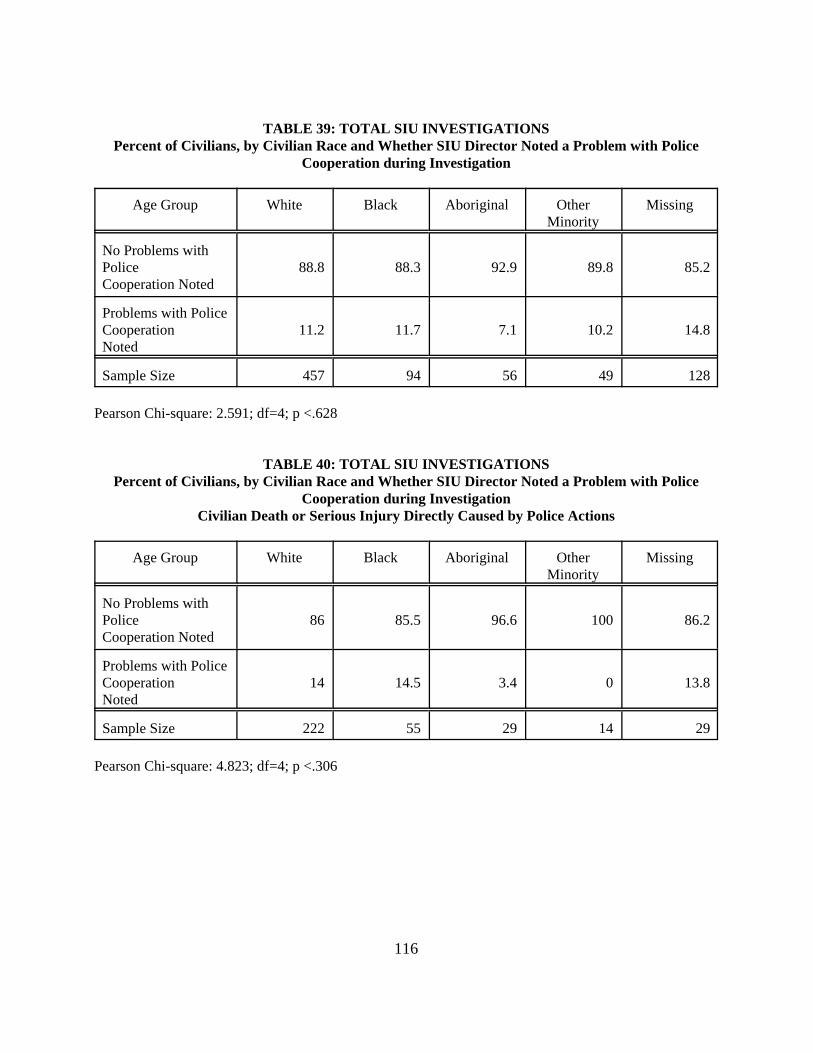
116
TABLE 39: TOTAL SIU INVESTIGATIONSPercent of Civilians, by Civilian Race and Whether SIU Director Noted a Problem with Police
Cooperation during Investigation
Age Group White Black Aboriginal OtherMinority
Missing
No Problems withPoliceCooperation Noted
88.8 88.3 92.9 89.8 85.2
Problems with PoliceCooperationNoted
11.2 11.7 7.1 10.2 14.8
Sample Size 457 94 56 49 128
Pearson Chi-square: 2.591; df=4; p <.628
TABLE 40: TOTAL SIU INVESTIGATIONSPercent of Civilians, by Civilian Race and Whether SIU Director Noted a Problem with Police
Cooperation during InvestigationCivilian Death or Serious Injury Directly Caused by Police Actions
Age Group White Black Aboriginal OtherMinority
Missing
No Problems withPoliceCooperation Noted
86 85.5 96.6 100 86.2
Problems with PoliceCooperationNoted
14 14.5 3.4 0 13.8
Sample Size 222 55 29 14 29
Pearson Chi-square: 4.823; df=4; p <.306
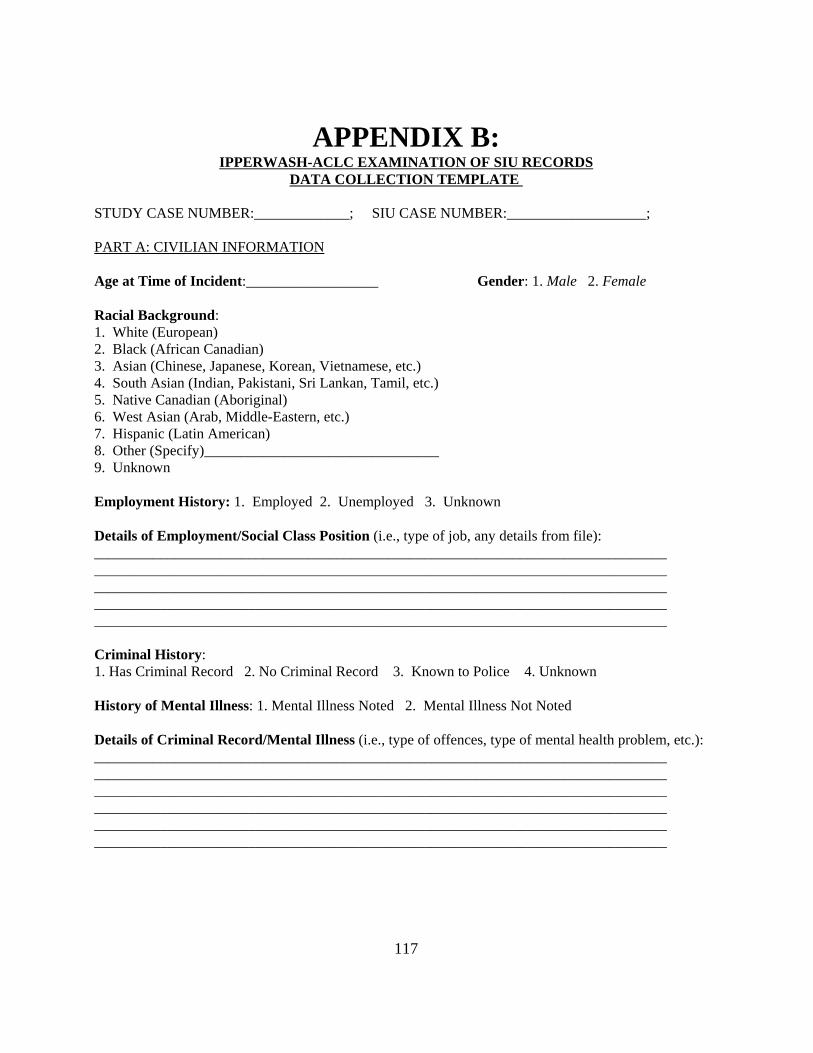
117
APPENDIX B:IPPERWASH-ACLC EXAMINATION OF SIU RECORDS
DATA COLLECTION TEMPLATE
STUDY CASE NUMBER:_____________; SIU CASE NUMBER:___________________;
PART A: CIVILIAN INFORMATION
Age at Time of Incident:__________________ Gender: 1. Male 2. Female
Racial Background:1. White (European)2. Black (African Canadian)3. Asian (Chinese, Japanese, Korean, Vietnamese, etc.)4. South Asian (Indian, Pakistani, Sri Lankan, Tamil, etc.)5. Native Canadian (Aboriginal)6. West Asian (Arab, Middle-Eastern, etc.)7. Hispanic (Latin American)8. Other (Specify)________________________________9. Unknown
Employment History: 1. Employed 2. Unemployed 3. Unknown
Details of Employment/Social Class Position (i.e., type of job, any details from file):______________________________________________________________________________________________________________________________________________________________________________________________________________________________________________________________________________________________________________________________________________________________________________________________________
Criminal History:1. Has Criminal Record 2. No Criminal Record 3. Known to Police 4. Unknown
History of Mental Illness: 1. Mental Illness Noted 2. Mental Illness Not Noted
Details of Criminal Record/Mental Illness (i.e., type of offences, type of mental health problem, etc.):____________________________________________________________________________________________________________________________________________________________________________________________________________________________________________________________________________________________________________________________________________________________________________________________________________________________________________________________________________________

118
Civilian’s Home Address (closest main intersection):_______________________________________________________________________________________________________________________________________________________________________________________________
PART B: POLICE INFORMATION
Number of Subject Officers:_____________ Number of Witness Officers:_______________
Gender of Subject Officers:______________ Age of Subject Officers:___________________
Years of Experience of Subject Officers:____________________________________________
Rank of Subject Officers: ________________________________________________________
Race of Subject Officers:_________________________________________________________
Did the Subject Officers Belong to a Special Unit? 1. YES 2. NO
Name/Description of Special Unit:_____________________________________________________________________________________________________________________________________________________________________________________________________________
Did the Subject Officer(s) make a statement to the SIU? 1. YES 2. NO
Nature of Subject Officer(s) statements:____________________________________________________________________________________________________________________________________________________________________________________________________________________________________________________________________________________________________________________________________________________________________
PART C: INCIDENT INFORMATION
Date of Incident (Month/Year only): _______________________________________________
Approximate Time of Incident:___________________________________________________
Number of Civilians Involved in Incident:__________________________________________
Number of Civilian Witnesses:____________________________________________________
Location of Incident:1. A large City (Over 500,000 population) 4. A Large Town (10,000 to 49,000)2. A Medium-sized city (100,000 to 499,000) 5. A Small Town (less than 10,000)3. A Small City (50,000 to 99,000) 6. A Rural Area
Address of Incident (including city, town, county, etc.):

119
________________________________________________________________________________________________________________________________________________________________________________________________________________________________________________________________________________________________________________________
Name of Police Service:____________________________________________________________________________________________________________________________________________________________
Description of Location (i.e., house, apartment, nightclub, street, park, housing project, etc):____________________________________________________________________________________________________________________________________________________________________________________________________________________________________________________________________________________________________________________________________________________________________________________________________________________________________________________________________________________
Type of Harm to Civilian1. Death2. Injury (specify)________________________________________________________________________________________________________________________________________________________________________________________________________________________
Cause of Harm to Civilian1. Police Shooting2. Police Use of Baton3. Police Taser4. Police Vehicle5. Other Police Use of Force (specify):___________________________________________________________________________________________________________________________________________________________________________________________________________
6. Investigation found that injury not caused by police (specify);__________________________________________________________________________________________________________________________________________________________________________________________________________________________________________
Civilian Involvement (check all that apply)1. Civilian committing a crime (specify)_____________________________________________2. Civilian Threatening Police3. Civilian Threatening Other Citizen(s)4. Civilian Physically Attacked Police5. Civilian Physically Attacked Other Citizen(s)6. Civilian Fleeing Police7. Other (specify)_______________________________________________________________
Civilian’s Use of Weapons (check all that apply)

120
1. Civilian had a firearm (specify handgun or long-gun)_________________________________2. Civilian had a knife3. Civilian had a bat/club (specify)_________________________________________________4. Civilian had other weapon (specify)______________________________________________5. Civilian used motor vehicle as a weapon6. Civilian was unarmed
Mental Health of Civilian at Time of Incident1. No mental health problems noted in file2. File notes a mental health problem (specify)________________________________________3. File notes that civilian was suicidal
Civilian Drug or Alcohol Use1. Alcohol use of civilian noted in file2. Civilian drunk on alcohol at the time of incident3. Drug use noted on file (specify type of drug)________________________________________4. Civilian intoxicated (high or impaired) on drugs at time of the incident
Brief Description of Incident________________________________________________________________________________________________________________________________________________________________________________________________________________________________________________________________________________________________________________________
Length of SIU Investigation (include length with respect to both time spent on the investigation andpage length of director’s report).________________________________________________________________________________________________________________________________________________________________________________________________________________________________________________________________________________________________________________________
Difficulty with police witnesses/subject officers.1. File notes that the police cooperated totally with the SIU investigation.2. No problems noted.
Files notes poor police cooperation with SIU investigators (please specify nature of cooperationproblem)_________________________________________________________________________________________________________________________________________________________________________________________________________________________________________________________________________________________________________________________________________________________________________________________________________________________________________________________________________________________________________________________________________________
Difficulty with the civilian “victim.”1. File notes that the civilian “victim” cooperated totally with the SIU investigation.

121
2. No problems noted.3. File notes a problem with the civilian’s participation in the investigation (please specify the nature ofthe problem): _________________________________________________________________________________________________________________________________________________________________________________________________________________________________________________________________________________________________________
Difficulty with the civilian witnesses.1. File notes that civilian witnesses cooperated totally with the SIU investigation.2. No problems noted.3. File notes a problem with the civilian witnesses (please specify the nature of the problem):________________________________________________________________________________________________________________________________________________________________________________________________________________________________________________________________________________________________________________________
Outcome of SIU Investigation1. Officer(s) cleared2. Charges Laid (please specify the nature of the charges)____________________________________________________________________________________________________________________________________________________________________________________________3. Other (specify) _______________________________________________________________

122
APPENDIX C
RECOMMENDATIONS MADE TO THEIPPERWASH INQUIRY BY THE
AFRICAN CANADIAN LEGAL CLINIC,AUGUST 2006
12 The Review Report on the Special Investigations Unit Reforms prepared for theAttorney General of Ontario by The Honourable George W. Adams, Q.C., February 26, 2003, at63-64, reported that the SIU has not fulfilled this recommendation.
123
Proposed Recommendations of the African Canadian Legal Clinic
1. That to monitor the impact of police use of force, with the purpose of ameliorating any adverse ordiscriminatory impact that such use of force may have on racialized communities:
a. The Province of Ontario take steps to require that the collection of disaggregatedrace-based data on use of force by the police be conducted on a permanent basis by:
(i) the SIU of all investigations into police use of force; (ii) the civilian oversight body through the Public Complaints Process for
incidents/complaints involving police use of force not falling within themandate of the SIU, and
(iii) Police Chiefs of all use of force incident reports which are required to becompleted under the Police Services Act Regulations. In this respect, theProvince of Ontario should amend Police Services Act Regulation 926 torequire that use of force incident reports submitted to a Police Chief beretained for at least two years.
b. These institutions will be required to report the results of the data collection to anygoverning police boards and the Attorney General on an annual basis, and make theresults available to the public.
c. Data collection will include information on a large number of variables such as: theage, gender and race of the civilian; cause of injury or death, criminal history of thecivilian, mental health of the civilian, police service involved, age, gender and raceof subject officers, rank and years of experience of subject officers, description of theincident and final outcome of case (i.e., officers cleared or charges laid). An exampleof an appropriate data collection instrument to be used to collect such information isprovided in Appendix A of the Preliminary Report of Professor Scot Wortley.
2. That the Province of Ontario take steps to strengthen police oversight mechanisms to ensureaccountability, transparency and independence with respect to police use of force against racializedpeople. Specifically:
a. The implementation of the recommendation in the Adams Report for cross-culturaleducation opportunities for SIU investigators and the recruitment of investigatorsfrom cultural and racially diverse backgrounds.12
b. The definition of “serious injury” under section 113(5) of the Police Services Actshould be broadly interpreted with the purpose of protecting victims of policeviolence to include psychological harm, such as to engage the investigativejurisdiction of the SIU, and the Police Services Act or Regulations should be amendedaccordingly to include such a definition.

124
c. With respect to incidents of use of force where injury is caused but does not fallwithin the SIU’s “serious injury” mandate, and particularly in situations where racismor racial bias is alleged to have been a factor, complainants must be entitled to andensured of an independent investigation. In the proposed Bill 103 Independent PoliceReview Act, 2006 currently before the Ontario Legislature, such an investigationwould be conducted by the civilian oversight body the Office of the IndependentPolice Review Director, and the Bill should be amended accordingly.
d. The Director of the SIU should have the power to compel Subject Officers underinvestigation to submit to an SIU interview, in light of the extraordinary powers givento police officers by the state including to carry and use firearms and thecorresponding heightened need for public accountability.
e. The Police Services Act be amended to authorize the Director of the SIU to bring acharge of misconduct before the Police Discipline Tribunal against a police officerwho fails to cooperate in an SIU investigation.
3. That police forces ensure that complaints and concerns against police officers relating to use of force,particularly when the complainant is racialized, are reflected and factored into the assessment of eachofficer’s performance review and or promotions.
4. That police forces develop an anti-racism curriculum and training program to be incorporated into anyexisting training programs on use of force and which will be mandatory for recruits, new officers, andserving officers. The training should be designed and delivered by independent experts in anti-racismto ensure a full understanding of racially biased policing, racial discrimination and the racializedcommunities police serve, particularly with respect to use of force. This training should be providedas a refresher on a regular basis. The training program should be independently and regularlyevaluated to assess its efficacy with respect to effecting anti-racist behavioral and attitudinal change.
5. That police recruits be screened for prejudicial and racially discriminatory attitudes, similar toscreening already being done for personality attributes, criminal record, and family background.
6. That police forces be encouraged to retain independent employment equity experts to developconcrete, measurable and attainable goals to increase the number of racialized people, particularlyAfrican Canadians and Aboriginals, especially in positions of responsibility, in order to achieve a“critical mass” of representation and diversity to promote cultural and organizational change.
7. That police forces review existing use of force policies and procedures with respect to their impact onracialized groups and amend and/or develop clear policies and procedures strictly governing when andhow force can be used, to ensure that any use of force by their officers are a last resort and do notresult in discriminatory or adverse impacts on those groups.
8. That use of force by the police should be free from political influence and public pressure. In situationsof public fear and tension, political leaders, politicians, police management and police associationsshould exercise restraint; and aim to diffuse, and refrain from escalating and reinforcing, public fearand tension. Arms length mediation and negotiation by an independent party such as the Chief

125
Commissioner of the Human Rights Commission or the Ombudsman, must be the first and preferredcourse of action.


