308875/ENL/ENL/03/07/A January 2014 P:\Hong Kong\ENL\PROJECTS\308875 3rd runway\03 Deliverables\07 Final EIA Report\Appendices\Ch 8 Water Quality\Draft\Appendix 8.7 PLI.doc
1
Appendix 8.7
The pollution loading inventory (PLI) is a compilation of all major wastewater discharges into the marine
environment. It includes effluent from sewage treatment works as well as stormwater outfalls and other
significant discharge sources. For this study, the PLI was prepared with reference to the methodology of
compiling PLI from the HATS Stage 2A EIA report (AEIAR-121/2008), and cross-referenced against the PLI
adopted in the HKBCF EIA report (AEIAR-145/2009). The pollution loads adopted in the HKBCF PLI is
considered to be relevant as the location of this Project is at close proximity to the HKBCF project, and the
committed land formation projects around the North Lantau Island, Western Lantau Island, Tsing Yi, Shek
Kwu Chau and Western New Territories were adopted with the latest available information.
Literature1 was reviewed to determine if any updates are needed for the values used in the HATS Stage 2A
EIA report for calculation of the pollution loads. Various government departments, such as Drainage
Service Department, would be contacted for information regarding any potential changes in pollution
sources, such as sewage outfalls. Pollution loads generated by this Project during operation phase will be
based on engineering scheme design information for this Project and will form part of the pollution loading
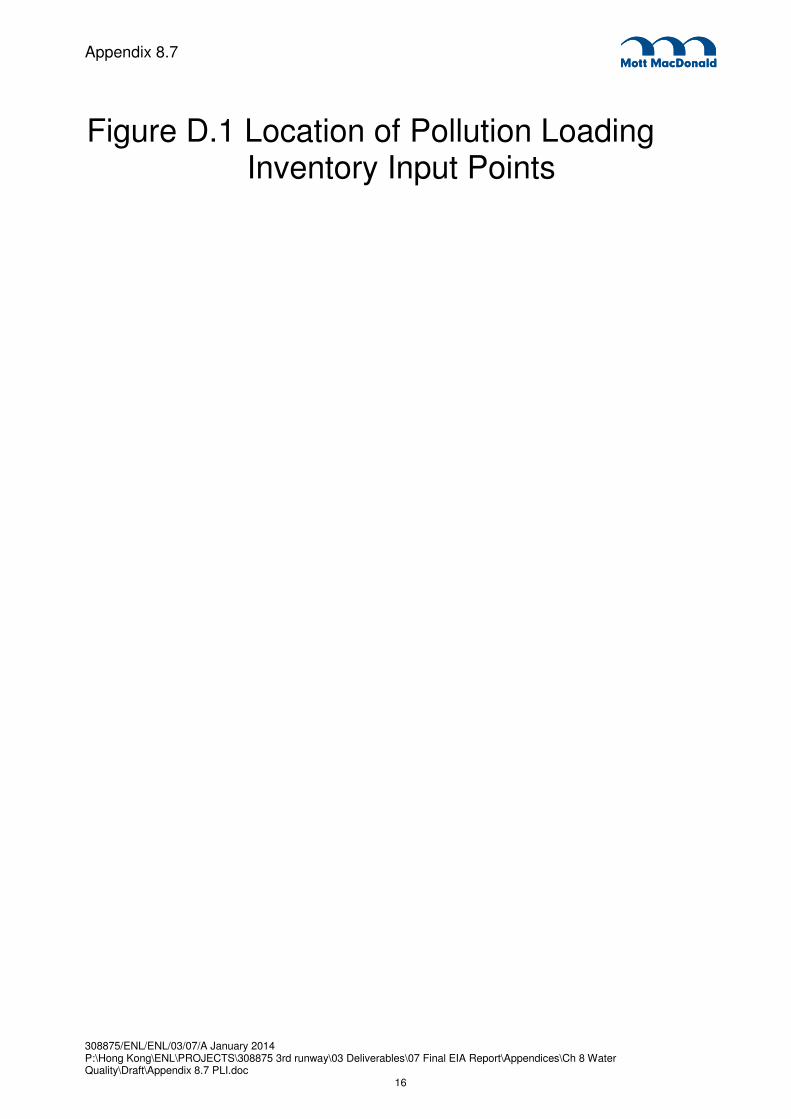
inventory to the adopted in the water quality model. The locations of the discharge / pollution source points
on the current pollution loading inventory are shown in Figure D.1.
1.1 Storm Outfalls
The key sources of water pollution in storm outfalls include:
� Pollution due to sewage from unsewered developments (dry weather load);
� Pollution due to expedient connections from trade and residential premises, and integrity problems of
aged drainage and sewerage systems (dry weather load);
� Pollution due to livestock waste (dry weather load); and
� Rainfall related load.
The total pollution load discharged via the storm system would cover the dry weather load and rainfall
related load.
1.1.1 Dry Weather Load
Domestic, commercial and industrial activities are the principle sources of dry weather load in storm drains.
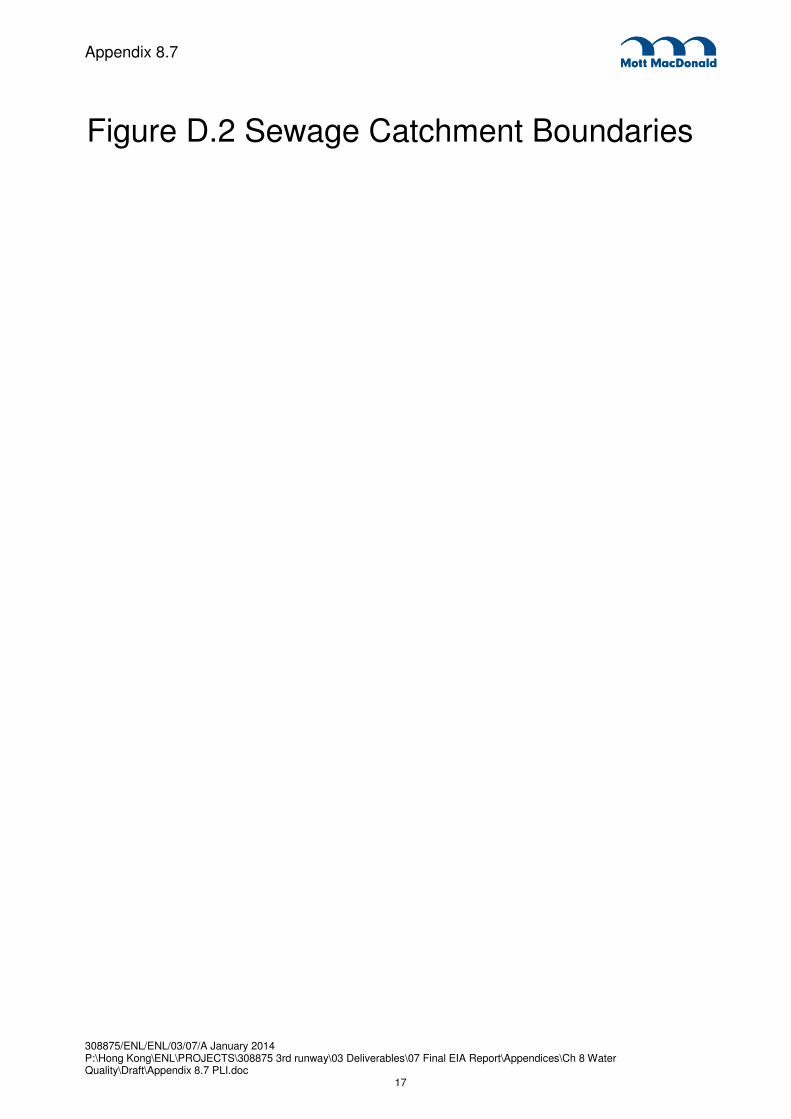
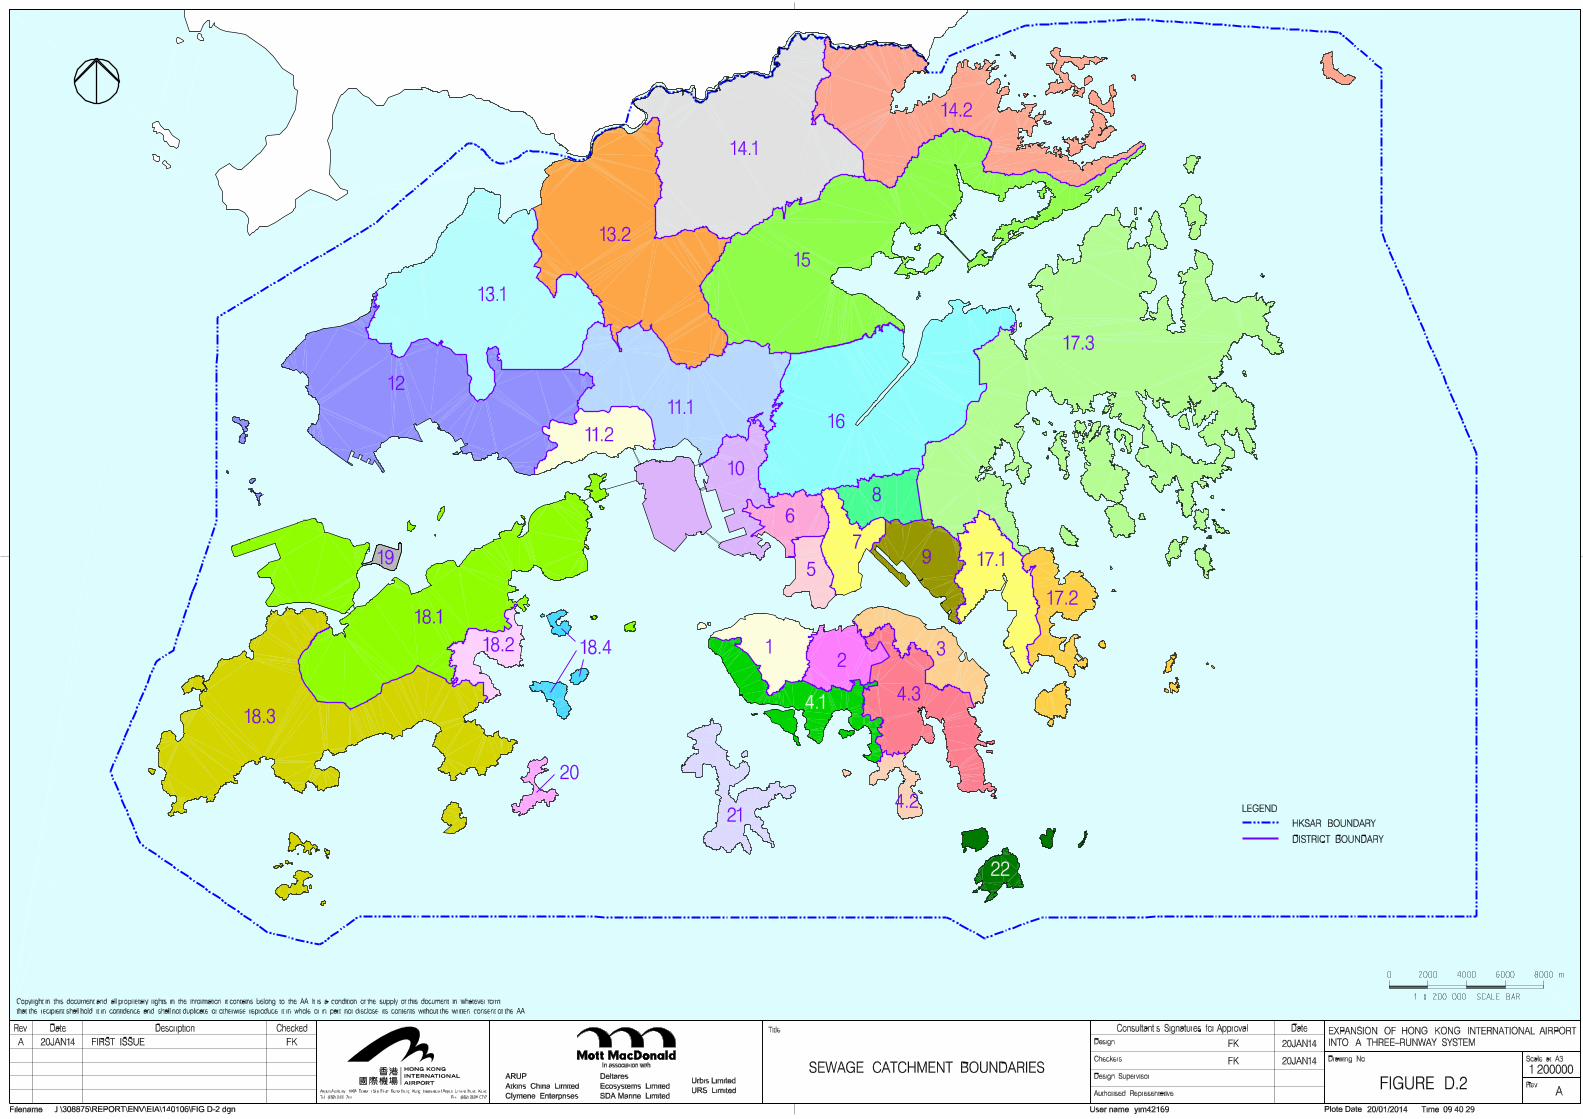
Total pollution loads generated from these activities were compiled by catchment areas as shown in Figure
D.2 with reference to the projected population and employment data provided by the Planning Department
(PlanD) in the 2009-based Territorial Population and Employment Data Matrix (TPEDM). Details of these
planning data and the methodology for calculating the pollution loads from domestic commercial and
industrial activities are given in Section 1.3.
It was assumed that a portion of total effluent load generated within a catchment would be lost to the storm
system whilst the rest of the flow would be diverted to the sewerage system.
_________________________
1 Guidelines for for Estimating Sewage Flows for Sewage Infrastructure Planning (Version 1.0), EPD, March 2005, DSD Sewerage Manual, EPD update study
Pollution Loading Inventory
308875/ENL/ENL/03/07/A January 2014 P:\Hong Kong\ENL\PROJECTS\308875 3rd runway\03 Deliverables\07 Final EIA Report\Appendices\Ch 8 Water Quality\Draft\Appendix 8.7 PLI.doc
2
Appendix 8.7
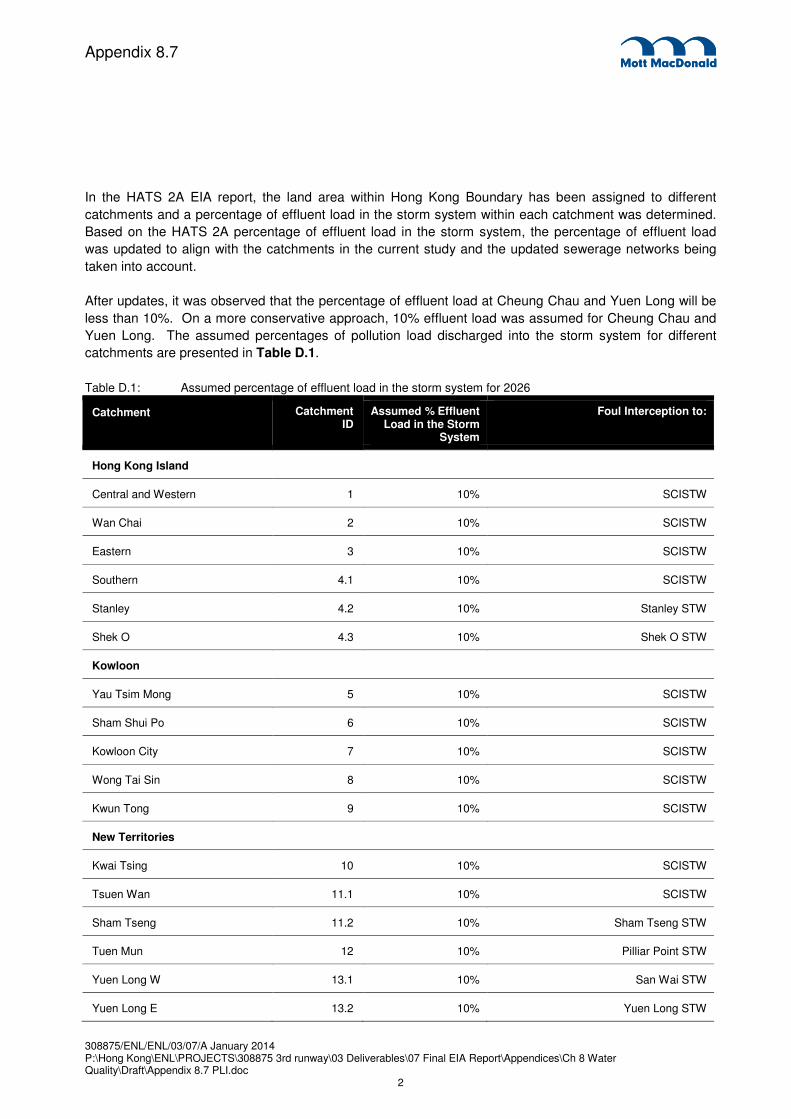
In the HATS 2A EIA report, the land area within Hong Kong Boundary has been assigned to different
catchments and a percentage of effluent load in the storm system within each catchment was determined.
Based on the HATS 2A percentage of effluent load in the storm system, the percentage of effluent load
was updated to align with the catchments in the current study and the updated sewerage networks being
taken into account.
After updates, it was observed that the percentage of effluent load at Cheung Chau and Yuen Long will be
less than 10%. On a more conservative approach, 10% effluent load was assumed for Cheung Chau and
Yuen Long. The assumed percentages of pollution load discharged into the storm system for different
catchments are presented in Table D.1.
Table D.1: Assumed percentage of effluent load in the storm system for 2026
Catchment Catchment ID
Assumed % Effluent Load in the Storm
System
Foul Interception to:
Hong Kong Island
Central and Western 1 10% SCISTW
Wan Chai 2 10% SCISTW
Eastern 3 10% SCISTW
Southern 4.1 10% SCISTW
Stanley 4.2 10% Stanley STW
Shek O 4.3 10% Shek O STW
Kowloon
Yau Tsim Mong 5 10% SCISTW
Sham Shui Po 6 10% SCISTW
Kowloon City 7 10% SCISTW
Wong Tai Sin 8 10% SCISTW
Kwun Tong 9 10% SCISTW
New Territories
Kwai Tsing 10 10% SCISTW
Tsuen Wan 11.1 10% SCISTW
Sham Tseng 11.2 10% Sham Tseng STW
Tuen Mun 12 10% Pilliar Point STW
Yuen Long W 13.1 10% San Wai STW
Yuen Long E 13.2 10% Yuen Long STW
308875/ENL/ENL/03/07/A January 2014 P:\Hong Kong\ENL\PROJECTS\308875 3rd runway\03 Deliverables\07 Final EIA Report\Appendices\Ch 8 Water Quality\Draft\Appendix 8.7 PLI.doc
3
Appendix 8.7
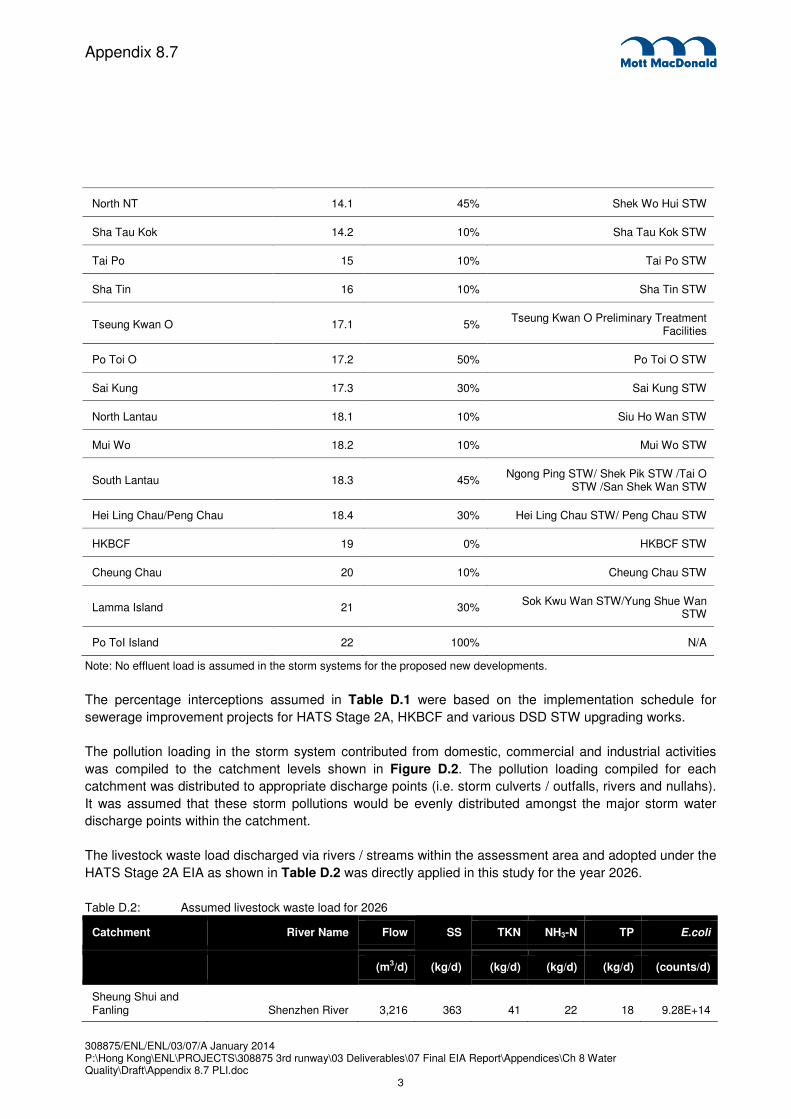
North NT 14.1 45% Shek Wo Hui STW
Sha Tau Kok 14.2 10% Sha Tau Kok STW
Tai Po 15 10% Tai Po STW
Sha Tin 16 10% Sha Tin STW
Tseung Kwan O 17.1 5% Tseung Kwan O Preliminary Treatment
Facilities
Po Toi O 17.2 50% Po Toi O STW
Sai Kung 17.3 30% Sai Kung STW
North Lantau 18.1 10% Siu Ho Wan STW
Mui Wo 18.2 10% Mui Wo STW
South Lantau 18.3 45% Ngong Ping STW/ Shek Pik STW /Tai O
STW /San Shek Wan STW
Hei Ling Chau/Peng Chau 18.4 30% Hei Ling Chau STW/ Peng Chau STW
HKBCF 19 0% HKBCF STW
Cheung Chau 20 10% Cheung Chau STW
Lamma Island 21 30% Sok Kwu Wan STW/Yung Shue Wan
STW
Po ToI Island 22 100% N/A
Note: No effluent load is assumed in the storm systems for the proposed new developments.
The percentage interceptions assumed in Table D.1 were based on the implementation schedule for
sewerage improvement projects for HATS Stage 2A, HKBCF and various DSD STW upgrading works.
The pollution loading in the storm system contributed from domestic, commercial and industrial activities
was compiled to the catchment levels shown in Figure D.2. The pollution loading compiled for each
catchment was distributed to appropriate discharge points (i.e. storm culverts / outfalls, rivers and nullahs).
It was assumed that these storm pollutions would be evenly distributed amongst the major storm water
discharge points within the catchment.
The livestock waste load discharged via rivers / streams within the assessment area and adopted under the
HATS Stage 2A EIA as shown in Table D.2 was directly applied in this study for the year 2026.
Table D.2: Assumed livestock waste load for 2026
Catchment River Name Flow SS TKN NH3-N TP E.coli
(m3/d) (kg/d) (kg/d) (kg/d) (kg/d) (counts/d)
Sheung Shui and Fanling Shenzhen River 3,216 363 41 22 18 9.28E+14

308875/ENL/ENL/03/07/A January 2014 P:\Hong Kong\ENL\PROJECTS\308875 3rd runway\03 Deliverables\07 Final EIA Report\Appendices\Ch 8 Water Quality\Draft\Appendix 8.7 PLI.doc
4
Appendix 8.7
Catchment River Name Flow SS TKN NH3-N TP E.coli
(m3/d) (kg/d) (kg/d) (kg/d) (kg/d) (counts/d)
Yuen Long, Tin Shui Wai and Kam Tin
Shan Pui Ho River 5,034 568 65 34 28 1.45E+15
Tin Shui Wai Nullah 4,190 473 54 28 24 1.21E+15
Deep Bay Sheung Pak Nai Stream 97 11 1 1 1 2.79E+13
Ha Pak Nai Stream 677 76 9 5 4 1.95E+14
Source: HATS Stage 2A EIA report (AEIAR-121/2008)
In summary, the total dry weather load in the storm outfall would include the loading contributed from
domestic, commercial and industrial activities and the loading from livestock discharges (if any) as shown
in Table D.1.
1.1.2 Rainfall Related Load
For the purpose of calculating runoff percentage and daily runoff value, the rainfall data from May to
September will represent the values for wet season, and those from November to March represent the
values for dry season. The runoff percentage of wet (93 %) and dry (70 %) season calculated in the HATS
Stage 2A EIA report has been adopted for use.
The updated thirty-year long term average rainfall data (1981 to 2010) was used to determine the daily
runoff value as shown below:
Daily runoff value (m/day) = thirty-year long term average daily rainfall data x runoff percentage
Thus, the runoff value was calculated as 0.01150 m/day and 0.00105 m/day for wet and dry seasons
respectively.
As permeable lands will also generate discharge after a certain amount of rainfall, permeable runoff
percentage has been used for calculating the runoff that is generated from the permeable lands during
heavy rainfalls. For assessment purposes, daily average rainfall over 10mm is considered as heavy rainfall.
Daily extract of meteorological observations for Hong Kong from 2003 to 2012 were used to calculate the
permeable runoff percentage, which is shown below:
Permeable runoff percentage (PRP) = no. of days over 10 mm / total no. of days x 100
The calculated permeable runoff percentages are 10.5 % and 1.3 % for wet and dry seasons respectively.
The amount of rainfall related load that would be discharged into the sea depends on the amount of area
within each catchment. It was assumed that all urbanized/developed areas within the catchment would be
impermeable and rural areas as permeable. The daily volume of runoff generated within each catchment
was estimated as shown below:
DVC = (DRV x IA) + (DRV (m/day) x PA x PRP)
DVC = daily volume of runoff in each catchment (m3/day)
308875/ENL/ENL/03/07/A January 2014 P:\Hong Kong\ENL\PROJECTS\308875 3rd runway\03 Deliverables\07 Final EIA Report\Appendices\Ch 8 Water Quality\Draft\Appendix 8.7 PLI.doc
5
Appendix 8.7
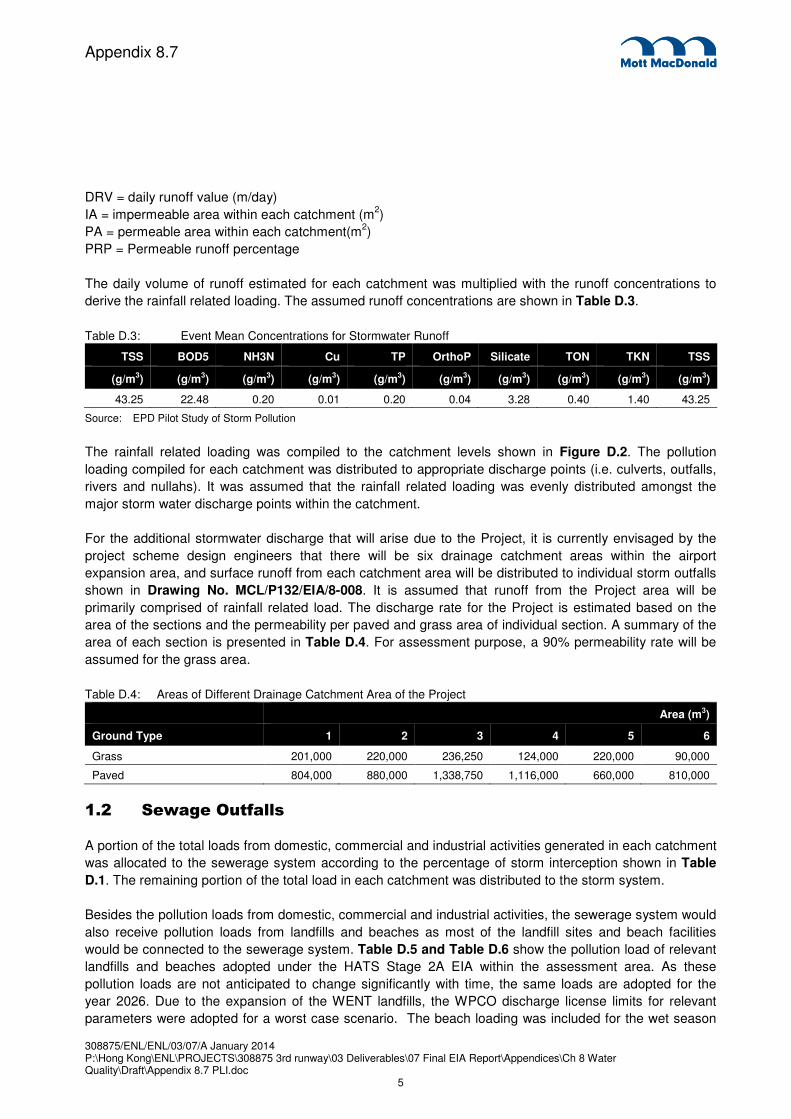
DRV = daily runoff value (m/day)
IA = impermeable area within each catchment (m2)
PA = permeable area within each catchment(m2)
PRP = Permeable runoff percentage
The daily volume of runoff estimated for each catchment was multiplied with the runoff concentrations to
derive the rainfall related loading. The assumed runoff concentrations are shown in Table D.3.
Table D.3: Event Mean Concentrations for Stormwater Runoff
TSS BOD5 NH3N Cu TP OrthoP Silicate TON TKN TSS
(g/m3) (g/m3) (g/m3) (g/m3) (g/m3) (g/m3) (g/m3) (g/m3) (g/m3) (g/m3)
43.25 22.48 0.20 0.01 0.20 0.04 3.28 0.40 1.40 43.25
Source: EPD Pilot Study of Storm Pollution
The rainfall related loading was compiled to the catchment levels shown in Figure D.2. The pollution
loading compiled for each catchment was distributed to appropriate discharge points (i.e. culverts, outfalls,
rivers and nullahs). It was assumed that the rainfall related loading was evenly distributed amongst the
major storm water discharge points within the catchment.
For the additional stormwater discharge that will arise due to the Project, it is currently envisaged by the
project scheme design engineers that there will be six drainage catchment areas within the airport
expansion area, and surface runoff from each catchment area will be distributed to individual storm outfalls
shown in Drawing No. MCL/P132/EIA/8-008. It is assumed that runoff from the Project area will be
primarily comprised of rainfall related load. The discharge rate for the Project is estimated based on the
area of the sections and the permeability per paved and grass area of individual section. A summary of the
area of each section is presented in Table D.4. For assessment purpose, a 90% permeability rate will be
assumed for the grass area.
Table D.4: Areas of Different Drainage Catchment Area of the Project
Area (m3)
Ground Type 1 2 3 4 5 6
Grass 201,000 220,000 236,250 124,000 220,000 90,000
Paved 804,000 880,000 1,338,750 1,116,000 660,000 810,000
1.2 Sewage Outfalls
A portion of the total loads from domestic, commercial and industrial activities generated in each catchment
was allocated to the sewerage system according to the percentage of storm interception shown in Table
D.1. The remaining portion of the total load in each catchment was distributed to the storm system.
Besides the pollution loads from domestic, commercial and industrial activities, the sewerage system would
also receive pollution loads from landfills and beaches as most of the landfill sites and beach facilities
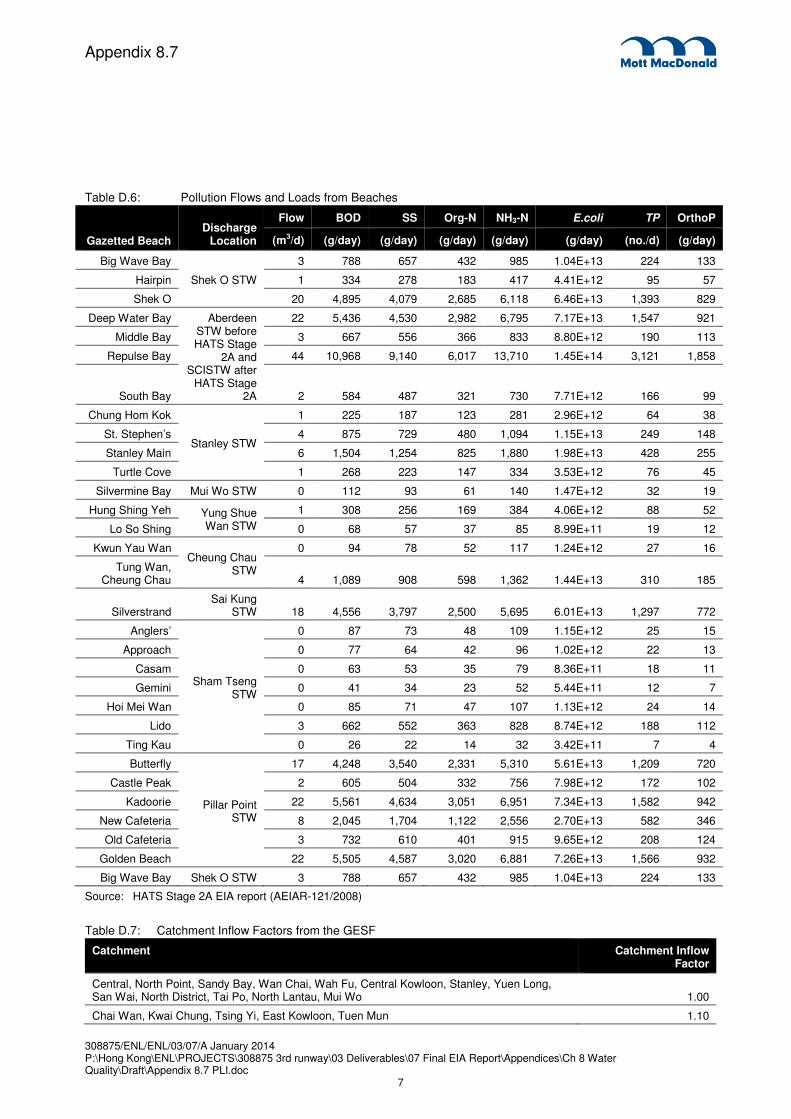
would be connected to the sewerage system. Table D.5 and Table D.6 show the pollution load of relevant
landfills and beaches adopted under the HATS Stage 2A EIA within the assessment area. As these
pollution loads are not anticipated to change significantly with time, the same loads are adopted for the
year 2026. Due to the expansion of the WENT landfills, the WPCO discharge license limits for relevant
parameters were adopted for a worst case scenario. The beach loading was included for the wet season
308875/ENL/ENL/03/07/A January 2014 P:\Hong Kong\ENL\PROJECTS\308875 3rd runway\03 Deliverables\07 Final EIA Report\Appendices\Ch 8 Water Quality\Draft\Appendix 8.7 PLI.doc
6
Appendix 8.7
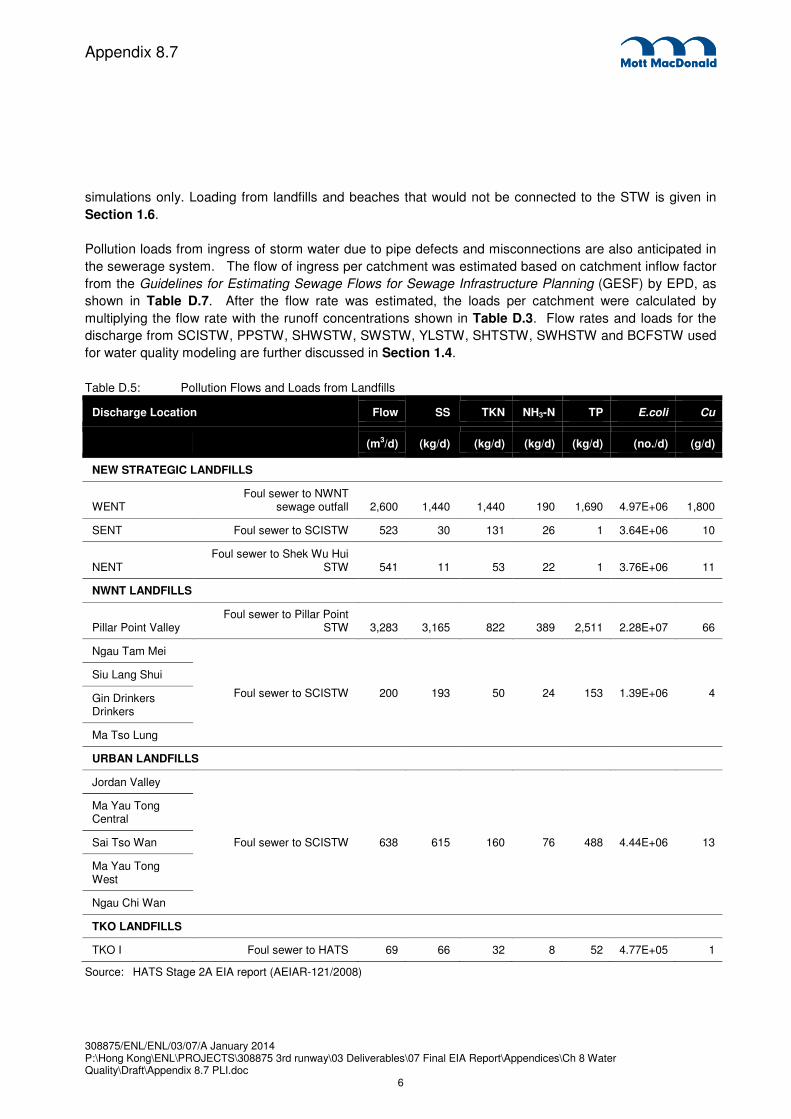
simulations only. Loading from landfills and beaches that would not be connected to the STW is given in
Section 1.6.
Pollution loads from ingress of storm water due to pipe defects and misconnections are also anticipated in
the sewerage system. The flow of ingress per catchment was estimated based on catchment inflow factor
from the Guidelines for Estimating Sewage Flows for Sewage Infrastructure Planning (GESF) by EPD, as
shown in Table D.7. After the flow rate was estimated, the loads per catchment were calculated by
multiplying the flow rate with the runoff concentrations shown in Table D.3. Flow rates and loads for the
discharge from SCISTW, PPSTW, SHWSTW, SWSTW, YLSTW, SHTSTW, SWHSTW and BCFSTW used
for water quality modeling are further discussed in Section 1.4.
Table D.5: Pollution Flows and Loads from Landfills
Discharge Location Flow SS TKN NH3-N TP E.coli Cu
(m3/d) (kg/d) (kg/d) (kg/d) (kg/d) (no./d) (g/d)
NEW STRATEGIC LANDFILLS
WENT Foul sewer to NWNT
sewage outfall 2,600 1,440 1,440 190 1,690 4.97E+06 1,800
SENT Foul sewer to SCISTW 523 30 131 26 1 3.64E+06 10
NENT Foul sewer to Shek Wu Hui
STW 541 11 53 22 1 3.76E+06 11
NWNT LANDFILLS
Pillar Point Valley Foul sewer to Pillar Point
STW 3,283 3,165 822 389 2,511 2.28E+07 66
Ngau Tam Mei
Foul sewer to SCISTW 200 193 50 24 153 1.39E+06 4
Siu Lang Shui
Gin Drinkers Drinkers
Ma Tso Lung
URBAN LANDFILLS
Jordan Valley
Foul sewer to SCISTW 638 615 160 76 488 4.44E+06 13
Ma Yau Tong Central
Sai Tso Wan
Ma Yau Tong West
Ngau Chi Wan
TKO LANDFILLS
TKO I Foul sewer to HATS 69 66 32 8 52 4.77E+05 1
Source: HATS Stage 2A EIA report (AEIAR-121/2008)
308875/ENL/ENL/03/07/A January 2014 P:\Hong Kong\ENL\PROJECTS\308875 3rd runway\03 Deliverables\07 Final EIA Report\Appendices\Ch 8 Water Quality\Draft\Appendix 8.7 PLI.doc
7
Appendix 8.7
Table D.6: Pollution Flows and Loads from Beaches
Gazetted Beach Discharge
Location
Flow BOD SS Org-N NH3-N E.coli TP OrthoP
(m3/d) (g/day) (g/day) (g/day) (g/day) (g/day) (no./d) (g/day)
Big Wave Bay
Shek O STW
3 788 657 432 985 1.04E+13 224 133
Hairpin 1 334 278 183 417 4.41E+12 95 57
Shek O 20 4,895 4,079 2,685 6,118 6.46E+13 1,393 829
Deep Water Bay Aberdeen STW before HATS Stage
2A and SCISTW after
HATS Stage 2A
22 5,436 4,530 2,982 6,795 7.17E+13 1,547 921
Middle Bay 3 667 556 366 833 8.80E+12 190 113
Repulse Bay 44 10,968 9,140 6,017 13,710 1.45E+14 3,121 1,858
South Bay 2 584 487 321 730 7.71E+12 166 99
Chung Hom Kok
Stanley STW
1 225 187 123 281 2.96E+12 64 38
St. Stephen’s 4 875 729 480 1,094 1.15E+13 249 148
Stanley Main 6 1,504 1,254 825 1,880 1.98E+13 428 255
Turtle Cove 1 268 223 147 334 3.53E+12 76 45
Silvermine Bay Mui Wo STW 0 112 93 61 140 1.47E+12 32 19
Hung Shing Yeh Yung Shue Wan STW
1 308 256 169 384 4.06E+12 88 52
Lo So Shing 0 68 57 37 85 8.99E+11 19 12
Kwun Yau Wan Cheung Chau
STW
0 94 78 52 117 1.24E+12 27 16
Tung Wan, Cheung Chau 4 1,089 908 598 1,362 1.44E+13 310 185
Silverstrand Sai Kung
STW 18 4,556 3,797 2,500 5,695 6.01E+13 1,297 772
Anglers’
Sham Tseng STW
0 87 73 48 109 1.15E+12 25 15
Approach 0 77 64 42 96 1.02E+12 22 13
Casam 0 63 53 35 79 8.36E+11 18 11
Gemini 0 41 34 23 52 5.44E+11 12 7
Hoi Mei Wan 0 85 71 47 107 1.13E+12 24 14
Lido 3 662 552 363 828 8.74E+12 188 112
Ting Kau 0 26 22 14 32 3.42E+11 7 4
Butterfly
Pillar Point STW
17 4,248 3,540 2,331 5,310 5.61E+13 1,209 720
Castle Peak 2 605 504 332 756 7.98E+12 172 102
Kadoorie 22 5,561 4,634 3,051 6,951 7.34E+13 1,582 942
New Cafeteria 8 2,045 1,704 1,122 2,556 2.70E+13 582 346
Old Cafeteria 3 732 610 401 915 9.65E+12 208 124
Golden Beach 22 5,505 4,587 3,020 6,881 7.26E+13 1,566 932
Big Wave Bay Shek O STW 3 788 657 432 985 1.04E+13 224 133
Source: HATS Stage 2A EIA report (AEIAR-121/2008)
Table D.7: Catchment Inflow Factors from the GESF
Catchment Catchment Inflow Factor
Central, North Point, Sandy Bay, Wan Chai, Wah Fu, Central Kowloon, Stanley, Yuen Long, San Wai, North District, Tai Po, North Lantau, Mui Wo 1.00
Chai Wan, Kwai Chung, Tsing Yi, East Kowloon, Tuen Mun 1.10
308875/ENL/ENL/03/07/A January 2014 P:\Hong Kong\ENL\PROJECTS\308875 3rd runway\03 Deliverables\07 Final EIA Report\Appendices\Ch 8 Water Quality\Draft\Appendix 8.7 PLI.doc
8
Appendix 8.7
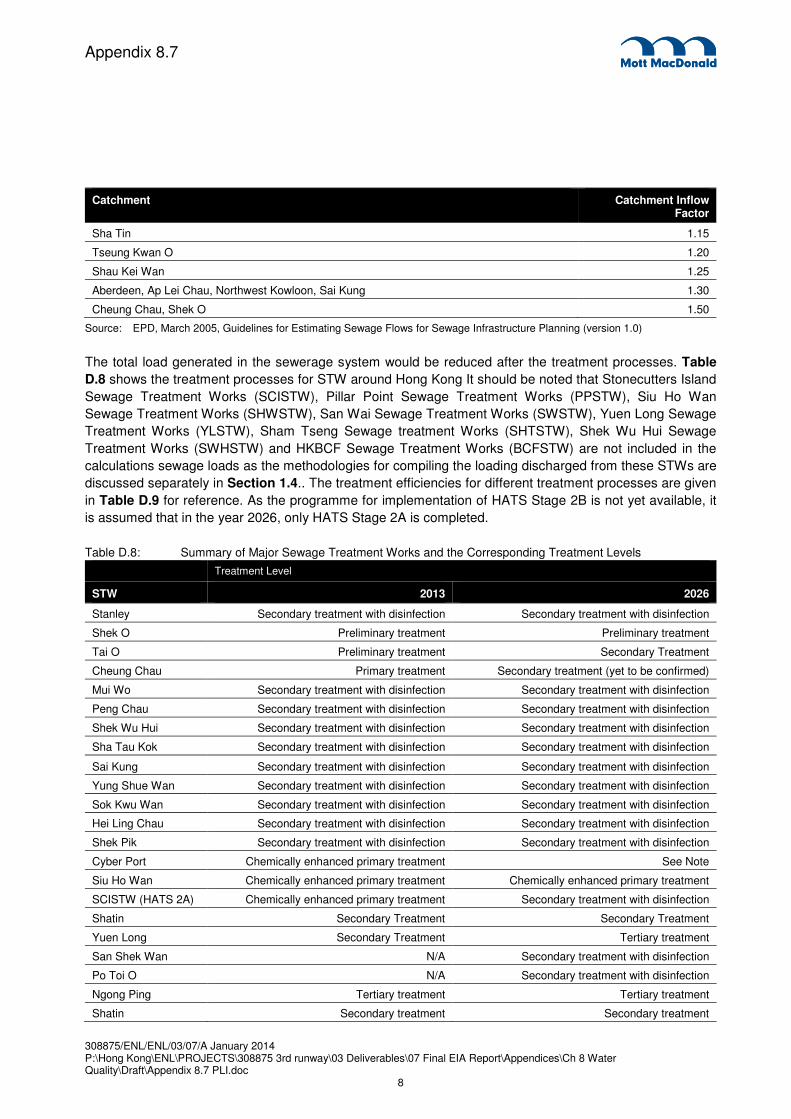
Catchment Catchment Inflow Factor
Sha Tin 1.15
Tseung Kwan O 1.20
Shau Kei Wan 1.25
Aberdeen, Ap Lei Chau, Northwest Kowloon, Sai Kung 1.30
Cheung Chau, Shek O 1.50
Source: EPD, March 2005, Guidelines for Estimating Sewage Flows for Sewage Infrastructure Planning (version 1.0)
The total load generated in the sewerage system would be reduced after the treatment processes. Table
D.8 shows the treatment processes for STW around Hong Kong It should be noted that Stonecutters Island
Sewage Treatment Works (SCISTW), Pillar Point Sewage Treatment Works (PPSTW), Siu Ho Wan
Sewage Treatment Works (SHWSTW), San Wai Sewage Treatment Works (SWSTW), Yuen Long Sewage
Treatment Works (YLSTW), Sham Tseng Sewage treatment Works (SHTSTW), Shek Wu Hui Sewage
Treatment Works (SWHSTW) and HKBCF Sewage Treatment Works (BCFSTW) are not included in the
calculations sewage loads as the methodologies for compiling the loading discharged from these STWs are
discussed separately in Section 1.4.. The treatment efficiencies for different treatment processes are given
in Table D.9 for reference. As the programme for implementation of HATS Stage 2B is not yet available, it
is assumed that in the year 2026, only HATS Stage 2A is completed.
Table D.8: Summary of Major Sewage Treatment Works and the Corresponding Treatment Levels
Treatment Level
STW 2013 2026
Stanley Secondary treatment with disinfection Secondary treatment with disinfection
Shek O Preliminary treatment Preliminary treatment
Tai O Preliminary treatment Secondary Treatment
Cheung Chau Primary treatment Secondary treatment (yet to be confirmed)
Mui Wo Secondary treatment with disinfection Secondary treatment with disinfection
Peng Chau Secondary treatment with disinfection Secondary treatment with disinfection
Shek Wu Hui Secondary treatment with disinfection Secondary treatment with disinfection
Sha Tau Kok Secondary treatment with disinfection Secondary treatment with disinfection
Sai Kung Secondary treatment with disinfection Secondary treatment with disinfection
Yung Shue Wan Secondary treatment with disinfection Secondary treatment with disinfection
Sok Kwu Wan Secondary treatment with disinfection Secondary treatment with disinfection
Hei Ling Chau Secondary treatment with disinfection Secondary treatment with disinfection
Shek Pik Secondary treatment with disinfection Secondary treatment with disinfection
Cyber Port Chemically enhanced primary treatment See Note
Siu Ho Wan Chemically enhanced primary treatment Chemically enhanced primary treatment
SCISTW (HATS 2A) Chemically enhanced primary treatment Secondary treatment with disinfection
Shatin Secondary Treatment Secondary Treatment
Yuen Long Secondary Treatment Tertiary treatment
San Shek Wan N/A Secondary treatment with disinfection
Po Toi O N/A Secondary treatment with disinfection
Ngong Ping Tertiary treatment Tertiary treatment
Shatin Secondary treatment Secondary treatment

308875/ENL/ENL/03/07/A January 2014 P:\Hong Kong\ENL\PROJECTS\308875 3rd runway\03 Deliverables\07 Final EIA Report\Appendices\Ch 8 Water Quality\Draft\Appendix 8.7 PLI.doc
9
Appendix 8.7
Treatment Level
STW 2013 2026
Tai Po Secondary treatment Secondary treatment
Yuen Long Secondary treatment Secondary treatment with disinfection
San Shek Wan N/A Secondary treatment with disinfection
Source:
1. HATS Stage 2A EIA report (AEIAR-121/2008)
2. Upgrading of Cheung Chau Sewage Collection, Treatment and Disposal Facilities Project Profile (PP-407/2009)
3. Upgrading of Tai O Sewage Collection, Treatment and Disposal Facilities Project Profile (PP-406/2009)
4. Expansion of Sha Tau Kok Sewage Treatment Works Project Profile (PP-474/2012)
5. Port Shelter Sewerage, Stage3 - Sewerage Works at Po Toi O Project Profile (PP-458/2012)
6. Effluent Polishing Scheme at Yuen Long Sewage Treatment Works Project Profile (PP-458/2012)
Note: Effluent from Cyberport STW would be discharged to the SCISTW under HATS Stage 2A by 2014.
Table D.9: Treatment Efficiency for Treatment Works
Types of Treatment Plant BOD5 TSS NH3-N Org-N OrthoP TP Cu E.coli
Screening Plants1 0% 0% 0% 0% 0% 0% 0% 0%
Primary Treatment (no disinfection) 32.50% 55% 0% 15% 0% 15% 26% 50%
Primary Treatment (with disinfection) 32.50% 55% 0% 15% 0% 15% 26% 99.95%
Chemical Enhanced Primary Treatment (with no disinfection)2 55% 70% 10% 45%3 60% 60% 80% 50%
Chemical Enhanced Primary Treatment (with disinfection)2 55% 70% 10% 45%3 60% 60% 80% 99.95%
Secondary Treatment (no disinfection) 85% 90% 75% 80% 35% 50% 74% 94%
Secondary Treatment (with disinfection) 85% 90% 75% 80% 35% 50% 74% 99.97%
Tertiary treatment 95% 99% 89% 95% 70% 85% 89% 100%
Source:
1. HATS Stage 2A EIA report (AEIAR-121/2008)
2. Ngong Ping Sewage Treatment Works and Sewerage EIA report (AEIAR-065/2002)
Note:
1. It is assumed that the reduction of the pollution parameters is insignificant in screening plants. Therefore, the removal rates for these parameters were all assumed zero.
2. Based on estimation from the SSDS EIA Study: Technical Note 1 (Revised) Wastewater Flows and Loads and Effluent Characteristics.
3. The removal rate of org-N is calculated from the removal rates of NH3-N and total N (10% and 25% respectively) assuming that NH3-N contributes about 57% of total N in raw sewage.
1.3 Pollution Loads From Domestic, Commercial and Industrial Activities
1.3.1 Time Aspect
Territorial Population and Employment Data Matrix (TPEDM) for population and employment provided by
the Planning Department (PlanD) was used to compile the pollution loads from domestic, commercial and
industrial activities for the operation Year 2026. The latest available TPEDM is the 2011-based version, and
the previous version is 2009-based. A decrease in the usual resident population for the 2026 forecast is
observed in the latest 2011-based Territorial Population and Employment Data Matrix (TPEDM) by about

308875/ENL/ENL/03/07/A January 2014 P:\Hong Kong\ENL\PROJECTS\308875 3rd runway\03 Deliverables\07 Final EIA Report\Appendices\Ch 8 Water Quality\Draft\Appendix 8.7 PLI.doc
10
Appendix 8.7
3% when compared with the 2009-based TPEDM. Since the population data would govern the total
sewage load, it is anticipated that the total sewage load generated from 2009-based TPEDM will be greater
than that from 2011-based TPEDM. For a more conservation approach, the 2009-based TPEDM was
adopted for use.
1.3.2 Spatial Aspect
To facilitate the estimation of pollution loading, the population and employment data are required to be
presented at the level of catchment areas shown in Figure D.2.
1.3.3 Data Manipulation
The planning data provide the number of usual residents, mobile residents and school places within the
territory at PVS zones. Employment population is divided by 12 job types as listed below:
� J1 Manufacture
� J2 Electricity, gas & water
� J3 Transport, storage & communication
� J4 Wholesale and retail
� J5 Import & export
� J6 Financial, insurance, real estate & business services
� J7 Agriculture & fishery
� J8 Mining & quarrying
� J9 Construction
� J10 Restaurants, hotels & boarding houses
� J11 Community, social & personal services
� J12 Public administration
The population data were manipulated and presented in the following categories:
� Residential population (by usual residents and mobile residents)
� Transient Population (by total employment number and total school places), where total employment
=J1+J2+J3+J4+J5+J6+J7+J8+J9+J10+J11+J12
� Number of employees in commercial sector (by J2, J3, J4, J9, J10 & J11)
The domestic pollution load to be generated from a catchment would be affected by the number of resident
population, transient population and the total employee number within the catchment. It is considered that
308875/ENL/ENL/03/07/A January 2014 P:\Hong Kong\ENL\PROJECTS\308875 3rd runway\03 Deliverables\07 Final EIA Report\Appendices\Ch 8 Water Quality\Draft\Appendix 8.7 PLI.doc
11
Appendix 8.7
commercial effluents are contributed from job J2 to J4 and J9 to J11. Industrial effluents are contributed
from job type J1.
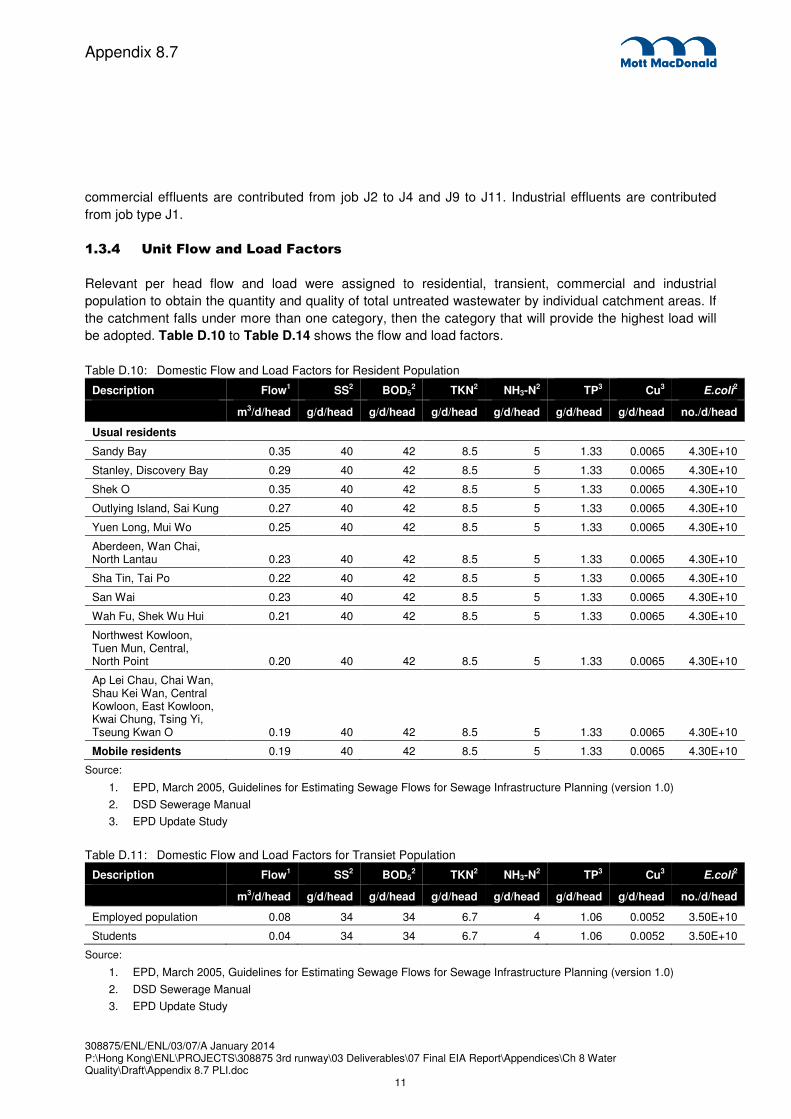
1.3.4 Unit Flow and Load Factors
Relevant per head flow and load were assigned to residential, transient, commercial and industrial
population to obtain the quantity and quality of total untreated wastewater by individual catchment areas. If
the catchment falls under more than one category, then the category that will provide the highest load will
be adopted. Table D.10 to Table D.14 shows the flow and load factors.
Table D.10: Domestic Flow and Load Factors for Resident Population
Description Flow1 SS2 BOD52 TKN2 NH3-N
2 TP3 Cu3 E.coli2
m3/d/head g/d/head g/d/head g/d/head g/d/head g/d/head g/d/head no./d/head
Usual residents
Sandy Bay 0.35 40 42 8.5 5 1.33 0.0065 4.30E+10
Stanley, Discovery Bay 0.29 40 42 8.5 5 1.33 0.0065 4.30E+10
Shek O 0.35 40 42 8.5 5 1.33 0.0065 4.30E+10
Outlying Island, Sai Kung 0.27 40 42 8.5 5 1.33 0.0065 4.30E+10
Yuen Long, Mui Wo 0.25 40 42 8.5 5 1.33 0.0065 4.30E+10
Aberdeen, Wan Chai, North Lantau 0.23 40 42 8.5 5 1.33 0.0065 4.30E+10
Sha Tin, Tai Po 0.22 40 42 8.5 5 1.33 0.0065 4.30E+10
San Wai 0.23 40 42 8.5 5 1.33 0.0065 4.30E+10
Wah Fu, Shek Wu Hui 0.21 40 42 8.5 5 1.33 0.0065 4.30E+10
Northwest Kowloon, Tuen Mun, Central, North Point 0.20 40 42 8.5 5 1.33 0.0065 4.30E+10
Ap Lei Chau, Chai Wan, Shau Kei Wan, Central Kowloon, East Kowloon, Kwai Chung, Tsing Yi, Tseung Kwan O 0.19 40 42 8.5 5 1.33 0.0065 4.30E+10
Mobile residents 0.19 40 42 8.5 5 1.33 0.0065 4.30E+10
Source:
1. EPD, March 2005, Guidelines for Estimating Sewage Flows for Sewage Infrastructure Planning (version 1.0)
2. DSD Sewerage Manual
3. EPD Update Study
Table D.11: Domestic Flow and Load Factors for Transiet Population
Description Flow1 SS2 BOD52 TKN2 NH3-N
2 TP3 Cu3 E.coli2
m3/d/head g/d/head g/d/head g/d/head g/d/head g/d/head g/d/head no./d/head
Employed population 0.08 34 34 6.7 4 1.06 0.0052 3.50E+10
Students 0.04 34 34 6.7 4 1.06 0.0052 3.50E+10
Source:
1. EPD, March 2005, Guidelines for Estimating Sewage Flows for Sewage Infrastructure Planning (version 1.0)
2. DSD Sewerage Manual
3. EPD Update Study

308875/ENL/ENL/03/07/A January 2014 P:\Hong Kong\ENL\PROJECTS\308875 3rd runway\03 Deliverables\07 Final EIA Report\Appendices\Ch 8 Water Quality\Draft\Appendix 8.7 PLI.doc
12
Appendix 8.7
Table D.12: Domestic Flow and Load Factors for Transient Population
ID Description Flow1 SS2 BOD52 TKN2 NH3-N
2 TP3 E.coli2
m3/d/employee g/d/head g/d/head g/d/head g/d/head g/d/head no./d/head
J2 Electricity Gas & Water 0.25 25 53 2.5 0.8 0.53 0
J3 Transport, Storage &
Communication 0.10 25 53 2.5 0.8 0.53 0
J4 Wholesale & Retail 0.20 25 53 2.5 0.8 0.53 0
J9 Construction 0.15 25 53 2.5 0.8 0.53 0
J10 Restaurants & Hotels 1.50 25 53 2.5 0.8 0.53 0
J11 Community, Social &
Personal Services 0.20 25 53 2.5 0.8 0.53 0
Source:
1. EPD, March 2005, Guidelines for Estimating Sewage Flows for Sewage Infrastructure Planning (version 1.0)
2. DSD Sewerage Manual
3. EPD Update Study
Table D.13: Flow Factors for Industrial Activities
Catchment Flow1
m3/d/employee
J1 Manufacturing
Hong Kong Island (except Aberdeen & Ap Lei Chau), San Po Kong 0.25
North West Kowloon 0.45
East Kowloon, Sha Tin, Lantau Island (except Mui Wo) 0.45
Central Kowloon, North District, Aberdeen, Ap Lei Chau 0.55
Tsuen Wan, Kwai Chung 0.65
Tai Po 0.75
Tuen Mun, Tseung Kwan O, Yau Tong, Cheung Chau, Mui Wo 1
Tsing Yi 1.5
Sai Kung, Yuen Long 2
Source: EPD, March 2005, Guidelines for Estimating Sewage Flows for Sewage Infrastructure Planning (version 1.0)
Table D.14: Load Factors for Industrial Activities
Category SS2 BOD52 TKN2 NH3-N
2 Cu3 E.coli2
g/d/head g/d/head g/d/head g/d/head g/d/head no./d/head
J1 Manufacturing
Food 502 713 39 0 0 0
Textiles 2,095 3,680 67 0 4.4 0
Leather 115 115 29 7 0.1 0
Paper 2,228 2,150 33 0 0 0
Manufacturing 355 931 0 0 2.4 0
Machinery 40 90 29 22 0.9 0
Source: EPD Update Study
Note: * The maximum load parameter for the six categories of manufacturing was adopted for use.
308875/ENL/ENL/03/07/A January 2014 P:\Hong Kong\ENL\PROJECTS\308875 3rd runway\03 Deliverables\07 Final EIA Report\Appendices\Ch 8 Water Quality\Draft\Appendix 8.7 PLI.doc
13
Appendix 8.7
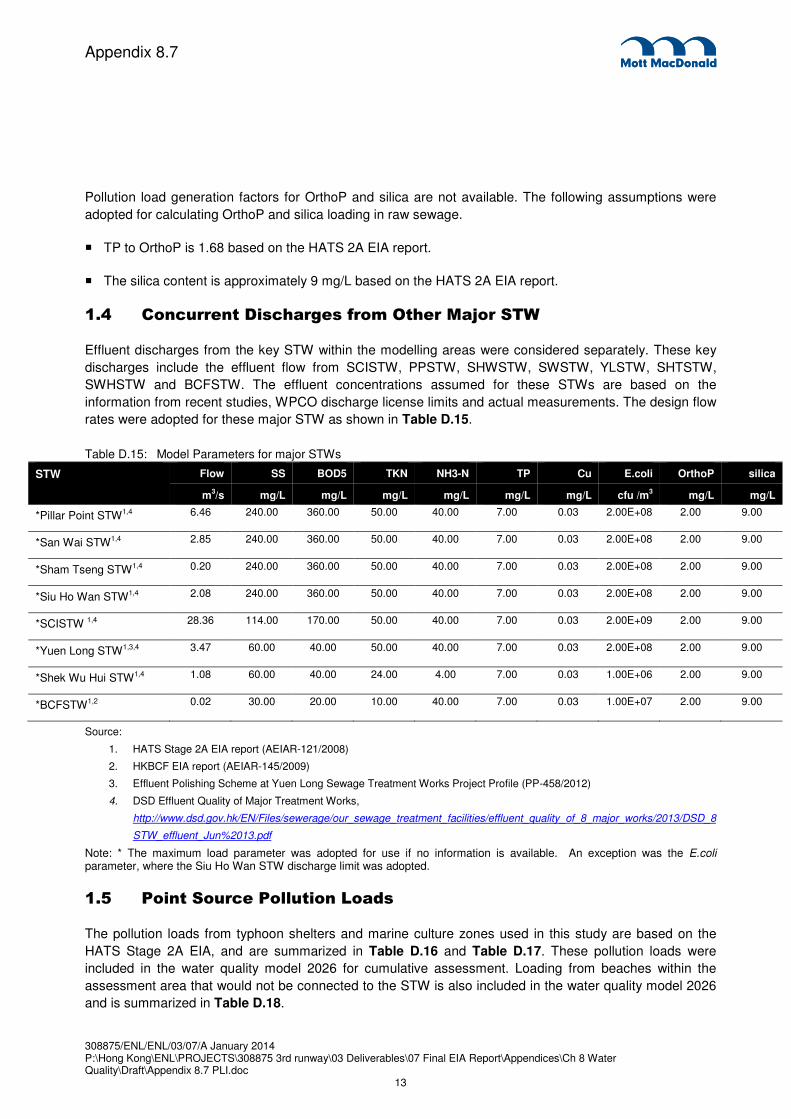
Pollution load generation factors for OrthoP and silica are not available. The following assumptions were
adopted for calculating OrthoP and silica loading in raw sewage.
� TP to OrthoP is 1.68 based on the HATS 2A EIA report.
� The silica content is approximately 9 mg/L based on the HATS 2A EIA report.
1.4 Concurrent Discharges from Other Major STW
Effluent discharges from the key STW within the modelling areas were considered separately. These key
discharges include the effluent flow from SCISTW, PPSTW, SHWSTW, SWSTW, YLSTW, SHTSTW,
SWHSTW and BCFSTW. The effluent concentrations assumed for these STWs are based on the
information from recent studies, WPCO discharge license limits and actual measurements. The design flow
rates were adopted for these major STW as shown in Table D.15.
Table D.15: Model Parameters for major STWs
STW Flow SS BOD5 TKN NH3-N TP Cu E.coli OrthoP silica
m3/s mg/L mg/L mg/L mg/L mg/L mg/L cfu /m
3 mg/L mg/L
*Pillar Point STW1,4 6.46 240.00 360.00 50.00 40.00 7.00 0.03 2.00E+08 2.00 9.00
*San Wai STW1,4 2.85 240.00 360.00 50.00 40.00 7.00 0.03 2.00E+08 2.00 9.00
*Sham Tseng STW1,4 0.20 240.00 360.00 50.00 40.00 7.00 0.03 2.00E+08 2.00 9.00
*Siu Ho Wan STW1,4 2.08 240.00 360.00 50.00 40.00 7.00 0.03 2.00E+08 2.00 9.00
*SCISTW 1,4 28.36 114.00 170.00 50.00 40.00 7.00 0.03 2.00E+09 2.00 9.00
*Yuen Long STW1,3,4 3.47 60.00 40.00 50.00 40.00 7.00 0.03 2.00E+08 2.00 9.00
*Shek Wu Hui STW1,4 1.08 60.00 40.00 24.00 4.00 7.00 0.03 1.00E+06 2.00 9.00
*BCFSTW1,2 0.02 30.00 20.00 10.00 40.00 7.00 0.03 1.00E+07 2.00 9.00
Source:
1. HATS Stage 2A EIA report (AEIAR-121/2008)
2. HKBCF EIA report (AEIAR-145/2009)
3. Effluent Polishing Scheme at Yuen Long Sewage Treatment Works Project Profile (PP-458/2012)
4. DSD Effluent Quality of Major Treatment Works,
http://www.dsd.gov.hk/EN/Files/sewerage/our_sewage_treatment_facilities/effluent_quality_of_8_major_works/2013/DSD_8
STW_effluent_Jun%2013.pdf
Note: * The maximum load parameter was adopted for use if no information is available. An exception was the E.coli parameter, where the Siu Ho Wan STW discharge limit was adopted.
1.5 Point Source Pollution Loads
The pollution loads from typhoon shelters and marine culture zones used in this study are based on the
HATS Stage 2A EIA, and are summarized in Table D.16 and Table D.17. These pollution loads were
included in the water quality model 2026 for cumulative assessment. Loading from beaches within the
assessment area that would not be connected to the STW is also included in the water quality model 2026
and is summarized in Table D.18.

308875/ENL/ENL/03/07/A January 2014 P:\Hong Kong\ENL\PROJECTS\308875 3rd runway\03 Deliverables\07 Final EIA Report\Appendices\Ch 8 Water Quality\Draft\Appendix 8.7 PLI.doc
14
Appendix 8.7
Table D.16: Pollution Flows and Loads from Typhoon Shelter
Typhoon Shelters
Flow BOD SS Org-N NH3-N E.coli Cu TP OrthoP Silicate
m3/d g/d g/d g/d g/d no./d g/d g/d g/d g/d
Shau Kei Wan 149 41,670 39,686 3,473 4,961 4.27E+14 6 1,320 785 1,279
Sam Ka Tsuen 39 10,803 10,289 900 1,286 1.11E+13 2 342 204 332
Kwun Tong 22 6,055 5,766 505 721 6.20E+12 1 192 114 186
Causeway Bay 179 50,099 47,714 4,175 5,964 5.13E+13 8 1,586 944 1,538
Yau Ma Tei 184 51,643 49,183 4,304 6,148 5.29E+13 8 1,635 973 1,586
Rambler Channel 36 10,032 9,554 836 1,194 1.03E+13 2 318 189 308
Aberdeen 388 108,746 103,568 9,062 12,946 1.11E+14 17 3,444 2,050 3,339
Tuen Mun 138 38,643 36,803 3,220 4,600 3.96E+13 6 1,224 728 1,186
Cheung Chau 166 46,597 44,378 3,883 5,547 4.77E+13 7 1,476 878 1,431
Chai Wan 44 12,347 11,759 1,029 1,470 1.26E+13 2 391 233 379
To Kwa Wan 53 14,840 14,133 1,237 1,767 1.52E+13 2 470 280 456
Source: HATS Stage 2A EIA report (AEIAR-121/2008)
Table D.17: Pollution Flows and Loads from Marine Culture Zone
Typhoon Shelters BOD SS Org-N NH3-N TP OrthoP
g/d g/d g/d g/d g/d g/d
Sham Wan 42,948 125,333 10,604 38,202 2,045 1,600
Kai Lung Wan 6,432 18,769 1,588 5,721 306 240
Ma Nam Wat 9,536 27,829 2,355 8,482 454 355
Po Toi O 9,084 26,510 2,243 8,080 432 339
Po Toi 33,579 97,990 8,291 29,868 1,599 1,251
Sok Kwu Wan 25,969 75,783 6,412 23,099 1,236 968
Lo Tik Wan 11,011 32,131 2,719 9,794 524 410
Ma Wan 50,939 148,650 12,577 45,310 2,425 1,898
Cheung Sha Wan 19,025 55,518 4,697 16,922 906 709
Tung Lung Chau 18,996 55,518 2,358 16,992 640 562
Source: HATS Stage 2A EIA report (AEIAR-121/2008)
Table D.18: Pollution Flows and Loads from Beaches
Gazetted Beach Flow BOD SS Org-N NH3-N E.coli TP OrthoP
m3/d g/d g/d g/d g/d no./d g/d g/d
Cheung Sha Lower 1 245 204 135 307 3.24E+12 70 42
Cheung Sha Upper 0 95 79 52 118 1.25E+12 27 16
Pui O 1 152 126 83 190 2.00E+12 43 26
Tong Fuk 1 188 156 103 234 2.48E+12 53 32
Tung Wan, Ma Wan 2 485 404 266 607 6.40E+12 138 82
Clear Water Bay 2nd 46 11,385 9,487 6,246 14,231 1.50E+14 3,240 1,928
Source: HATS Stage 2A EIA report (AEIAR-121/2008)
308875/ENL/ENL/03/07/A January 2014 P:\Hong Kong\ENL\PROJECTS\308875 3rd runway\03 Deliverables\07 Final EIA Report\Appendices\Ch 8 Water Quality\Draft\Appendix 8.7 PLI.doc
15
Appendix 8.7
1. Drainage Service Department, DSD Sewerage Manual
2. Environmental Protection Department, Guidelines for Estimating Sewage Flows for Sewage
Infrastructure Planning (Version 1.0), March 2005
3. Highways Department, EIA Report (ref. EIA-173/2009) for Hong Kong Boundary Crossing Facilities.
4. Highways Department, EIA Report (ref. EIA-174/2009) for Tuen Mun - Chek Lap Kok Link
5. Highways Department, EIA Report (ref. EIA-172/2009) for Hong Kong - Zhuhai - Macao Bridge Hong
Kong Link Road
6. Drainage Service Department, EIA Report (ref. EIA-148/2008) for Harbour Area Treatment Scheme
(HATS) Stage 2A
7. HKSAR Government website, Administrative Map
References
308875/ENL/ENL/03/07/A January 2014 P:\Hong Kong\ENL\PROJECTS\308875 3rd runway\03 Deliverables\07 Final EIA Report\Appendices\Ch 8 Water Quality\Draft\Appendix 8.7 PLI.doc
16
Appendix 8.7
Figure D.1 Location of Pollution Loading Inventory Input Points

M18
M20
M21
M22
M26
TS5
HLA
HLBMWA
PCA
TMA
WTA
HSGSPA
LIC
NWE
TOA
LIB
SSW
TC8
TC9
TMS3TMS4
TMS5
P7
P8
P9
P10
P11
P12
P13
P14
P15
LEGEND:
TYPHOON SHELTER
MARINE CULTURE ZONE
OUTFALLS FROM CONCURRENT PROJECTS
NON-POINT SOURCES OUTSIDE HKSAR
STW OUTFALL
STORMWATER OUTFALL
PROJECT BOUNDARY
HKSAR BOUNDARY
POLLUTION LOADING SOURCES
SW1
YL2
TM5
TM1TM2 TM3
TM4WT7
WT9
WT8
WT3WT2 WT1
TW7
TW9
TW8
TW10
NW23
NW20
NW19
NW18
NW17
NS3
A1
A2
A3A4
A5
A6
A7
NL19
NL20
NL21
NL22
TO1
TO2
TO3
SP1
SL1
SL2
SL3SL4
SL5SL6
SL7
SH1CC11
CM1
CM2
MW1
MW2
PC1
TU1
PT1
GL1CE1CE2CE3
WC7
WC8WC9
HS14
HS20
PF1
PF2
PF3
LI1
LI2
LI3
PTO
YLS
AN1
AN2
AN5
AN6
SWH
GAZETTED BEACH~
~~
~
BP1
BP3
BP4
BP2
BP7
~~
TS9
TS8
M24
M28
STORM OUTFALL / SPENT COOLING
A13
AN4
A8A9
A10A11
A12
AN3
TS6
TYP1
TYP2
IWMF
TW6
NL10NL11 NL12
TMS6TMS7
AL6 HS8 HS21,HS22HS23,HS24HS25,HS26
TMS2
WT5WT6
DE8
DE7
DE6
DE5
DE3, DE4DE1, DE2
WT4
TW1
TW11
NS2
NS4
NS5
NS15NS16NS17
TS3TS13
EK12
TS2
TK1 TK2
TK3BP9~CS5
CS24
CS13
CS14
TS12
CS23
TS1
NS9
WE6
CE4CE5
HS1HS2
HS3
HS9
HS11HS12
HS13
HS18
HS19
HS15
HSF
CCB
CC5
CC7
CC6CC12
CC8CC9
CC10
CC4
CC3CC2
CC1
N1
TMC
NLA
NPA
Filename: J:\308875\REPORT\ENV\EIA\140227\FIG D-1.dgn
Copyright in this document and all proprietary rights in the information it contains belong to the AA. It is a condition of the supply of this document, in whatever form,
that the recipient shall hold it in confidence and shall not duplicate or otherwise reproduce it in whole or in part, nor disclose its contents without the written consent of the AA.
Rev. Date Checked EXPANSION OF HONG KONG INTERNATIONAL AIRPORT
INTO A THREE-RUNWAY SYSTEM
Title
Drawing No.
Description
Rev.
Date
Design
Checkers
Design Supervisor
Authorised Representative
Consultant’s Signatures for Approval
User name: Time:28/02/2014 11:40:31yim42169 Plote Date:
Scale at A3
Airport Authority HKIA Tower, 1 Sky Plaza Road, Hong Kong International Airport, Lantau, Hong Kong
Tel : (852) 2188 7111 Fax : (852) 2824 0717
308875/ENL/ENL/03/07/A January 2014 P:\Hong Kong\ENL\PROJECTS\308875 3rd runway\03 Deliverables\07 Final EIA Report\Appendices\Ch 8 Water Quality\Draft\Appendix 8.7 PLI.doc
17
Appendix 8.7
Figure D.2 Sewage Catchment Boundaries
LEGEND:
DISTRICT BOUNDARY
HKSAR BOUNDARY
12
3
5
6
7
8
9
10
12
15
16
19
4.1
4.2
4.3
13.1
13.2
14.1
14.2
11.1
11.2
17.3
17.1
17.218.1
18.2
18.3
18.4
20
21
22
Filename: J:\308875\REPORT\ENV\EIA\140106\FIG D-2.dgn
Copyright in this document and all proprietary rights in the information it contains belong to the AA. It is a condition of the supply of this document, in whatever form,
that the recipient shall hold it in confidence and shall not duplicate or otherwise reproduce it in whole or in part, nor disclose its contents without the written consent of the AA.
Rev. Date Checked EXPANSION OF HONG KONG INTERNATIONAL AIRPORT
INTO A THREE-RUNWAY SYSTEM
Title
Drawing No.
Description
Rev.
Date
Design
Checkers
Design Supervisor
Authorised Representative
Consultant’s Signatures for Approval
User name: Time:20/01/2014 09:40:29yim42169 Plote Date:
Scale at A3
Airport Authority HKIA Tower, 1 Sky Plaza Road, Hong Kong International Airport, Lantau, Hong Kong
Tel : (852) 2188 7111 Fax : (852) 2824 0717


