
POPULATION
DILEMMAS IN
EUROPE
Mr. Schiebel GS8
1
Chapter 15
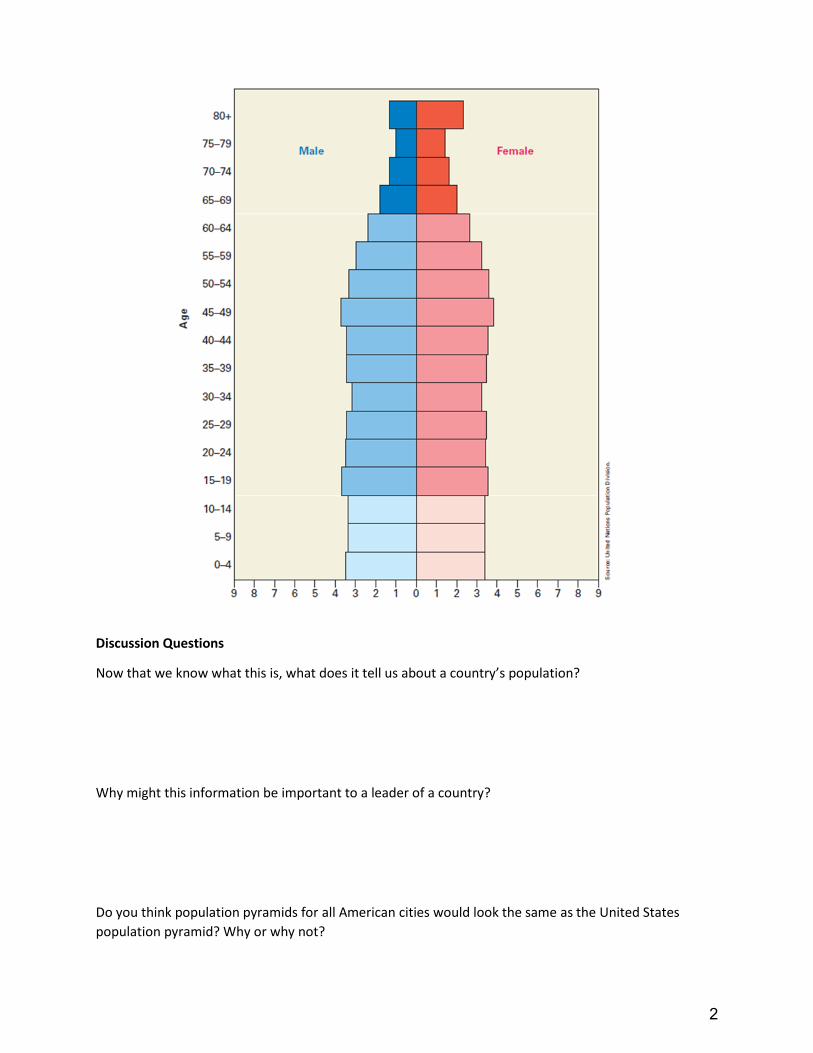
Discussion Questions
Now that we know what this is, what does it tell us about a country’s population?
Why might this information be important to a leader of a country?
Do you think population pyramids for all American cities would look the same as the United States
population pyramid? Why or why not?
2
P r e v i e w
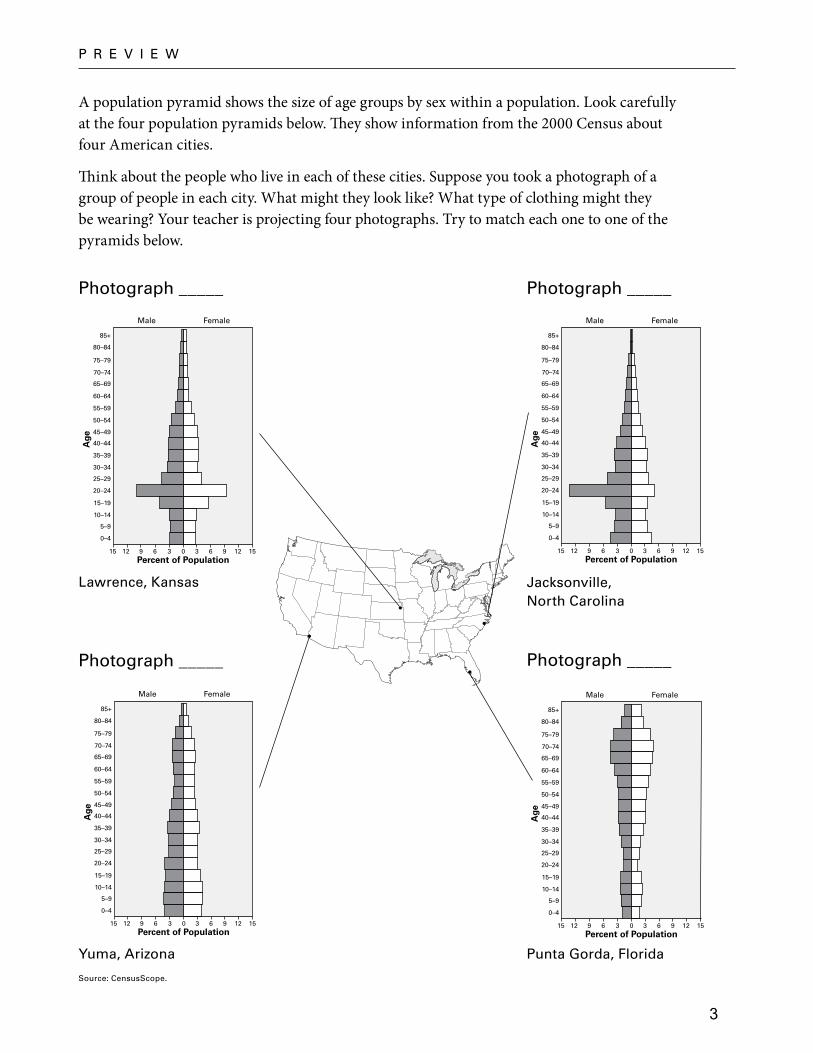
A population pyramid shows the size of age groups by sex within a population. Look carefully at the four population pyramids below. They show information from the 2000 Census about four American cities.
Think about the people who live in each of these cities. Suppose you took a photograph of a group of people in each city. What might they look like? What type of clothing might they be wearing? Your teacher is projecting four photographs. Try to match each one to one of the pyramids below.
Percent of Population
0–4
0 3 6 9 12 153691215
Male Female
5–9
10–14
15–19
20–24
25–29
30–34
35–39
40–44
45–49
50–54
55–59
60–64
65–69
70–74
75–79
80–84
85+
Age
TCI5 324GA_ISN_15_PRE4.epsSecond Proof
Percent of Population
0–4
0 3 6 9 12 153691215
Male Female
5–9
10–14
15–19
20–24
25–29
30–34
35–39
40–44
45–49
50–54
55–59
60–64
65–69
70–74
75–79
80–84
85+
Age
TCI5 325GA_ISN_15_PRE5.epsSecond Proof
Percent of Population
0–4
0 3 6 9 12 153691215
Male Female
5–9
10–14
15–19
20–24
25–29
30–34
35–39
40–44
45–49
50–54
55–59
60–64
65–69
70–74
75–79
80–84
85+
Age
TCI5 323GA_ISN_15_PRE3.epsSecond Proof
Percent of Population
0–4
0 3 6 9 12 153691215
Male Female
5–9
10–14
15–19
20–24
25–29
30–34
35–39
40–44
45–49
50–54
55–59
60–64
65–69
70–74
75–79
80–84
85+
Age
TCI5 322GA_ISN_15_PRE2.epsSecond Proof
Lawrence, Kansas
Yuma, Arizona Punta Gorda, Florida
Jacksonville, North Carolina
Photograph _____ Photograph _____
Photograph _____ Photograph _____
Source: CensusScope.
3

G e O T e r M S
Read Sections 1 and 2. Then create an illustrated dictionary of the Geoterms by completing these tasks:• Create a symbol or an illustration to represent each term.• Write a definition of each term in your own words.• Write a sentence that includes the term and the word Europe.
Geoterm and Symbol Definition Sentence
demography
dependency ratio
life expectancy
replacement rate
total fertility rate
4
Analyzing Population Pyramids
1) What is Demography?
How might demographers use population pyramids?
2) What are total fertility rate and replacement rate?
Why would the bottom of the pyramids be the best place to apply these terms?
Which pyramids represent countries at or about replacement level?
Which pyramids represent countries below replacement level?
3) What is life expectancy?
Why would the top of the pyramids be the best place to apply this term?
Which pyramids represent countries with higher life expectancy?
Which pyramids represent countries with lower life expectancy?
4) What is dependency ratio?
How might the three shades of color (light, medium and dark) on the pyramids help you figure out dependency ratio?
5
r e A D i N G N O T e S
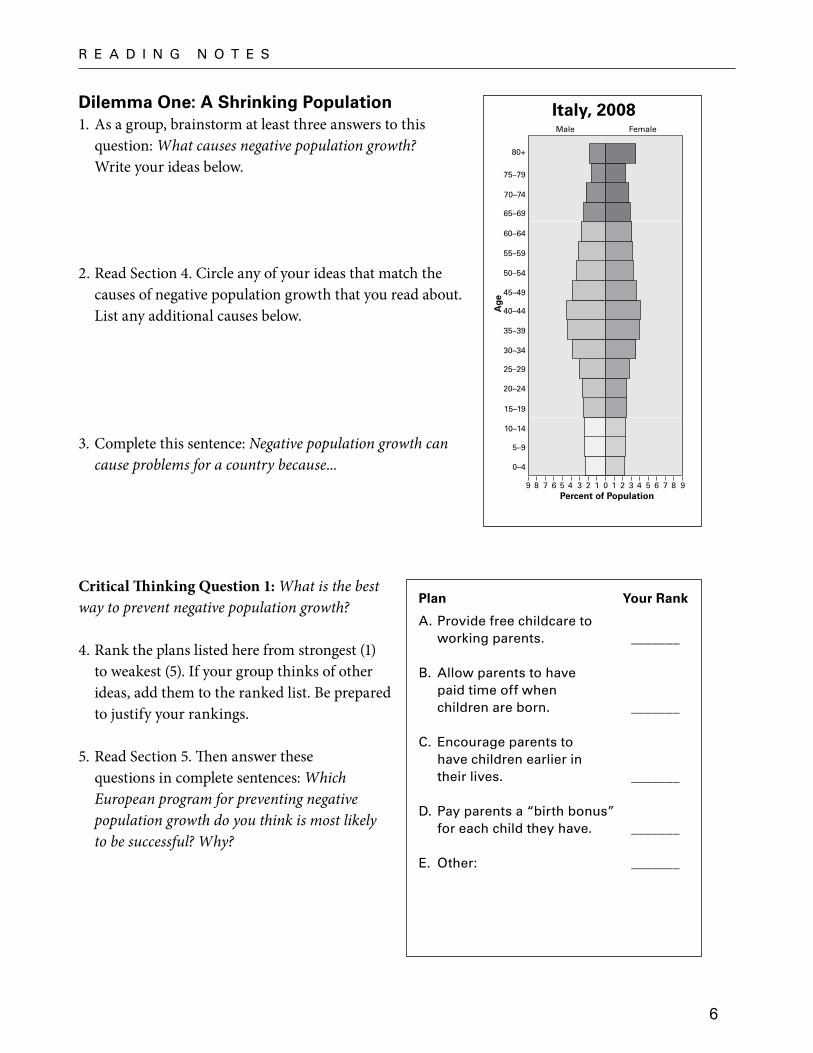
Dilemma One: A Shrinking Population1. As a group, brainstorm at least three answers to this
question: What causes negative population growth? Write your ideas below.
2. Read Section 4. Circle any of your ideas that match thecauses of negative population growth that you read about.List any additional causes below.
3. Complete this sentence: Negative population growth cancause problems for a country because...
Percent of Population
0–4
0 1 2 3 4 5 6 7 8 9123456789
Male Female
5–9
10–14
15–19
20–24
25–29
30–34
35–39
40–44
45–49
50–54
55–59
60–64
65–69
70–74
75–79
80+
Age
TCI17 73GA_LG_15-GRN-1First Proof
Italy, 2008
Critical Thinking Question 1: What is the best way to prevent negative population growth?
4. Rank the plans listed here from strongest (1)to weakest (5). If your group thinks of otherideas, add them to the ranked list. Be preparedto justify your rankings.
5. Read Section 5. Then answer thesequestions in complete sentences: WhichEuropean program for preventing negativepopulation growth do you think is most likelyto be successful? Why?
Plan Your Rank
A. Provide free childcare toworking parents. _______
B. Allow parents to havepaid time off whenchildren are born. _______
C. encourage parents tohave children earlier intheir lives. _______
D. Pay parents a “birth bonus”for each child they have. _______
e. Other: _______
6
r e A D i N G N O T e S
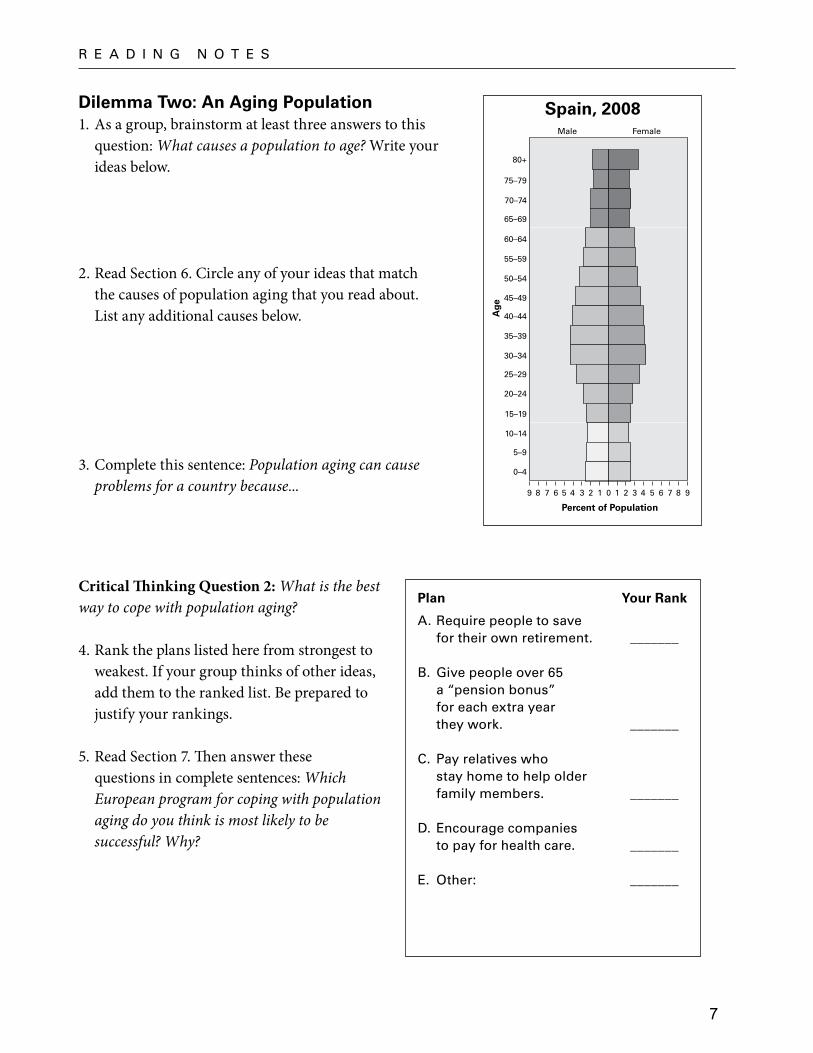
Dilemma Two: An Aging Population1. As a group, brainstorm at least three answers to this
question: What causes a population to age? Write your ideas below.
2. Read Section 6. Circle any of your ideas that matchthe causes of population aging that you read about.List any additional causes below.
3. Complete this sentence: Population aging can causeproblems for a country because...
Percent of Population
0–4
0 1 2 3 4 5 6 7 8 9123456789
Male Female
5–9
10–14
15–19
20–24
25–29
30–34
35–39
40–44
45–49
50–54
55–59
60–64
65–69
70–74
75–79
80+
Age
TCI17 74GA_LG_15-GRN-2First Proof
Spain, 2008
Critical Thinking Question 2: What is the best way to cope with population aging?
4. Rank the plans listed here from strongest toweakest. If your group thinks of other ideas,add them to the ranked list. Be prepared tojustify your rankings.
5. Read Section 7. Then answer thesequestions in complete sentences: WhichEuropean program for coping with populationaging do you think is most likely to besuccessful? Why?
Plan Your Rank
A. require people to savefor their own retirement. _______
B. Give people over 65a “pension bonus”for each extra yearthey work. _______
C. Pay relatives whostay home to help olderfamily members. _______
D. encourage companiesto pay for health care. _______
e. Other: _______
7
r e A D i N G N O T e S
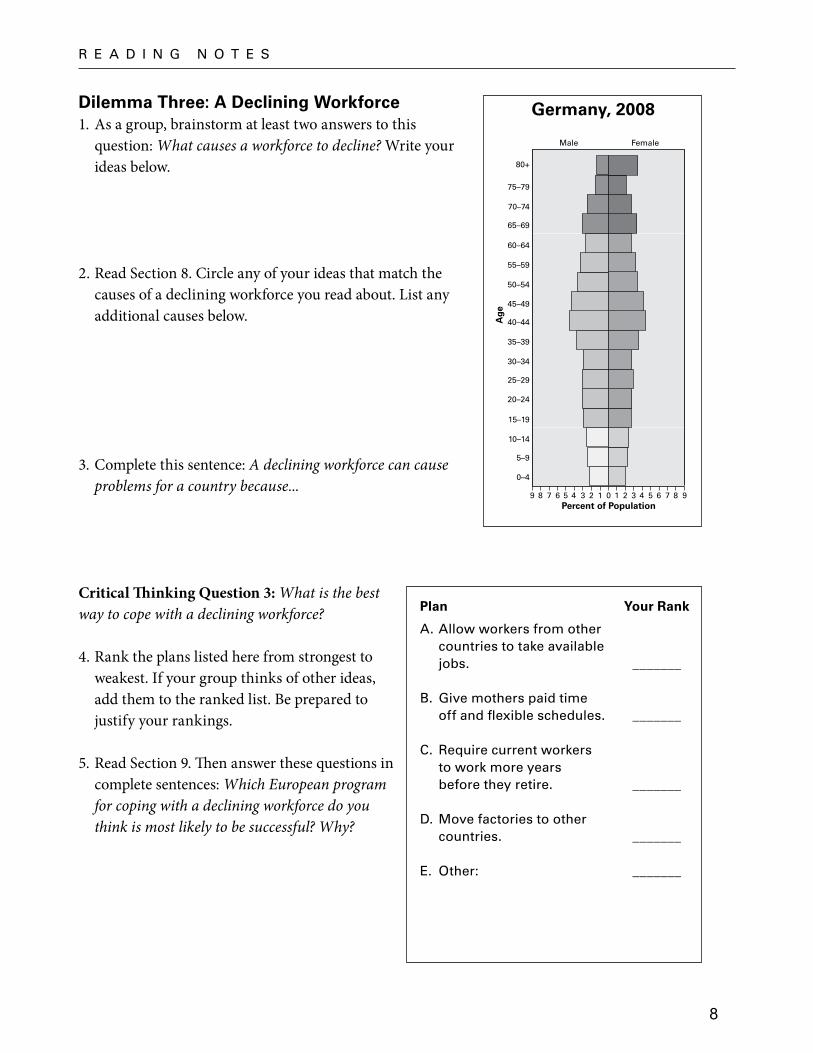
Dilemma Three: A Declining Workforce1. As a group, brainstorm at least two answers to this
question: What causes a workforce to decline? Write yourideas below.
2. Read Section 8. Circle any of your ideas that match thecauses of a declining workforce you read about. List anyadditional causes below.
3. Complete this sentence: A declining workforce can causeproblems for a country because...
Percent of Population
0–4
0 1 2 3 4 5 6 7 8 9123456789
Male Female
5–9
10–14
15–19
20–24
25–29
30–34
35–39
40–44
45–49
50–54
55–59
60–64
65–69
70–74
75–79
80+
Age
TCI17 75GA_LG_15-GRN-3First Proof
Germany, 2008
Critical Thinking Question 3: What is the best way to cope with a declining workforce?
4. Rank the plans listed here from strongest toweakest. If your group thinks of other ideas,add them to the ranked list. Be prepared tojustify your rankings.
5. Read Section 9. Then answer these questions incomplete sentences: Which European programfor coping with a declining workforce do youthink is most likely to be successful? Why?
Plan Your Rank
A. Allow workers from othercountries to take availablejobs. _______
B. Give mothers paid timeoff and flexible schedules. _______
C. require current workersto work more yearsbefore they retire. _______
D. Move factories to othercountries. _______
e. Other: _______
8

P r O C e S S i N G
Use your flipbook of U.S. population pyramids from 1950 through 2050 to answer the questions below.
1. Flip through the U.S. population pyramids from 1950 through 2050.List three interesting things you notice as the bars move.
•
•
•
2. Is the U.S. population aging? Analyze the pyramids in your flipbook to answerthis question. Explain your answer in at least two sentences.
3. How can the United States prepare for thedemographic changes that are predictedby 2050? Rank the plans listed here fromstrongest to weakest. If you think of otherideas, add them to the list. Then justify yourtop two rankings below.
Plan Your Rank
A. encourage immigrantsto continue to enterthe United States. _______
B. require baby boomersto work until age 70. _______
C. Provide government- sponsored childcare forworking parents. _______
D. Pay a $2,000 “medicalbonus” to seniors whodo not rely on thegovernment for healthinsurance. _______
e. Other: _______
9
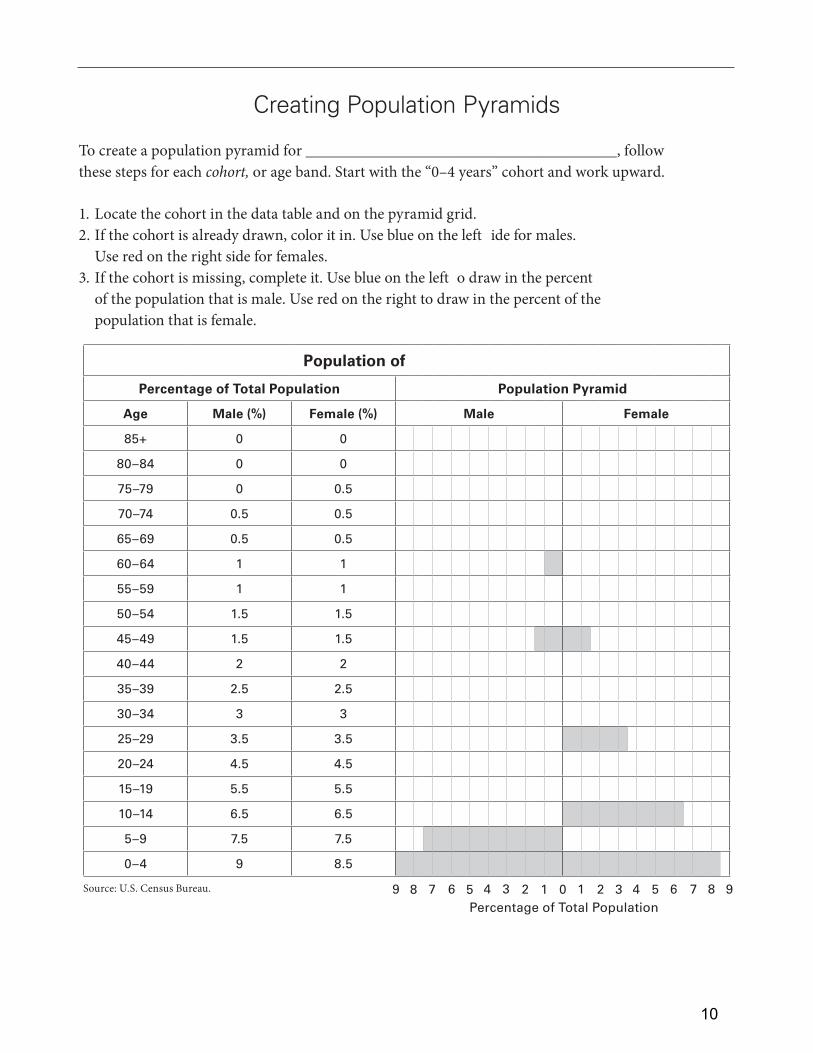
To create a population pyramid for _______________________________________, follow these steps for each cohort, or age band. Start with the “0–4 years” cohort and work upward.
1. Locate the cohort in the data table and on the pyramid grid.2. If the cohort is already drawn, color it in. Use blue on the left ide for males.
Use red on the right side for females.3. If the cohort is missing, complete it. Use blue on the left o draw in the percent
of the population that is male. Use red on the right to draw in the percent of thepopulation that is female.
39 8 7 6 5 4 2 1 0 1 2 3 4 5 6 7 8 9Percentage of Total Population
Population of
Percentage of Total Population Population Pyramid
Age Male (%) Female (%) Male Female
85+ 0 0
80–84 0 0
75–79 0 0.5
70–74 0.5 0.5
65–69 0.5 0.5
60–64 1 1
55–59 1 1
50–54 1.5 1.5
45–49 1.5 1.5
40–44 2 2
35–39 2.5 2.5
30–34 3 3
25–29 3.5 3.5
20–24 4.5 4.5
15–19 5.5 5.5
10–14 6.5 6.5
5–9 7.5 7.5
0–4 9 8.5
Source: U.S. Census Bureau.
Creating Population Pyramids
10
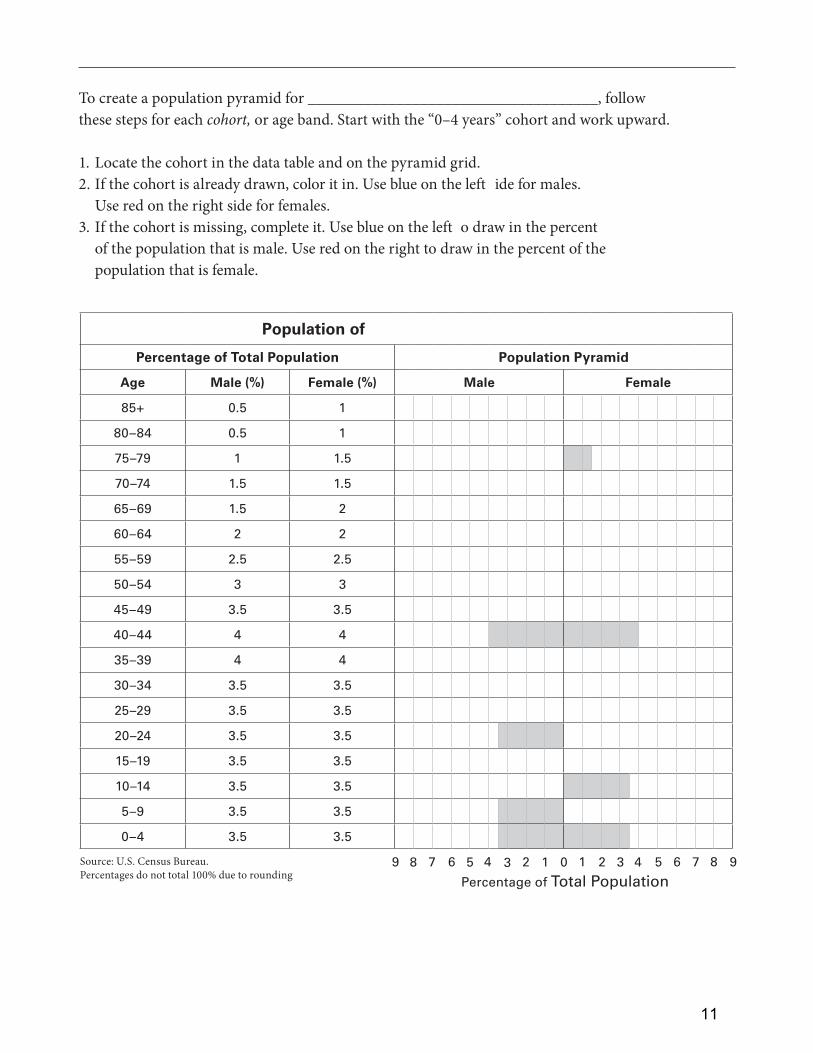
Population of
Percentage of Total Population Population Pyramid
Age Male (%) Female (%) Male Female
85+ 0.5 1
80–84 0.5 1
75–79 1 1.5
70–74 1.5 1.5
65–69 1.5 2
60–64 2 2
55–59 2.5 2.5
50–54 3 3
45–49 3.5 3.5
40–44 4 4
35–39 4 4
30–34 3.5 3.5
25–29 3.5 3.5
20–24 3.5 3.5
15–19 3.5 3.5
10–14 3.5 3.5
5–9 3.5 3.5
0–4 3.5 3.5
Source: U.S. Census Bureau. Percentages do not total 100% due to rounding
Percentage of Total Population9 8 7 6 5 4 2 1 0 1 2 3 4 5 6 7 8 93
To create a population pyramid for ____________________________________, follow these steps for each cohort, or age band. Start with the “0–4 years” cohort and work upward.
1. Locate the cohort in the data table and on the pyramid grid.2. If the cohort is already drawn, color it in. Use blue on the left ide for males.
Use red on the right side for females.3. If the cohort is missing, complete it. Use blue on the left o draw in the percent
of the population that is male. Use red on the right to draw in the percent of thepopulation that is female.
11
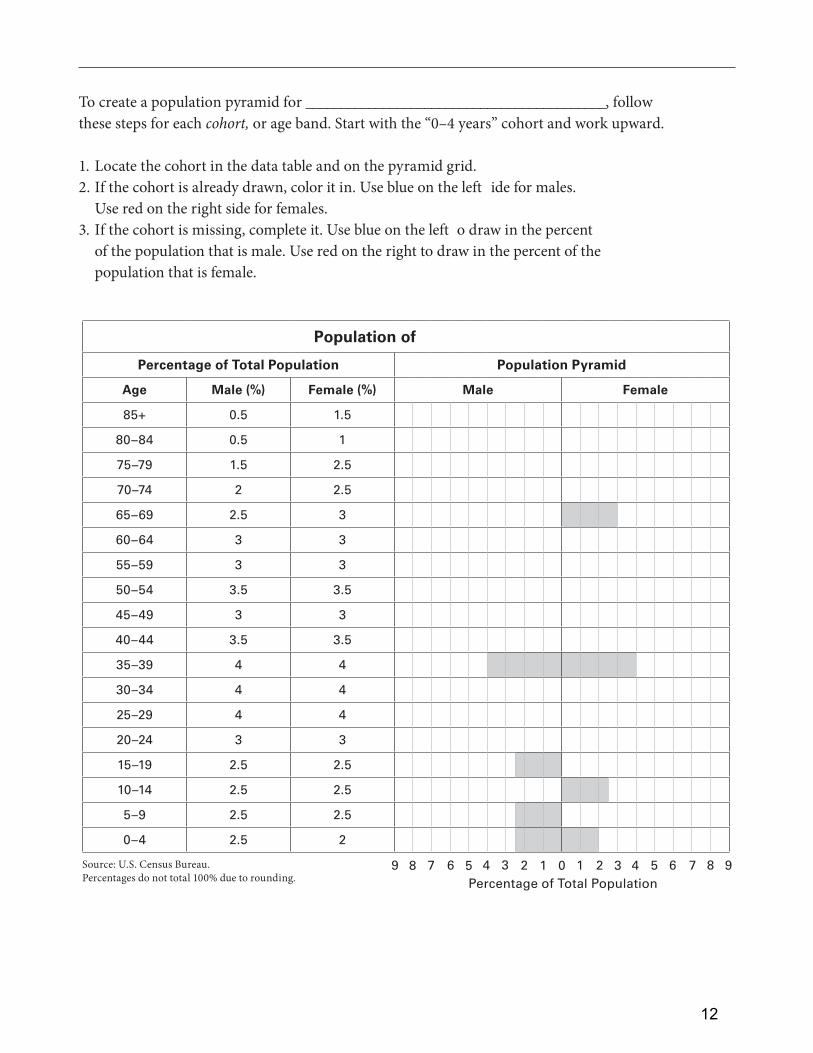
To create a population pyramid for ___________________________________________, follow these steps for each cohort, or age band. Start with the “0–4 years” cohort and work upward.
1. Locate the cohort in the data table and on the pyramid grid.2. If the cohort is already drawn, color it in. Use blue on the left ide for males.
Use red on the right side for females.3. If the cohort is missing, complete it. Use blue on the left o draw in the percent
of the population that is male. Use red on the right to draw in the percent of thepopulation that is female.
39 8 7 6 5 4 2 1 0 1 2 3 4 5 6 7 8 9Percentage of Total Population
Population of
Percentage of Total Population Population Pyramid
Age Male (%) Female (%) Male Female
85+ 0.5 1.5
80–84 0.5 1
75–79 1.5 2.5
70–74 2 2.5
65–69 2.5 3
60–64 3 3
55–59 3 3
50–54 3.5 3.5
45–49 3 3
40–44 3.5 3.5
35–39 4 4
30–34 4 4
25–29 4 4
20–24 3 3
15–19 2.5 2.5
10–14 2.5 2.5
5–9 2.5 2.5
0–4 2.5 2
Source: U.S. Census Bureau. Percentages do not total 100% due to rounding.
12

P r O C e S S i N G
Use your flipbook of U.S. population pyramids from 1950 through 2050 to answer the questions below.
1. Flip through the U.S. population pyramids from 1950 through 2050.List three interesting things you notice as the bars move.
•
•
•
2. Is the U.S. population aging? Analyze the pyramids in your flipbook to answerthis question. Explain your answer in at least two sentences.
3. How can the United States prepare for thedemographic changes that are predictedby 2050? Rank the plans listed here fromstrongest to weakest. If you think of otherideas, add them to the list. Then justify yourtop two rankings below.
Plan Your Rank
A. encourage immigrantsto continue to enterthe United States. _______
B. require baby boomersto work until age 70. _______
C. Provide government- sponsored childcare forworking parents. _______
D. Pay a $2,000 “medicalbonus” to seniors whodo not rely on thegovernment for healthinsurance. _______
e. Other: _______


