Post Polymerization Modification of
Poly(vinyl amine) with Functional Epoxides:
Multifunctional, Antimicrobial, Protein-like Polymers
Von der Fakultät für Mathematik, Informatik und Naturwissenschaften
der RWTH Aachen University zur Erlangung des akademischen Grades einer
Doktorin der Naturwissenschaften genehmigte Dissertation
vorgelegt von
Diplom-Chemikerin, Diplom-Wirtschaftschemikerin
Angela Schmalen, geb. Plum
aus Aachen
Berichter: Universitätsprofessor Dr. Dr. h. c. Martin Möller
Universitätsprofessor Dr. Andrij Pich
Tag der mündlichen Prüfung: 02.09.2014
Diese Dissertation ist auf den Internetseiten der Hochschulbibliothek online verfügbar.

i
ACKNOWLEDGMENT
The present work was carried out at the Institute of Technical and Macromolecular Chemistry
and the DWI - Leibniz-Institut für Interaktive Materialien at RWTH Aachen University under
the supervision of Prof. Dr. Martin Möller. I would like to take the opportunity to thank the
people who contributed to the success of this work.
At first, I want to thank Prof. Dr. Martin Möller for giving me the opportunity to be part of his
research group and for giving me a large freedom in the organization of my work.
I am deeply grateful to Dr. Helmut Keul for his never ending scientific support, the many
discussions we had and the critical revision of this thesis. I enjoyed being part of his group.
Additionally, I had the opportunity to collaborate with Dr. Elisabeth Heine and I want to
thank her for the critical revision of parts of this thesis, and together with her co-workers for
carrying out the antimicrobial and hemolytic tests, as well as the permeabilization
experiments and their constant willingness to discuss the obtained results.
During my PhD I had the chance to be part of the EU project Nanobond. I would like to thank
all co-operation partners for the fruitful collaborations and for sharing their ideas with me.
Especially, I would like to thank Prof. Dr. Éva Kiss and her co-workers for carrying out the
Langmuir film experiments.
I have to thank Rainer Haas for his constant cooperativeness and help regarding any question
or technical problem. Many thanks also to my research students Bianca Stöckel and Janine
Broda who contributed to this work.
Acknowledgment
ii
Many thanks go to my lab mates Marc Hans, Sascha Pargen, Michael Scharpf, and Jens
Köhler and all the other people from AK Keul and DWI for providing an enjoyable
atmosphere and a pleasant working environment and for all the interesting discussions we
had. Thinking about other colleagues at the DWI and ITMC, many thanks go also to Alex,
Anika, Dragos, Huihui, Kalle, Marc, Melanie, and Ramona for many great hours inside and
outside the institute.
Finally, special thanks belong to my parents, my sister, my brother, and the rest of my family
for their never-ending support over the years. Dear Laurent, thank you for all your love,
support and constant patience.
iii
KURZFASSUNG
Durch die zunehmende Resistenz von Bakterien gegenüber gebräuchlichen antimikrobiellen
Mitteln besteht ein erheblicher Bedarf an neuen antimikrobiellen Wirkstoffen. In diesem
Zusammenhang befasst sich die vorliegende Arbeit mit der Herstellung und Charakterisierung
neuartiger multifunktioneller Poly(vinyl amine). Poly(vinyl amin) wurde erfolgreich mit
quaternären Ammoniumgruppen und Alkylgruppen funktionalisiert, mit dem Ziel, natürliche
antimikrobielle Peptide nachzuahmen und so Zugang zu neuen antimikrobiellen Substanzen
zu erhalten. Als vielseitiger Ansatz um hydrophile und hydrophobe Reste in das Polymer
einzubringen, wurde die polymeranaloge Reaktion mit funktionellen Epoxiden gewählt. Der
Funktionalisierungsgrad kann über das Verhältnis von funktionellen Epoxiden zu
Aminogruppen einfach eingestellt werden, wodurch eine Vielzahl an unterschiedlichen
Polymeren herstellbar ist. Die neuen multifunktionellen Poly(vinyl amine) wurden mit
Hinblick auf den Einfluss der hydrophilen/hydrophoben Balance auf verschiedenste
Eigenschaften in Lösung und als Oberflächenbeschichtung charakterisiert. Der Einfluss der
hydrophilen/hydrophoben Balance auf die antimikrobielle Wirksamkeit, die kritische
Aggregationskonzentration und die Fähigkeit, in Membranmodelle einzudringen, wurde
untersucht. In funktionellen Polymeren mit gleicher chemischer Zusammensetzung und
gleichem Molekulargewicht wurden erfolgreich unterschiedliche Mikrostrukturen erzeugt.
Der Einfluss dieser Mikrostrukturen wurde auf die oben genannten Eigenschaften und
zusätzlich auf die Viskosität, die Fähigkeit in die äußere/innere Membran von E. coli
einzudringen und die hämolytische Wirksamkeit der Polymere, untersucht. Die erhaltenen
multifunktionellen Polymere lassen sich z.B. als antimikrobielle Mittel für
Oberflächenbeschichtungen oder Textilausrüstungen einsetzen.
iv
ABSTRACT
The increasing resistance of bacteria towards common antimicrobial agents causes a
significant need for new antimicrobial compounds. In this context, the present thesis deals
with the preparation and characterization of novel multifunctional poly(vinyl amine)s.
Poly(vinyl amine) was successfully functionalized with quaternary ammonium groups and
alkyl groups with the goal to mimic natural antimicrobial peptides and give access to novel
antimicrobial agents. The post polymerization modification with functional epoxides was
chosen as a versatile approach to introduce hydrophobic and hydrophilic functionalities into
the polymer. The degree of functionalization can easily be adjusted by the ratio of functional
epoxides to amine groups giving access to a high variety of polymers. The novel
multifunctional poly(vinyl amine)s were characterized in detail with regard to the influence of
the hydrophilic/hydrophobic balance on several properties in aqueous solution and coated on
surfaces. The influence of the hydrophilic/hydrophobic balance on the antimicrobial activity,
the critical aggregation concentration, and the penetration ability into model membranes was
thoroughly investigated. Different microstructures were successfully introduced into
functional polymers having an identical chemical composition and molecular weight. The
influence of these microstructures on the antimicrobial effect, the critical aggregation
concentration, the viscosity, the ability to penetrate into a model DPPC membrane, the ability
to penetrate into the outer/inner membrane of E. coli, and the hemolytic activity of the
polymers was determined. The resulting multifunctional polymers can, e.g., be used as
antimicrobial agents for surface coatings or textile finishings.
v
CONTENTS
Abbreviations .......................................................................................................................... vii
Chapter 1 Introduction ......................................................................................................... 1
1.1 Poly(vinyl amine) ........................................................................................................ 3
1.2 Post Polymerization Modification ............................................................................. 11
1.3 Bacteria Constitution and Antimicrobial Agents ....................................................... 12
1.4 Content of this Thesis ................................................................................................ 19
1.6 Literature ................................................................................................................... 20
Chapter 2 Synthesis of Amphiphilic Polymers from Poly(vinyl amine) ........................ 27
2.1 Introduction ............................................................................................................... 27
2.2 Experimental Part ...................................................................................................... 29
2.3 Results and Discussion .............................................................................................. 41
2.4 Conclusions ............................................................................................................... 76
2.5 Literature ................................................................................................................... 77
Chapter 3 Synthesis of Amphiphilic Polymers and Their Characterization
in Solution .......................................................................................................... 79
3.1 Introduction ............................................................................................................... 79
3.2 Experimental Part ...................................................................................................... 80
3.3 Results and Discussion .............................................................................................. 88
3.4 Conclusions ............................................................................................................. 103
3.5 Literature ................................................................................................................. 104
Contents
vi
Chapter 4 Amphiphilic Polymers with Antimicrobial Activity .................................... 107
4.1 Introduction ............................................................................................................. 107
4.2 Experimental Part .................................................................................................... 109
4.3 Results and Discussion ............................................................................................ 117
4.4 Conclusions ............................................................................................................. 153
4.5 Literature ................................................................................................................. 156
Chapter 5 Synthesis and Characterization of Polymers with the Same Composition
but Different Microstructures ........................................................................ 159
5.1 Introduction ............................................................................................................. 159
5.2 Experimental Part .................................................................................................... 161
5.3 Results and Discussion ............................................................................................ 176
5.4 Conclusions ............................................................................................................. 215
5.5 Literature ................................................................................................................. 219
Chapter 6 Summary .......................................................................................................... 223
Appendix A Supplementary Information on Chapter 4 ................................................... 229
List of Publications ............................................................................................................... 233
Curriculum Vitae ................................................................................................................. 234
vii
ABBREVIATIONS
a. D. after dialysis
AFM atomic force microscopy
aq. aqueous
br broad
°C degree Celsius
CAC critical aggregation concentration
cf. confer
cfu colony forming unit
cm centimeter
d days
DH degree of hydrolysis
dist. distilled
DNA deoxyribonucleic acid
DOW superwetting agent Q2-5211 from DOW Chemicals
DPPC dipalmitoylphosphatidylcholine
DPPG dipalmitoylphosphatidylglycerol
DSMZ Deutsche Sammlung von Mikroorganismen und Zellkulturen
EA8 1,2-epoxyoctane
EA10 1,2-epoxydecane
EA12 1,2-epoxydodecane
Abbreviations
viii
EA14 1,2-epoxytetradecane
EA16 1,2-epoxyhexadecane
EA18 1,2-epoxyoctadecane
EC effective concentration
e.g. for example
EG ethyleneglycole
EQ glycidyltrimethylammonium chloride
eq equivalents
et al. et alii (and others)
etc. et cetera
g gram
GPC gel permeation chromatography
h hour
kDa kilodalton
L liter
M averaged molecular weight of the repeating units calculated from the
1H NMR spectrum
M molar mass
m multiplet
m meter
mbar millibar
meq milliequivalents
mg milligram
MHz megahertz
MIC minimum inhibitory concentration
ABBREVIATIONS
ix
min minutes
mL milliliter
mm millimeter
mN millinewton
MP membrane permeabilization of E. coli
MW molecular weight
mW milliwatt
NL1 nutrient solution
NMR nuclear magnetic resonance
nm nanometer
NVF N-vinyl formamide
OD optical density
ONP o-nitrophenol
ONPG o-nitrophenyl-β-D-galactopyranosid
p. a. pro analysi
PAM poly(acrylamide)
PBS phosphate-buffered saline
PEI poly(ethylene imine)
PNVF poly(N-vinyl formamide)
POM polyoxymethylene
ppm parts per million
PVAm poly(vinyl amine)
RBC red blood cells
Rh Rhesus factor
rH relative humidity
Abbreviations
x
RNA ribonucleic acid
rpm revolutions per minute
RT room temperature
s singlet
sec seconds
sf salt free
t time
THF tetrahydrofuran
wt% weight percent
µL microliter
µS microsiemens
CHAPTER 1
1
INTRODUCTION
The antimicrobial resistance of bacteria towards antibiotics increased dramatically in the last
decades and the number of new antibiotic approvals is declining.1,2,3,4,5,6,7,8
Therefore, the
development of new antimicrobially active agents which are not prone to resistance
mechanisms is of high interest.9,10
In this context, the focus of research activities since the
1980s has been on host defense peptides and synthetic polymer disinfectants, two classes of
novel antimicrobials.9 Host defense peptides are very effective antimicrobial agents. They act
as broad-spectrum, fast-killing antibiotics and are not sensible to bacterial resistances.11
However, they have the drawback of high manufacturing cost, susceptibility to proteolysis,
and poorly understood pharmacokinetics hindering their application.12
In contrast, synthetic
polymeric antimicrobials have the advantage of low manufacturing cost, large-scale synthesis,
and diversity of synthesizable chemical structures. And as opposed to low molecular weight
agents, antimicrobial polymers have the advantage that the formation of antimicrobial
resistances is unlikely due to their mode of action.13
Furthermore, antimicrobial polymers
possess a higher efficiency against bacteria in comparison to their monomeric equivalents.14
However, the drawback of polymeric antimicrobial materials is that they are often toxic to
human cells15
or the toxicities are not well studied.
The combination of the design principles of host defense peptides with the simple and
inexpensive methods of polymer science can combine the advantages of both fields and
thereby give access to affordable and biocompatible antimicrobials.9,16
A lot of research is
currently going on to obtain peptide-mimicking antimicrobial polymers with potent
Introduction
2
antimicrobial activities and minimal or no hemolytic activity by optimization of the polymeric
structure.9,17,18,19,20,21,22,23,24,25,26,27,28,29
Peptides containing cationic and hydrophobic amino
acid residues are known to be antimicrobially active.9 However, the antimicrobial mode of
action is not completely understood to this date and several models for the antimicrobial
interaction have been proposed.9,27,30,31,32,33,34,35
The investigation of structure-properties
relations in polymers bearing cationic and hydrophobic groups is therefore of interest to gain
insights in the mode of operation of antimicrobial agents.
This thesis deals with the preparation and characterization of multifunctional, antimicrobial,
protein-like polymers. Poly(vinyl amine) was functionalized with quaternary ammonium
groups and alkyl groups with the goal to mimic natural antimicrobial peptides and to give
access to novel antimicrobial agents. The post polymerization modification with functional
epoxides was chosen as a versatile approach to introduce hydrophobic and hydrophilic
functionalities into the polymer. The influence of the hydrophilic/hydrophobic balance on
several polymer properties in aqueous solution and coated on surfaces was studied.
Furthermore, the formation of different microstructures within polymers having an identical
chemical composition and molecular weight and the effect of these microstructures on
different polymer properties were investigated.
CHAPTER 1
3
1.1 Poly(vinyl amine)
1.1.1 Synthesis
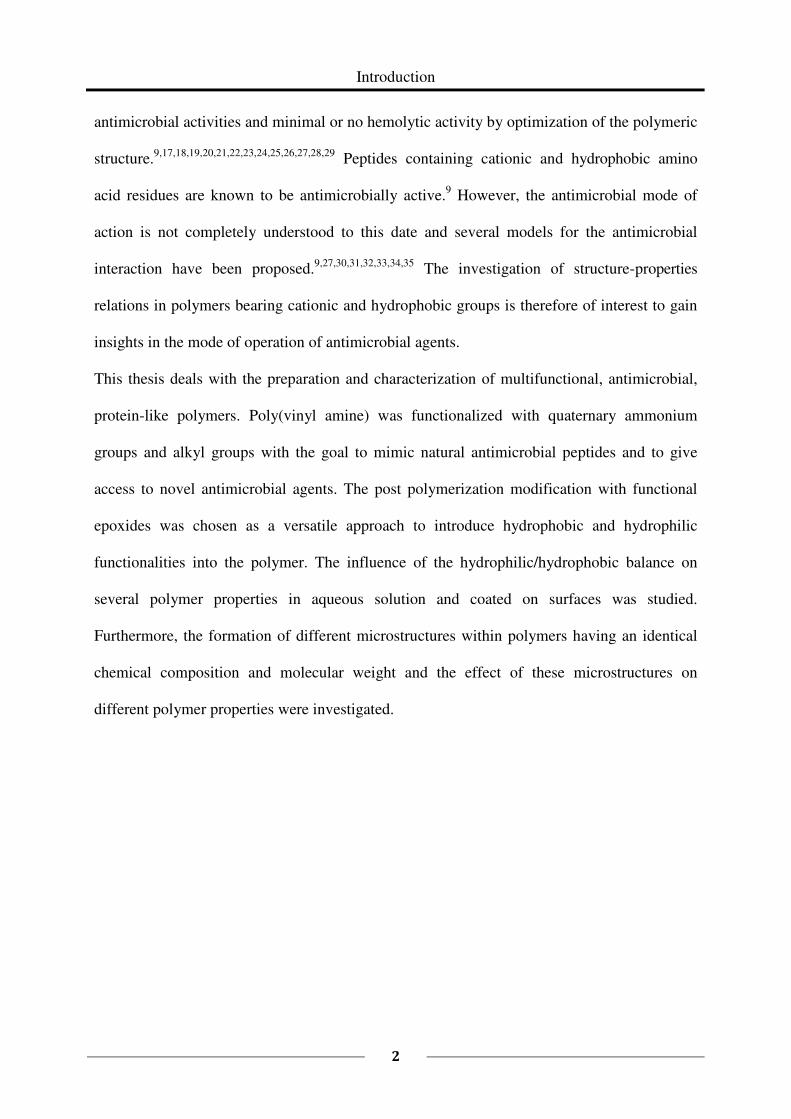
Poly(vinyl amine) (PVAm) is a linear, weak, cationic polyelectrolyte. The direct
polymerization of vinylamine as a precursor to PVAm is not possible, due to the enamine-
imine tautomerism (Scheme 1)36
.
Scheme 1. Schematic illustration of the enamine-imine tautomerism of vinylamine.
Therefore it is only possible to prepare poly(vinyl amine) indirectly via post polymerization
modification. Several routes of synthesis have been developed since the 1940’s. Already in
1944 Jones et al. prepared poly(vinyl amine) as a side product in a reaction of ethanol amine,
phthalic anhydride, and acetic anhydride. Further syntheses wherein N-substituted monomers
are polymerized and afterwards hydrolyzed to give PVAm are known36,37,38,39,40,41,42,43,44,45
.
Some examples are given in Scheme 2. Modifications as shown in Scheme 2 are always
complicated and expensive, because several steps are required to obtain the final pure product.
Another disadvantage of such syntheses is the need for drastic reaction conditions for the
hydrolysis of poly(N-vinyl amide)s (e.g. reaction under acidic conditions with excess of
hydrochloric acid or under basic conditions at high temperatures).
Introduction
4
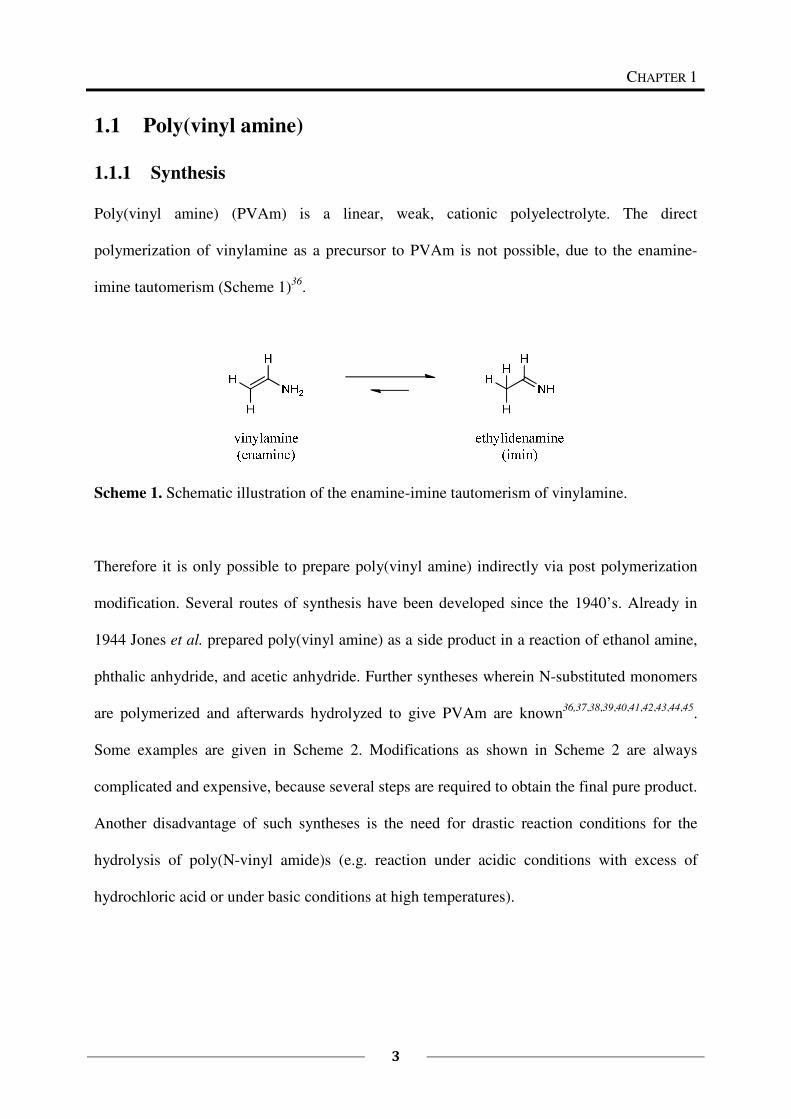
Scheme 2. Synthesis of poly(vinyl amine) by post polymerization modification. a)
hydrazinolysis of poly(N-vinyl carboxamide)s42,43,44,45
, b) hydrolysis of poly(N-vinyl
succinimide)39
, c) hydrolysis of poly(N-vinyl phthalimide)39,40
, d) Hofmann elimination of
poly(acrylamide)41
.
N-Vinylformamide (NVF) was developed as a precursor to PVAm to allow a simple,
economic synthesis. It has been commercially available since 1999. NVF as a precursor to
high molecular weight polyamides and polyamines shows a high reactivity both in radical
polymerization and copolymerization as well as in the hydrolysis of the amide groups. The
first successful synthesis of NVF has been carried out more than 40 years ago46
. Since that
time, several synthesis routes to NVF have been reported47
. One route developed in 1993
starts with two simple chemicals (acetaldehyde and formamide) to prepare
ethylideneformamide, a precursor of NVF. After the condensation of acetaldehyde and
CHAPTER 1
5
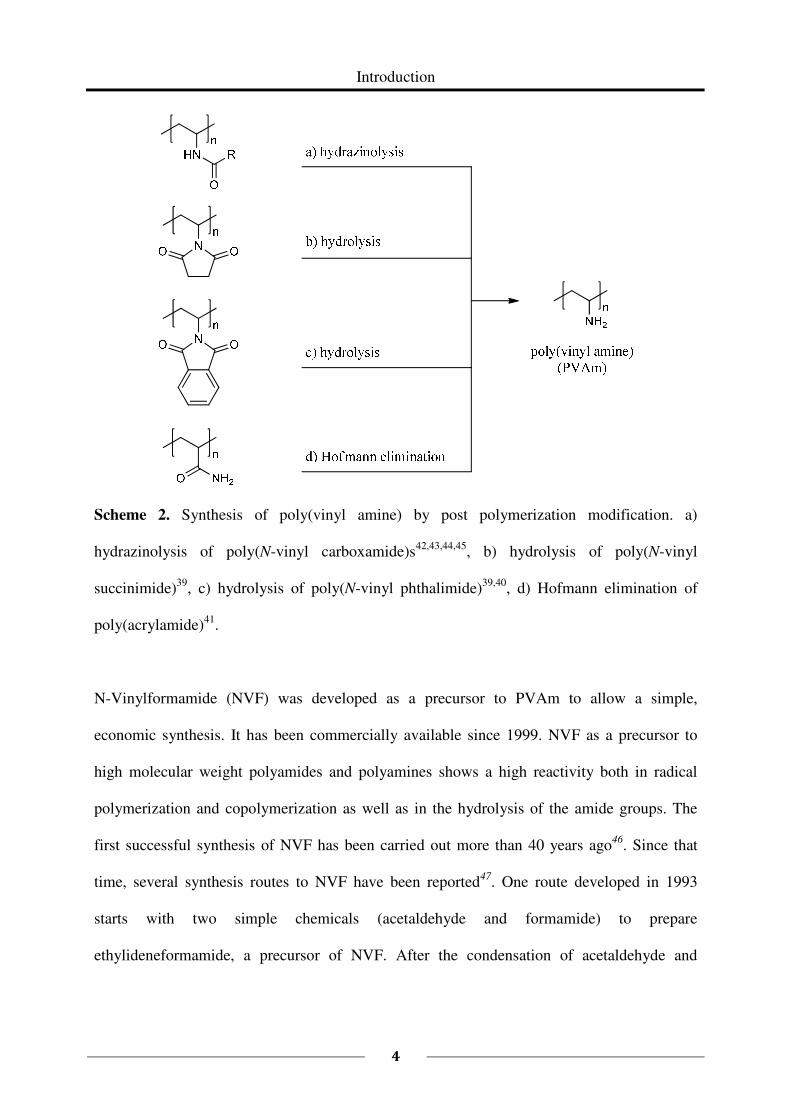
formamide to ethylidenformamide, the latter is isomerized to NVF through heating in
presence of a catalyst48
(Scheme 3).
������������ ��������� �����
� ��� � � � ��
�
�����
�� ����� ������� �����
�
Scheme 3. Synthesis of N-vinylformamide (NVF).
This synthesis route is commercially attractive and renewed the industrial and academic
interest in NVF and its polymers. Poly(N-vinyl formamide) (PNVF) is prepared by radical
polymerization using oil- or water-soluble azocompounds as initiatior. It is attractive due to
its low toxicity. Functional polyelectrolytes with high molecular weight are easily obtained.
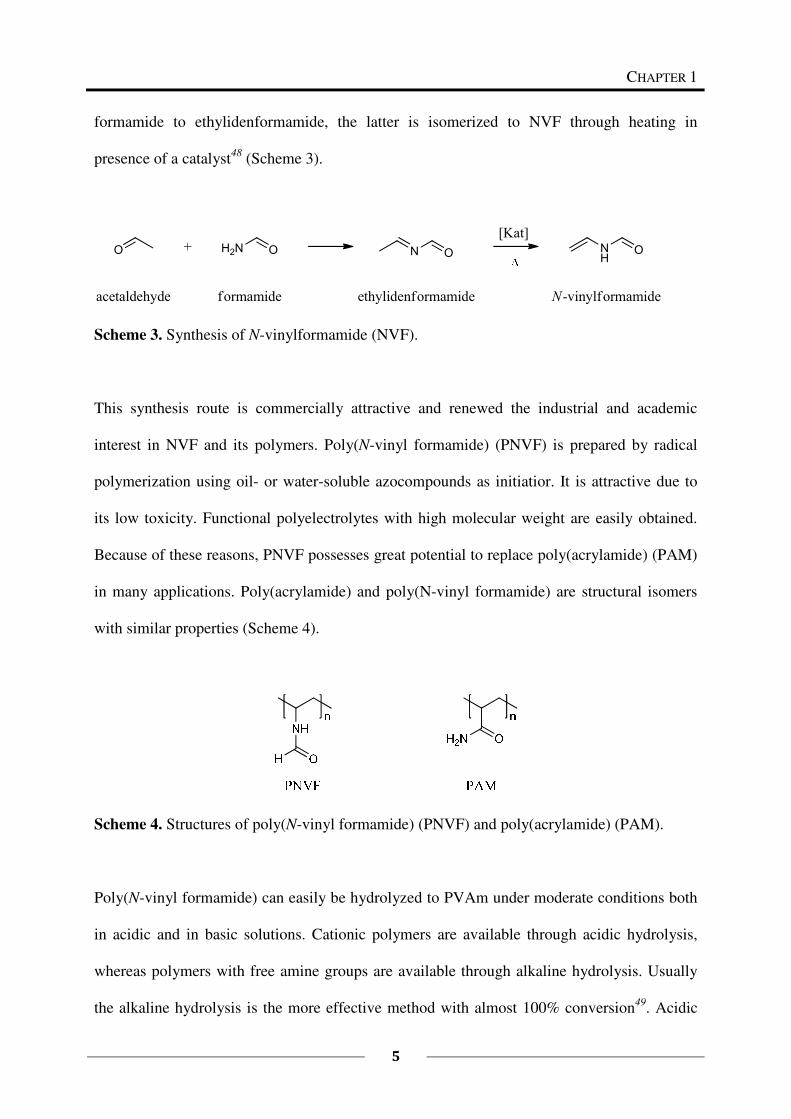
Because of these reasons, PNVF possesses great potential to replace poly(acrylamide) (PAM)
in many applications. Poly(acrylamide) and poly(N-vinyl formamide) are structural isomers
with similar properties (Scheme 4).
Scheme 4. Structures of poly(N-vinyl formamide) (PNVF) and poly(acrylamide) (PAM).
Poly(N-vinyl formamide) can easily be hydrolyzed to PVAm under moderate conditions both
in acidic and in basic solutions. Cationic polymers are available through acidic hydrolysis,
whereas polymers with free amine groups are available through alkaline hydrolysis. Usually
the alkaline hydrolysis is the more effective method with almost 100% conversion49
. Acidic
Introduction
6
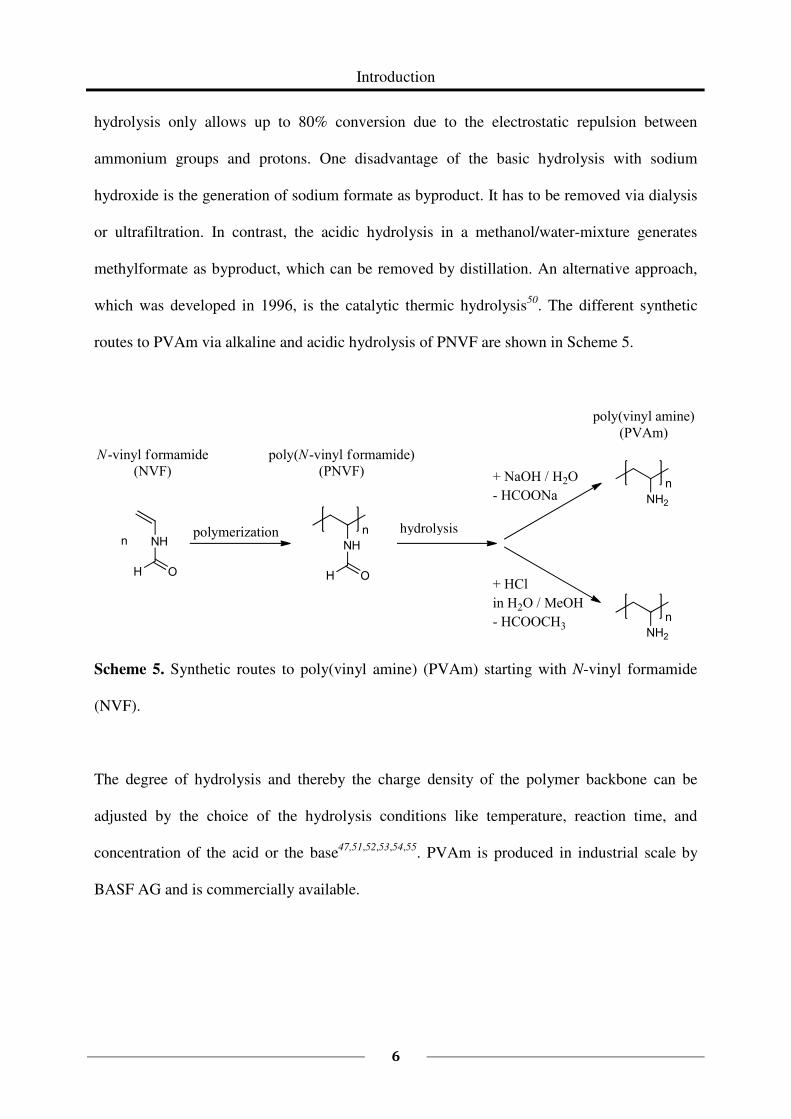
hydrolysis only allows up to 80% conversion due to the electrostatic repulsion between
ammonium groups and protons. One disadvantage of the basic hydrolysis with sodium
hydroxide is the generation of sodium formate as byproduct. It has to be removed via dialysis
or ultrafiltration. In contrast, the acidic hydrolysis in a methanol/water-mixture generates
methylformate as byproduct, which can be removed by distillation. An alternative approach,
which was developed in 1996, is the catalytic thermic hydrolysis50
. The different synthetic
routes to PVAm via alkaline and acidic hydrolysis of PNVF are shown in Scheme 5.
������ ������
� �
��
� �
�
���
�
���
�
����� ����
��� �����
� ���
��� � ����
� �������
� ���� � ���
� ������
����� �� �����
�!"#
���� ����� �� �����#
$�!"#
���� ��� ���#
$!%�#
�
Scheme 5. Synthetic routes to poly(vinyl amine) (PVAm) starting with N-vinyl formamide
(NVF).
The degree of hydrolysis and thereby the charge density of the polymer backbone can be
adjusted by the choice of the hydrolysis conditions like temperature, reaction time, and
concentration of the acid or the base47,51,52,53,54,55
. PVAm is produced in industrial scale by
BASF AG and is commercially available.
hydrolysis
CHAPTER 1
7
1.1.2 Solution Properties and Charge Density
Poly(vinyl amine) is a cationic polyelectrolyte and its primary amine groups are protonated
under acidic conditions. The degree of dissociation of the ionic groups of PVAm and thereby
the charge density along the polymer backbone is a function of the pH-value. This means
PVAm is a weak polyelectrolyte. The difference in charge density with varying pH-value
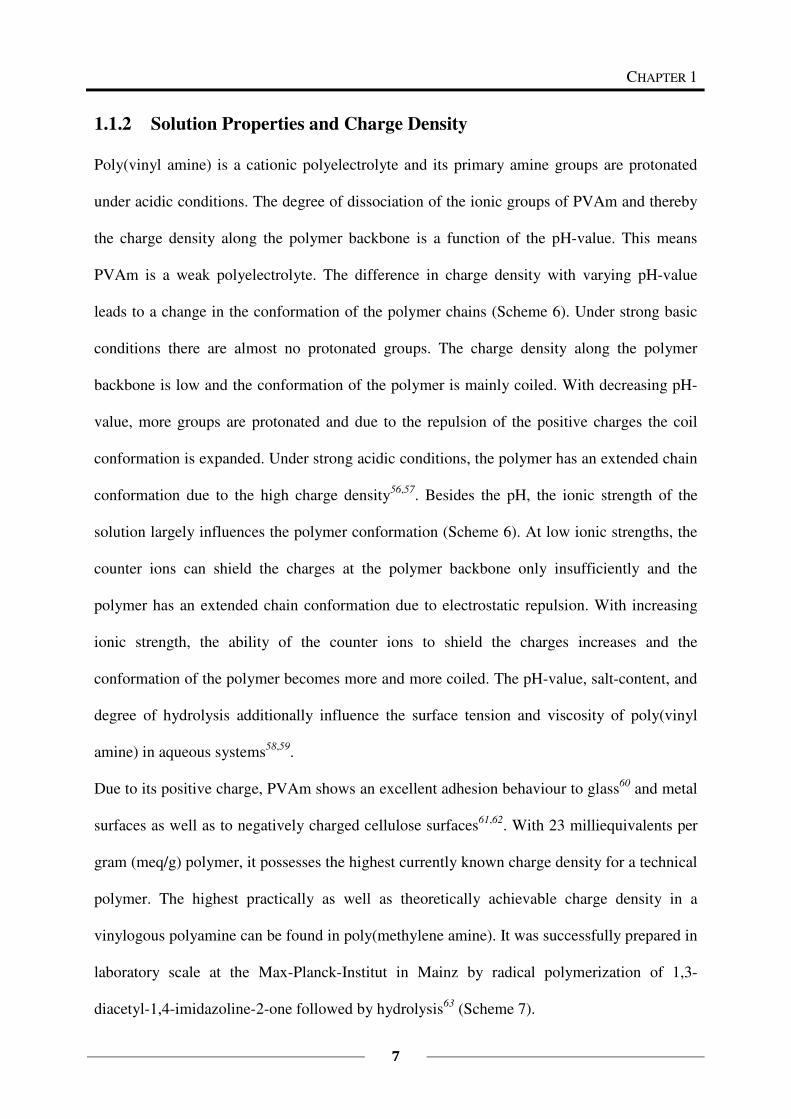
leads to a change in the conformation of the polymer chains (Scheme 6). Under strong basic
conditions there are almost no protonated groups. The charge density along the polymer
backbone is low and the conformation of the polymer is mainly coiled. With decreasing pH-
value, more groups are protonated and due to the repulsion of the positive charges the coil
conformation is expanded. Under strong acidic conditions, the polymer has an extended chain
conformation due to the high charge density56,57
. Besides the pH, the ionic strength of the
solution largely influences the polymer conformation (Scheme 6). At low ionic strengths, the
counter ions can shield the charges at the polymer backbone only insufficiently and the
polymer has an extended chain conformation due to electrostatic repulsion. With increasing
ionic strength, the ability of the counter ions to shield the charges increases and the
conformation of the polymer becomes more and more coiled. The pH-value, salt-content, and
degree of hydrolysis additionally influence the surface tension and viscosity of poly(vinyl
amine) in aqueous systems58,59
.
Due to its positive charge, PVAm shows an excellent adhesion behaviour to glass60
and metal
surfaces as well as to negatively charged cellulose surfaces61,62
. With 23 milliequivalents per
gram (meq/g) polymer, it possesses the highest currently known charge density for a technical
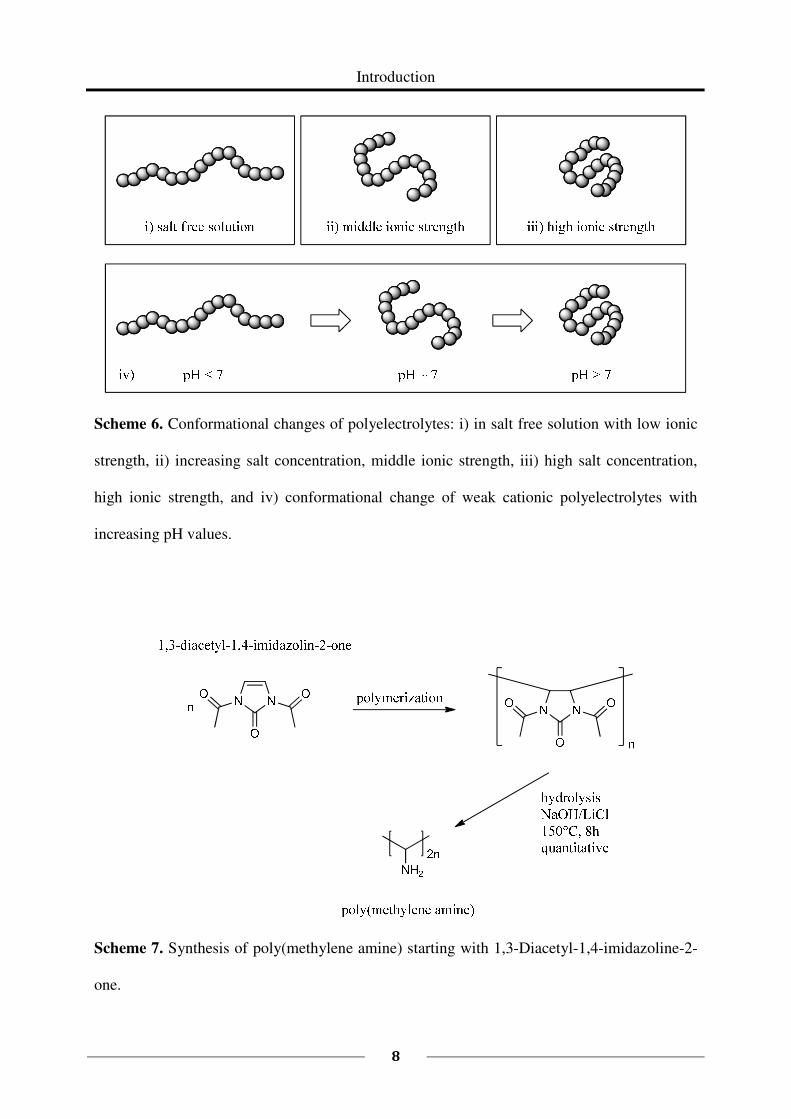
polymer. The highest practically as well as theoretically achievable charge density in a
vinylogous polyamine can be found in poly(methylene amine). It was successfully prepared in
laboratory scale at the Max-Planck-Institut in Mainz by radical polymerization of 1,3-
diacetyl-1,4-imidazoline-2-one followed by hydrolysis63
(Scheme 7).
Introduction
8
Scheme 6. Conformational changes of polyelectrolytes: i) in salt free solution with low ionic
strength, ii) increasing salt concentration, middle ionic strength, iii) high salt concentration,
high ionic strength, and iv) conformational change of weak cationic polyelectrolytes with
increasing pH values.
Scheme 7. Synthesis of poly(methylene amine) starting with 1,3-Diacetyl-1,4-imidazoline-2-
one.
CHAPTER 1
9
With increasing pH-values and decreasing degrees of hydrolysis, the charge density of PVAm
also decreases. It is interesting to note that even at relatively high pH-values (8-9), there is a
significant charge density of 6 meq/g64
. Due to a pKa value of 8.49, PVAm has still a
relatively high degree of protonation, even at higher pH-values65
.
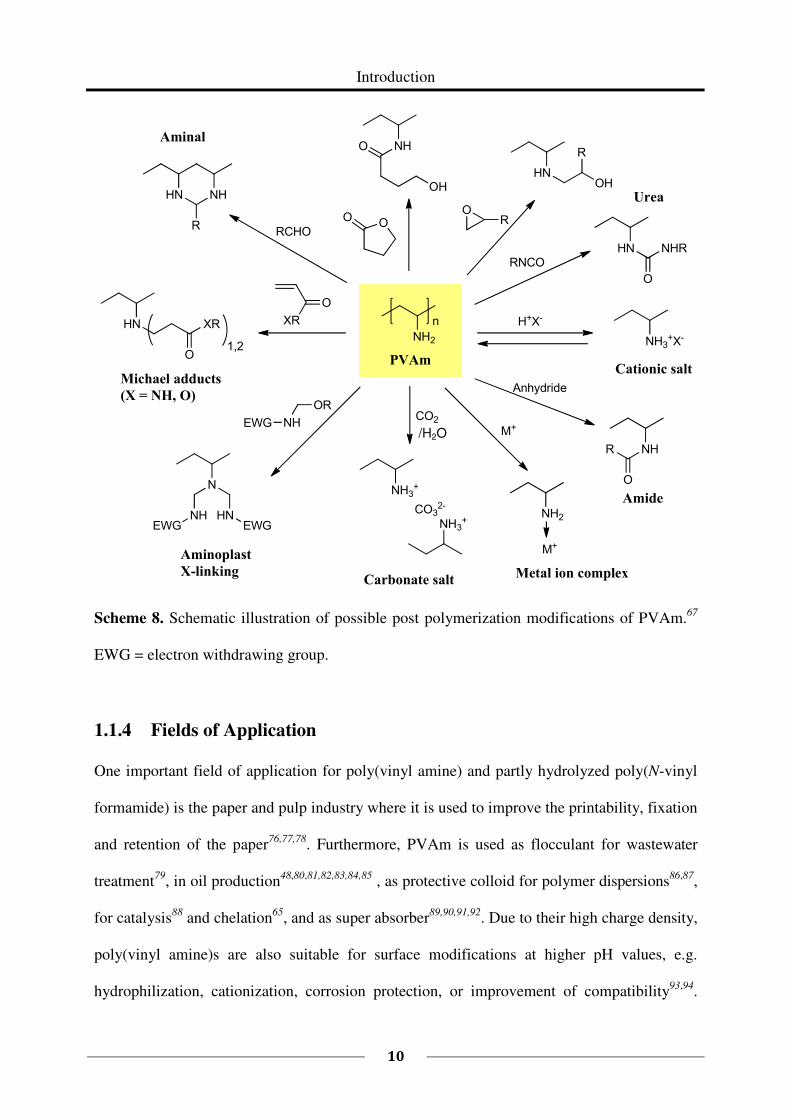
1.1.3 Reactions
Reactions of the primary amine groups of PVAm with electrophiles have been mentioned in
several publications66,67,68,69,70,64,71. The theoretically possible reactions with typical
electrophiles, like epoxides, anhydrides, isocyanates, etc., are shown in Scheme 8. With its
free amine groups acting as Lewis bases, PVAm can complex heavy metal ions72,73
. This fact
is used during the polymerization of methyl methacrylate wherein a copper(II)-poly(vinyl
amine) complex in the presence of sodiumsulfit is used as a catalyst for crosslinking74
. High
molecular weight PVAm is only soluble in very polar solvents like water, ethyleneglycole
(EG), or methanol and mixtures thereof with THF. Therefore a later derivatization is
interfered and mostly limited to reactants soluble in these solvents. Spange et al. successfully
reacted PVAm with 4-fluoronitrobenzol and its derivatives, mediated by β-cyclodextrine70
.
They further derivatized PVAm such that it can be used in nanotechnology as a functional
polyelectrolyte layer (thickness ca. 0.5 nm), e.g., as coating on silica gel particles. As a
possible application, they propose the use of the resulting insoluble hybrid material as a
biocompatible material for implants in medicine. Furthermore, PVAm was modified to yield
polymer surfactants75
, and to mimic natural enzymes88
. The aforementioned examples show
that it is possible to synthesize tailor-made polymers from PVAm with various possible
applications.
Introduction
10
������
����
���
�
�� ��
�
��
��
�
����
�
���
�
�� ��
���
���
�
��
����� � ���
�� � ��� ��
�
����
����
����������
���������
�� ��
��
����
����
����
��
���
��
��
�
�
��� �
���������
��
���� ��� �������� !����� ����
������
������� ����
����
��
�
���
" ��
���
Scheme 8. Schematic illustration of possible post polymerization modifications of PVAm.67
EWG = electron withdrawing group.
1.1.4 Fields of Application
One important field of application for poly(vinyl amine) and partly hydrolyzed poly(N-vinyl
formamide) is the paper and pulp industry where it is used to improve the printability, fixation
and retention of the paper76,77,78
. Furthermore, PVAm is used as flocculant for wastewater
treatment79
, in oil production48,80,81,82,83,84,85
, as protective colloid for polymer dispersions86,87
,
for catalysis88
and chelation65
, and as super absorber89,90,91,92
. Due to their high charge density,
poly(vinyl amine)s are also suitable for surface modifications at higher pH values, e.g.
hydrophilization, cationization, corrosion protection, or improvement of compatibility93,94
.
/H2O
CHAPTER 1
11
PVAm can be used as a non-viral gentransfer system in biological systems, in the same way
as Chitosan. It builds a genvector-complex and infiltrates DNA into animal cells95
. In this
work, the possibility to react amines with epoxides is used for the post polymerization
modification of PVAm.
1.2 Post Polymerization Modification
There are several approaches to synthesize functional polymers described in literature. These
approaches follow one of the three main concepts: i) the direct copolymerization of functional
monomers, ii) the copolymerization of protected monomers followed by selective
deprotection, and iii) the post polymerization modification of reactive groups bearing
polymers.96
The first two concepts show some disadvantages96
: Concept i), the direct copolymerization of
functional monomers, is still not possible for a broad range of side chain functionalities due to
the occurrence of side reactions at these functionalities. Concept ii), the copolymerization of
protected monomers followed by selective deprotection, needs an additional deprotection
step. The difficulty with this deprotection step is that it may affect the structural integrity of
the polymer backbone and, in addition, that it may not proceed quantitatively. In contrast to
these two first concepts, Concept iii), the post polymerization modification of reactive groups
bearing polymers, overcomes the aforementioned disadvantages.96
It is possible to obtain
excellent conversions under mild conditions, the reactions have got an excellent functional
group tolerance, and they are orthogonal. Thereby it is possible to obtain polymers which
cannot be prepared by direct polymerization of the corresponding functional monomers.
Another exceptionally important point is the possibility to obtain a library of functional
polymers. Taking one single reactive polymer precursor as starting material the resulting
Introduction
12
functional polymers possess identical average chain length and chain length distributions and
are thereby ideally suitable for studying structure-property relationships.
1.3 Bacteria Constitution and Antimicrobial Agents
The following sections closely follow the presentation of the topics given in reference 97
(bacteria composition) and 98 (antimicrobial agents). Bacteria belong to the group of
prokaryotes and they appear with a wide range of shapes, from spheres to rods to spirals.
Although one individual microbe is very small, their total amount and thereby their collective
mass on earth is immense. They can be found almost everywhere where free liquid water is
present. Their total biomass has been estimated to be nearly as large as that of all living
plants, or even larger. Bacteria reproduce by cell division. In the laboratory, some bacteria can
divide once every 20 minutes and others can divide even faster, but there are also some that
divide more slowly, e.g., once every 24 hours (Mycobacterium tuberculosis). Despite the fact
that the number of existing bacteria is so large, some diseases are caused by interacting with
only very few of them.
The anatomy and the surface components of bacteria are adapted to their special needs and
often determine whether an organism is able to survive in a particular environment or not.
Bacteria have to face nutritionally varied conditions, withstand physical and chemical
challenges, and often need the ability to attach to surfaces. The microbial cells are therefore
surrounded by different envelope layers and bear appendages to protect the cell against hostile
environments like, e.g., extreme osmolarity, harsh chemicals, and antibiotics.
Each bacterium is surrounded by a cell membrane which usually consists of a lipid bilayer.
This membrane is the boundary between the cell interior and the environment. It consists of
phospholipids and of more than 200 different kinds of proteins, which make up more than
70% of the mass of the membrane. Like all other membranes, the bacterial membrane is
CHAPTER 1
13
sensitive to detergents and other amphipathic agents and it has to resist intracellular osmotic
pressures. To protect the membrane, the bacteria surround it with tough, bag-like structures.
These structures are different for the various kinds of bacteria. In general, one can divide
between four main groups of bacteria: i) Gram positive, ii) Gram negative, iii) acid-fast, and
iv) mycoplasmas. Most of the bacteria can be divided into Gram positive and Gram negative
bacteria, whereof the Gram negative species appears in higher quantities. The name originates
from an early Danish microbiologist (Hans Christian Joachim Gram), who developed a
method to stain bacteria. The Gram positive bacteria can be stained and retain a complex of a
purple dye (crystal violet) and iodine after a brief alcohol wash, whereas the Gram negative
bacteria lose the complex and thereby the colour; afterwards they can be stained red
(safranin). This different stainability shows the fundamental differences between the cellular
envelopes of the two kinds of bacteria. In what follows, the cell structure of Gram positive
and Gram negative bacteria is described in more detail. The acid fast and mycoplasmas cell
structure will not be described in detail because only few bacteria belong to these groups.
1.3.1 Gram Positive Bacteria
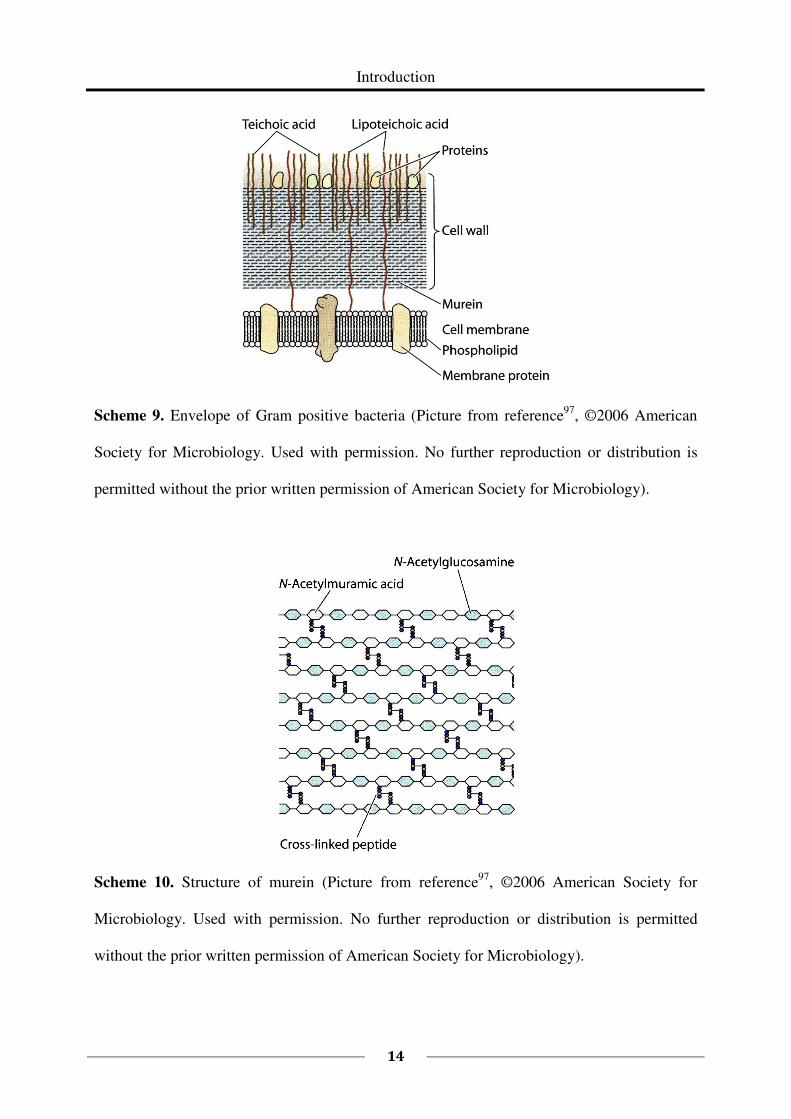
To protect the cell membrane against osmotic pressure, Gram positive bacteria are surrounded
by a thick cell wall (Scheme 9). This cell wall consists mainly of murein (Scheme 10), a
peptidoglycan (complex polymer of sugars and amino acids). The murein builds several layers
and is responsible for the bacteria’s shape and rigidity. The phosphates, sugars
(polysaccharides), and charged amino acids contained in the murein layers are highly polar
and build a hydrophilic barrier to damaging hydrophobic agents. In addition, some other
unique polymers like teichoic acids (chains of sugar alcohol) and lipoteichoic acids are linked
to the cell wall by phosphodiester bonds.
Introduction
14
Scheme 9. Envelope of Gram positive bacteria (Picture from reference97
, ©2006 American
Society for Microbiology. Used with permission. No further reproduction or distribution is
permitted without the prior written permission of American Society for Microbiology).
Scheme 10. Structure of murein (Picture from reference97
, ©2006 American Society for
Microbiology. Used with permission. No further reproduction or distribution is permitted
without the prior written permission of American Society for Microbiology).
CHAPTER 1
15
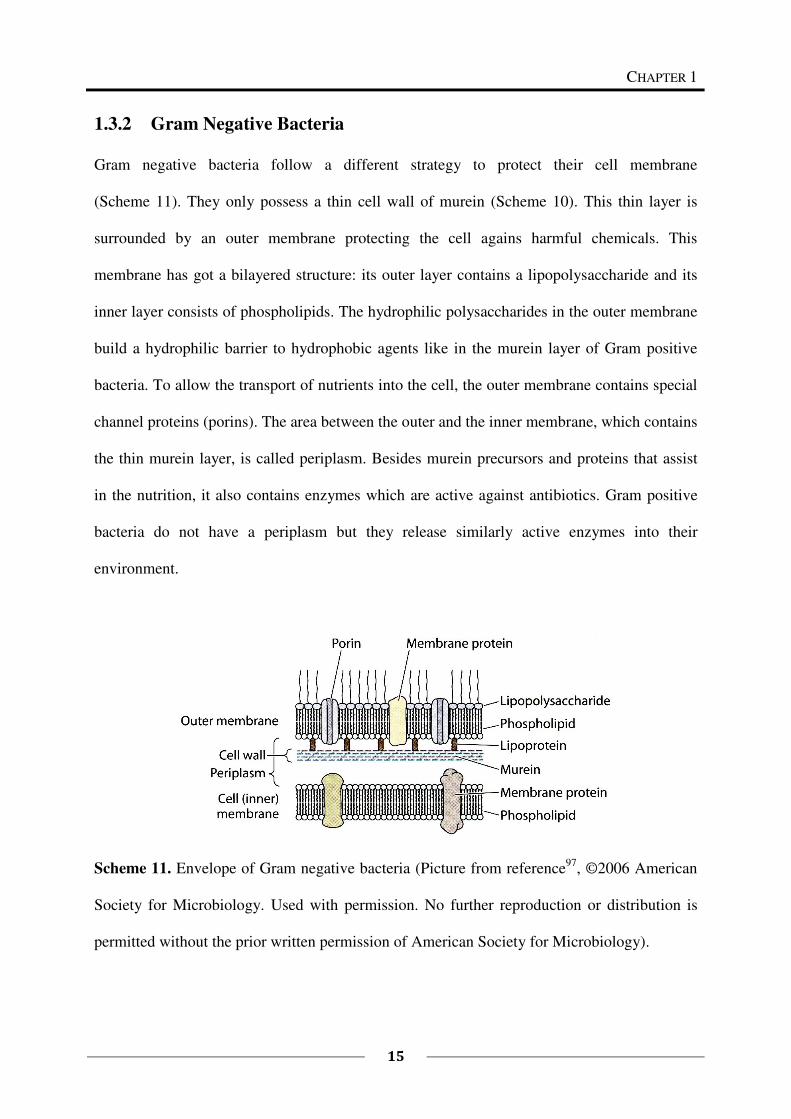
1.3.2 Gram Negative Bacteria
Gram negative bacteria follow a different strategy to protect their cell membrane
(Scheme 11). They only possess a thin cell wall of murein (Scheme 10). This thin layer is
surrounded by an outer membrane protecting the cell agains harmful chemicals. This
membrane has got a bilayered structure: its outer layer contains a lipopolysaccharide and its
inner layer consists of phospholipids. The hydrophilic polysaccharides in the outer membrane
build a hydrophilic barrier to hydrophobic agents like in the murein layer of Gram positive
bacteria. To allow the transport of nutrients into the cell, the outer membrane contains special
channel proteins (porins). The area between the outer and the inner membrane, which contains
the thin murein layer, is called periplasm. Besides murein precursors and proteins that assist
in the nutrition, it also contains enzymes which are active against antibiotics. Gram positive
bacteria do not have a periplasm but they release similarly active enzymes into their
environment.
Scheme 11. Envelope of Gram negative bacteria (Picture from reference97
, ©2006 American
Society for Microbiology. Used with permission. No further reproduction or distribution is
permitted without the prior written permission of American Society for Microbiology).
Introduction
16
In addition to the walls and membranes, some bacteria possess other external structures like
capsules (for defense), flagella (enabling the cell to move actively), and pili (diverse
functions, e.g. enabling the cell to attach to surfaces). These modifications are adaptions to
special living conditions and vary from bacteria to bacteria.
1.3.3 Antimicrobial Interaction
Several theories and models exist in literature about how an antimicrobial polymer interacts
with and how it kills bacteria. Bacterial cells carry negative charges on their surfaces with
mostly bivalent ions like Mg2+
and Ca2+
as counter ions. The cell walls and the peptidoglycan
layer (murein layer) of Gram positive bacteria contain teichoic acids and polysaccharides. The
outer membranes of Gram negative bacteria as well as the cytoplasmic membranes (inner
membranes) of both, Gram positive and Gram negative bacteria, contain anionic lipids like
phosphatidylglycerol and its dimer. As a first step of interaction, all theories consistently
describe the adsorption of the cationic antimicrobial agent onto the bacterial cell caused by
electrostatic interaction. The subsequent steps leading to the destruction of the bacterium vary
for the different theories.99
Some theories explain the destruction of the bacteria cells by
electrostatic interaction only, whereas others contain an active disruption of the bacterial
cytoplasmic membrane by functional groups of the antimicrobial agent. This disruption leads
to the death of the bacterium by leaching of intracellular components like K+, PO4
3-, DNA,
RNA, and other cytoplasmic components from its interior.
1.3.4 Systems Acting by Electrostatic Interaction
The easiest theory described, e.g., by Chen et al.99 is based on the idea that negatively charged
lipids are extracted from the bacterial membrane and are bound to the cationic functionality of
the antimicrobial agent. Hereby, the membrane is damaged and finally destroyed. Ikeda et al.
CHAPTER 1
17
describe the same effect100
. They analyzed polycationic substances with biguanidine
hydrochloride groups and were able to show the formation of complexes with the anionic
phosphatidylglycerol of the membrane. In contrast, no complexes with neutral lipids were
built. According to the authors this complexation of anionic lipids leads to a destabilization
and finally to the destruction of the membrane.
Another theory discusses the rearrangement of the anionic lipids within the bacterial
membrane caused by the cationic antimicrobial agent. The lipids can freely move within
(lateral diffusion) and in-between (transversal diffusion) the phospholipid bilayers of the
membrane.101
If the antimicrobial agent comes close to the bacterium, a rearrangement of the
anionic lipids within the bacterial membrane is caused. The anionic lipids move towards the
contrarily charged surface and neutral lipids replace them in the inner layer. This essentially
disturbs the identification and the metabolism activities because these activities depend on the
specific arrangement of the lipids. This causes the death of the bacterial cell102
.
1.3.5 Systems Acting by Active Disruption of the Bacterial Cytoplasmic
Membrane by, e.g., Functional Groups of the Antimicrobial Agent
Besides the mechanisms based on electrostatic interaction, there is evidence for other
mechanisms which include an active disruption of the cytoplasmic membrane as crucial step.
The prerequisite for these mechanisms is that the active components of the antimicrobial
agent reach the membrane. Franklin et al. proposed a concept consisting of six steps for such
a mode of action in 1981.103
Introduction
18
The six steps are:
1) Adsorption onto the bacterial cell due to electrostatic interaction.
2) Diffusion through the cell wall
3) Binding or rather adsorption to the cytoplasmic membrane
4) Disruption of the cytoplasmic membrane
5) Release of K+ ions and other constituents of the cytoplasmic membrane
6) Death of the cell
By comparing monomeric and polymeric antimicrobial agents, the first difference in
behaviour can be observed in the initial step. Here the adsorption of the polycation to the
negatively charged bacterial cell takes place more strongly and to a greater extent than that of
the monomeric agent. This is due to the higher charge density within the polycation. After a
successful diffusion through the cell wall, the hydrophobic or lipophilic moieties of the
antimicrobial agent bind to the cytoplasmic membrane and disrupt it. The longer/bigger the
hydrophobic moieties are, the more hindered is the diffusion. A careful adjustment of the
hydrophilic/hydrophobic balance is therefore of great importance.
1.3.6 Antimicrobial Surfaces
If the antimicrobial agent is bound to a surface, the chain length of the polymer is important
for the activity. The chains need to have a certain length to be able to penetrate through the
approximately 30 nm thick cell wall and to reach the cytoplasmic membrane.104
Surface
bound antimicrobial agents, so called contact systems, show some advantages: The agent is
not released to the environment and thereby the concentration of the compound on the surface
is constant. After one bacterium has been killed, the agent is not consumed and available for
the next bacterium. Therefore, the surface has got an enduring activity against bacteria. A
CHAPTER 1
19
drawback of contact systems is that destroyed bacteria and impurities from the surrounding
medium can stick to the surface and contaminate it. The antimicrobial surface is then covert
and not active against bacteria anymore. For this reason, the surfaces have to be regularly
cleaned and have to be resistant to this cleaning step.
In this work, quaternary ammomium groups bearing polymers were developed. This kind of
polymers is known to be more active against Gram positive bacteria than against Gram
negative bacteria due to differences in the cell wall composition.103
The developed polymers
were tested both in solution and bound to surfaces for their antimicrobial activity.
1.4 Content of this Thesis
This thesis deals with the preparation and characterization of multifunctional, antimicrobial,
protein-like poly(vinyl amine)s. The polymers were characterized with regard to the influence
of the hydrophilic/hydrophobic balance on several properties in aqueous solution and coated
on surfaces. The influence of different microstructures within polymers of the same chemical
composition and molecular weight on these properties was investigated.
Chapter 1 (present block) gives an introduction on the used polymer poly(vinyl amine), the
post polymerisation modification technique, as well as the constitution of bacteria and modes
of action of antimicrobial agents.
Chapter 2 presents the synthesis of multifunctional polymers starting from poly(vinyl amine)
by post polymerization modification with different functional epoxides to introduce
quaternary ammonium groups and alkyl chains into the polymer. Kinetic studies and
fractionation experiments to prove a homogenous modification were performed.
Chapter 3 deals with the ability of functional poly(vinyl amine)s to form micelle-like
aggregates in aqueous solution. The critical aggregation concentrations were determined
depending on the chain length and on the concentration of the introduced alkyl chains.
Introduction
20
In Chapter 4, the antimicrobial activity of the developed polymers was determined in
solution and coated on substrates. The influence of the hydrophilic/hydrophobic balance on
the antimicrobial activity and on the ability to penetrate into lipid monolayers was studied.
Chapter 5 shows the synthesis of polymers with different microstructures but having the
same chemical composition and molecular weight. The influence of the microstructures on
different properties like antimicrobial effect, critical aggregation concentration, hemolytic
activity, penetration ability into membranes, and viscosity was investigated. The effect of
annealing on the antimicrobial activity of polymer coated surfaces was studied.
Appendix A provides the proliferation curves of E. coli after exposure on surfaces coated
with the tested polymers, as supplementary material to Chapter 4.
1.6 Literature
1 Infectious Diseases Society of America (IDSA), Clin. Infect. Dis. 2012, 55 (8), 1031-1046.
2 M. E. Falagas, I. A. Bliziotis, Int. J. Antimicrob. Agents 2007, 29, 630–636.
3 M. E. Falagas, P. I. Rafailidis, D. K. Matthaiou, S. Virtzili, D. Nikita, A. Michalopoulos, Int. J. Antimicrob.
Agents 2008, 32, 450–454.
4 R. Valencia, L. A. Arroyo, M. Conde, Infect. Control. Hosp. Epidemiol. 2009, 30, 257–263.
5 M. S. Hoffmann, M. R. Eber, R. Laxminarayan, Infect. Control Hosp. Epidemiol. 2010, 31, 196–197.
6 M. D. Adams, G. C. Nickel, S. Bajaksouzian, Antimicrob. Agents Chemother. 2009, 53, 3628–3634.
7 E. Lautenbach, M. Synnestvedt, M. G. Weiner, Infect. Control Hosp. Epidemiol. 2009, 30, 1186–1192.
8 S. Navon-Venezia, A. Leavitt, Y. Carmeli, J. Antimicrob. Chemother. 2007, 59, 772–774.
9 E. F. Palermo, K. Kuroda, Appl Microbiol Biotechnol 2010, 87, 1605–1615.
10 H. W. Boucher, G. H. Talbot, J. S. Bradley, J. E. Edwards, D. Gilbert, L. B. Rice, M. Scheld, B. Spellberg, J.
Bartlett, Clin. Infect. Dis. 2009, 48, 1–12.
11 R. E. W. Hancock, R. Lehrer, Trends Biotechnol. 1998, 16, 82–88.
12 A. K. Marr, W. J. Gooderham, R. E. W. Hancock, Curr. Opin. Pharmacol. 2006, 6, 468–472.
CHAPTER 1
21
13 A. Klibanov, J. Mater. Chem. 2007, 17, 2479–2482
14 T. Tashiro, Macromol. Mater. Eng. 2001, 286, 63-87.
15 M. A. Gelman, B. Weisblum, D. M. Lynn, S. H. Gellman, Org. Lett. 2004, 6, 557–560.
16 G. J. Gabriel, A. Som, A. E. Madkour, T. Eren, G. N. Tew, Mater. Sci. Eng. R. Rep. 2007 57, 28–64.
17 G. N. Tew, R. W. Scott, M. L. Klein, W. F. Degrado, Acc. Chem. Res. 2010 43, 30–39.
18 C. Z. S. Chen, S. L. Cooper, Adv Mater 2000, 12, 843–846.
19 M. F. Ilker, K. Nusslein, G. N. Tew, E. B. Coughlin, J. Am. Chem. Soc. 2004, 126, 15870–15875.
20 K. Kuroda, G. A. Caputo, W. F. DeGrado, Chem. Eur. J. 2009, 15, 1123–1133.
21 B. P. Mowery, S. E. Lee, D. A. Kissounko, R. F. Epand, R. M. Epand, B. Weisblum, S. S. Stahl, S. H.
Gellman, J. Am. Chem. Soc. 2007, 129, 15474.
22 B. P. Mowery, A. H. Lindner, B. Weisblum, S. S. Stahl, S. H. Gellman, J. Am. Chem. Soc. 2009, 131, 9735–
9745.
23 E. F. Palermo, K. Kuroda, Biomacromolecules 2009, 10, 1416–1428.
24 E. F. Palermo, I. Sovadinova, K. Kuroda, Biomacromolecules 2009, 10, 3098–3107.
25 P. H. Sellenet, B. Allison, B. M. Applegate, J. P. Youngblood, Biomacromolecules 2007, 8, 19–23.
26 T. R. Stratton, J. L. Rickus, J. P. Youngblood, Biomacromolecules 2009, 10, 2550–2555.
27 N. Pasquier, H. Keul, E. Heine, M. Moeller, B. Angelov, S. Linser, R. Willumeit, Macromol. Biosci. 2008, 8,
903–915.
28 É. Kiss, E. T. Heine, K. Hill, Y-C. He, N. Keusgen, Cs. B. Pénzes, D. Schnöller, G. Gyulai, A. Mendrek, H.
Keul, M. Möller, Macromolecular Bioscience 2012, 12 (9), 1181–1189.
29 Y. He, E. Heine, N. Keusgen, H. Keul, M. Möller, Biomacromolecules 2012, 13 (3), 612–623.
30 L. Silvestro, J. N. Weiser, P. H. Axelsen, Antimicrob. Agents Chemother. 2000, 44 (3), 602–607.
31 M. Zasloff, Nature 2002, 415, 389.
32 O. Toke, L. Cegelski, J. Schaefer, Biochim. Biophys. Acta 2006, 1758, 1314.
33 H. Sato, J. B. Feix, Biochim. Biophys. Acta 2006, 1758, 1245.
34 Y. Shai, Biopolymers 2002, 66, 236.
35 D. I. Chan, E. J. Prenner, H. J. Vogel, Biochim. Biophys. Acta 2006, 1758, 1184.
36 CD Römpp Chemielexikon, Version 1.0, Georg Thieme Verlag, Stuttgart/New York 1995.
Introduction
22
37 S. Zhang, J. Yang, Z. Hu, Journal of Dalian University of Technology 46, 2002, 2, 659-662.
38 E. Parzich, GIT Labor-Fachzeitschrift 2 2005, 133-135.
39 W. E. Hanford, H. B. Stevenson, Patent 1944, US 2365340.
40 D. D. Reynolds, W. O. Kenyon, J. Am. Chem. Soc. 1947, 69, 911-915.
41 H. J. Tanaka, J. Polym. Sci. Part B 1978, 16, 87-89.
42 D. J. Dawson, R. D. Gless, R. E. Wingard Jr., J. Am. Chem. Soc. 1976, 98, 5996–6000.
43 R. W. Stackman, R. H. Summerville, Ind. Eng. Chem. Prod. Res. Dev. 1985, 24, 242–246.
44 C. G. Overberger, S. J. Kikiyotani, Polym. Sci. Chem. Ed. 1983, 21, 525–540.
45 D. J. Dawson, P. J. Brock, Patent 1983, US 4393174.
46 P. Kurtz, H. Disselnkoetter, Patents 1966, DE 1228246 and DE 1224304.
47 R. K. Pinschmidt Jr., D. J. Sagl, Polymeric Materials Encyclopedia; Ed.: Salamone, J. C.; CRC Press New
York 1996, 7095 ff.
48 S. Stinson, Chem. Eng. News 1993, 71 (36), 32.
49 R. J. Badesso, R. K. Pinschmidt Jr., D. J. Sagl, Proc. Am. Chem. Soc., Div. Polym. Mat. Sci. Eng. 1993, 69,
251.
R. J. Badesso, A. F. Nordquist, R. K. Pinschmidt Jr., D. J. Sagl, In: Hydrophilic Polymers: Performance with
Environmental Acceptance; E. Glass, Ed.; American Chemical Society: Washington, D.C., 1995; 489
50 M. Ford, J. N. Armor, Patent 1996, US 5491199.
51 Technisches Merkblatt N-Vinylformamid, Mitsubishi Kasai, Japan, 1997.
52 L. Gu, S. Zhu, A. N. Hrymak, R. H. Pelton, Polymer 2001, 42, 3077–3086.
53 L. Gu, S. Zhu, A. N. Hrymak, J. Appl. Polym. Sci. 2002, 86, 3412–3419.
54 M. Kröner, J. Dupuis, M. Winter, J. Prakt. Chem. 2000, 342, 115–131.
55 Produkt-Informationsbroschüre zu Lupaminen®, BASF AG, Ludwigshafen, 2000.
56 H.-G. Elias, Makromoleküle: Struktur-Eigenschaften-Synthesen Stoffe, 2. Edition., Hüthig & Wepf Verlag,
Basel, Heidelberg 1972, 271–275.
57 L. J. Kirwan, G. Papastavrou, M. Borkovec, Nano Lett. 2004, 4, 149–152.
58 R. Pelton, J. Hong, Colloid Polymer Science 280 2002, 203-205.
59 S. Zhang, J. Yang, Y. Chen, Z. Hu, Journal of Applied Polymer Science 89 2003, 3889-3893.
CHAPTER 1
23
60 E. Poptoshev, M. W. Rutland, P. M. Claesson, Langmuir 2000, 16, 1987–1992.
61 A. Shulga, J. Widmaier, E. Pefferkorn, S. Champ, H. Auweter, Journal of Colloid and Interface Science 2003,
258, 219–227.
62 A. Shulga, J. Widmaier, E. Pefferkorn, S. Champ, H. Auweter, Journal of Colloid and Interface Science 2003,
258, 228–234.
63 C. Hamaciuc, R. Dyllick-Brenzinger, K. Müllen, M. Klapper, Angewandte Chemie 2003, 115, 4835-4838.
64 Polyvinylamin, BASF AG, Firmen-Information 2004.
65 S. Kobayashi, K.-D. Suh, Y. Shirokura, Macromolecules 1989, 22, 2363.
66 R. J. Badesso, A. F. Nordquist, R. K. Pinschmidt Jr., D. J. Sagl, Adv. Chem. Ser. 1996, 248, 489-504.
67 W. E. Caroll, N. Chen, J. Drescher, A. F. Nordquist, R. K. Pinschmidt Jr.; W. L. Renz, K. J. Yacoub,
Macromol. Sci., Pure Appl. Chem. 1997, A34, 1885 – 1905.
68 I. Voigt, F. Simon, H. Komber, H. J. Jacobasch, S. Spange, Colloid Polym. Sci. 2000, 278, 48-56.
69 B. J. Haupt, J. Ennis, E. M. Sevick, Langmuir 1999, 15, 3886-3892.
70 I. Roth, S. Spange, Macromol. Rapid Commun. 2001, 22, 1288-1291.
71 W. Renz Jr., W. E. Carroll, K. Yacoub, J. Drescher, A. Nordquist, N. Cheng, R. K. Pinschmidt, Pure Applied
Chemistry A 34 1997, 10, 1885-1905.
72 G. V. Seguel, K. E. Geckeler, B. L. Rivas, Angewandte Makromolekulare Chemie 1997, 251, 97-106.
73 A. Rether, Entwicklung und Charakterisierung wasserlöslicher Benzoylthioharnstoff-funktionalisierter
Polymere zur selektiven Abtrennung von Schwermetallionen aus Abwässern und Prozesslösungen. In:
Dissertation, München 2002.
74 Z. Zhang, X. Xuewei, L. Wang, X. Zhu, J. Lu, Journal of Molecular Catalysis A: Chemical 2004, 207, 204-
214.
75 Y. Qui, T. Zang, M. Ruegsegger, R. E. Marchant Macromolecules 1998, 31, 165–171.
76 F. Linhart, W. Auhorn, Das Papier 1992, 10A, V38–V45.
77 U. Riebeling, A. De Clercq, A. Stange, N. Sendhoff, C. Nilz, M. Kröner, Patent 1993, EP 553135.
78 F. Wang, H. Tanaka J. Appl. Polym. Sci. 2000, 78, 1805–1810.
79 F. Brunnmueller, R. Schneider, M. Kroener, H. Mueller, F. Linhart, H. Burkert, K.-H. Beyer, Patent 1982,
EP 071050.
Introduction
24
80 R. K Pinschmidt Jr, B. R. Vijayendran, Ta.-W. Lai, Patent 1992, US 5085787.
81 Jr. R.K. Pinschmidt, T. Lai, Patent 1990, US 4931194.
82 P. Shu, Patent 1992, US 5134176.
83 D. Monech, H. Hartmann, E. Freudenberg, A. Stange, Patent 1993, US 5262008; W. Auhorn, F. Linhart, P.
Lorencak, M. Kroener, N. Sendhoff, W. Deninger, H. Hartmann, Patent 1992, US 5145559; S. Pfohl, M.
Kroener, H. Hartmann, W. Denzinger, Patents 1989, US 4978427, US 4880497 and 1988, US 4774285.
84 H. Burkert, F. Brunnmueller, K. Beyer, M. Kroener, H. Mueller, Patent 1984, US 4444667.
85 D. Monech, H. Hartmann, K. Buechner, Patent 1993, US 5225088.
86 W. E. Lenney, D. Sagl, Patent 1995, US 5470903.
87 I. Cabrera, Patent 1997, EP 894809.
88 B. Martel, A. Pollet, M. Morcellet, Macromolecules 1994, 27, 5258–5262.
89 T. Beihoffer, M. Mitchell, L. T. Truzpek, J. W. Darlington, M. Anderson, Patent 2001, US 6194631.
90 T. Beihoffer, M. Mitchell, J. W. Darlington, M. Anderson, Patent 1997, WO 99/25745.
91 T. Beihoffer, M. Mitchell, Patent 2000, US 6159591.
92 T. Beihoffer, M. Mitchell, Patent 2001, US 6235965.
93 H. Keller, G. Hoffmann, W. Denzinger, R. Fässler, Patent 1994, EP 672467.
94 A. Schrell, B. Huber, Patent 1994, EP 692559.
95 S. Gersting, Einfluss Extrazellulärer Faktoren auf Struktur und Funktion viraler Genvektoren. In: Dissertation,
Ludwig-Maximilians-Universität München 2003.
96 M. A. Gauthier, M. I. Gibson, H-A. Klok, Angew. Chem. Int. Ed. 2009, 48, 48-58.
97 M. Schaechter, J. L. Ingraham, F. C. Neidhardt, Microbe – Das Original mit Übersetzungshilfen, 1. Ed.,
Elsevier GmbH, München, 2007, 3ff.
98 A. M. Bieser, Oberflächenmodifizierung durch Hydrogelierung und durch Beschichtung mit antimikrobiellen
Cellulosederivaten. In: Dissertation, Freiburg im Breisgau 2007.
99 C.Z. Chen, S. L. Cooper, Biomaterials 2002, 23, 3359-3368.
100 T. Ikeda, S. Tazuke, M. Watanabe, Biochim. Biophys. Acta 1983, 735, 380.
101 S. J. Singer, G. L. Nicolson, Science 1972, 175, 720.
102 A. A. Yaroslavov, N. S. Melik-Nubarov, F. M. Menger, Acc. Chem. Res., 2006, 39, 702.
CHAPTER 1
25
103 T. Tashiro, Macromol. Mater. Eng. 2001, 286, 63-87.
With reference to: T. J. Franklin, G. A. Snow, Eds., “Biochemistry of Antimicrobial Action, Antiseptics,
Antibiotics, and the Cell Membrane”, Chapman & Hall, Ltd., London 1981, p. 58–78.
104 J. C. Tiller, C-J. Liao, K. Lewis, A. M. Klibanov Proc. Nat. Acad. Sci. U.S.A. 2001, 98, 5981.

Introduction
26
CHAPTER 2
27
SYNTHESIS OF AMPHIPHILIC POLYMERS FROM
POLY(VINYL AMINE)
2.1 Introduction
Functional polymers are a field of increasing interest in polymer chemistry and several
approaches for their synthesis have been developed: i) direct copolymerization of functional
monomers, ii) copolymerization of protected monomers followed by selective deprotection,
and iii) post polymerization modification of polymers bearing reactive groups.1 Although new
controlled “living” radical polymerization techniques have been developed and there have
been advances in catalytic polymerization expanding the functional group tolerance, the direct
copolymerization of functional monomers is still not possible for a broad range of side chain
functionalities.1 The copolymerization of protected monomers has the disadvantage of an
additional deprotection step which may affect the structural integrity of the polymer backbone
and which may not proceed quantitatively in addition. In contrast, the post polymerization
modification (also called polymer analogous reaction) is a very attractive approach to
synthesize functional polymers. It overcomes the limited functional group tolerance of many
controlled “living” polymerization techniques.1 In a first step, monomers with functional and
reactive groups that are inert towards the polymerization conditions are polymerized. In the
second step, the conversion of the reactive side groups with suitable reagents leads to new
functionalities. The main advantages of the post polymerization modification are excellent
conversions under mild conditions, the excellent functional group tolerance and the
orthogonality of the reactions. The post polymerization modification gives access to
Synthesis of Amphiphilic Polymers from Poly(vinyl amine)
28
functional polymers which cannot be prepared by direct polymerization of the corresponding
functional monomers. It is furthermore possible to synthesize a library of functional polymers
starting from one single reactive polymer precursor. All resulting functional polymers possess
identical average chain lengths and identical chain length distributions so that the
investigation of structure-property relationships becomes possible.
In this chapter, the post polymerization modification of poly(vinyl amine) (PVAm) as single
reactive polymer precursor is presented. As described in Chapter 1, PVAm is a linear, weak,
cationic polyelectrolyte with up to 100 % free primary amine groups, one per repeating unit.
Its direct synthesis from vinylamine is not possible due to the enamine-imine tautomerism.
Therefore, PVAm is nowadays prepared from poly(N-vinyl formamide) (PNVF) by
hydrolysis under moderate conditions both in acidic and in alkaline media. PNVF is prepared
by radical polymerization using oil- or water-soluble azocompounds as initiatior. Functional
polyelectrolytes with high molecular weights are easily obtained. Alkaline hydrolysis of
PNVF yields almost 100 % conversion of the functional groups to free amine groups, whereas
acidic hydrolysis allows only up to 80 % conversion due to electrostatic repulsion2. The
degree of hydrolysis and thereby the charge density of the polymer backbone can be adjusted
by the choice of the hydrolysis conditions like temperature, reaction time, and amount of acid
or base.3,4,5,6,7,8
Post polymerization modification of the free primary amine groups of PVAm with functional
epoxides is presented in this chapter and the resulting functional polymers are characterized.
By this approach, different functionalities (cationic and hydrophobic groups) were introduced
as side groups within the polymer. The resulting polymers are potential candidates for
antimicrobial finishings or coatings because the combination of these functionalities is known
to be antimicrobially active.9,10,11,12
CHAPTER 2
29
2.2 Experimental Part
Poly(vinyl amine) is composed of different repeating units: vinyl amine and residual vinyl
formamide. The ratio of these repeating units can be determined by 1H NMR spectroscopy. In
what follows, M denotes the averaged molecular weight of the repeating units calculated
from the 1H NMR spectrum.
2.2.1 Materials
Starting materials were used as received: 1,2-epoxyoctane (EA8) (Alfa Aesar, 97 %), 1,2-
epoxydecane (EA10) (Alfa Aesar, 97 %), 1,2-epoxydodecane (EA12) (Alfa Aesar, 96 %) and
glycidyltrimethylammonium chloride (EQ) (Aldrich, 75-80 % in water; since the oxirane
degrades in time, the active content is determined just before use by NMR spectroscopy).
Three different poly(vinyl amine)s (PVAm) have been supplied by BASF: Lupamin 9095
(supplier information: molecular weight = 340.000 g/mol), Lupamin 1595 (supplier
information: molecular weight = 10.000 g/mol), explorative material: salt free PVAm
(supplier information: purified by ultra filtration, molecular weight = 340.000 g/mol).
Lupamin 9095 and Lupamin 1595 are technical polymer solutions with up to 70 % salt-
content. PVAm was freeze-dried before use. The dialysis tubings of regenerated cellulose had
a molecular weight cut off of 25 kDa and 50 kDa (CelluSep). The analytical data of the
PVAm charges are summarized in Table 1.
Synthesis of Amphiphilic Polymers from Poly(vinyl amine)
30
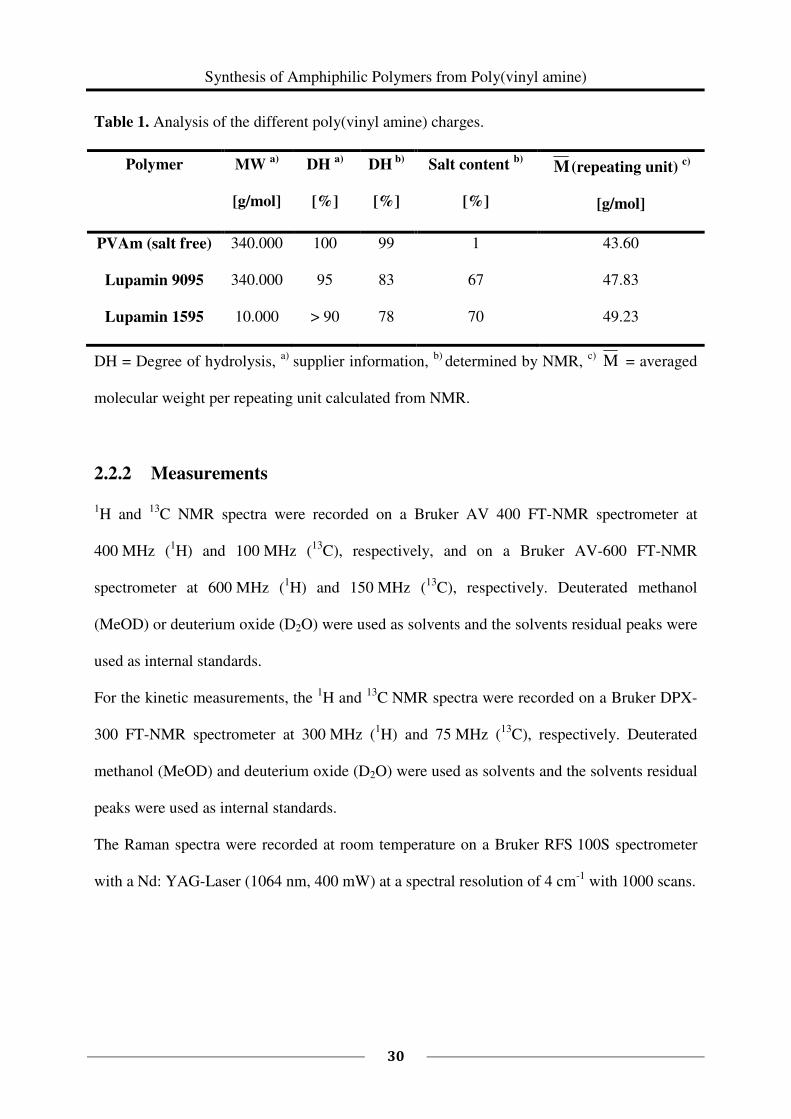
Table 1. Analysis of the different poly(vinyl amine) charges.
Polymer
MW a)
[g/mol]
DH a)
[%]
DH b)
[%]
Salt content b)
[%]
M (repeating unit) c)
[g/mol]
PVAm (salt free) 340.000 100 99 1 43.60
Lupamin 9095 340.000 95 83 67 47.83
Lupamin 1595 10.000 > 90 78 70 49.23
DH = Degree of hydrolysis, a)
supplier information, b)
determined by NMR, c)
M = averaged
molecular weight per repeating unit calculated from NMR.
2.2.2 Measurements
1H and
13C NMR spectra were recorded on a Bruker AV 400 FT-NMR spectrometer at
400 MHz (1H) and 100 MHz (
13C), respectively, and on a Bruker AV-600 FT-NMR
spectrometer at 600 MHz (1H) and 150 MHz (
13C), respectively. Deuterated methanol
(MeOD) or deuterium oxide (D2O) were used as solvents and the solvents residual peaks were
used as internal standards.
For the kinetic measurements, the 1H and
13C NMR spectra were recorded on a Bruker DPX-
300 FT-NMR spectrometer at 300 MHz (1H) and 75 MHz (
13C), respectively. Deuterated
methanol (MeOD) and deuterium oxide (D2O) were used as solvents and the solvents residual
peaks were used as internal standards.
The Raman spectra were recorded at room temperature on a Bruker RFS 100S spectrometer
with a Nd: YAG-Laser (1064 nm, 400 mW) at a spectral resolution of 4 cm-1
with 1000 scans.
CHAPTER 2
31
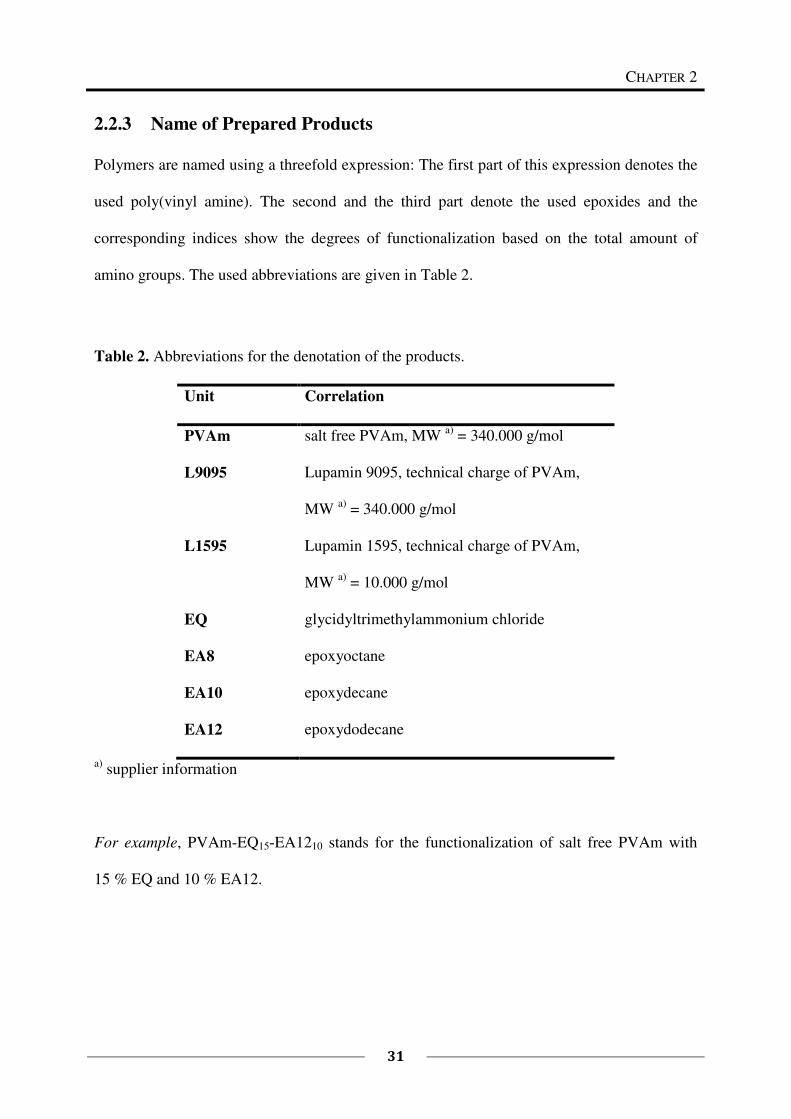
2.2.3 Name of Prepared Products
Polymers are named using a threefold expression: The first part of this expression denotes the
used poly(vinyl amine). The second and the third part denote the used epoxides and the
corresponding indices show the degrees of functionalization based on the total amount of
amino groups. The used abbreviations are given in Table 2.
Table 2. Abbreviations for the denotation of the products.
Unit Correlation
PVAm salt free PVAm, MW a)
= 340.000 g/mol
L9095 Lupamin 9095, technical charge of PVAm,
MW a)
= 340.000 g/mol
L1595 Lupamin 1595, technical charge of PVAm,
MW a)
= 10.000 g/mol
EQ glycidyltrimethylammonium chloride
EA8 epoxyoctane
EA10 epoxydecane
EA12 epoxydodecane
a) supplier information
For example, PVAm-EQ15-EA1210 stands for the functionalization of salt free PVAm with
15 % EQ and 10 % EA12.
Synthesis of Amphiphilic Polymers from Poly(vinyl amine)
32
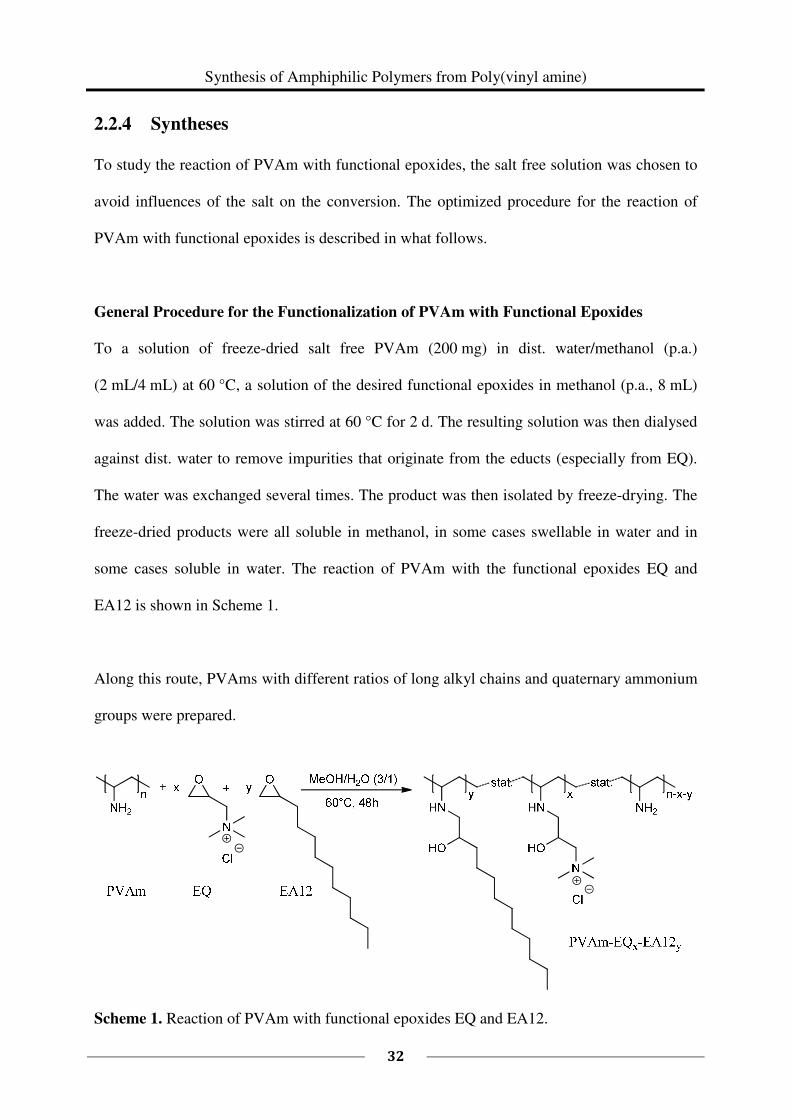
2.2.4 Syntheses
To study the reaction of PVAm with functional epoxides, the salt free solution was chosen to
avoid influences of the salt on the conversion. The optimized procedure for the reaction of
PVAm with functional epoxides is described in what follows.
General Procedure for the Functionalization of PVAm with Functional Epoxides
To a solution of freeze-dried salt free PVAm (200 mg) in dist. water/methanol (p.a.)
(2 mL/4 mL) at 60 °C, a solution of the desired functional epoxides in methanol (p.a., 8 mL)
was added. The solution was stirred at 60 °C for 2 d. The resulting solution was then dialysed
against dist. water to remove impurities that originate from the educts (especially from EQ).
The water was exchanged several times. The product was then isolated by freeze-drying. The
freeze-dried products were all soluble in methanol, in some cases swellable in water and in
some cases soluble in water. The reaction of PVAm with the functional epoxides EQ and
EA12 is shown in Scheme 1.
Along this route, PVAms with different ratios of long alkyl chains and quaternary ammonium
groups were prepared.
Scheme 1. Reaction of PVAm with functional epoxides EQ and EA12.
CHAPTER 2
33
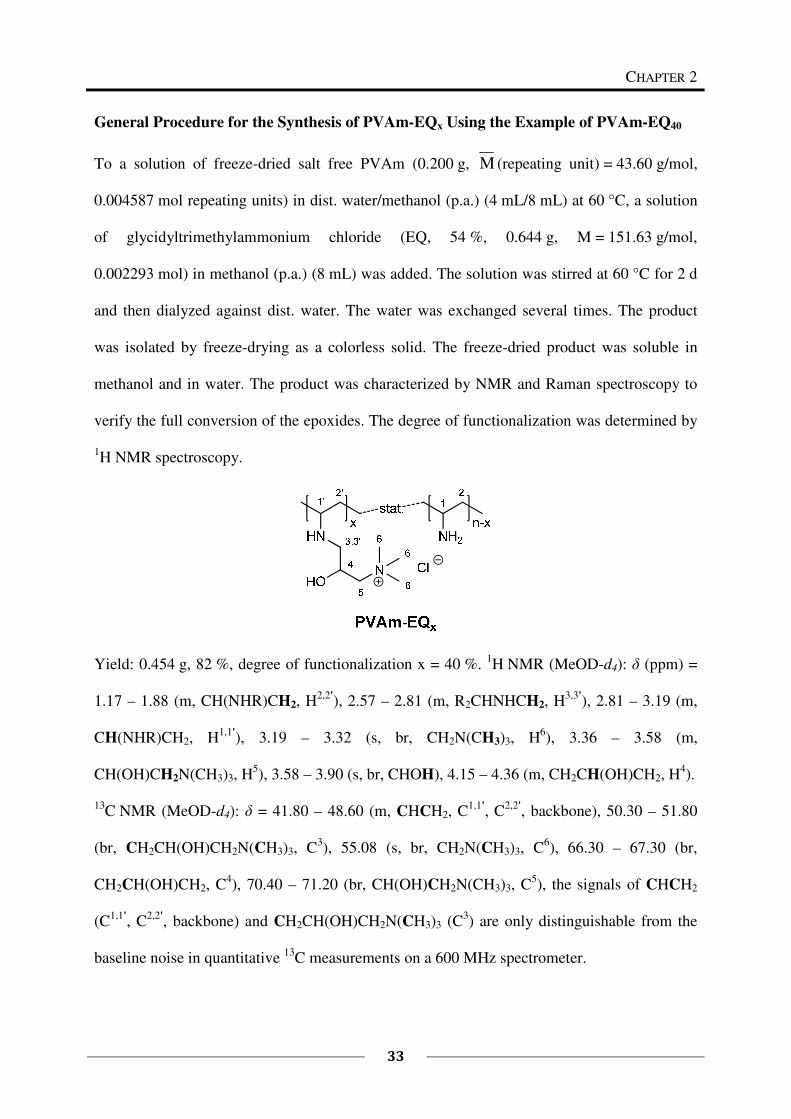
General Procedure for the Synthesis of PVAm-EQx Using the Example of PVAm-EQ40
To a solution of freeze-dried salt free PVAm (0.200 g, M (repeating unit) = 43.60 g/mol,
0.004587 mol repeating units) in dist. water/methanol (p.a.) (4 mL/8 mL) at 60 °C, a solution
of glycidyltrimethylammonium chloride (EQ, 54 %, 0.644 g, M = 151.63 g/mol,
0.002293 mol) in methanol (p.a.) (8 mL) was added. The solution was stirred at 60 °C for 2 d
and then dialyzed against dist. water. The water was exchanged several times. The product
was isolated by freeze-drying as a colorless solid. The freeze-dried product was soluble in
methanol and in water. The product was characterized by NMR and Raman spectroscopy to
verify the full conversion of the epoxides. The degree of functionalization was determined by
1H NMR spectroscopy.
Yield: 0.454 g, 82 %, degree of functionalization x = 40 %. 1H NMR (MeOD-d4): δ (ppm) =
1.17 – 1.88 (m, CH(NHR)CH2, H2,2'
), 2.57 – 2.81 (m, R2CHNHCH2, H3,3'
), 2.81 – 3.19 (m,
CH(NHR)CH2, H1,1'
), 3.19 – 3.32 (s, br, CH2N(CH3)3, H6), 3.36 – 3.58 (m,
CH(OH)CH2N(CH3)3, H5), 3.58 – 3.90 (s, br, CHOH), 4.15 – 4.36 (m, CH2CH(OH)CH2, H
4).
13C NMR (MeOD-d4): δ = 41.80 – 48.60 (m, CHCH2, C
1,1', C
2,2', backbone), 50.30 – 51.80
(br, CH2CH(OH)CH2N(CH3)3, C3), 55.08 (s, br, CH2N(CH3)3, C
6), 66.30 – 67.30 (br,
CH2CH(OH)CH2, C4), 70.40 – 71.20 (br, CH(OH)CH2N(CH3)3, C
5), the signals of CHCH2
(C1,1'
, C2,2'
, backbone) and CH2CH(OH)CH2N(CH3)3 (C3) are only distinguishable from the
baseline noise in quantitative 13
C measurements on a 600 MHz spectrometer.
Synthesis of Amphiphilic Polymers from Poly(vinyl amine)
34
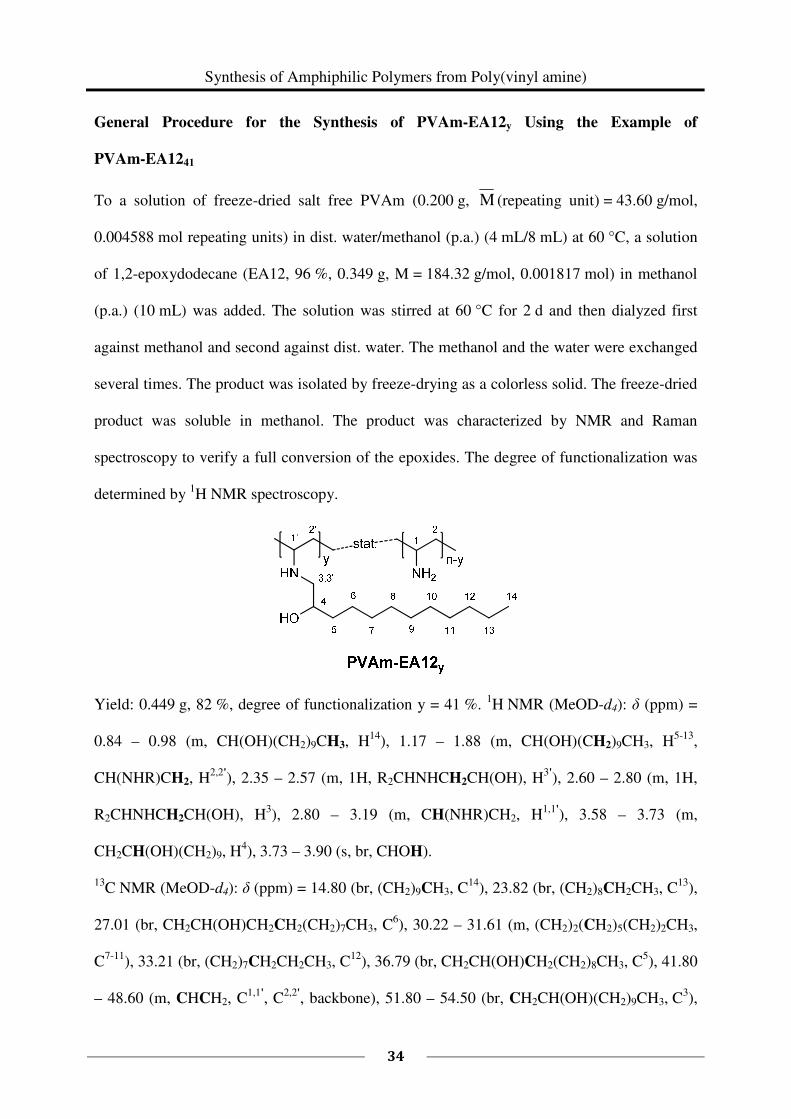
General Procedure for the Synthesis of PVAm-EA12y Using the Example of
PVAm-EA1241
To a solution of freeze-dried salt free PVAm (0.200 g, M (repeating unit) = 43.60 g/mol,
0.004588 mol repeating units) in dist. water/methanol (p.a.) (4 mL/8 mL) at 60 °C, a solution
of 1,2-epoxydodecane (EA12, 96 %, 0.349 g, M = 184.32 g/mol, 0.001817 mol) in methanol
(p.a.) (10 mL) was added. The solution was stirred at 60 °C for 2 d and then dialyzed first
against methanol and second against dist. water. The methanol and the water were exchanged
several times. The product was isolated by freeze-drying as a colorless solid. The freeze-dried
product was soluble in methanol. The product was characterized by NMR and Raman
spectroscopy to verify a full conversion of the epoxides. The degree of functionalization was
determined by 1H NMR spectroscopy.
Yield: 0.449 g, 82 %, degree of functionalization y = 41 %. 1H NMR (MeOD-d4): δ (ppm) =
0.84 – 0.98 (m, CH(OH)(CH2)9CH3, H14
), 1.17 – 1.88 (m, CH(OH)(CH2)9CH3, H5-13
,
CH(NHR)CH2, H2,2'
), 2.35 – 2.57 (m, 1H, R2CHNHCH2CH(OH), H3'
), 2.60 – 2.80 (m, 1H,
R2CHNHCH2CH(OH), H3), 2.80 – 3.19 (m, CH(NHR)CH2, H
1,1'), 3.58 – 3.73 (m,
CH2CH(OH)(CH2)9, H4), 3.73 – 3.90 (s, br, CHOH).
13C NMR (MeOD-d4): δ (ppm) = 14.80 (br, (CH2)9CH3, C
14), 23.82 (br, (CH2)8CH2CH3, C
13),
27.01 (br, CH2CH(OH)CH2CH2(CH2)7CH3, C6), 30.22 – 31.61 (m, (CH2)2(CH2)5(CH2)2CH3,
C7-11
), 33.21 (br, (CH2)7CH2CH2CH3, C12
), 36.79 (br, CH2CH(OH)CH2(CH2)8CH3, C5), 41.80
– 48.60 (m, CHCH2, C1,1'
, C2,2'
, backbone), 51.80 – 54.50 (br, CH2CH(OH)(CH2)9CH3, C3),
CHAPTER 2
35
70.40 – 71.20 (br, CH2CH(OH)(CH2)9CH3, C4), the signals of CHCH2 (C
1,1', C
2,2', backbone)
and CH2CH(OH)(CH2)9CH3 (C3 and C
4) are only distinguishable from the baseline noise in
quantitative 13
C measurements on a 600 MHz spectrometer.
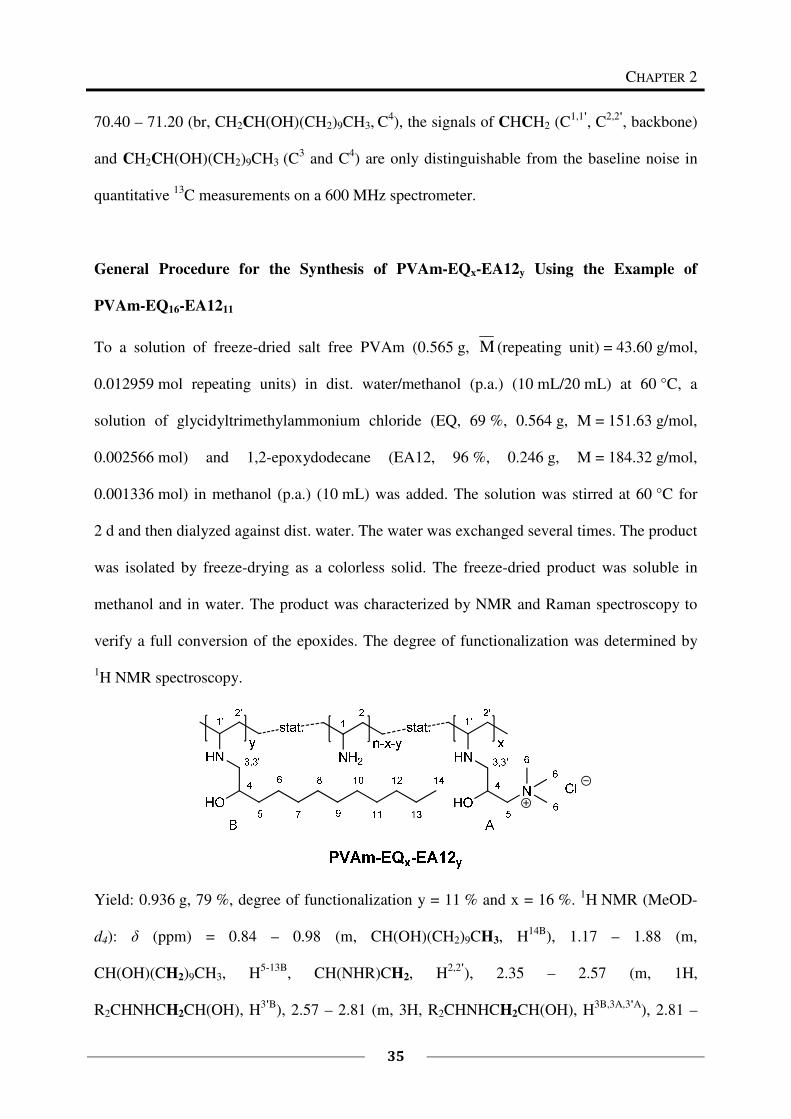
General Procedure for the Synthesis of PVAm-EQx-EA12y Using the Example of
PVAm-EQ16-EA1211
To a solution of freeze-dried salt free PVAm (0.565 g, M (repeating unit) = 43.60 g/mol,
0.012959 mol repeating units) in dist. water/methanol (p.a.) (10 mL/20 mL) at 60 °C, a
solution of glycidyltrimethylammonium chloride (EQ, 69 %, 0.564 g, M = 151.63 g/mol,
0.002566 mol) and 1,2-epoxydodecane (EA12, 96 %, 0.246 g, M = 184.32 g/mol,
0.001336 mol) in methanol (p.a.) (10 mL) was added. The solution was stirred at 60 °C for
2 d and then dialyzed against dist. water. The water was exchanged several times. The product
was isolated by freeze-drying as a colorless solid. The freeze-dried product was soluble in
methanol and in water. The product was characterized by NMR and Raman spectroscopy to
verify a full conversion of the epoxides. The degree of functionalization was determined by
1H NMR spectroscopy.
Yield: 0.936 g, 79 %, degree of functionalization y = 11 % and x = 16 %. 1H NMR (MeOD-
d4): δ (ppm) = 0.84 – 0.98 (m, CH(OH)(CH2)9CH3, H14B
), 1.17 – 1.88 (m,
CH(OH)(CH2)9CH3, H5-13B
, CH(NHR)CH2, H2,2'
), 2.35 – 2.57 (m, 1H,
R2CHNHCH2CH(OH), H3'B
), 2.57 – 2.81 (m, 3H, R2CHNHCH2CH(OH), H3B,3A,3'A
), 2.81 –
Synthesis of Amphiphilic Polymers from Poly(vinyl amine)
36
3.19 (m, CH(NHR)CH2, H1,1'
), 3.19 – 3.32 (s, br, CH2N(CH3)3, H6A
), 3.36 – 3.58 (m,
CH(OH)CH2N(CH3)3, H5A
), 3.58 – 3.73 (m, CH2CH(OH)(CH2)9, H4B
), 3.73 – 3.90 (s, br,
CHOH), 4.15 – 4.36 (m, CH2CH(OH)CH2, H4A
).
13C NMR (MeOD-d4): δ (ppm) = 14.80 (br, CH2CH(OH)(CH2)9CH3, C
14B), 23.82 (br,
CH2CH(OH)(CH2)8CH2CH3, C13B
), 27.01 (br, CH2CH(OH)CH2CH2(CH2)7CH3, C6B
), 30.22 –
31.61 (m, CH2CH(OH)(CH2)2(CH2)5(CH2)2CH3, C7-11B
), 33.21 (br, (CH2)7CH2CH2CH3,
C12B
), 36.79 (br, CH2CH(OH)CH2(CH2)8CH3, C5B
), 41.80 – 48.60 (m, CHCH2, C1,1'
, C2,2'
,
backbone), 50.30 – 51.80 (br, CH2CH(OH)CH2N(CH3)3, C3A
), 51.80 – 54.50 (br,
CH2CH(OH)(CH2)9CH3, C3B
), 55.08 (s, br, CH2CH(OH)CH2N(CH3)3, C6A
), 66.30 – 67.30
(br, CH2CH(OH)CH2N(CH3)3, C4A
), 70.40 – 71.20 (m, CH2CH(OH)CH2N(CH3)3, C5A
and
CH2CH(OH)(CH2)9CH3, C4B
), the signals of CHCH2 (C1,1'
, C2,2'
, backbone),
CH2CH(OH)CH2N(CH3)3 (C3A
) and CH2CH(OH)(CH2)9CH3 (C3B
and C4B
) are only
distinguishable from the baseline noise in quantitative 13
C measurements on a 600 MHz
spectrometer.
Reaction Kinetics
13C NMR spectroscopy was used to study the kinetics of the reaction of 1 eq PVAm (salt free)
(0.150 g, M (repeating unit) = 43.60 g/mol, 0.003441 mol repeating units) with 0.27 eq EA12
(96 %, 0.176 g, M = 184.32 g/mol, 0.000956 mol). The reaction was carried out in a mixture
of deuterated methanol and deuterium oxide following the above described general procedure
(60 °C). Samples of each 0.5 mL were taken after every hour starting at t = 0 h and ending at
t = 9 h. The samples were cooled down with crashed ice and measured immediately. To study
the kinetics at a higher temperature (80 °C), the reaction was carried out in a mixture of
deuterated ethanol and deuterium oxide. Besides this, the same procedure as described above
had been followed. Samples were taken every hour from t = 0 h until t = 8 h.
CHAPTER 2
37
1H NMR spectroscopy was used to study the kinetics of the reaction of 1 eq PVAm (salt free)
(0.435 g, M (repeating unit) = 43.60 g/mol, 0.009978 mol repeating units) with 0.27 eq EQ
(60 %, 0.672 g, M = 151.63 g/mol, 0.002661 mol). The reaction was carried out in a mixture
of deuterated methanol and deuterium oxide following the above described general procedure
(60 °C). Samples of each 0.5 mL were taken every 30 minutes starting at t = 0 min and ending
at t = 7 h.
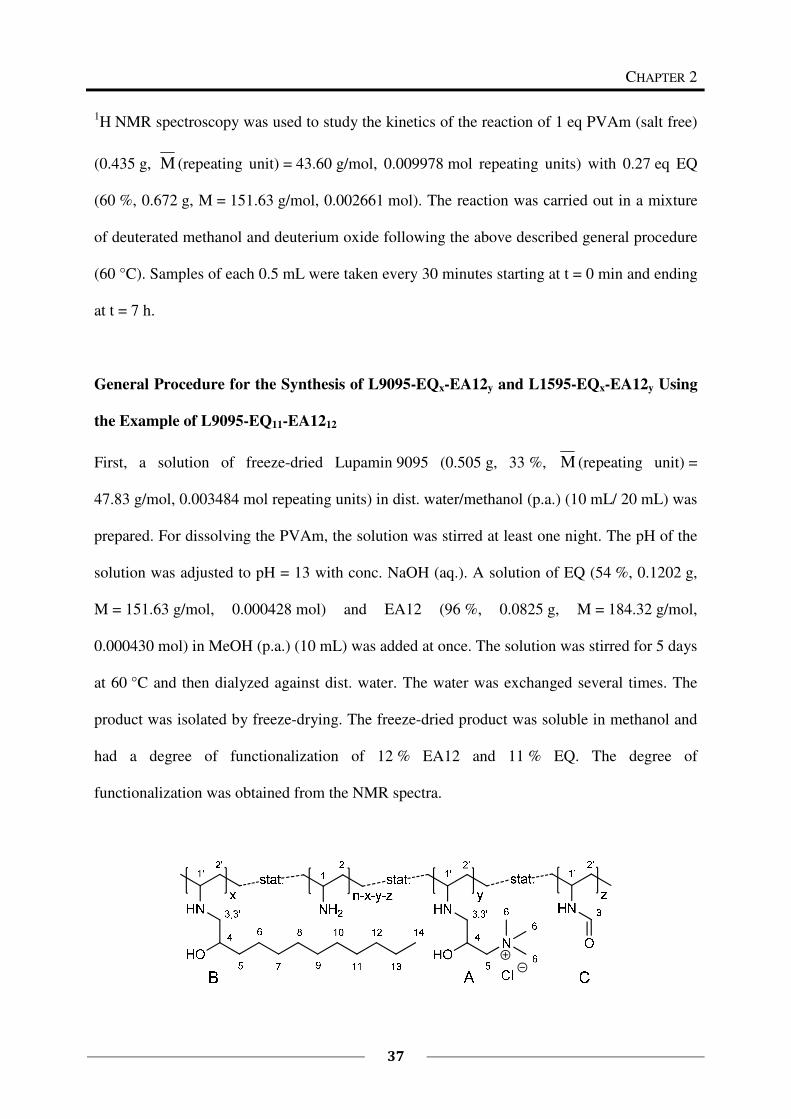
General Procedure for the Synthesis of L9095-EQx-EA12y and L1595-EQx-EA12y Using
the Example of L9095-EQ11-EA1212
First, a solution of freeze-dried Lupamin 9095 (0.505 g, 33 %, M (repeating unit) =
47.83 g/mol, 0.003484 mol repeating units) in dist. water/methanol (p.a.) (10 mL/ 20 mL) was
prepared. For dissolving the PVAm, the solution was stirred at least one night. The pH of the
solution was adjusted to pH = 13 with conc. NaOH (aq.). A solution of EQ (54 %, 0.1202 g,
M = 151.63 g/mol, 0.000428 mol) and EA12 (96 %, 0.0825 g, M = 184.32 g/mol,
0.000430 mol) in MeOH (p.a.) (10 mL) was added at once. The solution was stirred for 5 days
at 60 °C and then dialyzed against dist. water. The water was exchanged several times. The
product was isolated by freeze-drying. The freeze-dried product was soluble in methanol and
had a degree of functionalization of 12 % EA12 and 11 % EQ. The degree of
functionalization was obtained from the NMR spectra.
Synthesis of Amphiphilic Polymers from Poly(vinyl amine)
38
Yield: 0.275 g, 89 %, degree of functionalization x = 12 % and y = 11 %.
1H NMR (MeOD-d4): δ (ppm) = 0.84 – 0.98 (m, CH(OH)(CH2)9CH3, H
14B), 1.17 – 2.35 (m,
CH(OH)(CH2)9CH3, H5-13B
, CH(NHR)CH2, H2,2'
), 2.35 – 2.57 (m, 1H,
R2CHNHCH2CH(OH), H3'B
), 2.57 – 2.81 (m, 3H, R2CHNHCH2CH(OH), H3B,3A,3'A
), 2.81 –
3.19 (m, CH(NHR)CH2, H1,1'
), 3.19 – 3.32 (s, br, CH2N(CH3)3, H6A
), 3.36 – 3.58 (m,
CH(OH)CH2N(CH3)3, H5A
), 3.58 – 3.73 (m, CH2CH(OH)(CH2)9, H4B
), 3.73 – 3.90 (s, br,
CHOH), 4.15 – 4.36 (m, CH2CH(OH)CH2, H4A
), 7.10 – 7.60 (NHCHO, H3C
, formamide),
8.54 (OCHONa, sodium formate).
Fractionation of Functional Polymers
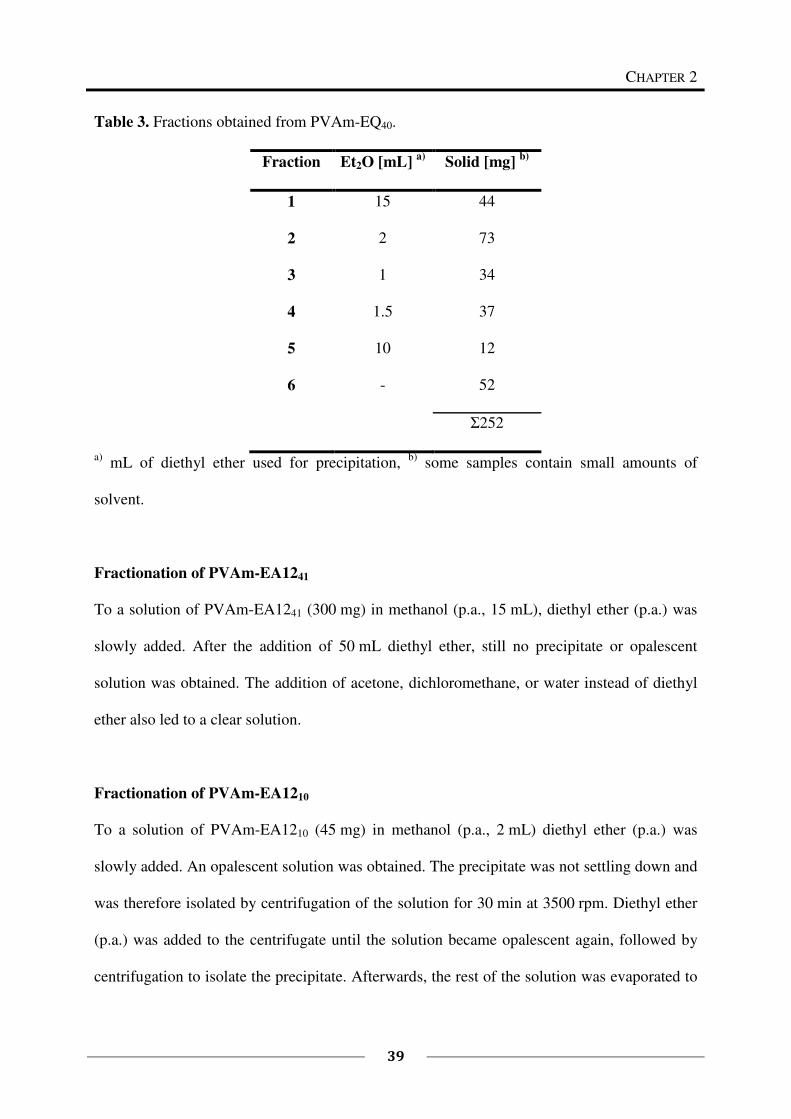
Fractionation of PVAm-EQ40
To a solution of PVAm-EQ40 (250 mg) in methanol (p.a., 15 mL), diethyl ether (p.a.) was
slowly added until an opalescent solution was obtained. The precipitate was not settling down
and was therefore isolated by centrifugation of the solution for 30 min at 3500 rpm. To the
centrifugate, diethyl ether (p.a.) was added until the solution became opalescent again and the
precipitate was isolated by centrifugation. This was repeated several times and afterwards, the
rest of the solution was evaporated to obtain the last fraction of isolated polymer. All in all six
different fractions were obtained in this way. The fractions were dried by vacuum distillation
(15 mbar) (Table 3).
CHAPTER 2
39
Table 3. Fractions obtained from PVAm-EQ40.
Fraction Et2O [mL] a)
Solid [mg] b)
1 15 44
2 2 73
3 1 34
4 1.5 37
5 10 12
6 - 52
Σ252
a) mL of diethyl ether used for precipitation,
b) some samples contain small amounts of
solvent.
Fractionation of PVAm-EA1241
To a solution of PVAm-EA1241 (300 mg) in methanol (p.a., 15 mL), diethyl ether (p.a.) was
slowly added. After the addition of 50 mL diethyl ether, still no precipitate or opalescent
solution was obtained. The addition of acetone, dichloromethane, or water instead of diethyl
ether also led to a clear solution.
Fractionation of PVAm-EA1210
To a solution of PVAm-EA1210 (45 mg) in methanol (p.a., 2 mL) diethyl ether (p.a.) was
slowly added. An opalescent solution was obtained. The precipitate was not settling down and
was therefore isolated by centrifugation of the solution for 30 min at 3500 rpm. Diethyl ether
(p.a.) was added to the centrifugate until the solution became opalescent again, followed by
centrifugation to isolate the precipitate. Afterwards, the rest of the solution was evaporated to
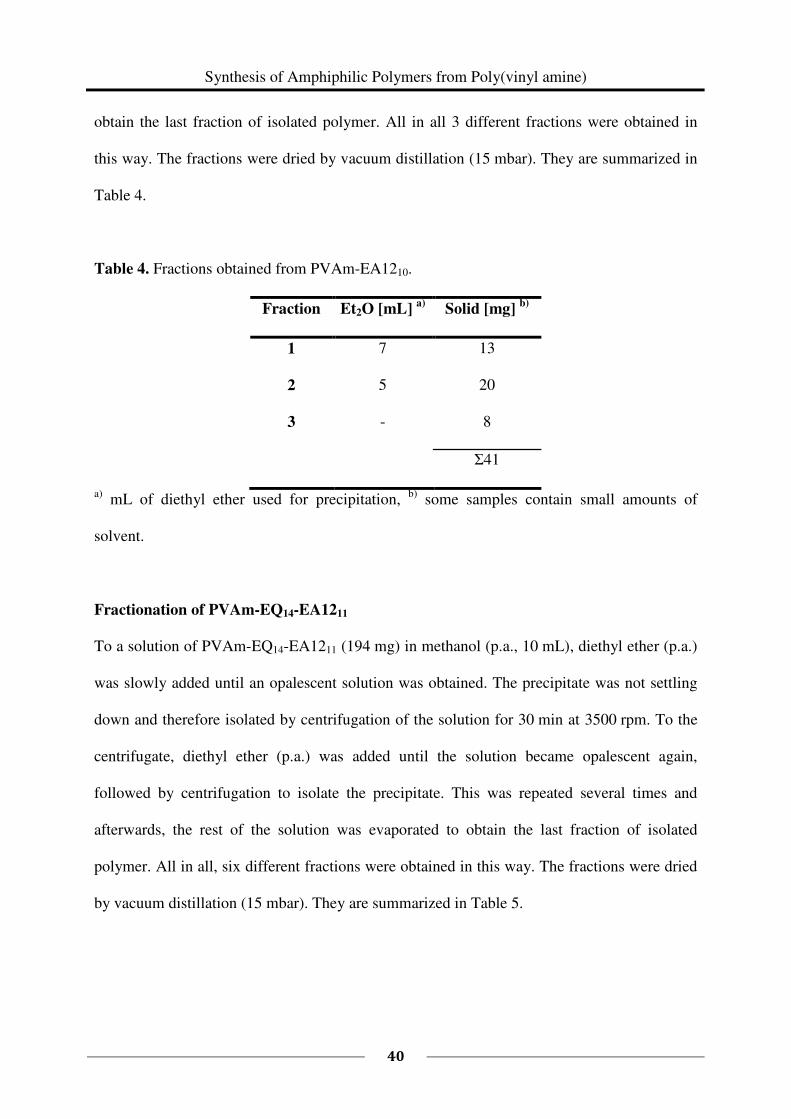
Synthesis of Amphiphilic Polymers from Poly(vinyl amine)
40
obtain the last fraction of isolated polymer. All in all 3 different fractions were obtained in
this way. The fractions were dried by vacuum distillation (15 mbar). They are summarized in
Table 4.
Table 4. Fractions obtained from PVAm-EA1210.
Fraction Et2O [mL] a)
Solid [mg] b)
1 7 13
2 5 20
3 - 8
Σ41
a) mL of diethyl ether used for precipitation,
b) some samples contain small amounts of
solvent.
Fractionation of PVAm-EQ14-EA1211
To a solution of PVAm-EQ14-EA1211 (194 mg) in methanol (p.a., 10 mL), diethyl ether (p.a.)
was slowly added until an opalescent solution was obtained. The precipitate was not settling
down and therefore isolated by centrifugation of the solution for 30 min at 3500 rpm. To the
centrifugate, diethyl ether (p.a.) was added until the solution became opalescent again,
followed by centrifugation to isolate the precipitate. This was repeated several times and
afterwards, the rest of the solution was evaporated to obtain the last fraction of isolated
polymer. All in all, six different fractions were obtained in this way. The fractions were dried
by vacuum distillation (15 mbar). They are summarized in Table 5.
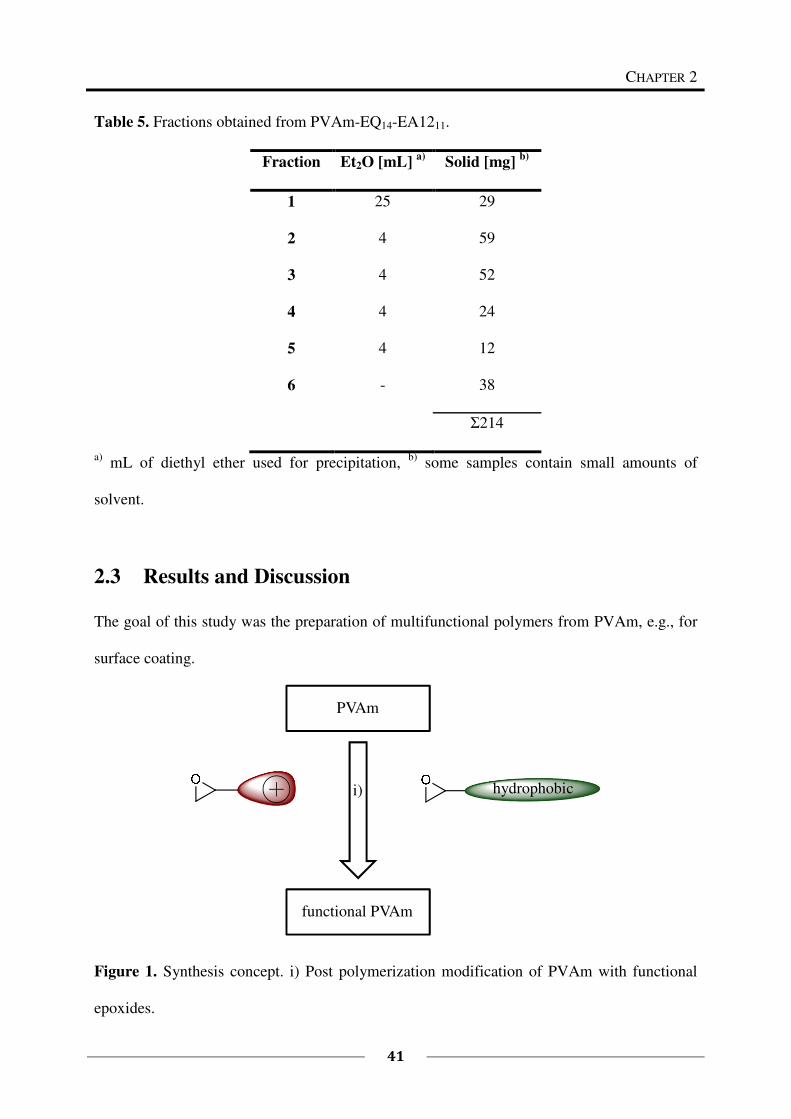
CHAPTER 2
41
Table 5. Fractions obtained from PVAm-EQ14-EA1211.
Fraction Et2O [mL] a)
Solid [mg] b)
1 25 29
2 4 59
3 4 52
4 4 24
5 4 12
6 - 38
Σ214
a) mL of diethyl ether used for precipitation,
b) some samples contain small amounts of
solvent.
2.3 Results and Discussion
The goal of this study was the preparation of multifunctional polymers from PVAm, e.g., for
surface coating.
Figure 1. Synthesis concept. i) Post polymerization modification of PVAm with functional
epoxides.
PVAm
functional PVAm
hydrophobic
i)
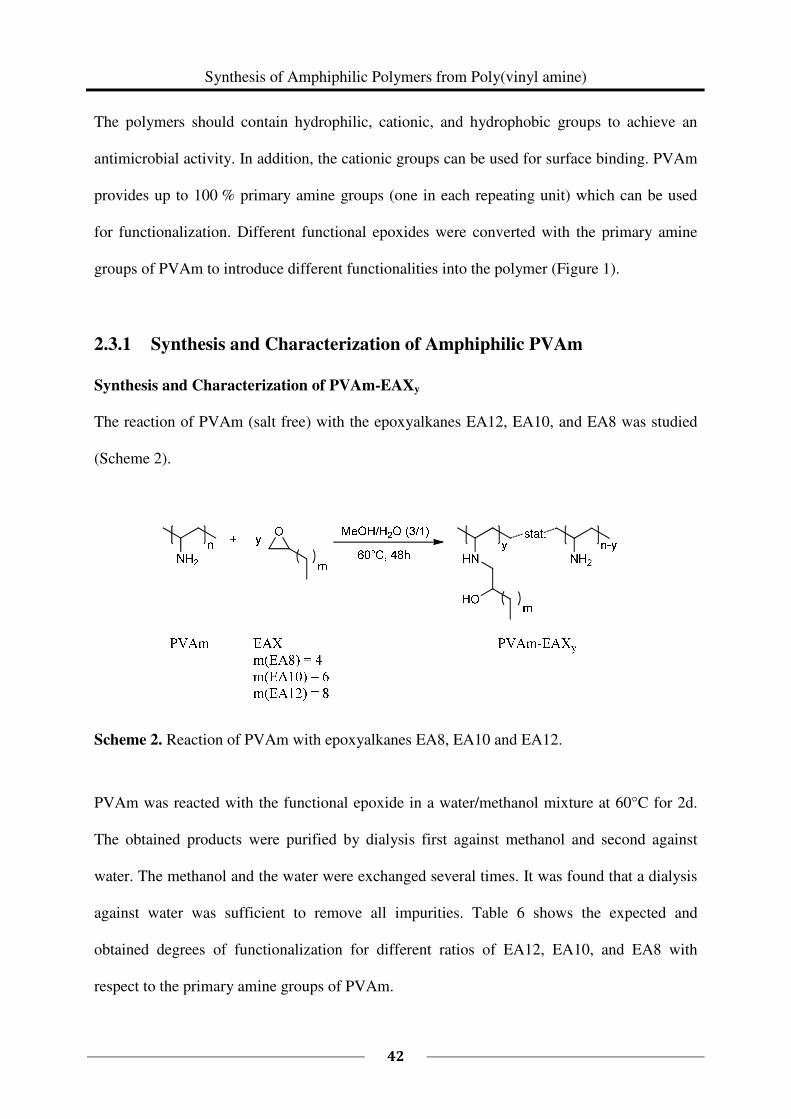
Synthesis of Amphiphilic Polymers from Poly(vinyl amine)
42
The polymers should contain hydrophilic, cationic, and hydrophobic groups to achieve an
antimicrobial activity. In addition, the cationic groups can be used for surface binding. PVAm
provides up to 100 % primary amine groups (one in each repeating unit) which can be used
for functionalization. Different functional epoxides were converted with the primary amine
groups of PVAm to introduce different functionalities into the polymer (Figure 1).
2.3.1 Synthesis and Characterization of Amphiphilic PVAm
Synthesis and Characterization of PVAm-EAXy
The reaction of PVAm (salt free) with the epoxyalkanes EA12, EA10, and EA8 was studied
(Scheme 2).
Scheme 2. Reaction of PVAm with epoxyalkanes EA8, EA10 and EA12.
PVAm was reacted with the functional epoxide in a water/methanol mixture at 60°C for 2d.
The obtained products were purified by dialysis first against methanol and second against
water. The methanol and the water were exchanged several times. It was found that a dialysis
against water was sufficient to remove all impurities. Table 6 shows the expected and
obtained degrees of functionalization for different ratios of EA12, EA10, and EA8 with
respect to the primary amine groups of PVAm.
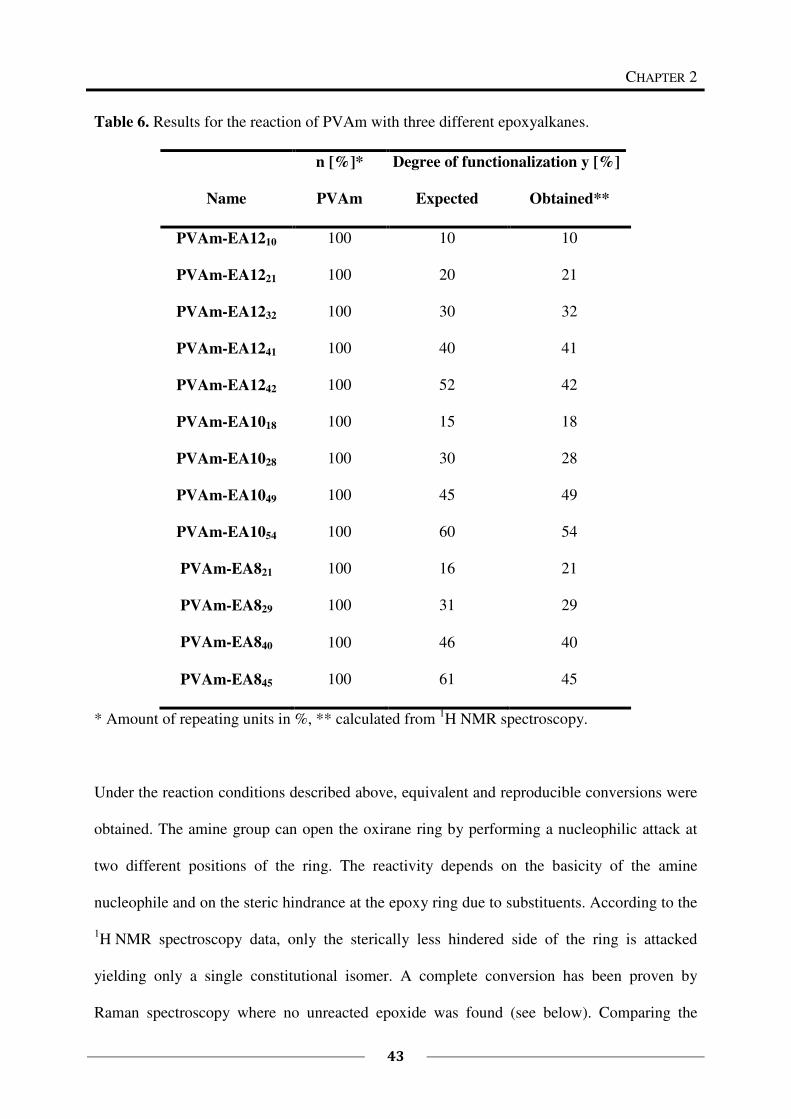
CHAPTER 2
43
Table 6. Results for the reaction of PVAm with three different epoxyalkanes.
Name
n [%]* Degree of functionalization y [%]
PVAm Expected Obtained**
PVAm-EA1210 100 10 10
PVAm-EA1221 100 20 21
PVAm-EA1232 100 30 32
PVAm-EA1241 100 40 41
PVAm-EA1242 100 52 42
PVAm-EA1018 100 15 18
PVAm-EA1028 100 30 28
PVAm-EA1049 100 45 49
PVAm-EA1054 100 60 54
PVAm-EA821 100 16 21
PVAm-EA829 100 31 29
PVAm-EA840 100 46 40
PVAm-EA845 100 61 45
* Amount of repeating units in %, ** calculated from 1H NMR spectroscopy.
Under the reaction conditions described above, equivalent and reproducible conversions were
obtained. The amine group can open the oxirane ring by performing a nucleophilic attack at
two different positions of the ring. The reactivity depends on the basicity of the amine
nucleophile and on the steric hindrance at the epoxy ring due to substituents. According to the
1H NMR spectroscopy data, only the sterically less hindered side of the ring is attacked
yielding only a single constitutional isomer. A complete conversion has been proven by
Raman spectroscopy where no unreacted epoxide was found (see below). Comparing the
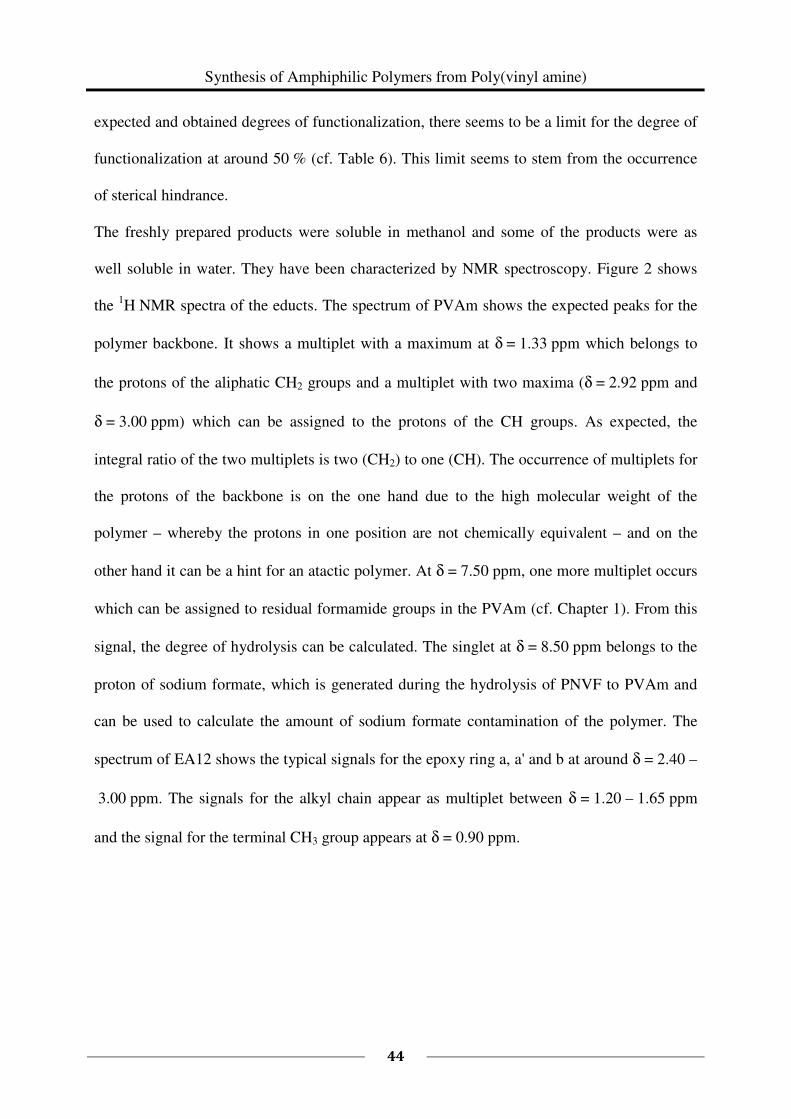
Synthesis of Amphiphilic Polymers from Poly(vinyl amine)
44
expected and obtained degrees of functionalization, there seems to be a limit for the degree of
functionalization at around 50 % (cf. Table 6). This limit seems to stem from the occurrence
of sterical hindrance.
The freshly prepared products were soluble in methanol and some of the products were as
well soluble in water. They have been characterized by NMR spectroscopy. Figure 2 shows
the 1H NMR spectra of the educts. The spectrum of PVAm shows the expected peaks for the
polymer backbone. It shows a multiplet with a maximum at δ = 1.33 ppm which belongs to
the protons of the aliphatic CH2 groups and a multiplet with two maxima (δ = 2.92 ppm and
δ = 3.00 ppm) which can be assigned to the protons of the CH groups. As expected, the
integral ratio of the two multiplets is two (CH2) to one (CH). The occurrence of multiplets for
the protons of the backbone is on the one hand due to the high molecular weight of the
polymer – whereby the protons in one position are not chemically equivalent – and on the
other hand it can be a hint for an atactic polymer. At δ = 7.50 ppm, one more multiplet occurs
which can be assigned to residual formamide groups in the PVAm (cf. Chapter 1). From this
signal, the degree of hydrolysis can be calculated. The singlet at δ = 8.50 ppm belongs to the
proton of sodium formate, which is generated during the hydrolysis of PNVF to PVAm and
can be used to calculate the amount of sodium formate contamination of the polymer. The
spectrum of EA12 shows the typical signals for the epoxy ring a, a' and b at around δ = 2.40 –
3.00 ppm. The signals for the alkyl chain appear as multiplet between δ = 1.20 – 1.65 ppm
and the signal for the terminal CH3 group appears at δ = 0.90 ppm.
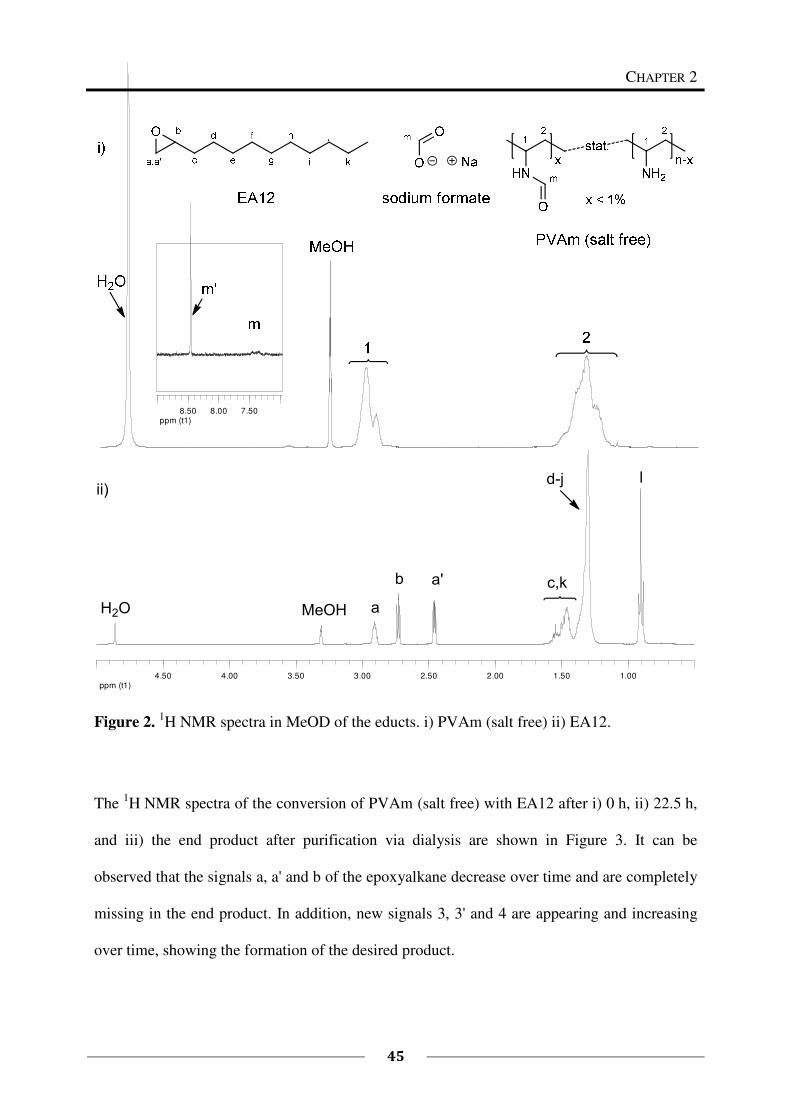
CHAPTER 2
45
ppm (t1)7.508.008.50
ppm (t1)1.001.502.002.503.003.504.004.50
��� ���� �
� �� �
� � ����
Figure 2. 1H NMR spectra in MeOD of the educts. i) PVAm (salt free) ii) EA12.
The 1H NMR spectra of the conversion of PVAm (salt free) with EA12 after i) 0 h, ii) 22.5 h,
and iii) the end product after purification via dialysis are shown in Figure 3. It can be
observed that the signals a, a' and b of the epoxyalkane decrease over time and are completely
missing in the end product. In addition, new signals 3, 3' and 4 are appearing and increasing
over time, showing the formation of the desired product.
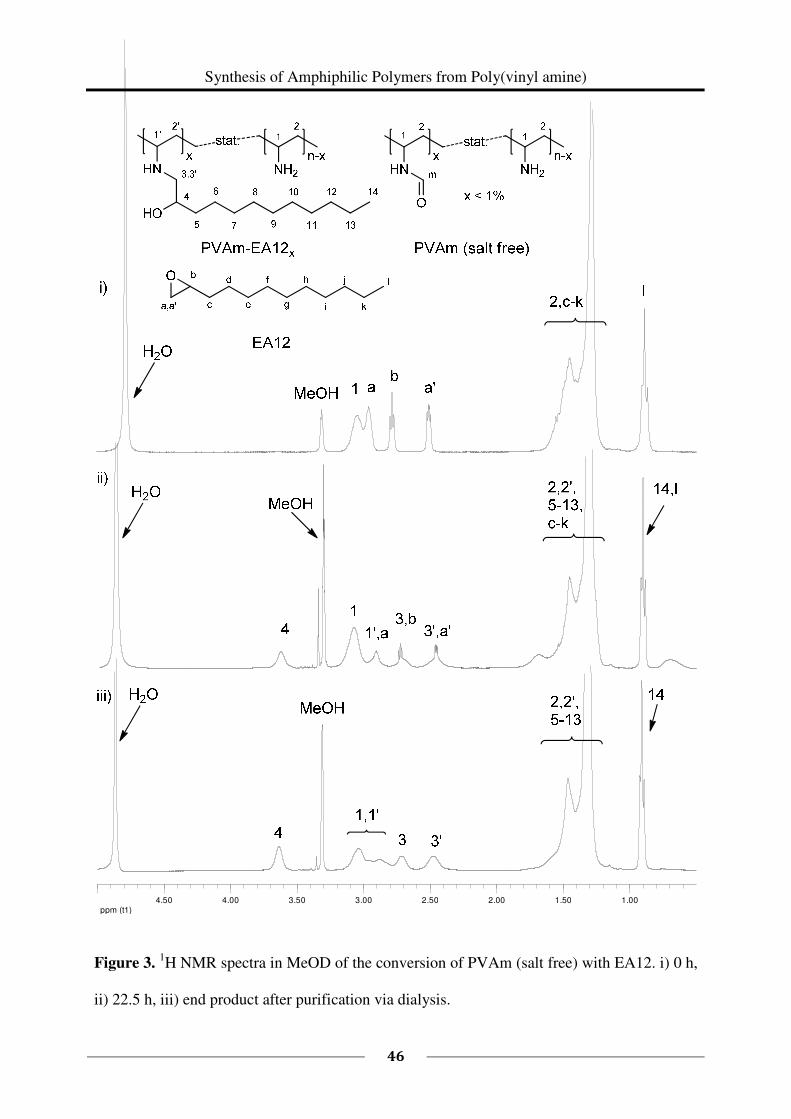
Synthesis of Amphiphilic Polymers from Poly(vinyl amine)
46
ppm (t1)1.001.502.002.503.003.504.004.50
Figure 3. 1H NMR spectra in MeOD of the conversion of PVAm (salt free) with EA12. i) 0 h,
ii) 22.5 h, iii) end product after purification via dialysis.
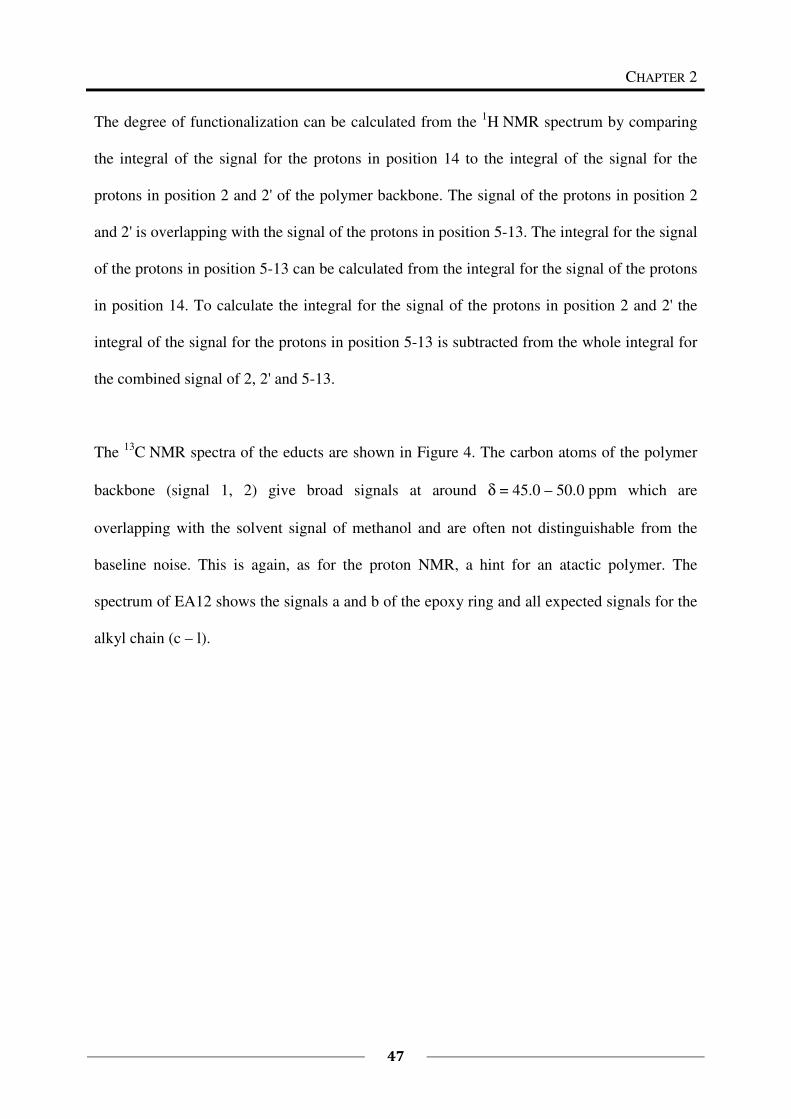
CHAPTER 2
47
The degree of functionalization can be calculated from the 1H NMR spectrum by comparing
the integral of the signal for the protons in position 14 to the integral of the signal for the
protons in position 2 and 2' of the polymer backbone. The signal of the protons in position 2
and 2' is overlapping with the signal of the protons in position 5-13. The integral for the signal
of the protons in position 5-13 can be calculated from the integral for the signal of the protons
in position 14. To calculate the integral for the signal of the protons in position 2 and 2' the
integral of the signal for the protons in position 5-13 is subtracted from the whole integral for
the combined signal of 2, 2' and 5-13.
The 13
C NMR spectra of the educts are shown in Figure 4. The carbon atoms of the polymer
backbone (signal 1, 2) give broad signals at around δ = 45.0 – 50.0 ppm which are
overlapping with the solvent signal of methanol and are often not distinguishable from the
baseline noise. This is again, as for the proton NMR, a hint for an atactic polymer. The
spectrum of EA12 shows the signals a and b of the epoxy ring and all expected signals for the
alkyl chain (c – l).
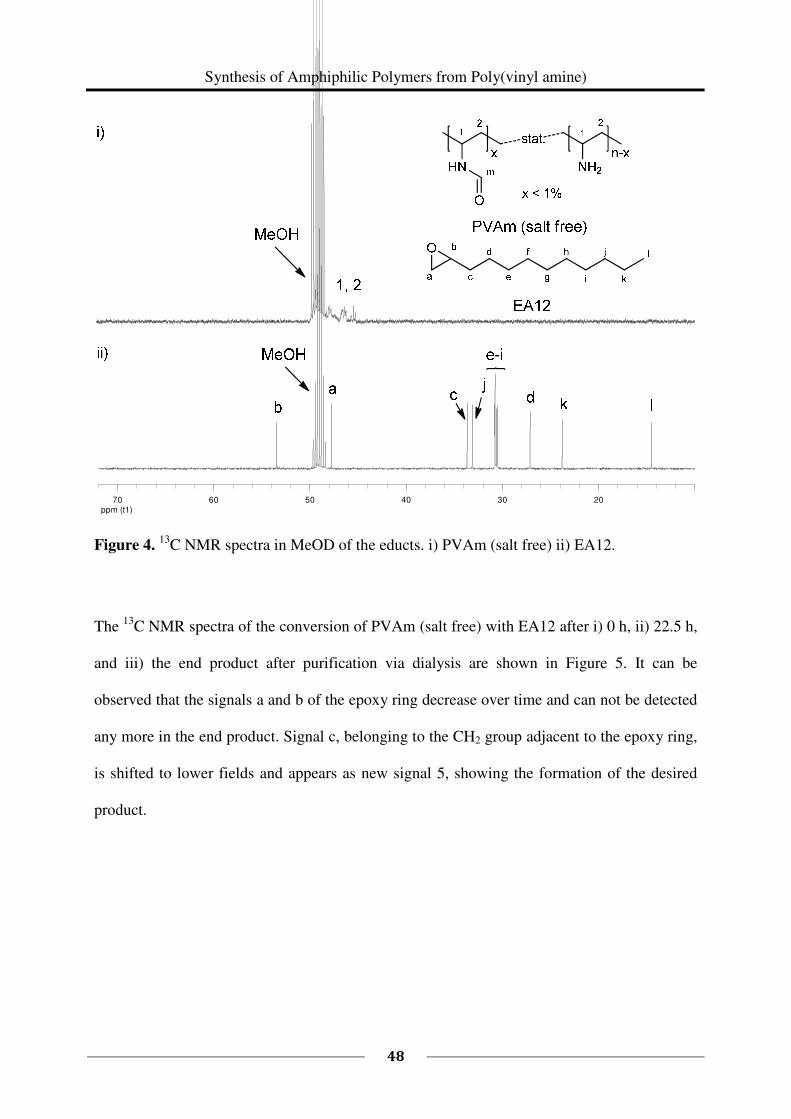
Synthesis of Amphiphilic Polymers from Poly(vinyl amine)
48
ppm (t1)203040506070
Figure 4. 13
C NMR spectra in MeOD of the educts. i) PVAm (salt free) ii) EA12.
The 13
C NMR spectra of the conversion of PVAm (salt free) with EA12 after i) 0 h, ii) 22.5 h,
and iii) the end product after purification via dialysis are shown in Figure 5. It can be
observed that the signals a and b of the epoxy ring decrease over time and can not be detected
any more in the end product. Signal c, belonging to the CH2 group adjacent to the epoxy ring,
is shifted to lower fields and appears as new signal 5, showing the formation of the desired
product.
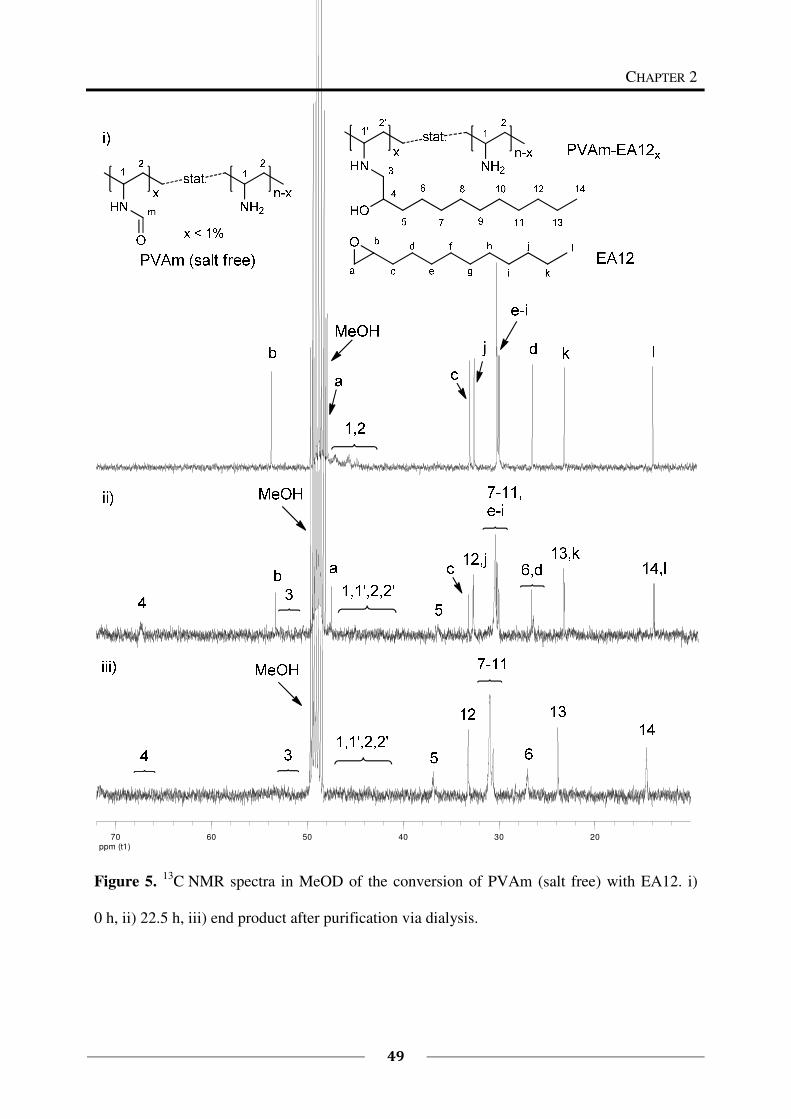
CHAPTER 2
49
ppm (t1)203040506070
Figure 5. 13
C NMR spectra in MeOD of the conversion of PVAm (salt free) with EA12. i)
0 h, ii) 22.5 h, iii) end product after purification via dialysis.
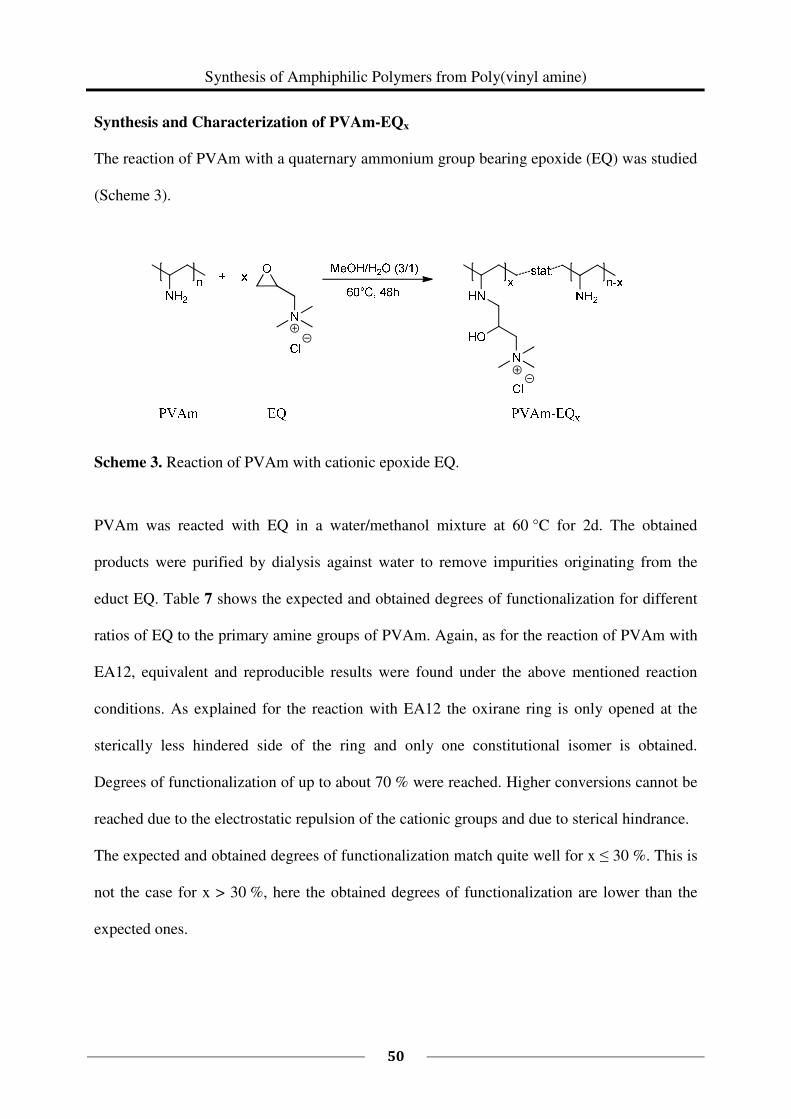
Synthesis of Amphiphilic Polymers from Poly(vinyl amine)
50
Synthesis and Characterization of PVAm-EQx
The reaction of PVAm with a quaternary ammonium group bearing epoxide (EQ) was studied
(Scheme 3).
Scheme 3. Reaction of PVAm with cationic epoxide EQ.
PVAm was reacted with EQ in a water/methanol mixture at 60 °C for 2d. The obtained
products were purified by dialysis against water to remove impurities originating from the
educt EQ. Table 7 shows the expected and obtained degrees of functionalization for different
ratios of EQ to the primary amine groups of PVAm. Again, as for the reaction of PVAm with
EA12, equivalent and reproducible results were found under the above mentioned reaction
conditions. As explained for the reaction with EA12 the oxirane ring is only opened at the
sterically less hindered side of the ring and only one constitutional isomer is obtained.
Degrees of functionalization of up to about 70 % were reached. Higher conversions cannot be
reached due to the electrostatic repulsion of the cationic groups and due to sterical hindrance.
The expected and obtained degrees of functionalization match quite well for x ≤ 30 %. This is
not the case for x > 30 %, here the obtained degrees of functionalization are lower than the
expected ones.
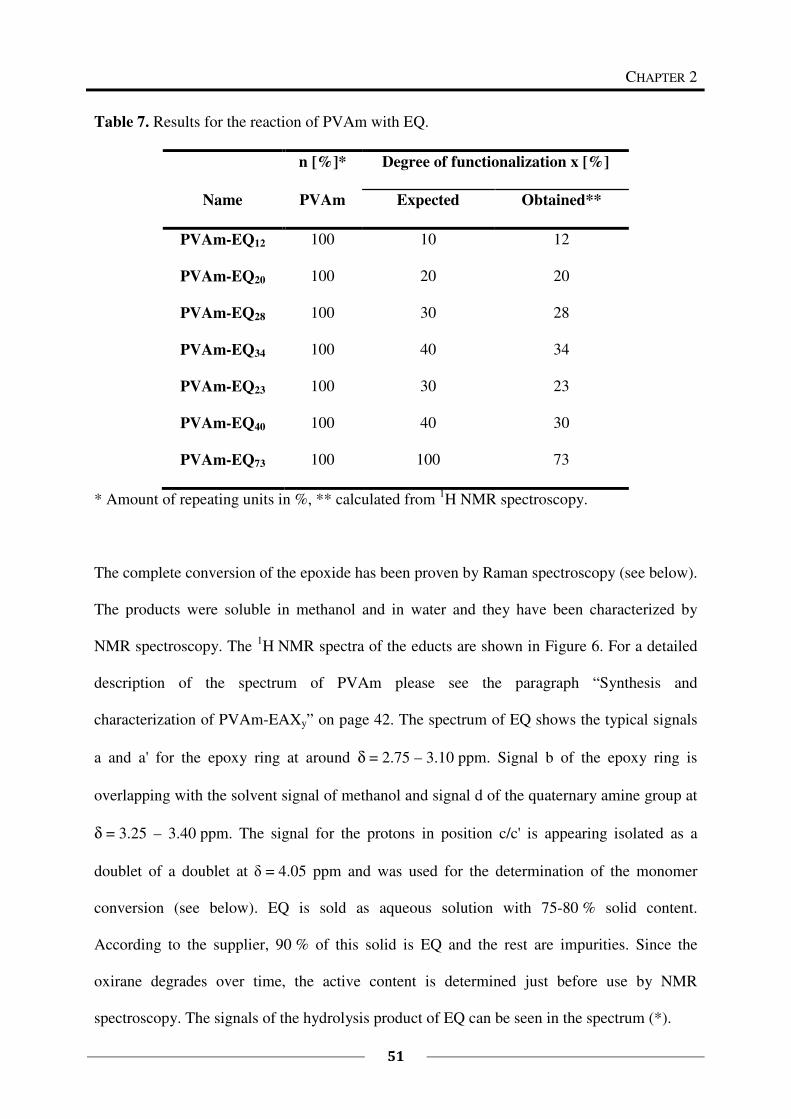
CHAPTER 2
51
Table 7. Results for the reaction of PVAm with EQ.
Name
n [%]* Degree of functionalization x [%]
PVAm Expected Obtained**
PVAm-EQ12 100 10 12
PVAm-EQ20 100 20 20
PVAm-EQ28 100 30 28
PVAm-EQ34 100 40 34
PVAm-EQ23 100 30 23
PVAm-EQ40 100 40 30
PVAm-EQ73 100 100 73
* Amount of repeating units in %, ** calculated from 1H NMR spectroscopy.
The complete conversion of the epoxide has been proven by Raman spectroscopy (see below).
The products were soluble in methanol and in water and they have been characterized by
NMR spectroscopy. The 1H NMR spectra of the educts are shown in Figure 6. For a detailed
description of the spectrum of PVAm please see the paragraph “Synthesis and
characterization of PVAm-EAXy” on page 42. The spectrum of EQ shows the typical signals
a and a' for the epoxy ring at around δ = 2.75 – 3.10 ppm. Signal b of the epoxy ring is
overlapping with the solvent signal of methanol and signal d of the quaternary amine group at
δ = 3.25 – 3.40 ppm. The signal for the protons in position c/c' is appearing isolated as a
doublet of a doublet at δ = 4.05 ppm and was used for the determination of the monomer
conversion (see below). EQ is sold as aqueous solution with 75-80 % solid content.
According to the supplier, 90 % of this solid is EQ and the rest are impurities. Since the
oxirane degrades over time, the active content is determined just before use by NMR
spectroscopy. The signals of the hydrolysis product of EQ can be seen in the spectrum (*).
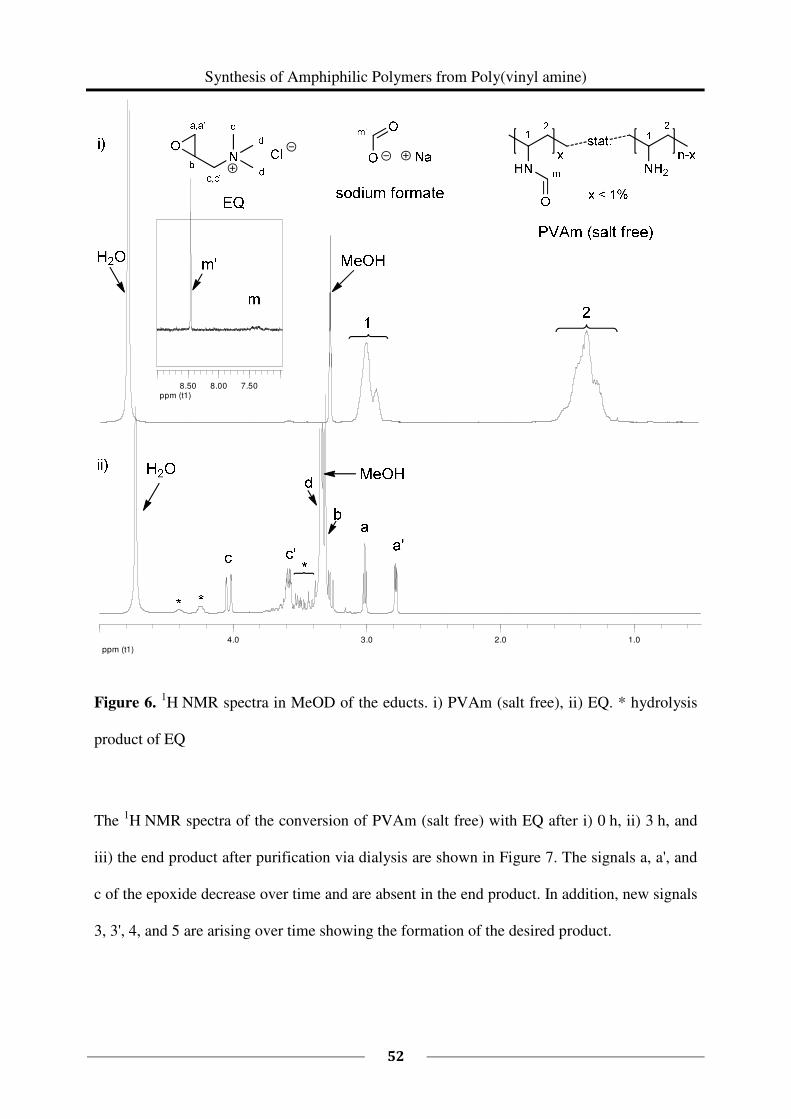
Synthesis of Amphiphilic Polymers from Poly(vinyl amine)
52
ppm (t1)7.508.008.50
ppm (t1)1.02.03.04.0
Figure 6. 1H NMR spectra in MeOD of the educts. i) PVAm (salt free), ii) EQ. * hydrolysis
product of EQ
The 1H NMR spectra of the conversion of PVAm (salt free) with EQ after i) 0 h, ii) 3 h, and
iii) the end product after purification via dialysis are shown in Figure 7. The signals a, a', and
c of the epoxide decrease over time and are absent in the end product. In addition, new signals
3, 3', 4, and 5 are arising over time showing the formation of the desired product.
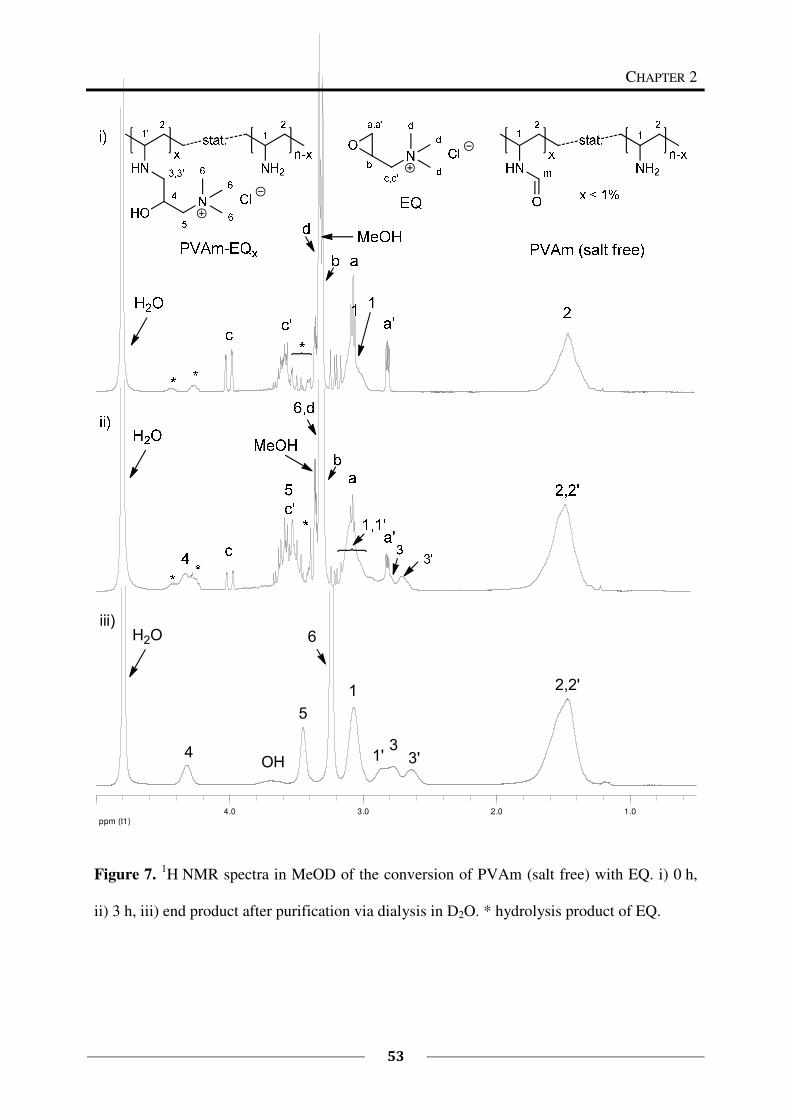
CHAPTER 2
53
ppm (t1)1.02.03.04.0
���
��� �
�
�
�
�����
����
��
Figure 7. 1H NMR spectra in MeOD of the conversion of PVAm (salt free) with EQ. i) 0 h,
ii) 3 h, iii) end product after purification via dialysis in D2O. * hydrolysis product of EQ.
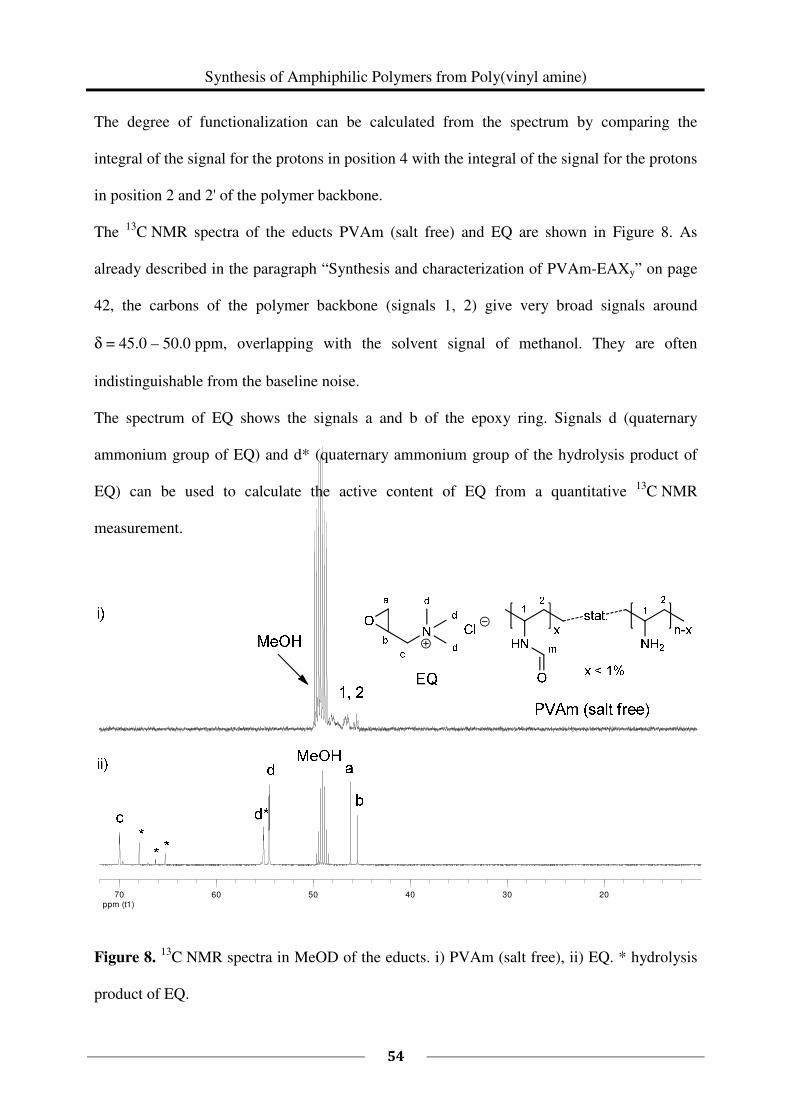
Synthesis of Amphiphilic Polymers from Poly(vinyl amine)
54
The degree of functionalization can be calculated from the spectrum by comparing the
integral of the signal for the protons in position 4 with the integral of the signal for the protons
in position 2 and 2' of the polymer backbone.
The 13
C NMR spectra of the educts PVAm (salt free) and EQ are shown in Figure 8. As
already described in the paragraph “Synthesis and characterization of PVAm-EAXy” on page
42, the carbons of the polymer backbone (signals 1, 2) give very broad signals around
δ = 45.0 – 50.0 ppm, overlapping with the solvent signal of methanol. They are often
indistinguishable from the baseline noise.
The spectrum of EQ shows the signals a and b of the epoxy ring. Signals d (quaternary
ammonium group of EQ) and d* (quaternary ammonium group of the hydrolysis product of
EQ) can be used to calculate the active content of EQ from a quantitative 13
C NMR
measurement.
ppm (t1)203040506070
Figure 8. 13
C NMR spectra in MeOD of the educts. i) PVAm (salt free), ii) EQ. * hydrolysis
product of EQ.
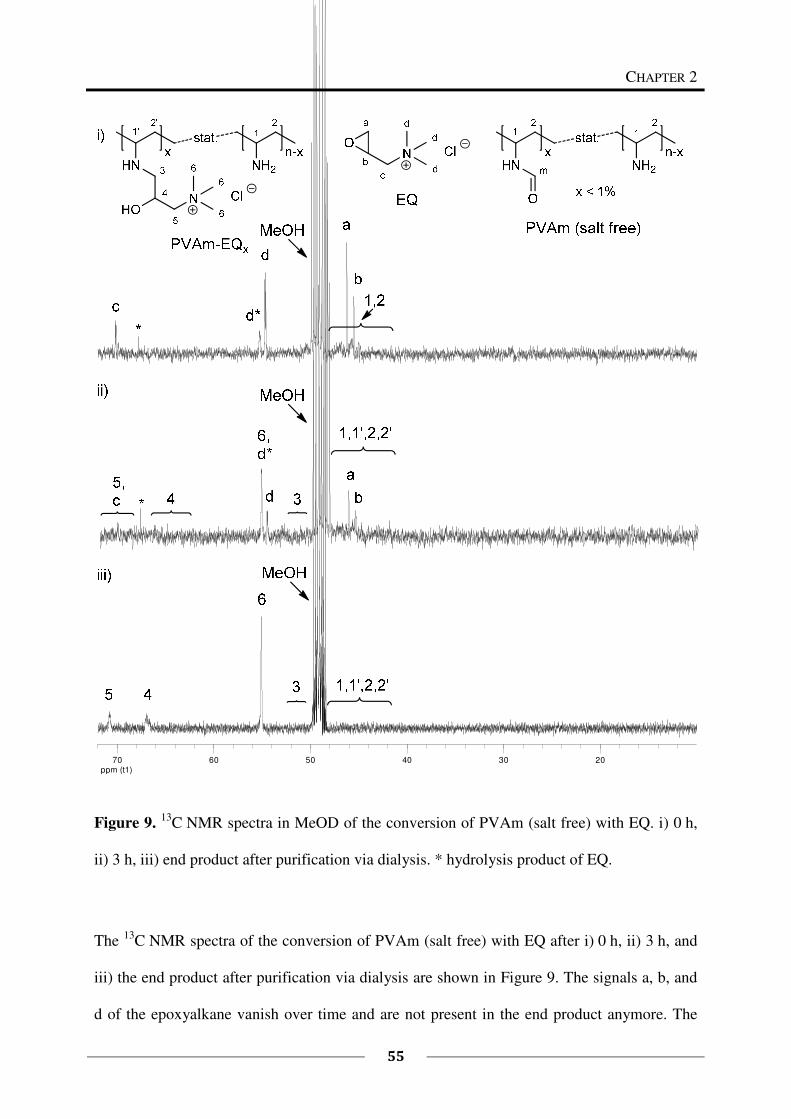
CHAPTER 2
55
ppm (t1)203040506070
Figure 9. 13
C NMR spectra in MeOD of the conversion of PVAm (salt free) with EQ. i) 0 h,
ii) 3 h, iii) end product after purification via dialysis. * hydrolysis product of EQ.
The 13
C NMR spectra of the conversion of PVAm (salt free) with EQ after i) 0 h, ii) 3 h, and
iii) the end product after purification via dialysis are shown in Figure 9. The signals a, b, and
d of the epoxyalkane vanish over time and are not present in the end product anymore. The
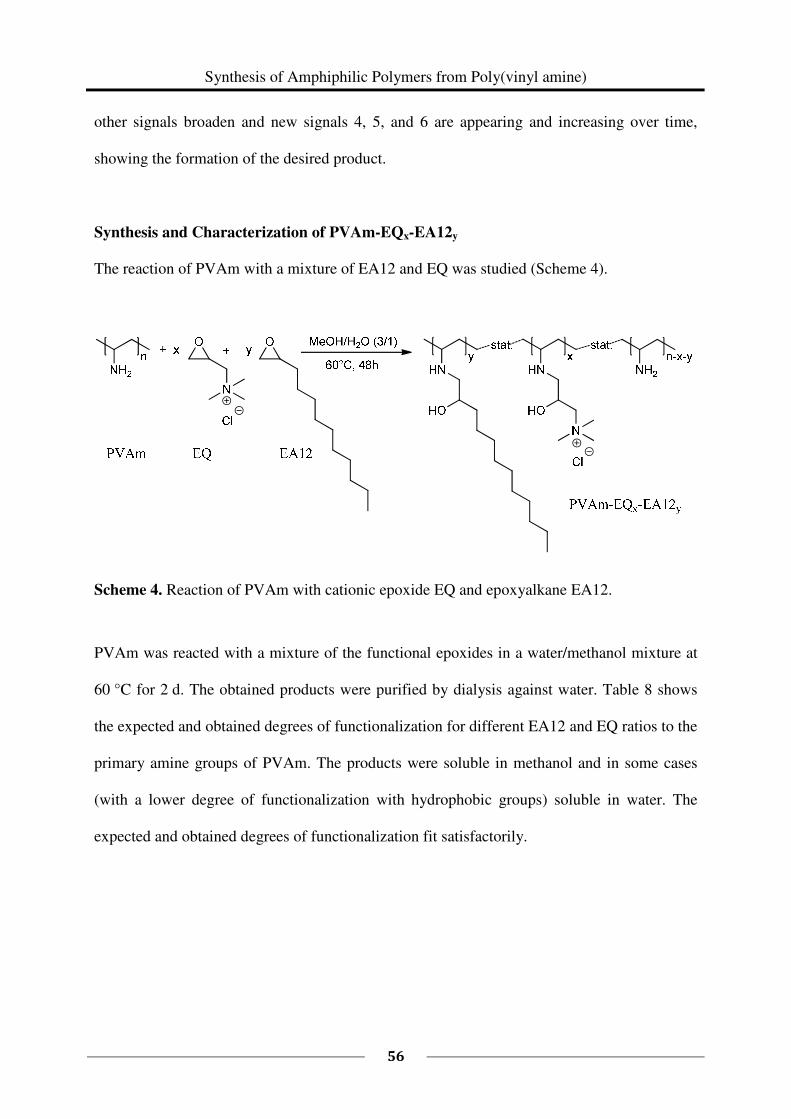
Synthesis of Amphiphilic Polymers from Poly(vinyl amine)
56
other signals broaden and new signals 4, 5, and 6 are appearing and increasing over time,
showing the formation of the desired product.
Synthesis and Characterization of PVAm-EQx-EA12y
The reaction of PVAm with a mixture of EA12 and EQ was studied (Scheme 4).
Scheme 4. Reaction of PVAm with cationic epoxide EQ and epoxyalkane EA12.
PVAm was reacted with a mixture of the functional epoxides in a water/methanol mixture at
60 °C for 2 d. The obtained products were purified by dialysis against water. Table 8 shows
the expected and obtained degrees of functionalization for different EA12 and EQ ratios to the
primary amine groups of PVAm. The products were soluble in methanol and in some cases
(with a lower degree of functionalization with hydrophobic groups) soluble in water. The
expected and obtained degrees of functionalization fit satisfactorily.
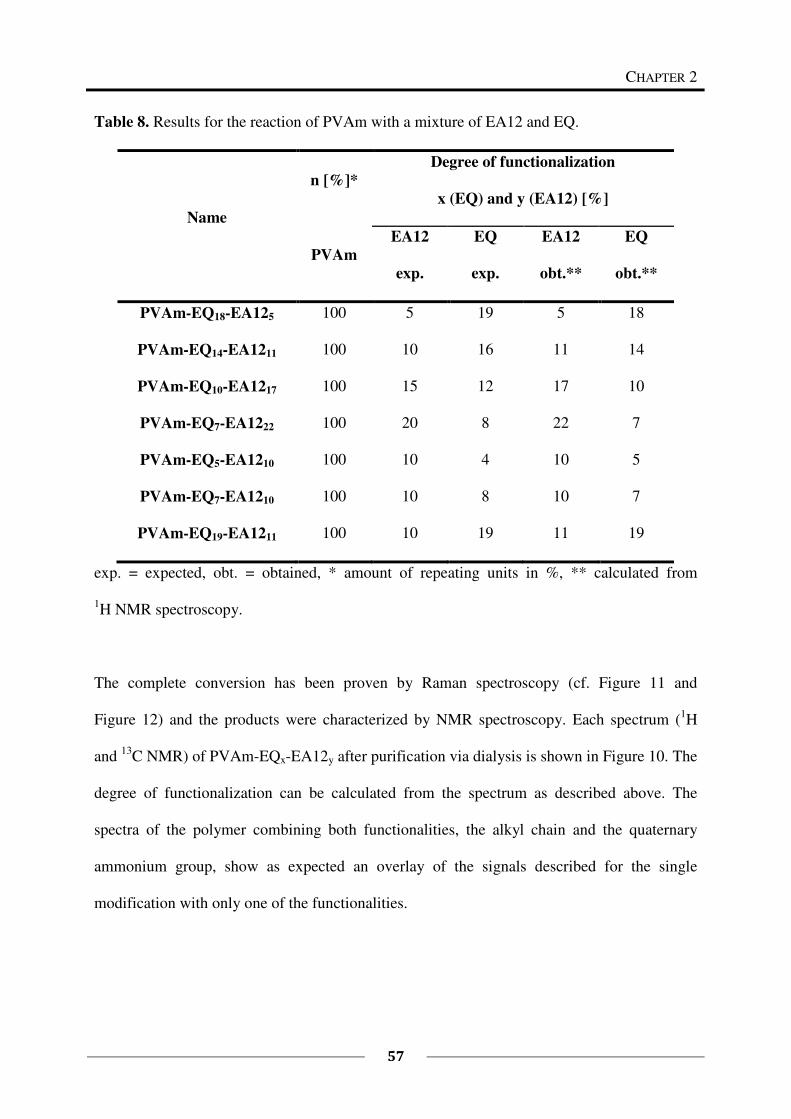
CHAPTER 2
57
Table 8. Results for the reaction of PVAm with a mixture of EA12 and EQ.
Name
n [%]*
Degree of functionalization
x (EQ) and y (EA12) [%]
PVAm
EA12
exp.
EQ
exp.
EA12
obt.**
EQ
obt.**
PVAm-EQ18-EA125 100 5 19 5 18
PVAm-EQ14-EA1211 100 10 16 11 14
PVAm-EQ10-EA1217 100 15 12 17 10
PVAm-EQ7-EA1222 100 20 8 22 7
PVAm-EQ5-EA1210 100 10 4 10 5
PVAm-EQ7-EA1210 100 10 8 10 7
PVAm-EQ19-EA1211 100 10 19 11 19
exp. = expected, obt. = obtained, * amount of repeating units in %, ** calculated from
1H NMR spectroscopy.
The complete conversion has been proven by Raman spectroscopy (cf. Figure 11 and
Figure 12) and the products were characterized by NMR spectroscopy. Each spectrum (1H
and 13
C NMR) of PVAm-EQx-EA12y after purification via dialysis is shown in Figure 10. The
degree of functionalization can be calculated from the spectrum as described above. The
spectra of the polymer combining both functionalities, the alkyl chain and the quaternary
ammonium group, show as expected an overlay of the signals described for the single
modification with only one of the functionalities.
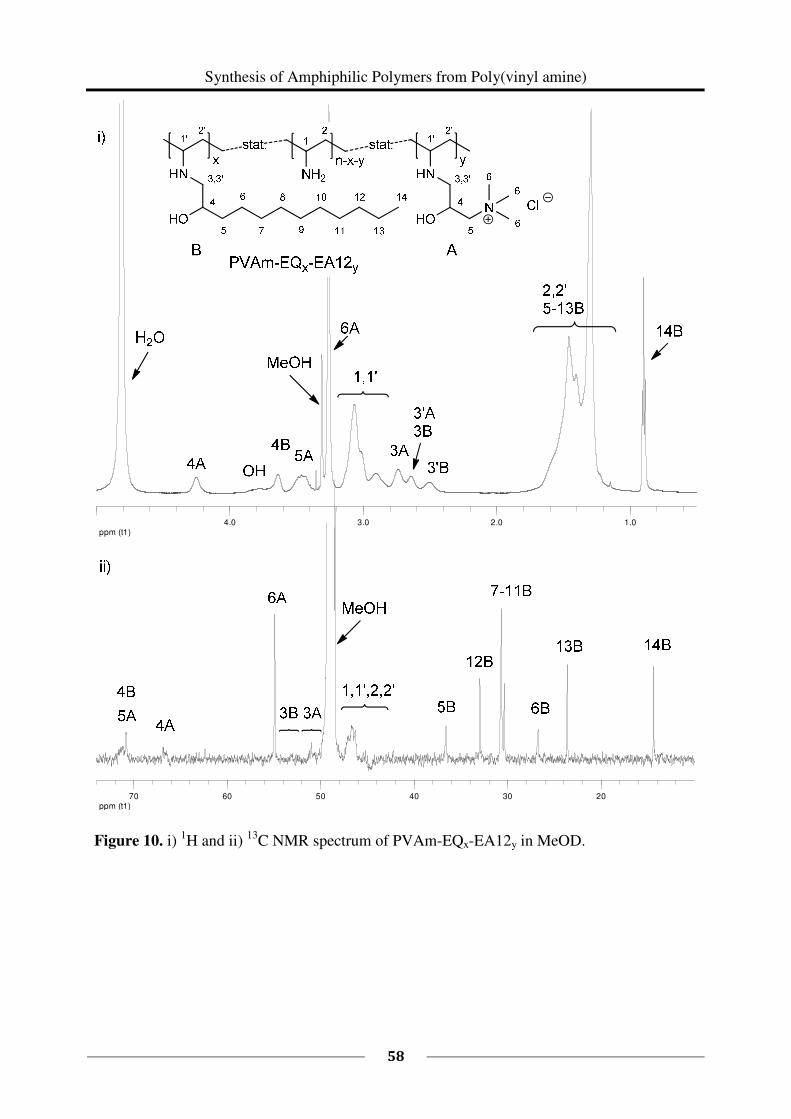
Synthesis of Amphiphilic Polymers from Poly(vinyl amine)
58
ppm (t1)1.02.03.04.0
ppm (t1)203040506070
Figure 10. i) 1H and ii)
13C NMR spectrum of PVAm-EQx-EA12y in MeOD.
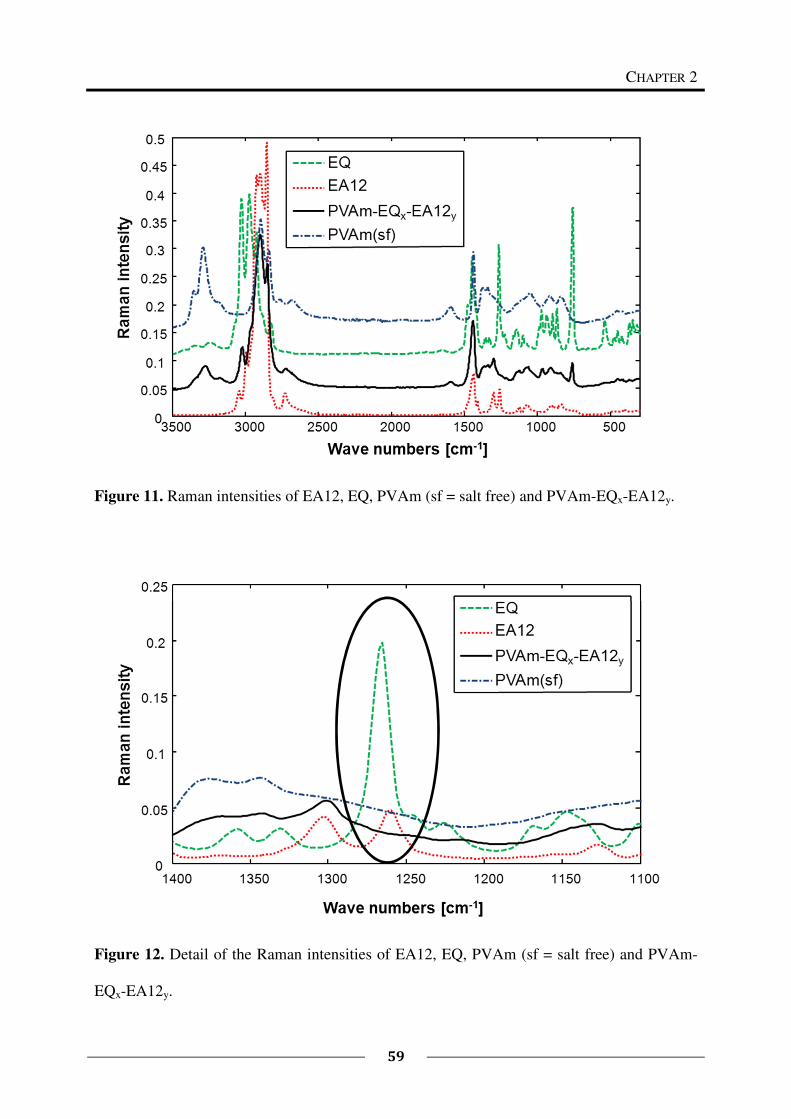
CHAPTER 2
59
Figure 11. Raman intensities of EA12, EQ, PVAm (sf = salt free) and PVAm-EQx-EA12y.
Figure 12. Detail of the Raman intensities of EA12, EQ, PVAm (sf = salt free) and PVAm-
EQx-EA12y.
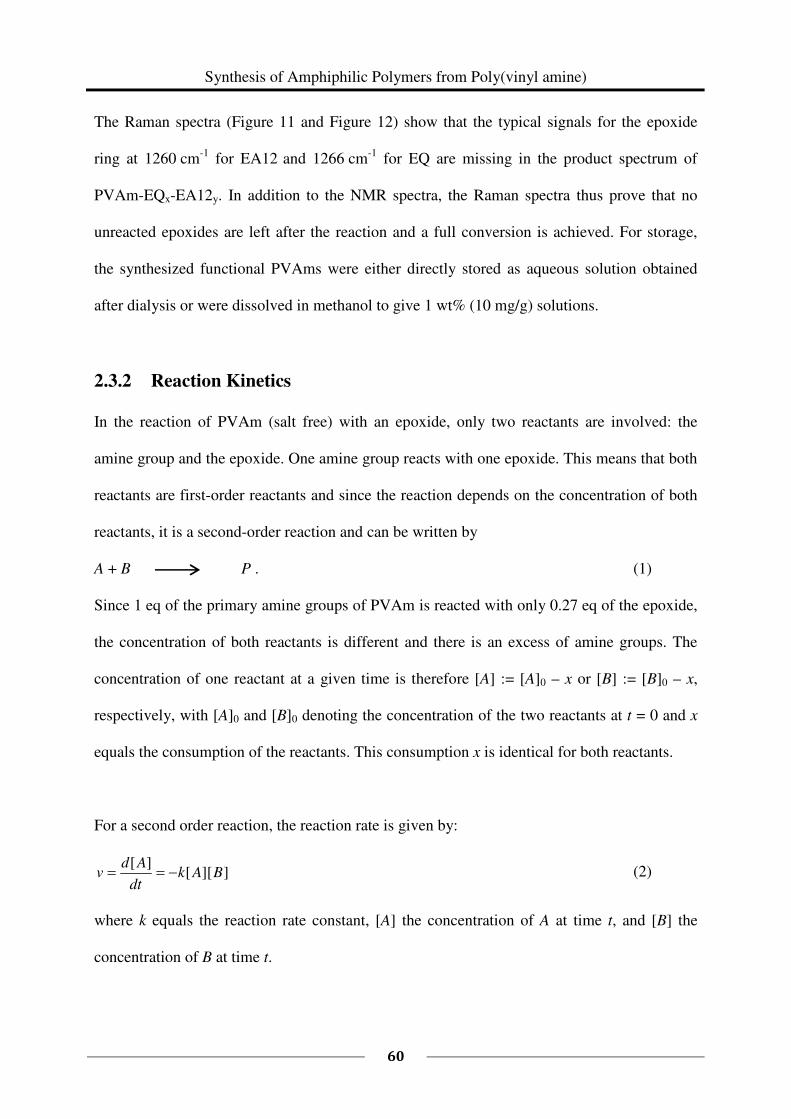
Synthesis of Amphiphilic Polymers from Poly(vinyl amine)
60
The Raman spectra (Figure 11 and Figure 12) show that the typical signals for the epoxide
ring at 1260 cm-1
for EA12 and 1266 cm-1
for EQ are missing in the product spectrum of
PVAm-EQx-EA12y. In addition to the NMR spectra, the Raman spectra thus prove that no
unreacted epoxides are left after the reaction and a full conversion is achieved. For storage,
the synthesized functional PVAms were either directly stored as aqueous solution obtained
after dialysis or were dissolved in methanol to give 1 wt% (10 mg/g) solutions.
2.3.2 Reaction Kinetics
In the reaction of PVAm (salt free) with an epoxide, only two reactants are involved: the
amine group and the epoxide. One amine group reacts with one epoxide. This means that both
reactants are first-order reactants and since the reaction depends on the concentration of both
reactants, it is a second-order reaction and can be written by
A + B P . (1)
Since 1 eq of the primary amine groups of PVAm is reacted with only 0.27 eq of the epoxide,
the concentration of both reactants is different and there is an excess of amine groups. The
concentration of one reactant at a given time is therefore [A] := [A]0 – x or [B] := [B]0 – x,
respectively, with [A]0 and [B]0 denoting the concentration of the two reactants at t = 0 and x
equals the consumption of the reactants. This consumption x is identical for both reactants.
For a second order reaction, the reaction rate is given by:
]][[][
BAkdt
Adv −==
(2)
where k equals the reaction rate constant, [A] the concentration of A at time t, and [B] the
concentration of B at time t.
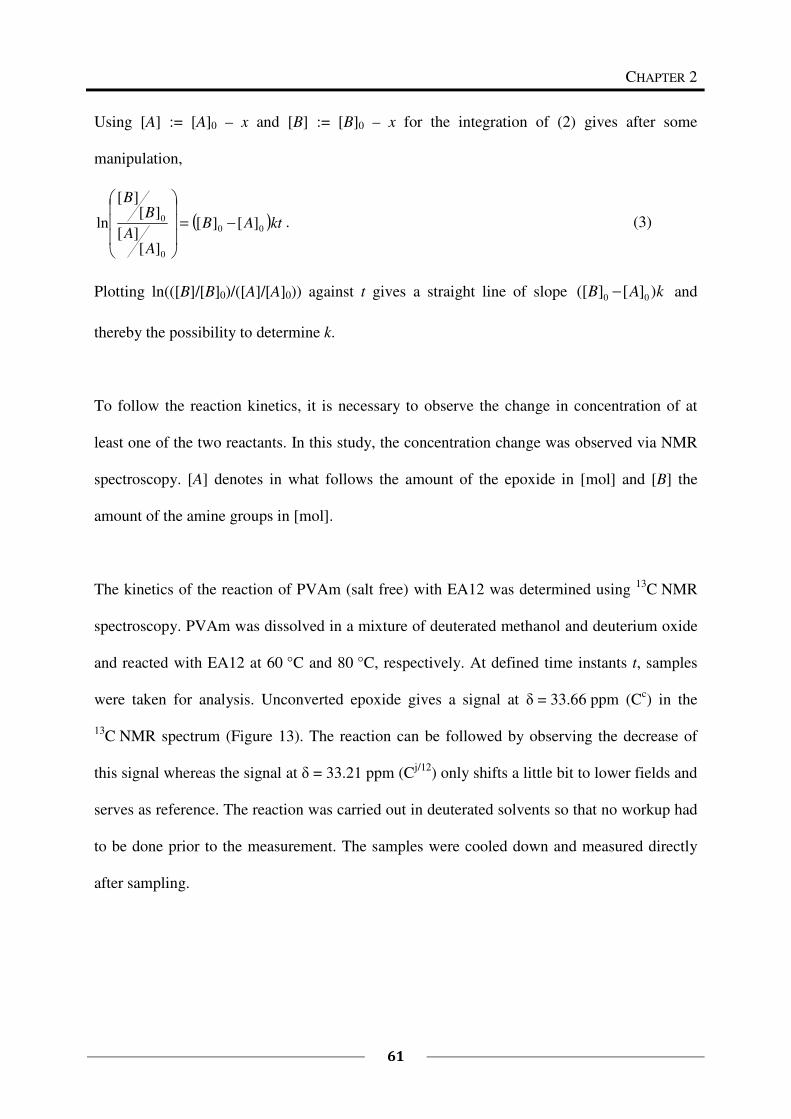
CHAPTER 2
61
Using [A] := [A]0 – x and [B] := [B]0 – x for the integration of (2) gives after some
manipulation,
( )ktAB
AA
BB
00
0
0 ][][
][][
][][
ln −=
. (3)
Plotting ln(([B]/[B]0)/([A]/[A]0)) against t gives a straight line of slope kAB )][]([ 00 − and
thereby the possibility to determine k.
To follow the reaction kinetics, it is necessary to observe the change in concentration of at
least one of the two reactants. In this study, the concentration change was observed via NMR
spectroscopy. [A] denotes in what follows the amount of the epoxide in [mol] and [B] the
amount of the amine groups in [mol].
The kinetics of the reaction of PVAm (salt free) with EA12 was determined using 13
C NMR
spectroscopy. PVAm was dissolved in a mixture of deuterated methanol and deuterium oxide
and reacted with EA12 at 60 °C and 80 °C, respectively. At defined time instants t, samples
were taken for analysis. Unconverted epoxide gives a signal at δ = 33.66 ppm (Cc) in the
13C NMR spectrum (Figure 13). The reaction can be followed by observing the decrease of
this signal whereas the signal at δ = 33.21 ppm (Cj/12
) only shifts a little bit to lower fields and
serves as reference. The reaction was carried out in deuterated solvents so that no workup had
to be done prior to the measurement. The samples were cooled down and measured directly
after sampling.
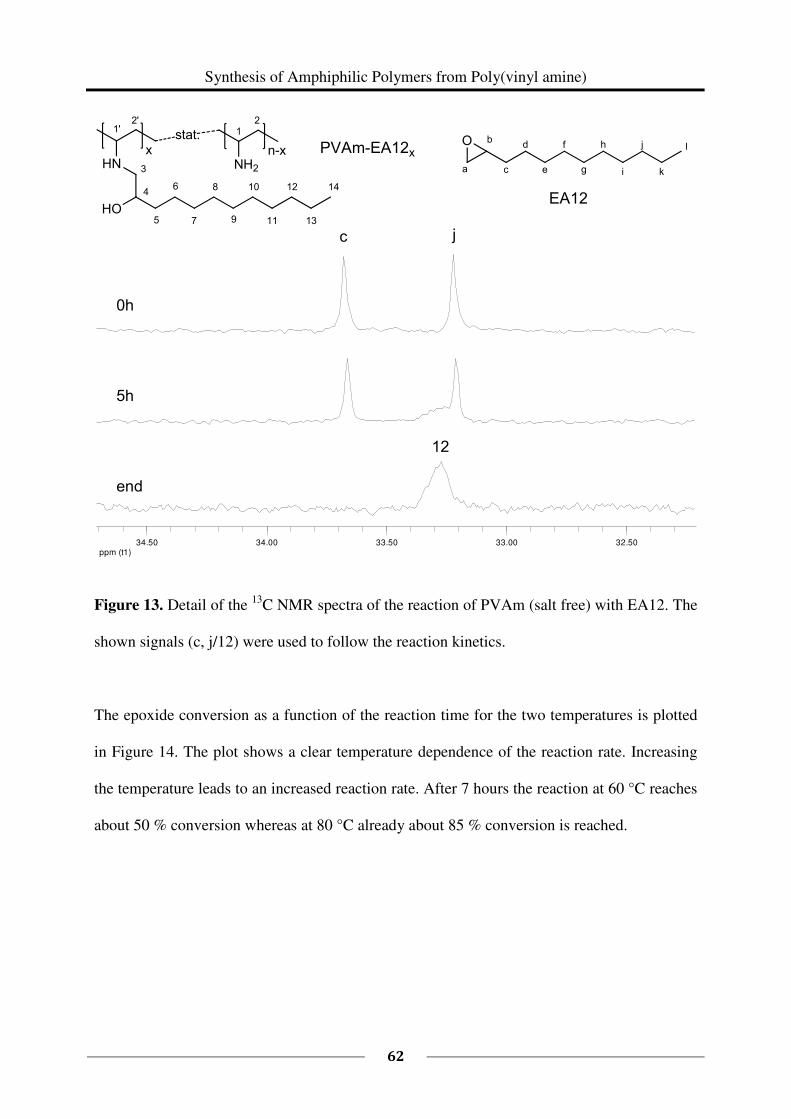
Synthesis of Amphiphilic Polymers from Poly(vinyl amine)
62
ppm (t1)32.5033.0033.5034.0034.50
��
��
���
�
�
�
�
�
�
�
�
�
�
�
�
����
���
� �
��
��
��
�
�
�
�
����
���� !
������"�
#$�$%&'�( �����
�
��
Figure 13. Detail of the 13
C NMR spectra of the reaction of PVAm (salt free) with EA12. The
shown signals (c, j/12) were used to follow the reaction kinetics.
The epoxide conversion as a function of the reaction time for the two temperatures is plotted
in Figure 14. The plot shows a clear temperature dependence of the reaction rate. Increasing
the temperature leads to an increased reaction rate. After 7 hours the reaction at 60 °C reaches
about 50 % conversion whereas at 80 °C already about 85 % conversion is reached.
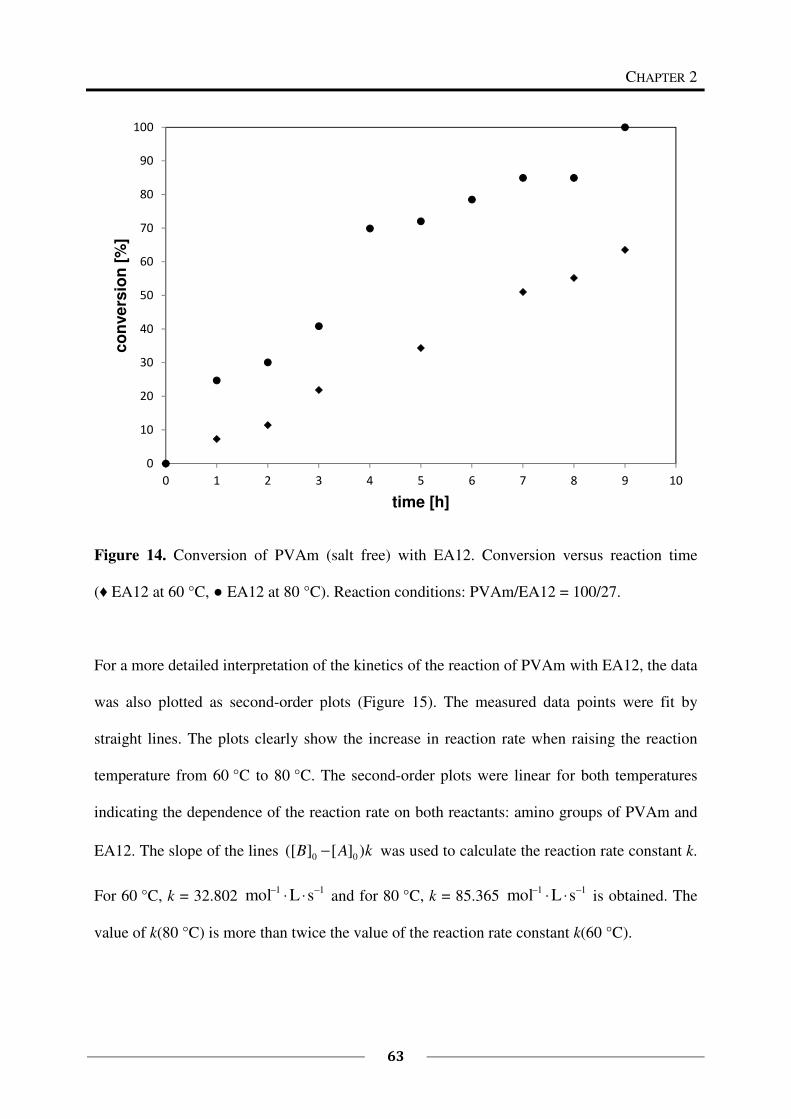
CHAPTER 2
63
Figure 14. Conversion of PVAm (salt free) with EA12. Conversion versus reaction time
(♦ EA12 at 60 °C, ● EA12 at 80 °C). Reaction conditions: PVAm/EA12 = 100/27.
For a more detailed interpretation of the kinetics of the reaction of PVAm with EA12, the data
was also plotted as second-order plots (Figure 15). The measured data points were fit by
straight lines. The plots clearly show the increase in reaction rate when raising the reaction
temperature from 60 °C to 80 °C. The second-order plots were linear for both temperatures
indicating the dependence of the reaction rate on both reactants: amino groups of PVAm and
EA12. The slope of the lines kAB )][]([ 00 − was used to calculate the reaction rate constant k.
For 60 °C, k = 32.802 11 sLmol −− ⋅⋅ and for 80 °C, k = 85.365
11 sLmol −− ⋅⋅ is obtained. The
value of k(80 °C) is more than twice the value of the reaction rate constant k(60 °C).
0
10
20
30
40
50
60
70
80
90
100
0 1 2 3 4 5 6 7 8 9 10
co
nve
rsio
n [
%]
time [h]
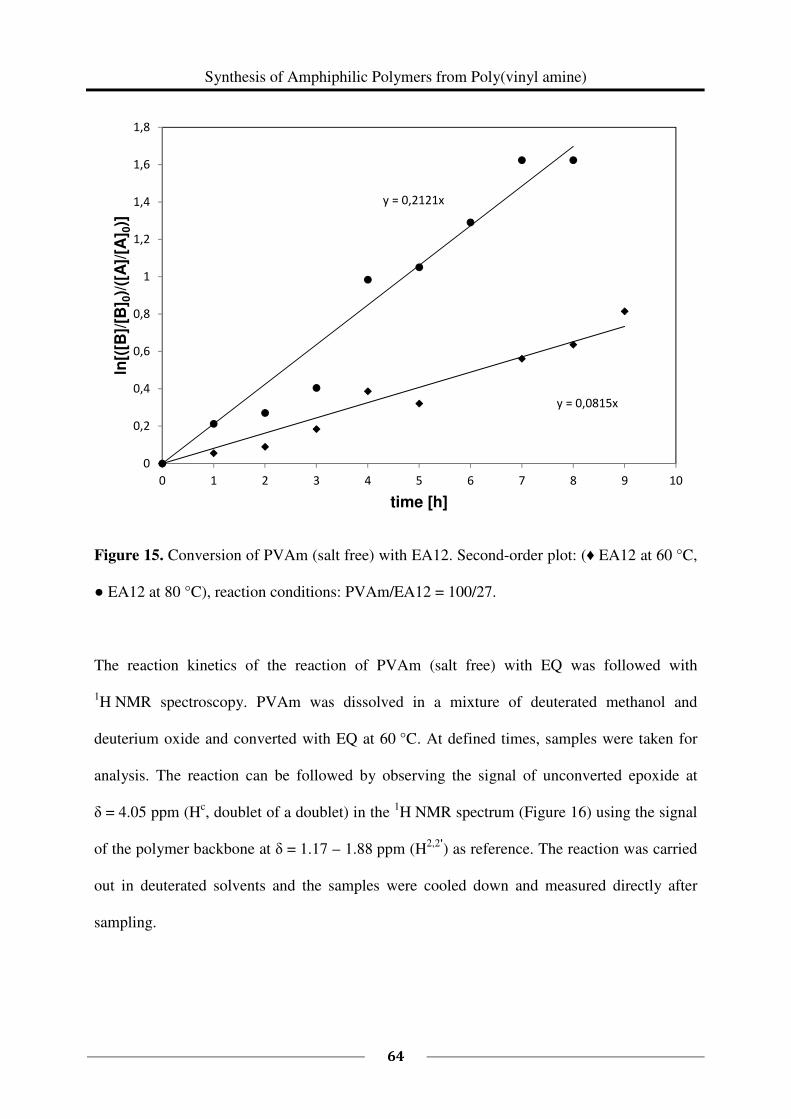
Synthesis of Amphiphilic Polymers from Poly(vinyl amine)
64
Figure 15. Conversion of PVAm (salt free) with EA12. Second-order plot: (♦ EA12 at 60 °C,
● EA12 at 80 °C), reaction conditions: PVAm/EA12 = 100/27.
The reaction kinetics of the reaction of PVAm (salt free) with EQ was followed with
1H NMR spectroscopy. PVAm was dissolved in a mixture of deuterated methanol and
deuterium oxide and converted with EQ at 60 °C. At defined times, samples were taken for
analysis. The reaction can be followed by observing the signal of unconverted epoxide at
δ = 4.05 ppm (Hc, doublet of a doublet) in the
1H NMR spectrum (Figure 16) using the signal
of the polymer backbone at δ = 1.17 – 1.88 ppm (H2,2'
) as reference. The reaction was carried
out in deuterated solvents and the samples were cooled down and measured directly after
sampling.
y = 0,0815x
y = 0,2121x
0
0,2
0,4
0,6
0,8
1
1,2
1,4
1,6
1,8
0 1 2 3 4 5 6 7 8 9 10
ln[(
[B]/
[B] 0
)/([
A]/
[A] 0
)]
time [h]
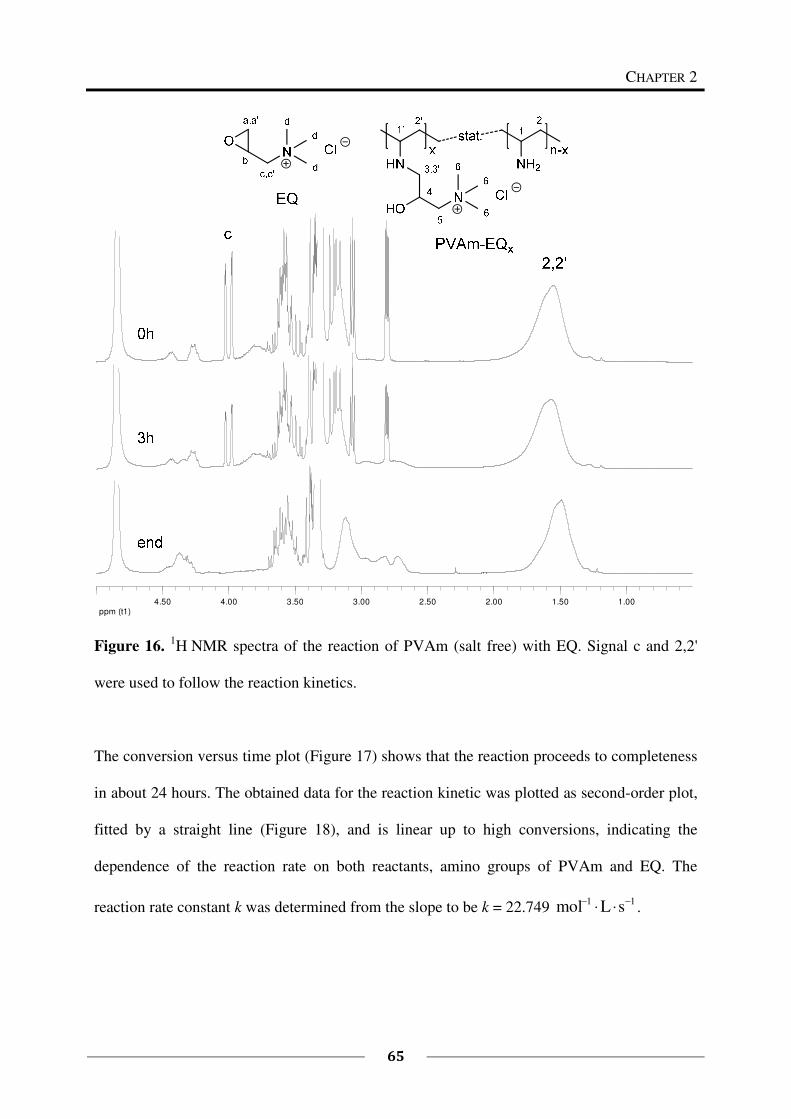
CHAPTER 2
65
ppm (t1)1.001.502.002.503.003.504.004.50
Figure 16. 1H NMR spectra of the reaction of PVAm (salt free) with EQ. Signal c and 2,2'
were used to follow the reaction kinetics.
The conversion versus time plot (Figure 17) shows that the reaction proceeds to completeness
in about 24 hours. The obtained data for the reaction kinetic was plotted as second-order plot,
fitted by a straight line (Figure 18), and is linear up to high conversions, indicating the
dependence of the reaction rate on both reactants, amino groups of PVAm and EQ. The
reaction rate constant k was determined from the slope to be k = 22.749 11 sLmol −− ⋅⋅ .
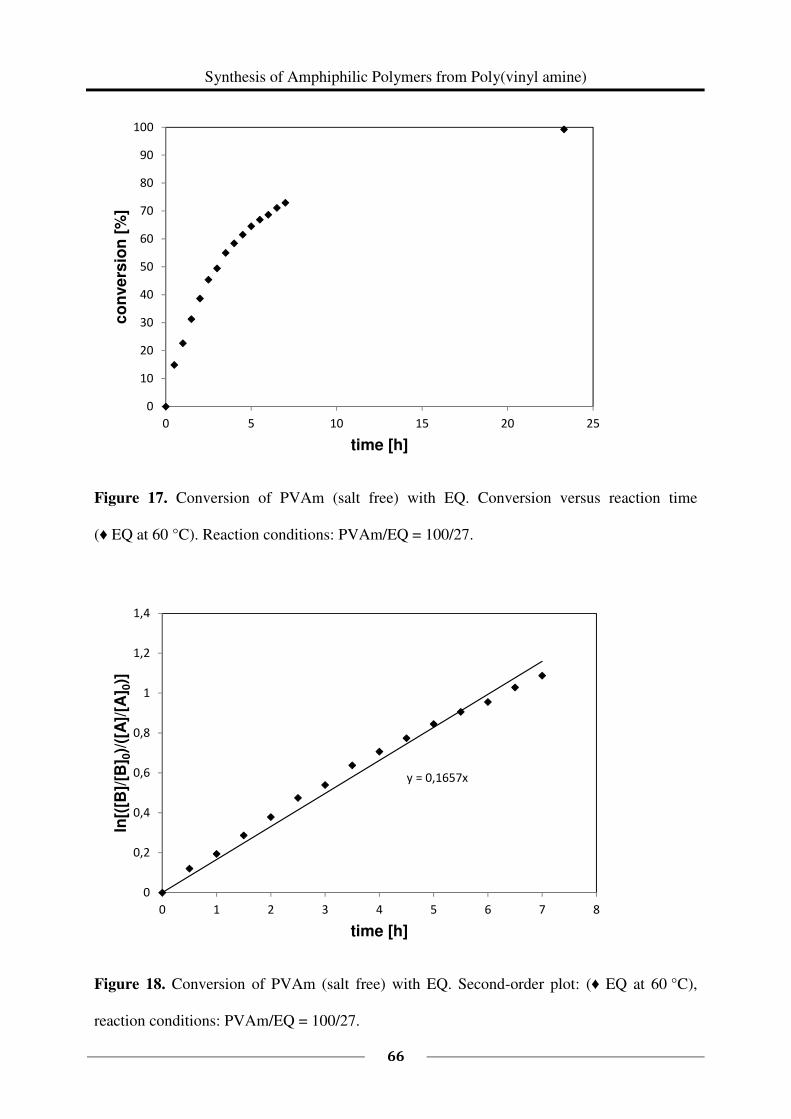
Synthesis of Amphiphilic Polymers from Poly(vinyl amine)
66
Figure 17. Conversion of PVAm (salt free) with EQ. Conversion versus reaction time
(♦ EQ at 60 °C). Reaction conditions: PVAm/EQ = 100/27.
Figure 18. Conversion of PVAm (salt free) with EQ. Second-order plot: (♦ EQ at 60 °C),
reaction conditions: PVAm/EQ = 100/27.
0
10
20
30
40
50
60
70
80
90
100
0 5 10 15 20 25
co
nve
rsio
n [
%]
time [h]
y = 0,1657x
0
0,2
0,4
0,6
0,8
1
1,2
1,4
0 1 2 3 4 5 6 7 8
ln[(
[B]/
[B] 0
)/([
A]/
[A] 0
)]
time [h]
CHAPTER 2
67
2.3.3 Reaction of Lupamins
The aim of this section was to transfer the reaction of PVAm (salt free) with functional
epoxides to the salt containing charges Lupamin 9095 and Lupamin 1595. It was observed
that the pH-value of the solution plays an important role for the reaction. Freeze-dried PVAm
(salt free) dissolved in dist. water has a pH of about 12. Freeze-dried Lupamin 9095 and 1595
dissolved in dist. water have a pH of about 8. This lower pH-value seems to hinder the
reaction. At the lower pH of 8, there is no reaction between the Lupamin and the functional
epoxide. The pH-value needs to be raised to about 13 before the reaction of the Lupamins
with EQ and EA12 can take place. This can be attributed to the lower nucleophilicity of the
amine groups at lower pH-values compared to the nucleophilicity at higher pH-values. At low
pH-values, the amine groups are partly protonated and not able to nucleophilicly attack the
epoxy ring. Both NaOH and KOH were tested to adjust the pH. Unfortunately, due to the
added base to raise the pH, some side reactions occurred. The functional epoxide EQ is partly
hydrolyzed during the reaction. This needs to be incorporated in the calculation of the amount
of educt to use, because the obtained degrees of functionalization for EQ are lower than the
adjusted ones. In addition the reaction time is longer for the reaction of Lupamins than for the
reaction of salt free PVAm with functional epoxides, using the same reaction conditions. It
takes 5 days instead of 2 days. As bases NaOH and KOH were tested whereof KOH leads to
slightly better results concerning the degree of functionalization and the reproducibility than
NaOH. NH3 is not suitable as base, because it reacts with the epoxides itself and leads to
crosslinking. A careful adjusting of the pH with KOH leads to reproducible results. The
hydrolysis of EQ can be determined and disregarded and the reaction with the Lupamins as
educts is a good possibility for scale up. Table 9 shows the expected and obtained degrees of
functionalization for the reaction of Lupamins with functional epoxides EA12 and EQ.
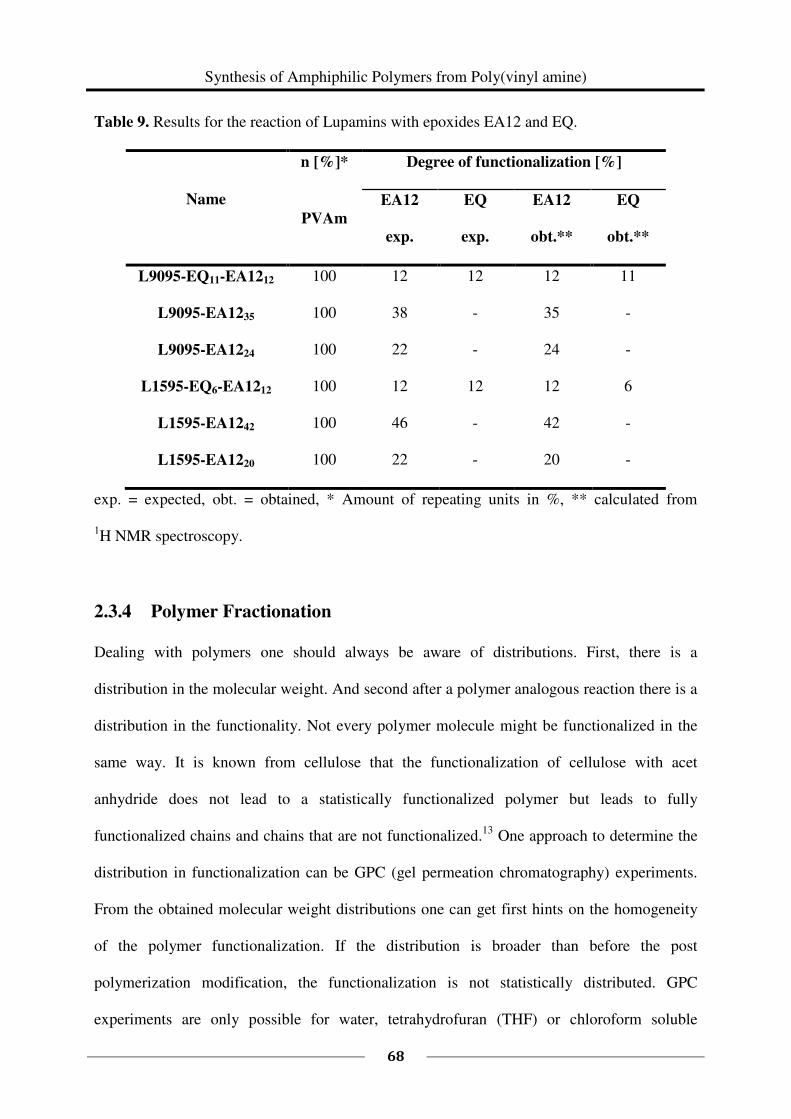
Synthesis of Amphiphilic Polymers from Poly(vinyl amine)
68
Table 9. Results for the reaction of Lupamins with epoxides EA12 and EQ.
Name
n [%]* Degree of functionalization [%]
PVAm
EA12
exp.
EQ
exp.
EA12
obt.**
EQ
obt.**
L9095-EQ11-EA1212 100 12 12 12 11
L9095-EA1235 100 38 - 35 -
L9095-EA1224 100 22 - 24 -
L1595-EQ6-EA1212 100 12 12 12 6
L1595-EA1242 100 46 - 42 -
L1595-EA1220 100 22 - 20 -
exp. = expected, obt. = obtained, * Amount of repeating units in %, ** calculated from
1H NMR spectroscopy.
2.3.4 Polymer Fractionation
Dealing with polymers one should always be aware of distributions. First, there is a
distribution in the molecular weight. And second after a polymer analogous reaction there is a
distribution in the functionality. Not every polymer molecule might be functionalized in the
same way. It is known from cellulose that the functionalization of cellulose with acet
anhydride does not lead to a statistically functionalized polymer but leads to fully
functionalized chains and chains that are not functionalized.13
One approach to determine the
distribution in functionalization can be GPC (gel permeation chromatography) experiments.
From the obtained molecular weight distributions one can get first hints on the homogeneity
of the polymer functionalization. If the distribution is broader than before the post
polymerization modification, the functionalization is not statistically distributed. GPC
experiments are only possible for water, tetrahydrofuran (THF) or chloroform soluble
CHAPTER 2
69
polymers due to technical reasons. The polymers prepared in this work are insoluble in THF
and chloroform and in some cases also insoluble in water. The polymers which were soluble
in water could not be measured with GPC because they were adhering to the GPC columns
and could therefore not be detected. Therefore NMR measurements were chosen as approach
to determine differences between the different fractions of the polymers. To determine if the
reaction of PVAm with functional epoxides gives statistically functionalized polymers,
polymer samples were prepared by fractional precipitation.
Fractionation of PVAm-EQ40
PVAm-EQ40 was fractionated by dissolution in methanol (p.a.) and addition of diethyl ether
(p.a.) until an opalescent solution was obtained followed by centrifugation to isolate the
precipitate and repeating these steps several times. The resulting six different fractions are
listed in Table 10. Fraction 6 is the evaporated rest of the solution. The residual solvent was
removed from the fractions by vacuum distillation (15 mbar). Acetone was not suitable for
fractionation.
It was observed that the solubility decreases with increasing fraction number. The three later
fractions number 4, 5 and 6 could not be brought back into solution properly for NMR
measurements. They were swelling and forming a gel. A possible reason for this is that the
polymer was fractionated by molecular weight and the later fractions contain polymers of
higher molecular weight which causes the reduced solubility once they are isolated. The
fractions were analyzed by 1H NMR spectroscopy (Figure 19). Although Fraction 6 formed
only a gel it was measured.
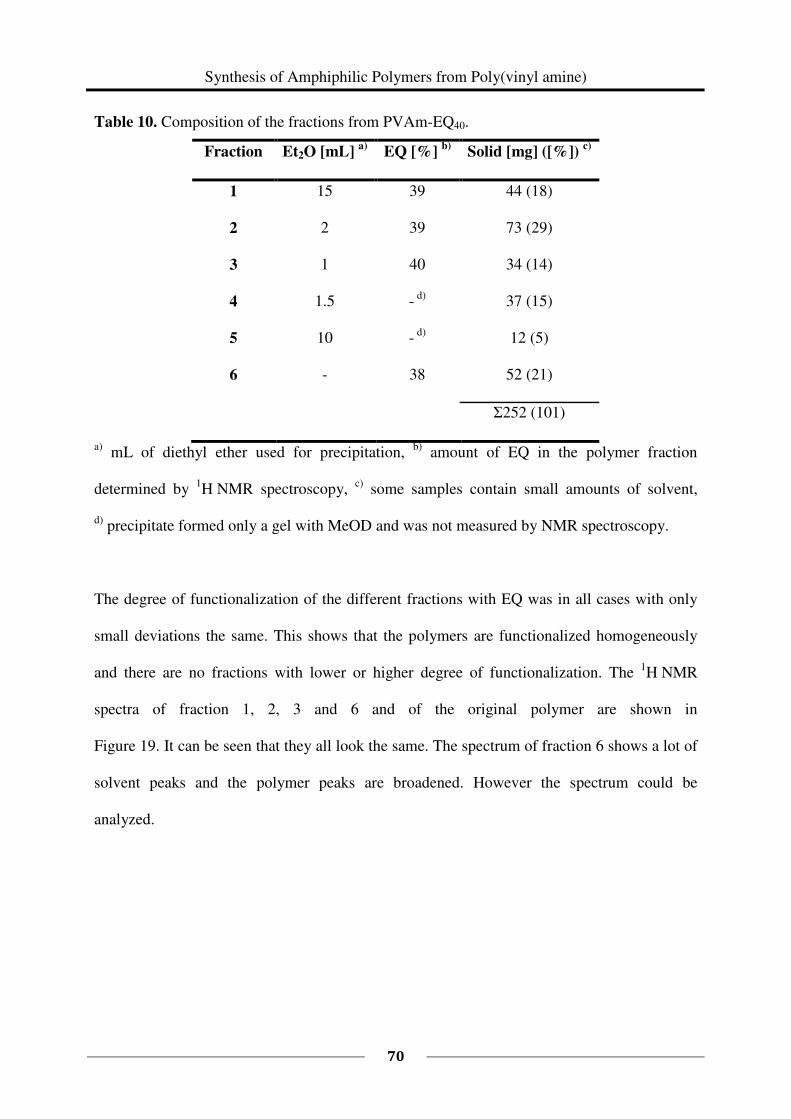
Synthesis of Amphiphilic Polymers from Poly(vinyl amine)
70
Table 10. Composition of the fractions from PVAm-EQ40.
Fraction Et2O [mL] a)
EQ [%] b)
Solid [mg] ([%]) c)
1 15 39 44 (18)
2 2 39 73 (29)
3 1 40 34 (14)
4 1.5 - d)
37 (15)
5 10 - d)
12 (5)
6 - 38 52 (21)
Σ252 (101)
a) mL of diethyl ether used for precipitation,
b) amount of EQ in the polymer fraction
determined by 1H NMR spectroscopy,
c) some samples contain small amounts of solvent,
d) precipitate formed only a gel with MeOD and was not measured by NMR spectroscopy.
The degree of functionalization of the different fractions with EQ was in all cases with only
small deviations the same. This shows that the polymers are functionalized homogeneously
and there are no fractions with lower or higher degree of functionalization. The 1H NMR
spectra of fraction 1, 2, 3 and 6 and of the original polymer are shown in
Figure 19. It can be seen that they all look the same. The spectrum of fraction 6 shows a lot of
solvent peaks and the polymer peaks are broadened. However the spectrum could be
analyzed.
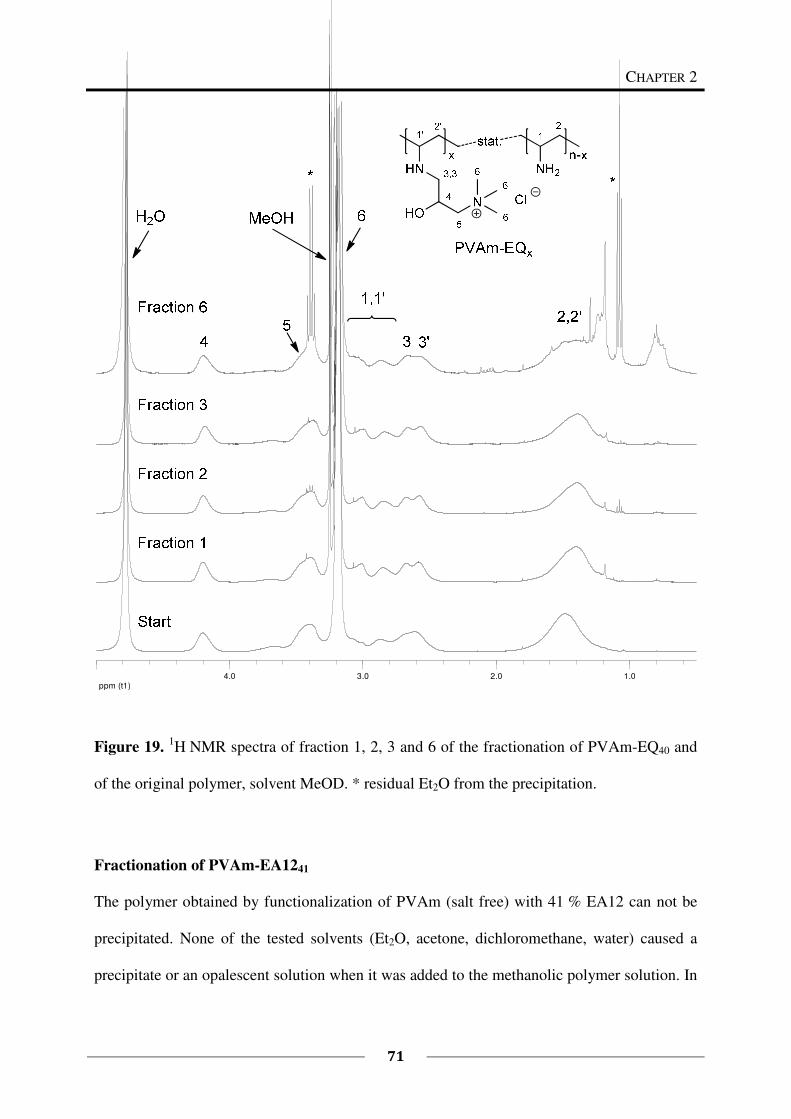
CHAPTER 2
71
ppm (t1)1.02.03.04.0
Figure 19. 1H NMR spectra of fraction 1, 2, 3 and 6 of the fractionation of PVAm-EQ40 and
of the original polymer, solvent MeOD. * residual Et2O from the precipitation.
Fractionation of PVAm-EA1241
The polymer obtained by functionalization of PVAm (salt free) with 41 % EA12 can not be
precipitated. None of the tested solvents (Et2O, acetone, dichloromethane, water) caused a
precipitate or an opalescent solution when it was added to the methanolic polymer solution. In
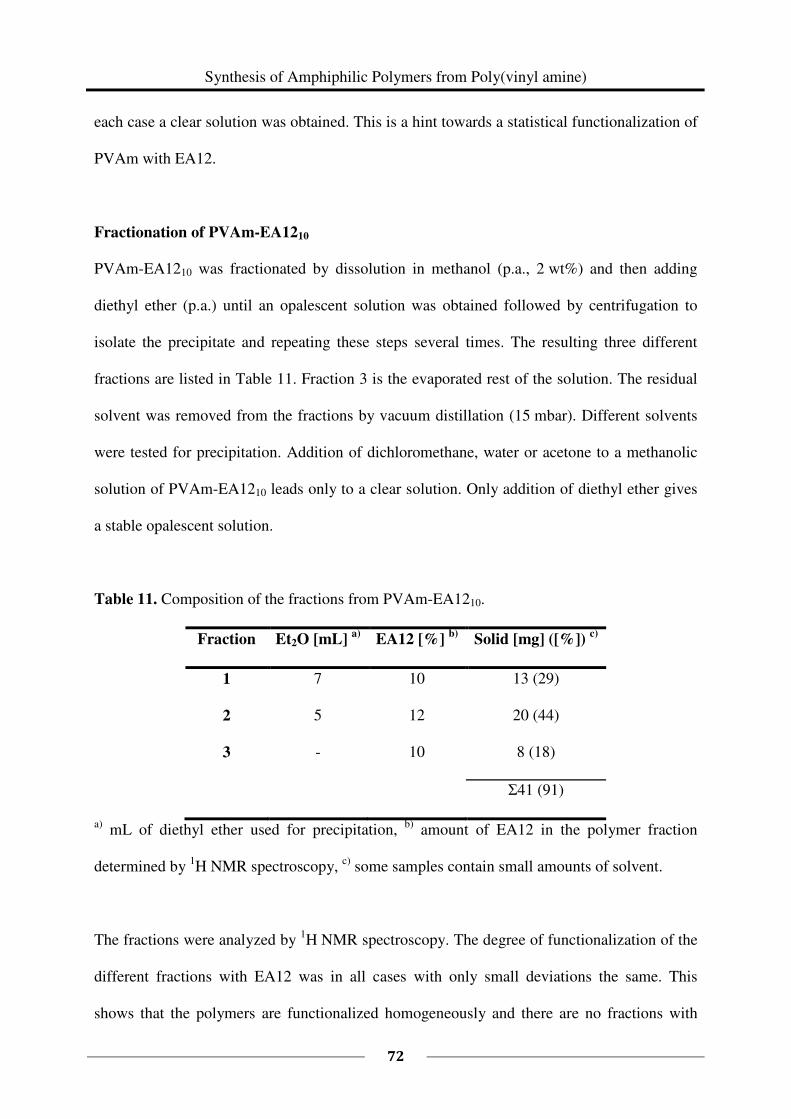
Synthesis of Amphiphilic Polymers from Poly(vinyl amine)
72
each case a clear solution was obtained. This is a hint towards a statistical functionalization of
PVAm with EA12.
Fractionation of PVAm-EA1210
PVAm-EA1210 was fractionated by dissolution in methanol (p.a., 2 wt%) and then adding
diethyl ether (p.a.) until an opalescent solution was obtained followed by centrifugation to
isolate the precipitate and repeating these steps several times. The resulting three different
fractions are listed in Table 11. Fraction 3 is the evaporated rest of the solution. The residual
solvent was removed from the fractions by vacuum distillation (15 mbar). Different solvents
were tested for precipitation. Addition of dichloromethane, water or acetone to a methanolic
solution of PVAm-EA1210 leads only to a clear solution. Only addition of diethyl ether gives
a stable opalescent solution.
Table 11. Composition of the fractions from PVAm-EA1210.
Fraction Et2O [mL] a)
EA12 [%] b)
Solid [mg] ([%]) c)
1 7 10 13 (29)
2 5 12 20 (44)
3 - 10 8 (18)
Σ41 (91)
a) mL of diethyl ether used for precipitation,
b) amount of EA12 in the polymer fraction
determined by 1H NMR spectroscopy,
c) some samples contain small amounts of solvent.
The fractions were analyzed by 1H NMR spectroscopy. The degree of functionalization of the
different fractions with EA12 was in all cases with only small deviations the same. This
shows that the polymers are functionalized homogeneously and there are no fractions with
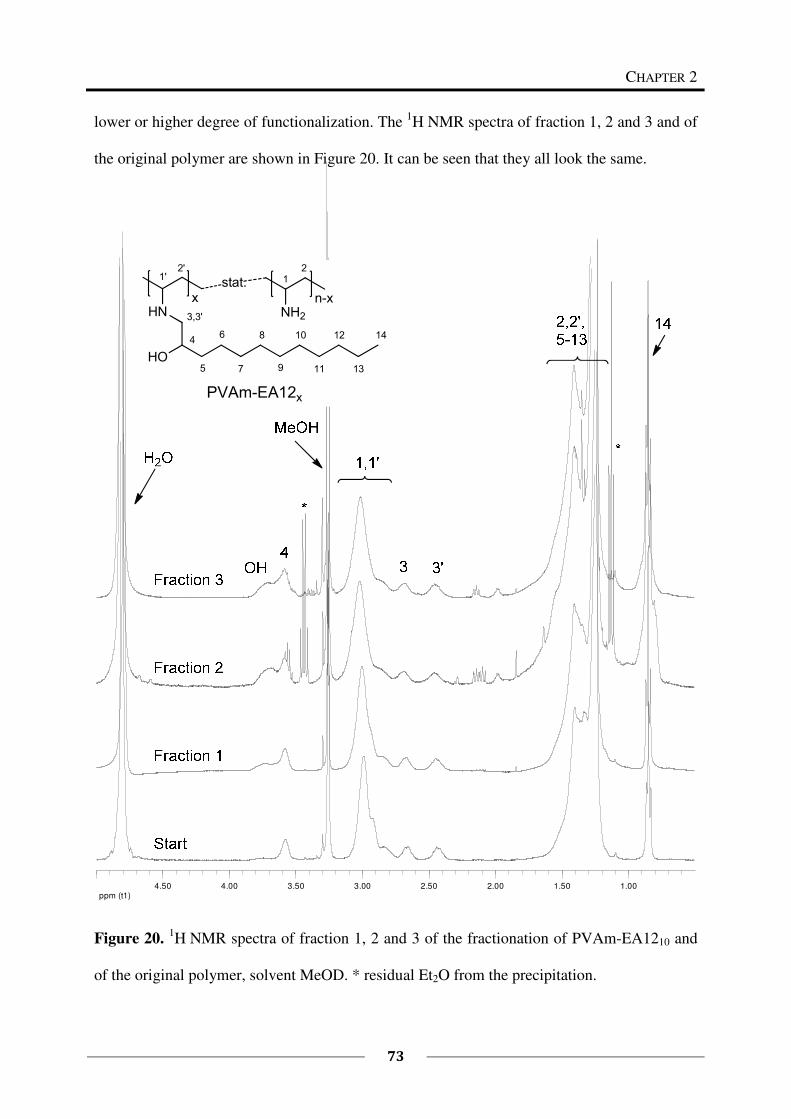
CHAPTER 2
73
lower or higher degree of functionalization. The 1H NMR spectra of fraction 1, 2 and 3 and of
the original polymer are shown in Figure 20. It can be seen that they all look the same.
ppm (t1)1.001.502.002.503.003.504.004.50
Figure 20. 1H NMR spectra of fraction 1, 2 and 3 of the fractionation of PVAm-EA1210 and
of the original polymer, solvent MeOD. * residual Et2O from the precipitation.
���
� �
��
��
��
�
���
�
�
����
���� !
������"�
#$�$%
&'�( �����
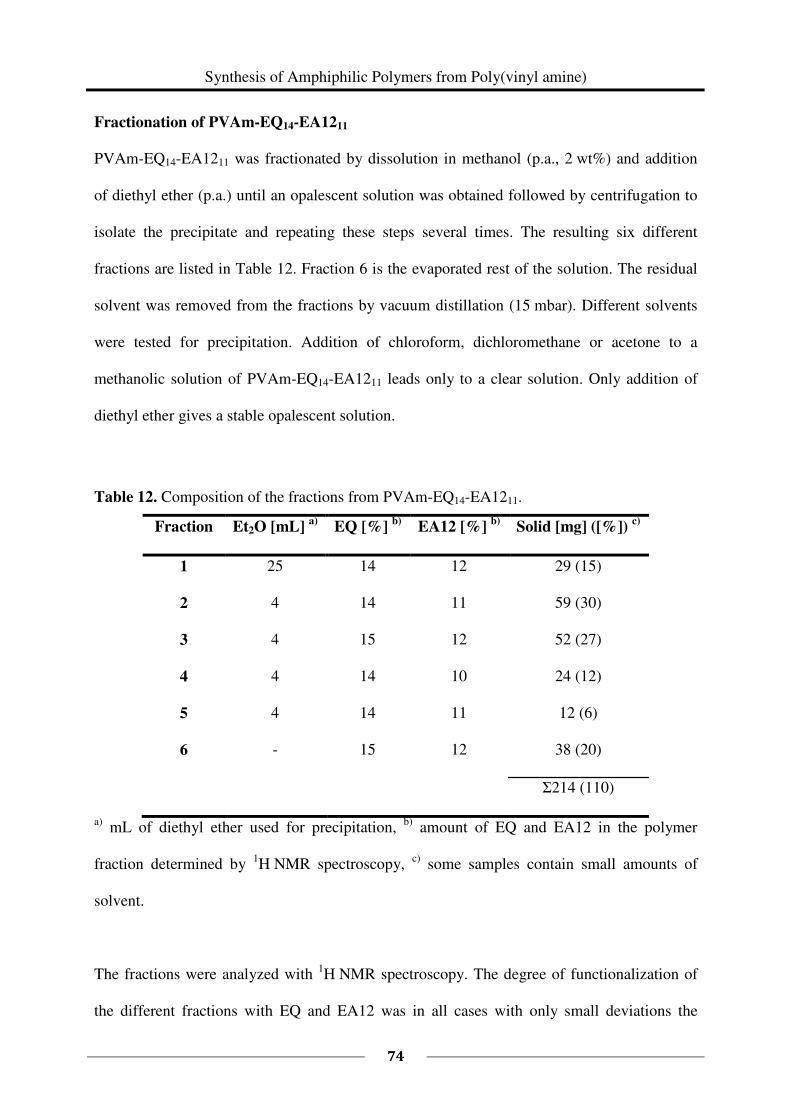
Synthesis of Amphiphilic Polymers from Poly(vinyl amine)
74
Fractionation of PVAm-EQ14-EA1211
PVAm-EQ14-EA1211 was fractionated by dissolution in methanol (p.a., 2 wt%) and addition
of diethyl ether (p.a.) until an opalescent solution was obtained followed by centrifugation to
isolate the precipitate and repeating these steps several times. The resulting six different
fractions are listed in Table 12. Fraction 6 is the evaporated rest of the solution. The residual
solvent was removed from the fractions by vacuum distillation (15 mbar). Different solvents
were tested for precipitation. Addition of chloroform, dichloromethane or acetone to a
methanolic solution of PVAm-EQ14-EA1211 leads only to a clear solution. Only addition of
diethyl ether gives a stable opalescent solution.
Table 12. Composition of the fractions from PVAm-EQ14-EA1211.
Fraction Et2O [mL] a)
EQ [%] b)
EA12 [%] b)
Solid [mg] ([%]) c)
1 25 14 12 29 (15)
2 4 14 11 59 (30)
3 4 15 12 52 (27)
4 4 14 10 24 (12)
5 4 14 11 12 (6)
6 - 15 12 38 (20)
Σ214 (110)
a) mL of diethyl ether used for precipitation,
b) amount of EQ and EA12 in the polymer
fraction determined by 1H NMR spectroscopy,
c) some samples contain small amounts of
solvent.
The fractions were analyzed with 1H NMR spectroscopy. The degree of functionalization of
the different fractions with EQ and EA12 was in all cases with only small deviations the
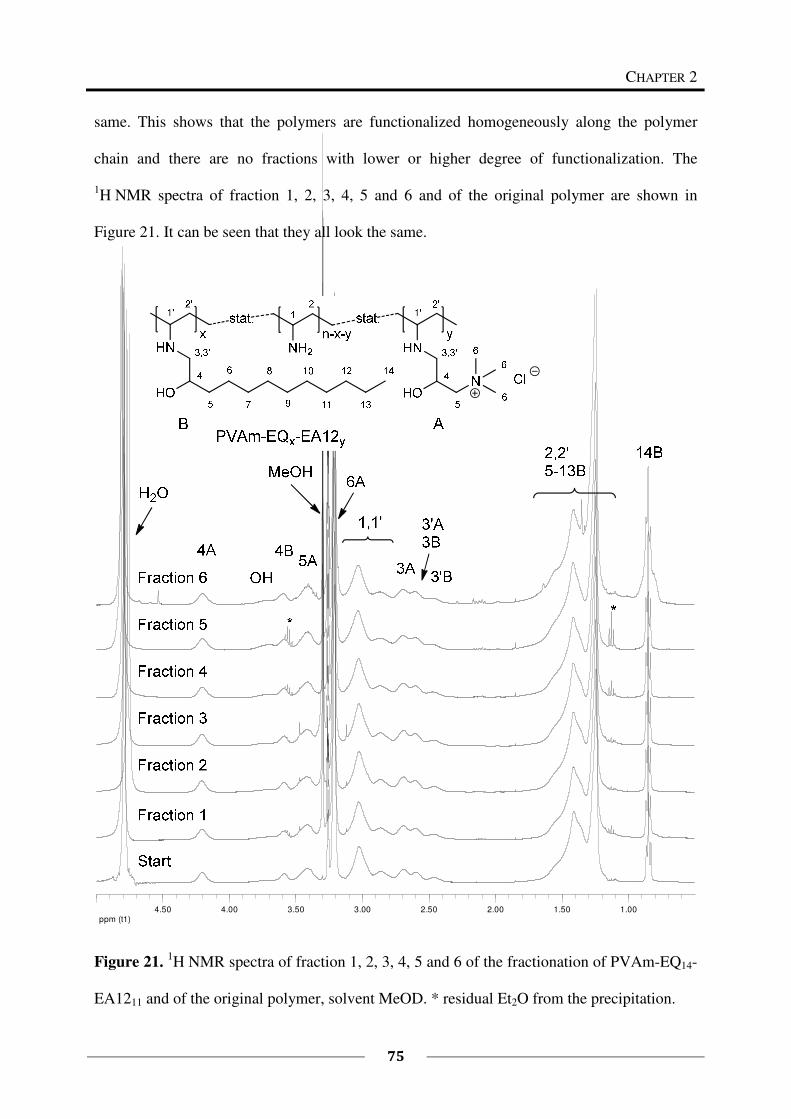
CHAPTER 2
75
same. This shows that the polymers are functionalized homogeneously along the polymer
chain and there are no fractions with lower or higher degree of functionalization. The
1H NMR spectra of fraction 1, 2, 3, 4, 5 and 6 and of the original polymer are shown in
Figure 21. It can be seen that they all look the same.
ppm (t1)1.001.502.002.503.003.504.004.50
Figure 21. 1H NMR spectra of fraction 1, 2, 3, 4, 5 and 6 of the fractionation of PVAm-EQ14-
EA1211 and of the original polymer, solvent MeOD. * residual Et2O from the precipitation.
Synthesis of Amphiphilic Polymers from Poly(vinyl amine)
76
The performed fractionation experiments show that the functionalization of PVAm with
different functional epoxides leads to statistically functionalized polymers. Via NMR analysis
no differences in functionalization could be determined. Due to differences in solubility and
viscosity of the fractions (especially for PVAm-EQ40) it can be assumed that the polymers
were fractionated by molecular weight and the later fractions contain polymers of higher
molecular weight which causes the reduced solubility once they are isolated.
2.4 Conclusions
Amphiphilic multifunctional poly(vinyl amine)s with long alkyl chains, quaternary
ammonium groups or both together were successfully prepared by polymer analogous
reaction of PVAm with functional epoxides. The reaction was studied in detail. Equimolar
and reproducible conversions were obtained. There is a limit to the degree of functionalization
at around 70 % for the functionalization with cationic groups. This limit stems from the
electrostatic repulsion of the groups. For the functionalization with epoxyalkanes there seems
to be a limit at about 50 %. This can be due to sterical hindrance. A complete conversion of
oxiranes has been proven by Raman spectroscopy and the polymers were characterized by
NMR spectroscopy. The degree of functionalization can easily be adjusted by the ratio of
functional epoxides to amine groups so that a high variety of polymers is accessible. The
reaction kinetics were analysed. Both reactions, with the cationic epoxide and with the
epoxyalkane, follow a second-order kinetic and are dependent on the concentration of both,
amine groups and epoxide. Raising the temperature leads to an increased reaction rate. The
reaction rate constants k were calculated from the fitted data. The reaction was successfully
transferred to technically available PVAm (Lupamin 9095 and Lupamin 1595) so that a scale
up of the reaction is possible. Fractionation experiments were performed and demonstrated
that the functionalization of PVAm with different functional epoxides leads to statistically
CHAPTER 2
77
functionalized polymers. The prepared multifunctional polymers can be used for surface
coating. The degree of functionalization with cationic groups will affect the strength of
adhesion to the surface.
2.5 Literature
1 M. A. Gauthier, M. I. Gibson, H-A. Klok, Angew. Chem. Int. Ed. 2009, 48, 48-58.
2 Badesso, R.J.; Pinschmidt, Jr., R.K.; Sagl, D.J. Proc. Am. Chem. Soc., Div. Polym. Mat. Sci. Eng. 1993, 69,
251.
Badesso, R.J.; Nordquist, A.F.; Pinschmidt, Jr., R.K.; Sagl, D.J. In Hydrophilic Polymers: Performance with
Environmental Acceptance; Glass, E., Ed.; American Chemical Society: Washington, D.C., 1995; 489
3 Technisches Merkblatt N-Vinylformamid, Mitsubishi Kasai, Japan, 1997.
4 Pinschmidt Jr., R. K.; Sagl, D. J. Polymeric Materials Encyclopedia; Ed.: Salamone, J. C.; CRC Press New
York 1996, 7095 ff.
5 Gu, L.; Zhu, S.; Hrymak, A. N.; Pelton, R. H. Polymer 2001, 42, 3077–3086.
6 Gu, L.; Zhu, S.; Hrymak, A. N. J. Appl. Polym. Sci. 2002, 86, 3412–3419.
7 Kröner, M.; Dupuis, J., Winter, M. J. Prakt. Chem. 2000, 342, 115–131.
8 Produkt-Informationsbroschüre zu Lupaminen®, BASF AG, Ludwigshafen, 2000.
9 T. Tashiro Macromol. Mater. Eng. 2001, 286, 63-87.
10 Y. He Dissertation „From Cyclic Cyrbonate Bifunctional Couplers to Amphiphilic Poly(ethylene imine)s”
2010, ITMC RWTH Aachen.
11 N. Pasquier, H. Keul, E. Heine, M. Moeller Biomacromolecules 2007, 8 (9), 2874-2882.
12 N. Pasquier, H. Keul, E. Heine, M. Moeller, B. Angelov, S. Linser, R. Willumeit Macromolecular Bioscience
2008, 8 (10), 903-915.
13 Th. Eicher, W. Fischer Ullmanns Encyklopädie der technischen Chemie, 4. Edition, Volume 9,
(Celluloseester), 227-246.
Synthesis of Amphiphilic Polymers from Poly(vinyl amine)
78
CHAPTER 3
79
SYNTHESIS OF AMPHIPHILIC POLYMERS AND THEIR
CHARACTERIZATION IN SOLUTION
3.1 Introduction
The post polymerization modification of poly(vinyl amine) (PVAm) with functional epoxides
provides a straightforward route to the synthesis of multifunctional amphiphilic polyamines.
Cationic groups and alkyl chains can easily be incorporated into the polymer backbone.
PVAm is a linear, weak, cationic polyelectrolyte with up to 100 % free primary amine groups,
one per repeating unit. It is nowadays prepared from poly(N-vinyl formamide) (PNVF) by
hydrolysis under moderate conditions both in acidic and in basic media and is commercially
available from BASF SE (Lupamin). The degree of hydrolysis and thereby the charge density
of the polymer backbone can be adjusted by the choice of the hydrolysis conditions like
temperature, reaction time, and concentration of acid or base.1,2,3,4,5,6
PVAm has been applied in many fields like catalysis7, waste water treatment
8, paper
making9,10,11
, chelation12
, recovery of oil13,14,15,16,17,18,19,20
, and as superabsorber21,22,23,24
. Some
studies on the modification of PVAm with the goal to obtain polymeric water-soluble dyes
have been performed.25
For instance Spange et al. modified PVAm with azo dyes to introduce
chromophores in the polymeric structure.26
Furthermore PVAm was modified to give polymer
surfactants27
, and to mimic natural enzymes7.
The objective of this work is the functionalization of PVAm on the one hand with a
combination of cationic and alkyl oxiranes of different chain length and on the other hand
with different concentrations of an alkyl oxirane only. The aim is to get insight into the
Synthesis of Amphiphilic Polymers and Their Characterization in Solution
80
structure-solution properties relation of the developed polymers, in dependence on the chain
length and the concentration of introduced alkyl chains.
3.2 Experimental Part
Poly(vinyl amine) is composed of different repeating units: vinyl amine and residual vinyl
formamide, whose ratio can be determined by 1H NMR spectroscopy. In what follows, M
denotes the averaged molecular weight per repeating unit calculated from the 1H NMR
spectrum.
3.2.1 Materials
Starting materials were used as received: 1,2-epoxyoctane (EA8) (Alfa Aesar, 96 %), 1,2-
epoxydecane (EA10) (Alfa Aesar, 97 %), 1,2-epoxydodecane (EA12) (Alfa Aesar, 96 %),
1,2-epoxytetradecane (EA14) (TCI Europe, 95 %), 1,2-epoxyhexadecane (EA16) (Aldrich,
86 %), 1,2-epoxyoctadecane (EA18) (Alfa Aesar, 90 %) and glycidyltrimethylammonium
chloride (EQ) (Aldrich, 75-80 % in water; since the oxirane degrades in time, the active
content is determined just before use by NMR spectroscopy), Seral-water (conductivity
0.055 µS/cm). Poly(vinyl amine) (PVAm) has been supplied by BASF (explorative material:
salt free PVAm, supplier information: purified by ultra filtration, molecular weight =
340.000 g/mol). PVAm was freeze-dried before use. The dialysis tubings of regenerated
cellulose had a molecular weight cut off of 50 kDa (CelluSep). The analytical data of the
PVAm (salt free) are summarized in Table 1.
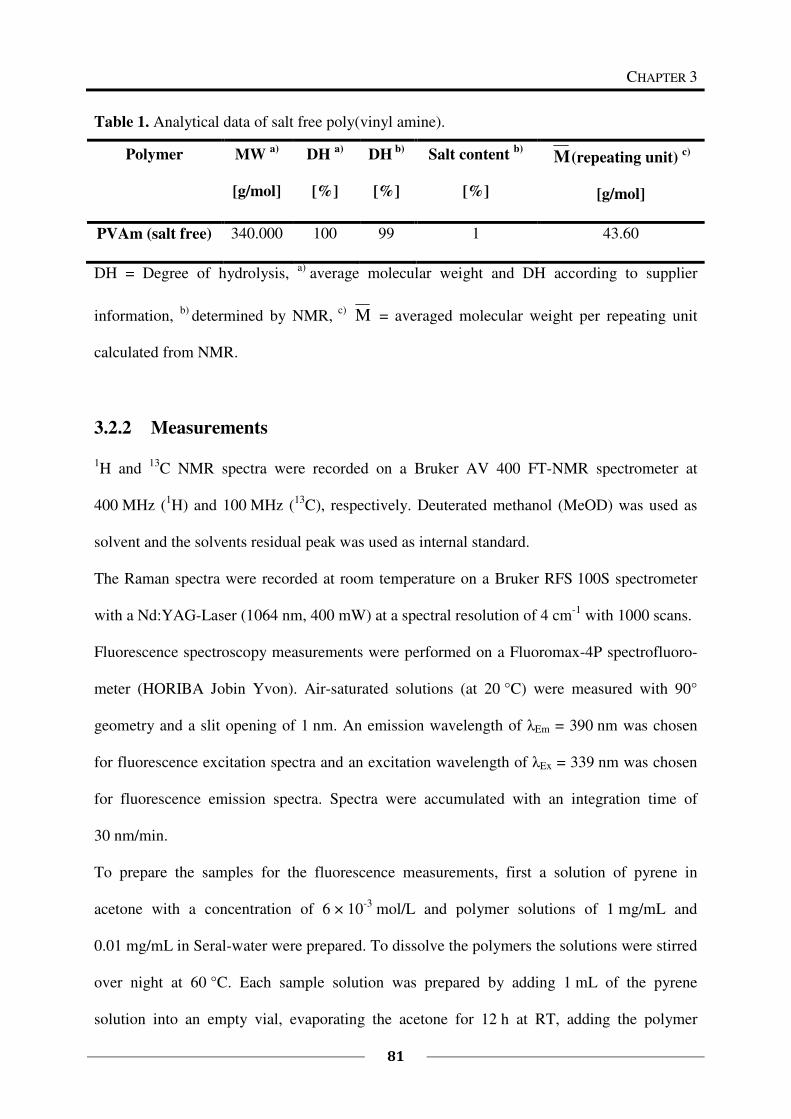
CHAPTER 3
81
Table 1. Analytical data of salt free poly(vinyl amine).
Polymer
MW a)
[g/mol]
DH a)
[%]
DH b)
[%]
Salt content b)
[%]
M(repeating unit) c)
[g/mol]
PVAm (salt free) 340.000 100 99 1 43.60
DH = Degree of hydrolysis, a)
average molecular weight and DH according to supplier
information, b)
determined by NMR, c)
M = averaged molecular weight per repeating unit
calculated from NMR.
3.2.2 Measurements
1H and
13C NMR spectra were recorded on a Bruker AV 400 FT-NMR spectrometer at
400 MHz (1H) and 100 MHz (
13C), respectively. Deuterated methanol (MeOD) was used as
solvent and the solvents residual peak was used as internal standard.
The Raman spectra were recorded at room temperature on a Bruker RFS 100S spectrometer
with a Nd:YAG-Laser (1064 nm, 400 mW) at a spectral resolution of 4 cm-1
with 1000 scans.
Fluorescence spectroscopy measurements were performed on a Fluoromax-4P spectrofluoro-
meter (HORIBA Jobin Yvon). Air-saturated solutions (at 20 °C) were measured with 90°
geometry and a slit opening of 1 nm. An emission wavelength of λEm = 390 nm was chosen
for fluorescence excitation spectra and an excitation wavelength of λEx = 339 nm was chosen
for fluorescence emission spectra. Spectra were accumulated with an integration time of
30 nm/min.
To prepare the samples for the fluorescence measurements, first a solution of pyrene in
acetone with a concentration of 6 × 10⁻³
mol/L and polymer solutions of 1 mg/mL and
0.01 mg/mL in Seral-water were prepared. To dissolve the polymers the solutions were stirred
over night at 60 °C. Each sample solution was prepared by adding 1 mL of the pyrene
solution into an empty vial, evaporating the acetone for 12 h at RT, adding the polymer
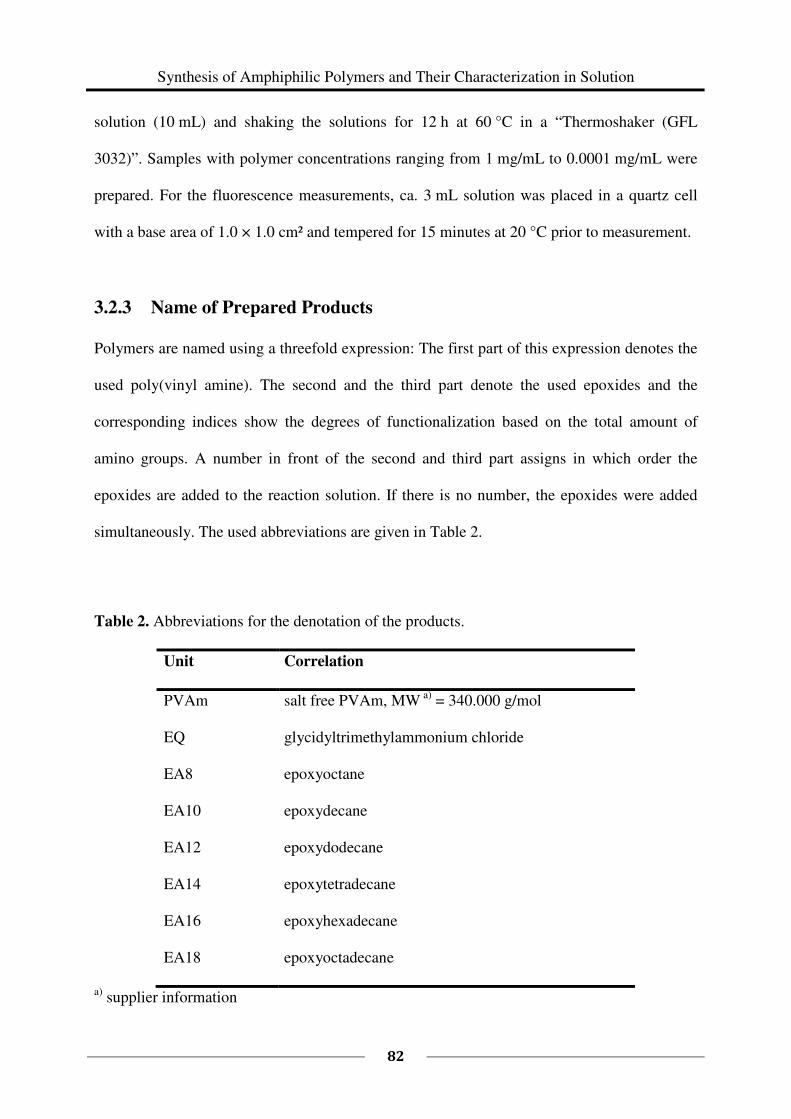
Synthesis of Amphiphilic Polymers and Their Characterization in Solution
82
solution (10 mL) and shaking the solutions for 12 h at 60 °C in a “Thermoshaker (GFL
3032)”. Samples with polymer concentrations ranging from 1 mg/mL to 0.0001 mg/mL were
prepared. For the fluorescence measurements, ca. 3 mL solution was placed in a quartz cell
with a base area of 1.0 × 1.0 cm² and tempered for 15 minutes at 20 °C prior to measurement.
3.2.3 Name of Prepared Products
Polymers are named using a threefold expression: The first part of this expression denotes the
used poly(vinyl amine). The second and the third part denote the used epoxides and the
corresponding indices show the degrees of functionalization based on the total amount of
amino groups. A number in front of the second and third part assigns in which order the
epoxides are added to the reaction solution. If there is no number, the epoxides were added
simultaneously. The used abbreviations are given in Table 2.
Table 2. Abbreviations for the denotation of the products.
Unit Correlation
PVAm salt free PVAm, MW a)
= 340.000 g/mol
EQ glycidyltrimethylammonium chloride
EA8 epoxyoctane
EA10 epoxydecane
EA12 epoxydodecane
EA14 epoxytetradecane
EA16 epoxyhexadecane
EA18 epoxyoctadecane
a) supplier information
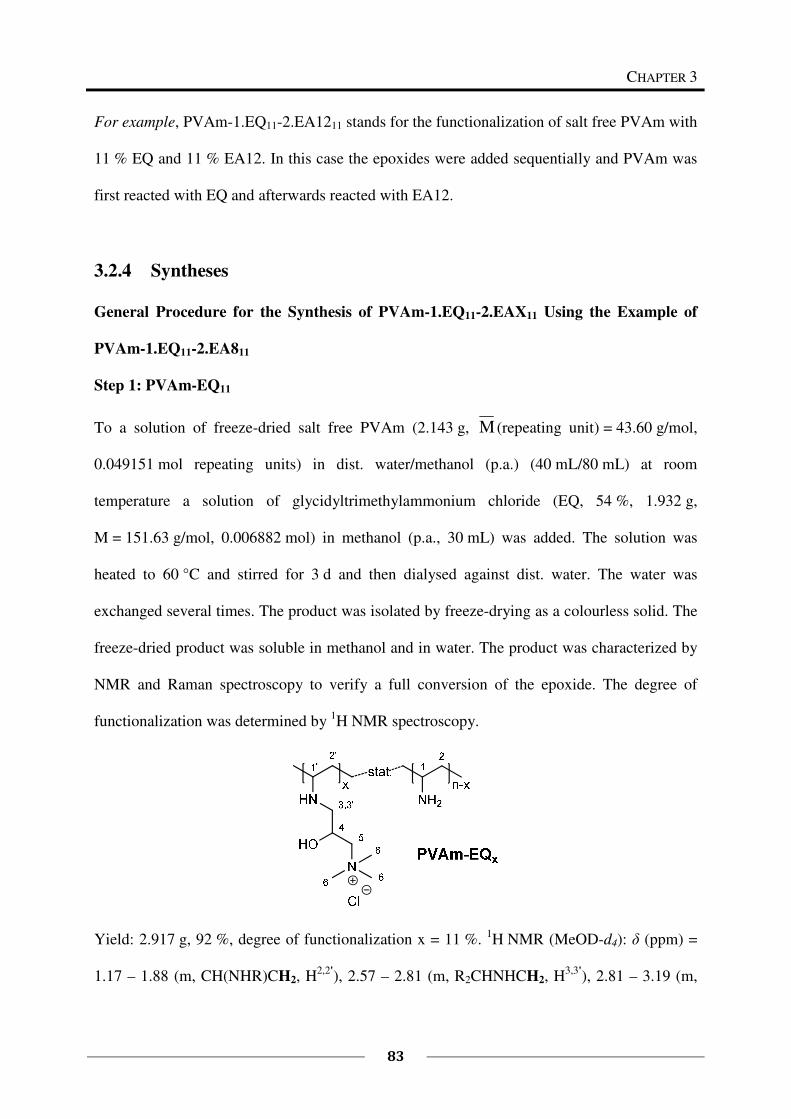
CHAPTER 3
83
For example, PVAm-1.EQ11-2.EA1211 stands for the functionalization of salt free PVAm with
11 % EQ and 11 % EA12. In this case the epoxides were added sequentially and PVAm was
first reacted with EQ and afterwards reacted with EA12.
3.2.4 Syntheses
General Procedure for the Synthesis of PVAm-1.EQ11-2.EAX11 Using the Example of
PVAm-1.EQ11-2.EA811
Step 1: PVAm-EQ11
To a solution of freeze-dried salt free PVAm (2.143 g, M (repeating unit) = 43.60 g/mol,
0.049151 mol repeating units) in dist. water/methanol (p.a.) (40 mL/80 mL) at room
temperature a solution of glycidyltrimethylammonium chloride (EQ, 54 %, 1.932 g,
M = 151.63 g/mol, 0.006882 mol) in methanol (p.a., 30 mL) was added. The solution was
heated to 60 °C and stirred for 3 d and then dialysed against dist. water. The water was
exchanged several times. The product was isolated by freeze-drying as a colourless solid. The
freeze-dried product was soluble in methanol and in water. The product was characterized by
NMR and Raman spectroscopy to verify a full conversion of the epoxide. The degree of
functionalization was determined by 1H NMR spectroscopy.
Yield: 2.917 g, 92 %, degree of functionalization x = 11 %. 1H NMR (MeOD-d4): δ (ppm) =
1.17 – 1.88 (m, CH(NHR)CH2, H2,2'
), 2.57 – 2.81 (m, R2CHNHCH2, H3,3'
), 2.81 – 3.19 (m,
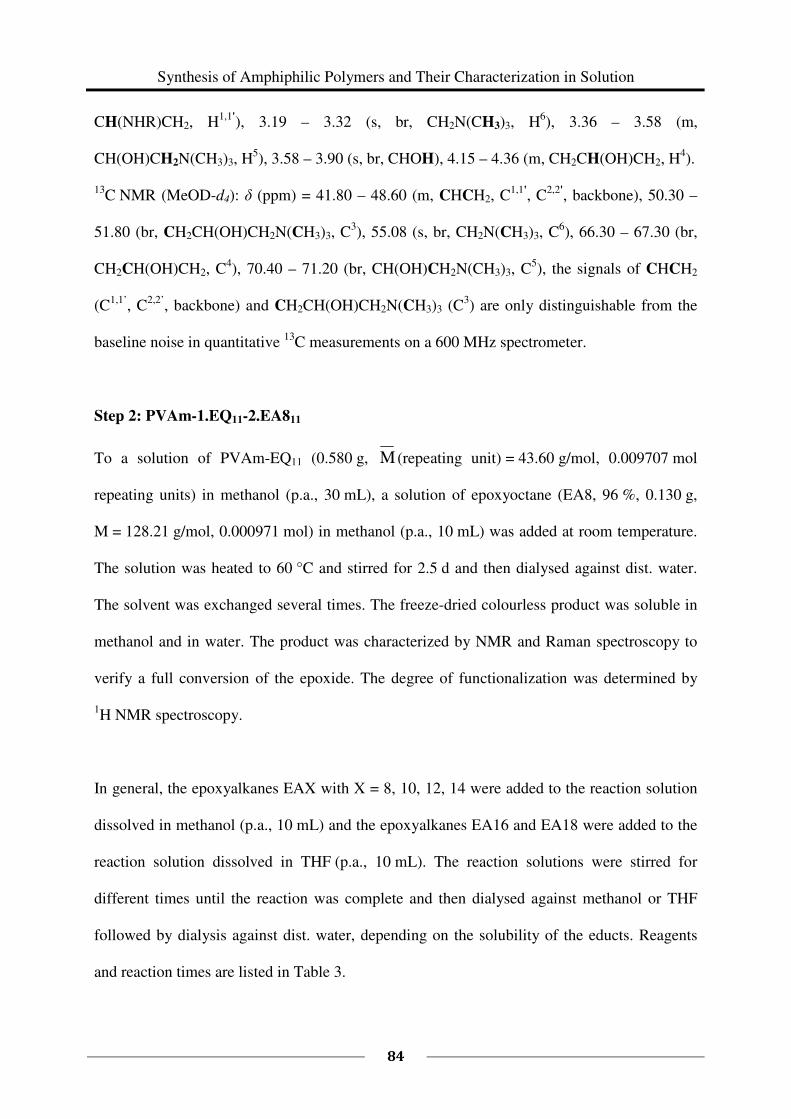
Synthesis of Amphiphilic Polymers and Their Characterization in Solution
84
CH(NHR)CH2, H1,1'
), 3.19 – 3.32 (s, br, CH2N(CH3)3, H6), 3.36 – 3.58 (m,
CH(OH)CH2N(CH3)3, H5), 3.58 – 3.90 (s, br, CHOH), 4.15 – 4.36 (m, CH2CH(OH)CH2, H
4).
13C NMR (MeOD-d4): δ (ppm) = 41.80 – 48.60 (m, CHCH2, C
1,1', C
2,2', backbone), 50.30 –
51.80 (br, CH2CH(OH)CH2N(CH3)3, C3), 55.08 (s, br, CH2N(CH3)3, C
6), 66.30 – 67.30 (br,
CH2CH(OH)CH2, C4), 70.40 – 71.20 (br, CH(OH)CH2N(CH3)3, C
5), the signals of CHCH2
(C1,1’
, C2,2’
, backbone) and CH2CH(OH)CH2N(CH3)3 (C3) are only distinguishable from the
baseline noise in quantitative 13
C measurements on a 600 MHz spectrometer.
Step 2: PVAm-1.EQ11-2.EA811
To a solution of PVAm-EQ11 (0.580 g, M (repeating unit) = 43.60 g/mol, 0.009707 mol
repeating units) in methanol (p.a., 30 mL), a solution of epoxyoctane (EA8, 96 %, 0.130 g,
M = 128.21 g/mol, 0.000971 mol) in methanol (p.a., 10 mL) was added at room temperature.
The solution was heated to 60 °C and stirred for 2.5 d and then dialysed against dist. water.
The solvent was exchanged several times. The freeze-dried colourless product was soluble in
methanol and in water. The product was characterized by NMR and Raman spectroscopy to
verify a full conversion of the epoxide. The degree of functionalization was determined by
1H NMR spectroscopy.
In general, the epoxyalkanes EAX with X = 8, 10, 12, 14 were added to the reaction solution
dissolved in methanol (p.a., 10 mL) and the epoxyalkanes EA16 and EA18 were added to the
reaction solution dissolved in THF (p.a., 10 mL). The reaction solutions were stirred for
different times until the reaction was complete and then dialysed against methanol or THF
followed by dialysis against dist. water, depending on the solubility of the educts. Reagents
and reaction times are listed in Table 3.
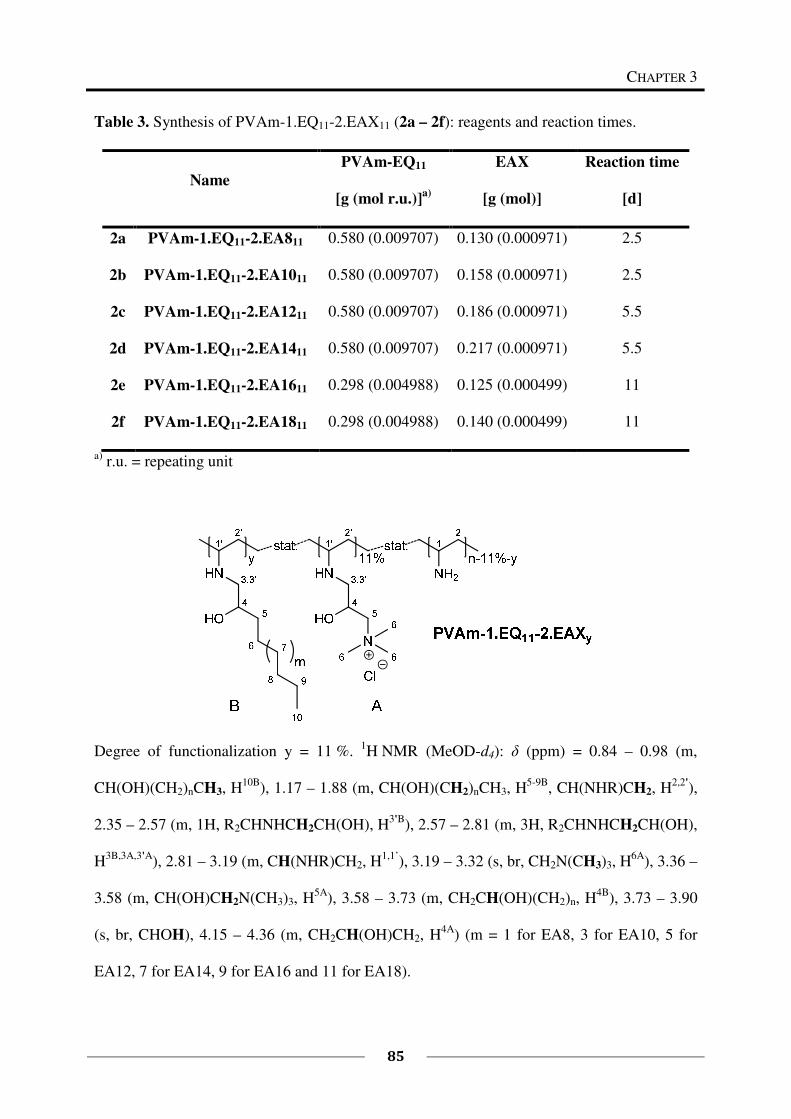
CHAPTER 3
85
Table 3. Synthesis of PVAm-1.EQ11-2.EAX11 (2a – 2f): reagents and reaction times.
Name
PVAm-EQ11
[g (mol r.u.)]a)
EAX
[g (mol)]
Reaction time
[d]
2a PVAm-1.EQ11-2.EA811 0.580 (0.009707) 0.130 (0.000971) 2.5
2b PVAm-1.EQ11-2.EA1011 0.580 (0.009707) 0.158 (0.000971) 2.5
2c PVAm-1.EQ11-2.EA1211 0.580 (0.009707) 0.186 (0.000971) 5.5
2d PVAm-1.EQ11-2.EA1411 0.580 (0.009707) 0.217 (0.000971) 5.5
2e PVAm-1.EQ11-2.EA1611 0.298 (0.004988) 0.125 (0.000499) 11
2f PVAm-1.EQ11-2.EA1811 0.298 (0.004988) 0.140 (0.000499) 11
a) r.u. = repeating unit
Degree of functionalization y = 11 %. 1H NMR (MeOD-d4): δ (ppm) = 0.84 – 0.98 (m,
CH(OH)(CH2)nCH3, H10B
), 1.17 – 1.88 (m, CH(OH)(CH2)nCH3, H5-9B
, CH(NHR)CH2, H2,2'
),
2.35 – 2.57 (m, 1H, R2CHNHCH2CH(OH), H3'B
), 2.57 – 2.81 (m, 3H, R2CHNHCH2CH(OH),
H3B,3A,3'A
), 2.81 – 3.19 (m, CH(NHR)CH2, H1,1’
), 3.19 – 3.32 (s, br, CH2N(CH3)3, H6A
), 3.36 –
3.58 (m, CH(OH)CH2N(CH3)3, H5A
), 3.58 – 3.73 (m, CH2CH(OH)(CH2)n, H4B
), 3.73 – 3.90
(s, br, CHOH), 4.15 – 4.36 (m, CH2CH(OH)CH2, H4A
) (m = 1 for EA8, 3 for EA10, 5 for
EA12, 7 for EA14, 9 for EA16 and 11 for EA18).
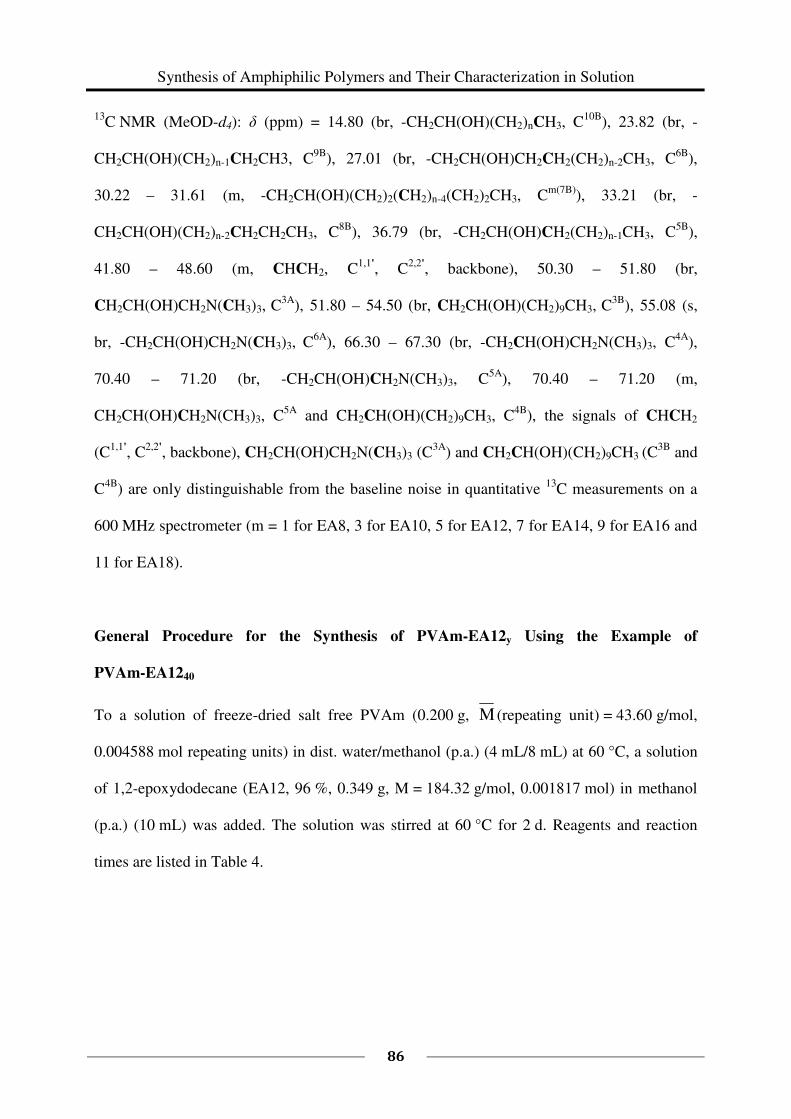
Synthesis of Amphiphilic Polymers and Their Characterization in Solution
86
13C NMR (MeOD-d4): δ (ppm) = 14.80 (br, -CH2CH(OH)(CH2)nCH3, C
10B), 23.82 (br, -
CH2CH(OH)(CH2)n-1CH2CH3, C9B
), 27.01 (br, -CH2CH(OH)CH2CH2(CH2)n-2CH3, C6B
),
30.22 – 31.61 (m, -CH2CH(OH)(CH2)2(CH2)n-4(CH2)2CH3, Cm(7B)
), 33.21 (br, -
CH2CH(OH)(CH2)n-2CH2CH2CH3, C8B
), 36.79 (br, -CH2CH(OH)CH2(CH2)n-1CH3, C5B
),
41.80 – 48.60 (m, CHCH2, C1,1'
, C2,2'
, backbone), 50.30 – 51.80 (br,
CH2CH(OH)CH2N(CH3)3, C3A
), 51.80 – 54.50 (br, CH2CH(OH)(CH2)9CH3, C3B
), 55.08 (s,
br, -CH2CH(OH)CH2N(CH3)3, C6A
), 66.30 – 67.30 (br, -CH2CH(OH)CH2N(CH3)3, C4A
),
70.40 – 71.20 (br, -CH2CH(OH)CH2N(CH3)3, C5A
), 70.40 – 71.20 (m,
CH2CH(OH)CH2N(CH3)3, C5A
and CH2CH(OH)(CH2)9CH3, C4B
), the signals of CHCH2
(C1,1'
, C2,2'
, backbone), CH2CH(OH)CH2N(CH3)3 (C3A
) and CH2CH(OH)(CH2)9CH3 (C3B
and
C4B
) are only distinguishable from the baseline noise in quantitative 13
C measurements on a
600 MHz spectrometer (m = 1 for EA8, 3 for EA10, 5 for EA12, 7 for EA14, 9 for EA16 and
11 for EA18).
General Procedure for the Synthesis of PVAm-EA12y Using the Example of
PVAm-EA1240
To a solution of freeze-dried salt free PVAm (0.200 g, M (repeating unit) = 43.60 g/mol,
0.004588 mol repeating units) in dist. water/methanol (p.a.) (4 mL/8 mL) at 60 °C, a solution
of 1,2-epoxydodecane (EA12, 96 %, 0.349 g, M = 184.32 g/mol, 0.001817 mol) in methanol
(p.a.) (10 mL) was added. The solution was stirred at 60 °C for 2 d. Reagents and reaction
times are listed in Table 4.
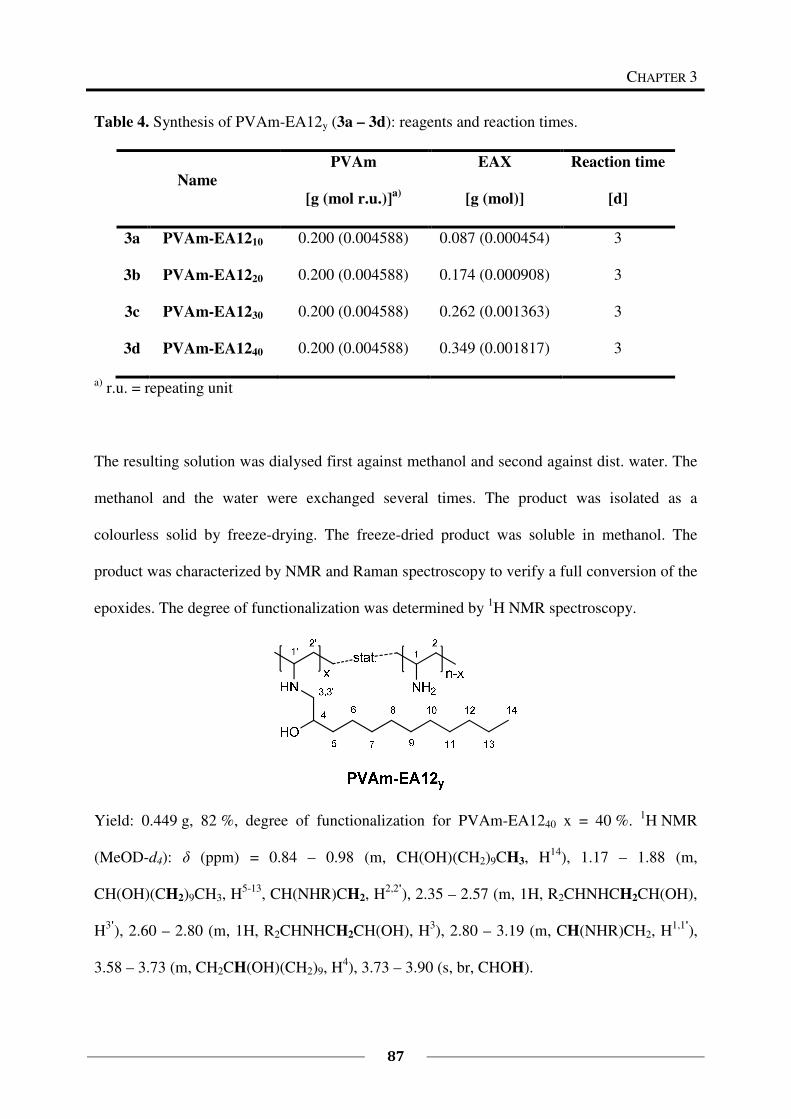
CHAPTER 3
87
Table 4. Synthesis of PVAm-EA12y (3a – 3d): reagents and reaction times.
Name
PVAm
[g (mol r.u.)]a)
EAX
[g (mol)]
Reaction time
[d]
3a PVAm-EA1210 0.200 (0.004588) 0.087 (0.000454) 3
3b PVAm-EA1220 0.200 (0.004588) 0.174 (0.000908) 3
3c PVAm-EA1230 0.200 (0.004588) 0.262 (0.001363) 3
3d PVAm-EA1240 0.200 (0.004588) 0.349 (0.001817) 3
a) r.u. = repeating unit
The resulting solution was dialysed first against methanol and second against dist. water. The
methanol and the water were exchanged several times. The product was isolated as a
colourless solid by freeze-drying. The freeze-dried product was soluble in methanol. The
product was characterized by NMR and Raman spectroscopy to verify a full conversion of the
epoxides. The degree of functionalization was determined by 1H NMR spectroscopy.
Yield: 0.449 g, 82 %, degree of functionalization for PVAm-EA1240 x = 40 %. 1H NMR
(MeOD-d4): δ (ppm) = 0.84 – 0.98 (m, CH(OH)(CH2)9CH3, H14
), 1.17 – 1.88 (m,
CH(OH)(CH2)9CH3, H5-13
, CH(NHR)CH2, H2,2'
), 2.35 – 2.57 (m, 1H, R2CHNHCH2CH(OH),
H3'
), 2.60 – 2.80 (m, 1H, R2CHNHCH2CH(OH), H3), 2.80 – 3.19 (m, CH(NHR)CH2, H
1,1'),
3.58 – 3.73 (m, CH2CH(OH)(CH2)9, H4), 3.73 – 3.90 (s, br, CHOH).
Synthesis of Amphiphilic Polymers and Their Characterization in Solution
88
13C NMR (MeOD-d4): δ (ppm) = 14.80 (br, (CH2)9CH3, C
14), 23.82 (br, (CH2)8CH2CH3, C
13),
27.01 (br, CH2CH(OH)CH2CH2(CH2)7CH3, C6), 30.22 – 31.61 (m, (CH2)2(CH2)5(CH2)2CH3,
C7-11
), 33.21 (br, (CH2)7CH2CH2CH3, C12
), 36.79 (br, CH2CH(OH)CH2(CH2)8CH3, C5), 41.80
– 48.60 (m, CHCH2, C1,1'
, C2,2'
, backbone), 51.80 – 54.50 (br, CH2CH(OH)(CH2)9CH3, C3),
70.40 – 71.20 (br, CH2CH(OH)(CH2)9CH3, C4), the signals of CHCH2 (C
1,1', C
2,2', backbone)
and CH2CH(OH)(CH2)9CH3 (C3 and C
4) are only distinguishable from the baseline noise in
quantitative 13
C measurements on a 600 MHz spectrometer.
3.3 Results and Discussion
3.3.1 PVAm Based Amphiphilic Polymers
Based on the grafting-to strategy described in Chapter 2, a series of poly(vinyl amine)s,
functionalized with the same concentration of cationic groups and hydrophobic groups with
different alkyl chain lengths, was prepared. The aim was to get insight into the structure-
solution properties relation of the developed polymers, depending on the length of the
introduced alkyl chains. The synthetic route includes two steps:
1) In the first step, PVAm (salt free) is functionalized with EQ yielding a polymer
functionalized with 11 mol% of cationic groups (PVAm-EQ11).
2) Afterwards PVAm-EQ11 is converted with epoxyalkanes of different chain lengths.
The epoxy groups react with the primary amine groups of the polymer to yield a series
of polymers functionalized with 11 mol% of EQ and the same molar concentration of
alkyl chains of different lengths. An overview of the used epoxyalkanes is given in
Scheme 1.
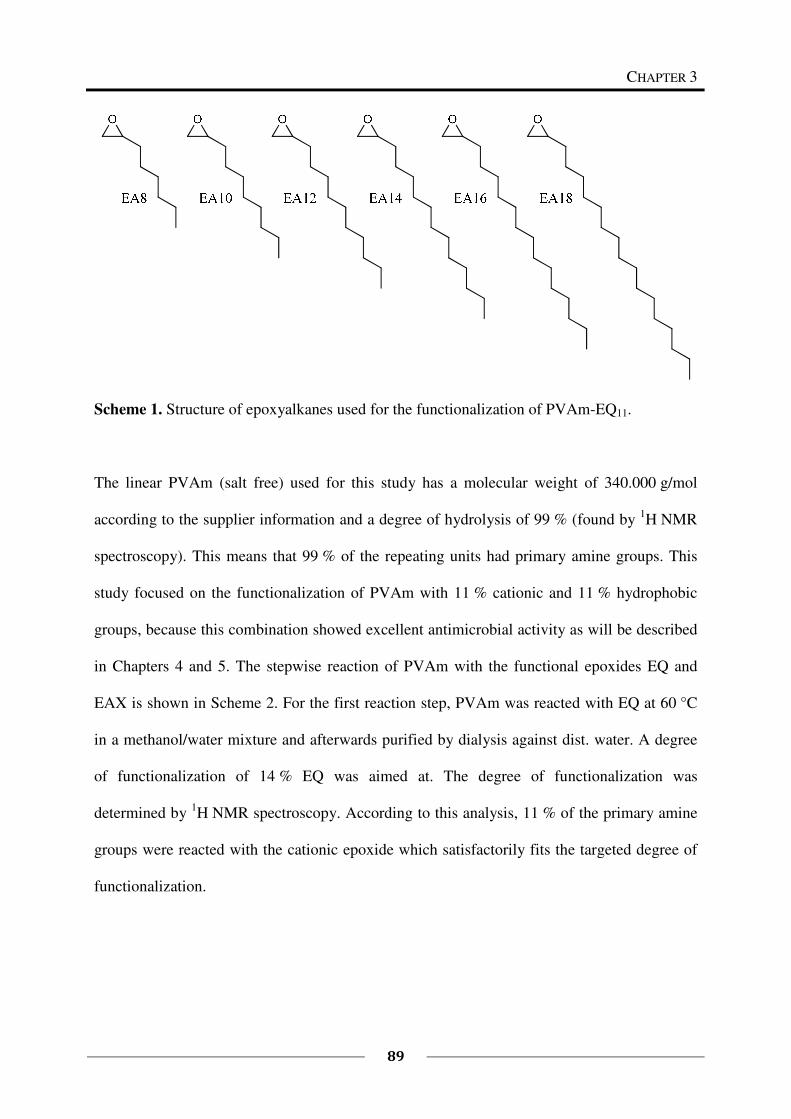
CHAPTER 3
89
Scheme 1. Structure of epoxyalkanes used for the functionalization of PVAm-EQ11.
The linear PVAm (salt free) used for this study has a molecular weight of 340.000 g/mol
according to the supplier information and a degree of hydrolysis of 99 % (found by 1H NMR
spectroscopy). This means that 99 % of the repeating units had primary amine groups. This
study focused on the functionalization of PVAm with 11 % cationic and 11 % hydrophobic
groups, because this combination showed excellent antimicrobial activity as will be described
in Chapters 4 and 5. The stepwise reaction of PVAm with the functional epoxides EQ and
EAX is shown in Scheme 2. For the first reaction step, PVAm was reacted with EQ at 60 °C
in a methanol/water mixture and afterwards purified by dialysis against dist. water. A degree
of functionalization of 14 % EQ was aimed at. The degree of functionalization was
determined by 1H NMR spectroscopy. According to this analysis, 11 % of the primary amine
groups were reacted with the cationic epoxide which satisfactorily fits the targeted degree of
functionalization.
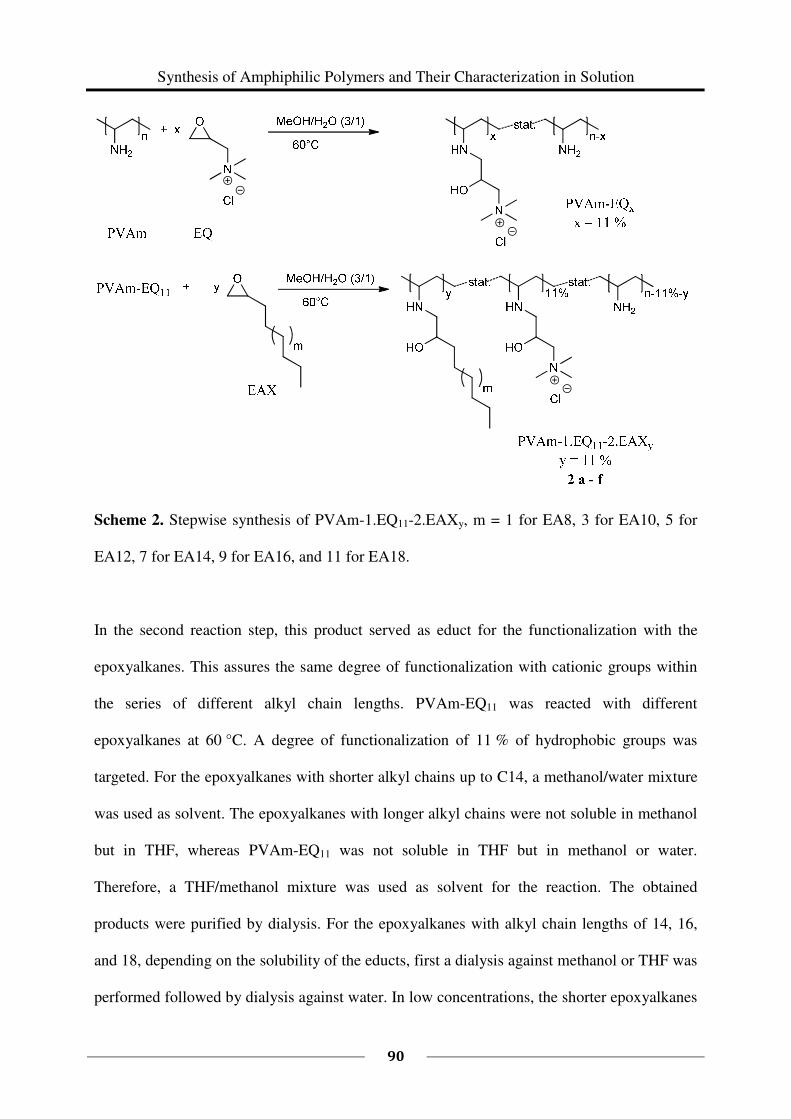
Synthesis of Amphiphilic Polymers and Their Characterization in Solution
90
Scheme 2. Stepwise synthesis of PVAm-1.EQ11-2.EAXy, m = 1 for EA8, 3 for EA10, 5 for
EA12, 7 for EA14, 9 for EA16, and 11 for EA18.
In the second reaction step, this product served as educt for the functionalization with the
epoxyalkanes. This assures the same degree of functionalization with cationic groups within
the series of different alkyl chain lengths. PVAm-EQ11 was reacted with different
epoxyalkanes at 60 °C. A degree of functionalization of 11 % of hydrophobic groups was
targeted. For the epoxyalkanes with shorter alkyl chains up to C14, a methanol/water mixture
was used as solvent. The epoxyalkanes with longer alkyl chains were not soluble in methanol
but in THF, whereas PVAm-EQ11 was not soluble in THF but in methanol or water.
Therefore, a THF/methanol mixture was used as solvent for the reaction. The obtained
products were purified by dialysis. For the epoxyalkanes with alkyl chain lengths of 14, 16,
and 18, depending on the solubility of the educts, first a dialysis against methanol or THF was
performed followed by dialysis against water. In low concentrations, the shorter epoxyalkanes
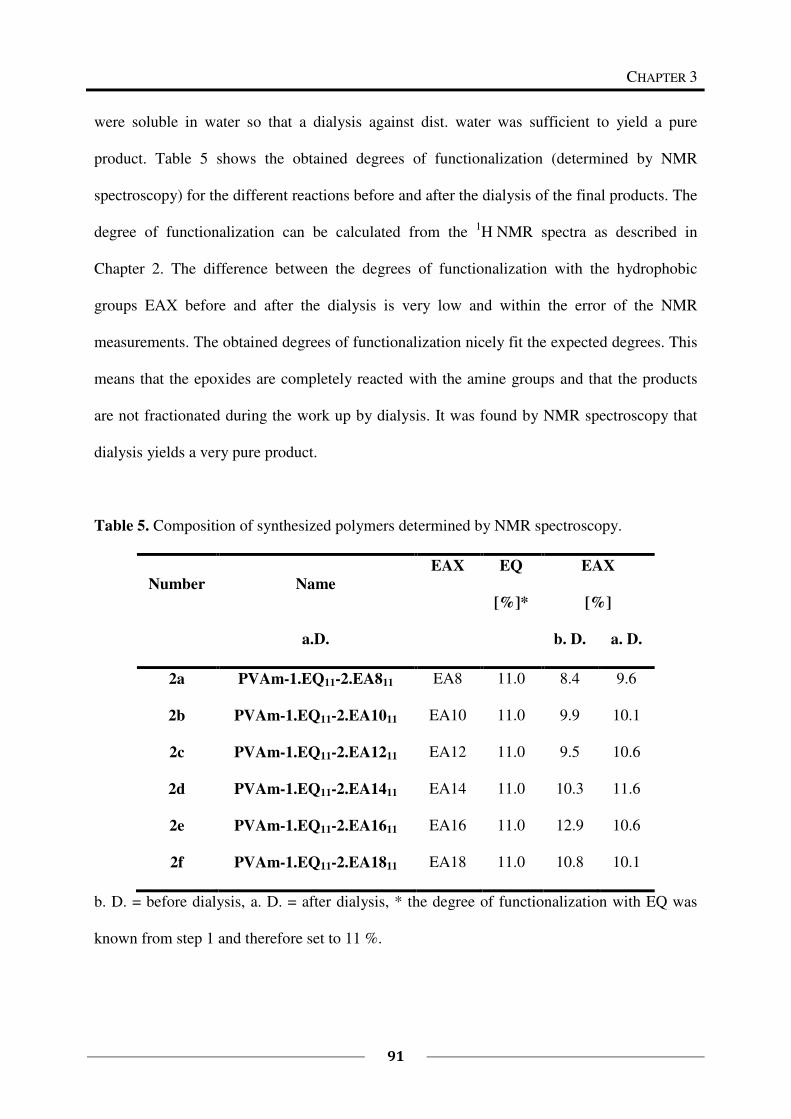
CHAPTER 3
91
were soluble in water so that a dialysis against dist. water was sufficient to yield a pure
product. Table 5 shows the obtained degrees of functionalization (determined by NMR
spectroscopy) for the different reactions before and after the dialysis of the final products. The
degree of functionalization can be calculated from the 1H NMR spectra as described in
Chapter 2. The difference between the degrees of functionalization with the hydrophobic
groups EAX before and after the dialysis is very low and within the error of the NMR
measurements. The obtained degrees of functionalization nicely fit the expected degrees. This
means that the epoxides are completely reacted with the amine groups and that the products
are not fractionated during the work up by dialysis. It was found by NMR spectroscopy that
dialysis yields a very pure product.
Table 5. Composition of synthesized polymers determined by NMR spectroscopy.
Number Name
EAX
EQ
[%]*
EAX
[%]
a.D. b. D. a. D.
2a PVAm-1.EQ11-2.EA811 EA8 11.0 8.4 9.6
2b PVAm-1.EQ11-2.EA1011 EA10 11.0 9.9 10.1
2c PVAm-1.EQ11-2.EA1211 EA12 11.0 9.5 10.6
2d PVAm-1.EQ11-2.EA1411 EA14 11.0 10.3 11.6
2e PVAm-1.EQ11-2.EA1611 EA16 11.0 12.9 10.6
2f PVAm-1.EQ11-2.EA1811 EA18 11.0 10.8 10.1
b. D. = before dialysis, a. D. = after dialysis, * the degree of functionalization with EQ was
known from step 1 and therefore set to 11 %.
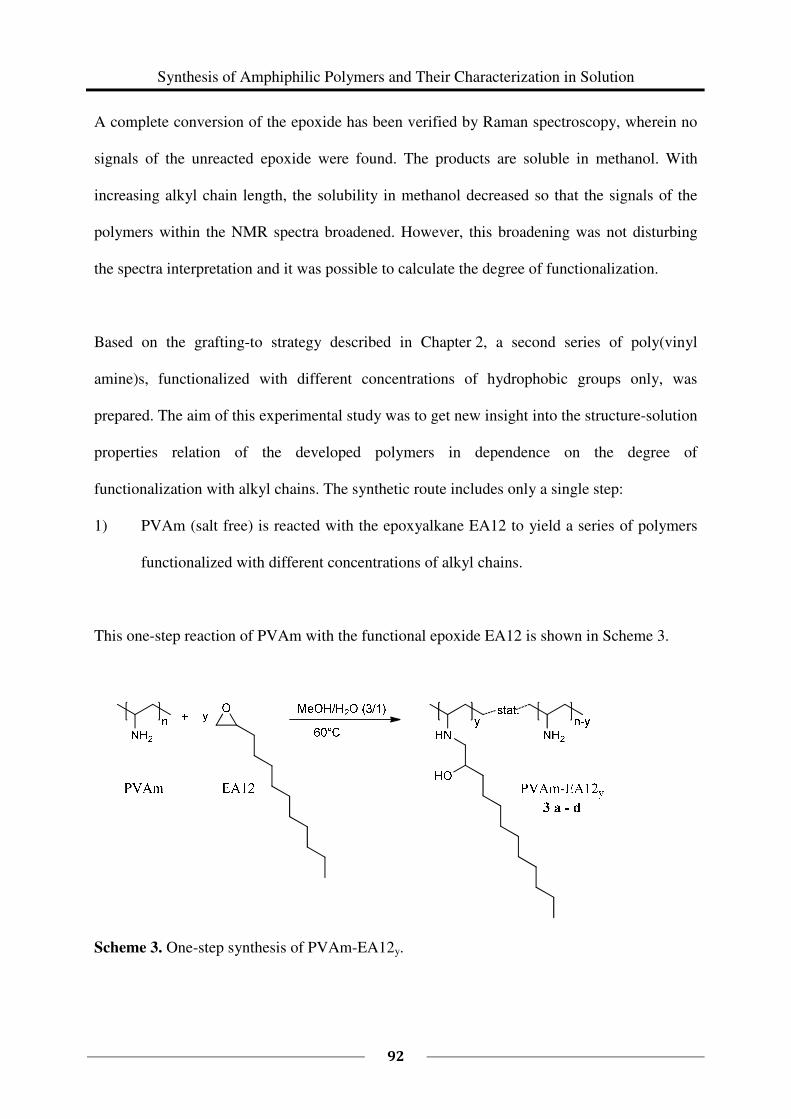
Synthesis of Amphiphilic Polymers and Their Characterization in Solution
92
A complete conversion of the epoxide has been verified by Raman spectroscopy, wherein no
signals of the unreacted epoxide were found. The products are soluble in methanol. With
increasing alkyl chain length, the solubility in methanol decreased so that the signals of the
polymers within the NMR spectra broadened. However, this broadening was not disturbing
the spectra interpretation and it was possible to calculate the degree of functionalization.
Based on the grafting-to strategy described in Chapter 2, a second series of poly(vinyl
amine)s, functionalized with different concentrations of hydrophobic groups only, was
prepared. The aim of this experimental study was to get new insight into the structure-solution
properties relation of the developed polymers in dependence on the degree of
functionalization with alkyl chains. The synthetic route includes only a single step:
1) PVAm (salt free) is reacted with the epoxyalkane EA12 to yield a series of polymers
functionalized with different concentrations of alkyl chains.
This one-step reaction of PVAm with the functional epoxide EA12 is shown in Scheme 3.
Scheme 3. One-step synthesis of PVAm-EA12y.
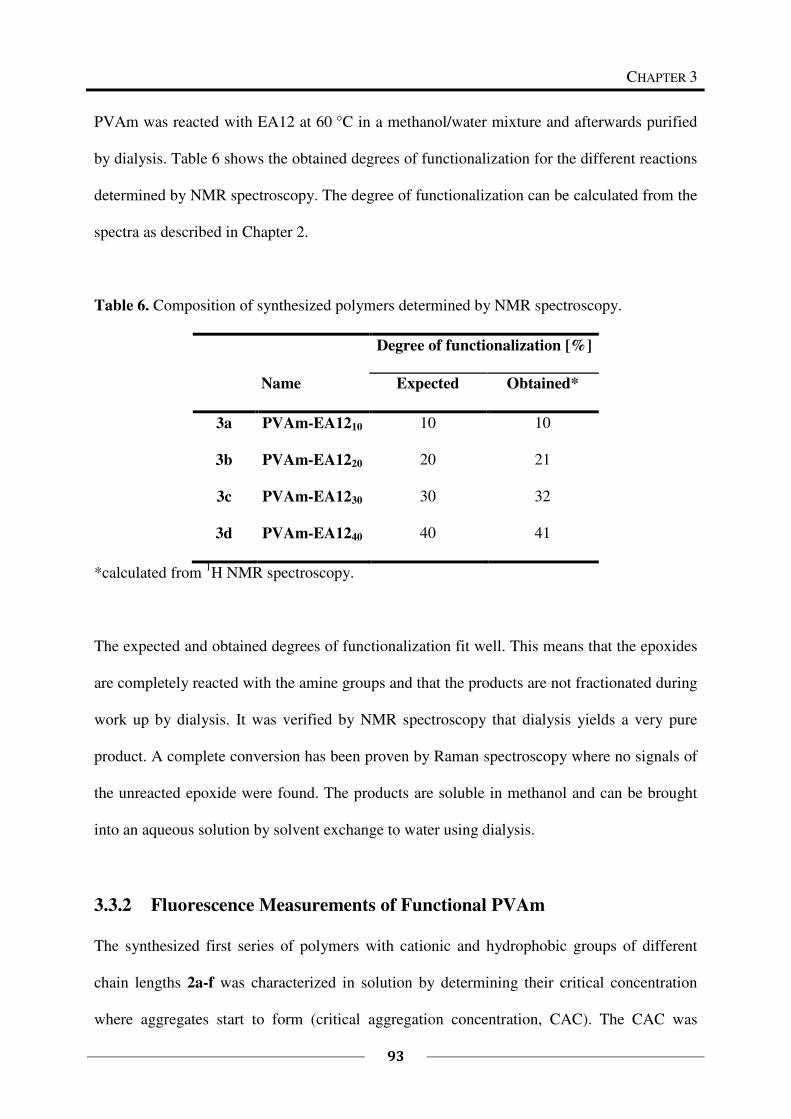
CHAPTER 3
93
PVAm was reacted with EA12 at 60 °C in a methanol/water mixture and afterwards purified
by dialysis. Table 6 shows the obtained degrees of functionalization for the different reactions
determined by NMR spectroscopy. The degree of functionalization can be calculated from the
spectra as described in Chapter 2.
Table 6. Composition of synthesized polymers determined by NMR spectroscopy.
Name
Degree of functionalization [%]
Expected Obtained*
3a PVAm-EA1210 10 10
3b PVAm-EA1220 20 21
3c PVAm-EA1230 30 32
3d PVAm-EA1240 40 41
*calculated from 1H NMR spectroscopy.
The expected and obtained degrees of functionalization fit well. This means that the epoxides
are completely reacted with the amine groups and that the products are not fractionated during
work up by dialysis. It was verified by NMR spectroscopy that dialysis yields a very pure
product. A complete conversion has been proven by Raman spectroscopy where no signals of
the unreacted epoxide were found. The products are soluble in methanol and can be brought
into an aqueous solution by solvent exchange to water using dialysis.
3.3.2 Fluorescence Measurements of Functional PVAm
The synthesized first series of polymers with cationic and hydrophobic groups of different
chain lengths 2a-f was characterized in solution by determining their critical concentration
where aggregates start to form (critical aggregation concentration, CAC). The CAC was
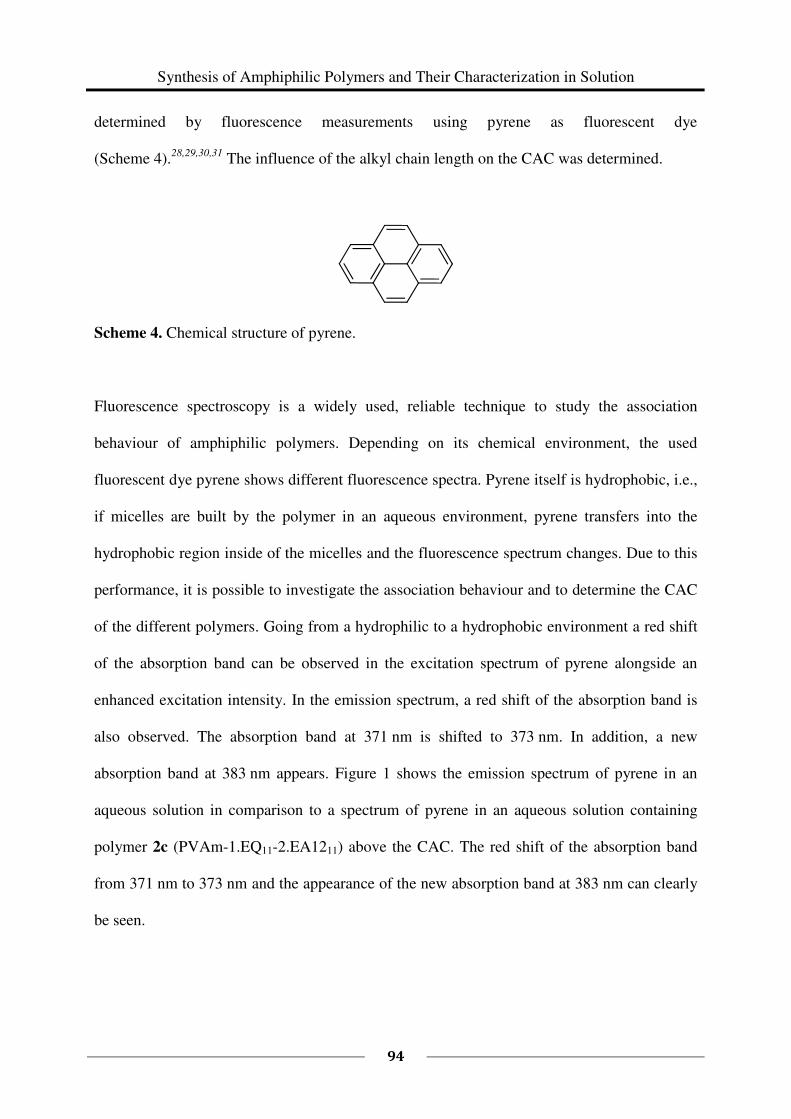
Synthesis of Amphiphilic Polymers and Their Characterization in Solution
94
determined by fluorescence measurements using pyrene as fluorescent dye
(Scheme 4).28,29,30,31
The influence of the alkyl chain length on the CAC was determined.
Scheme 4. Chemical structure of pyrene.
Fluorescence spectroscopy is a widely used, reliable technique to study the association
behaviour of amphiphilic polymers. Depending on its chemical environment, the used
fluorescent dye pyrene shows different fluorescence spectra. Pyrene itself is hydrophobic, i.e.,
if micelles are built by the polymer in an aqueous environment, pyrene transfers into the
hydrophobic region inside of the micelles and the fluorescence spectrum changes. Due to this
performance, it is possible to investigate the association behaviour and to determine the CAC
of the different polymers. Going from a hydrophilic to a hydrophobic environment a red shift
of the absorption band can be observed in the excitation spectrum of pyrene alongside an
enhanced excitation intensity. In the emission spectrum, a red shift of the absorption band is
also observed. The absorption band at 371 nm is shifted to 373 nm. In addition, a new
absorption band at 383 nm appears. Figure 1 shows the emission spectrum of pyrene in an
aqueous solution in comparison to a spectrum of pyrene in an aqueous solution containing
polymer 2c (PVAm-1.EQ11-2.EA1211) above the CAC. The red shift of the absorption band
from 371 nm to 373 nm and the appearance of the new absorption band at 383 nm can clearly
be seen.
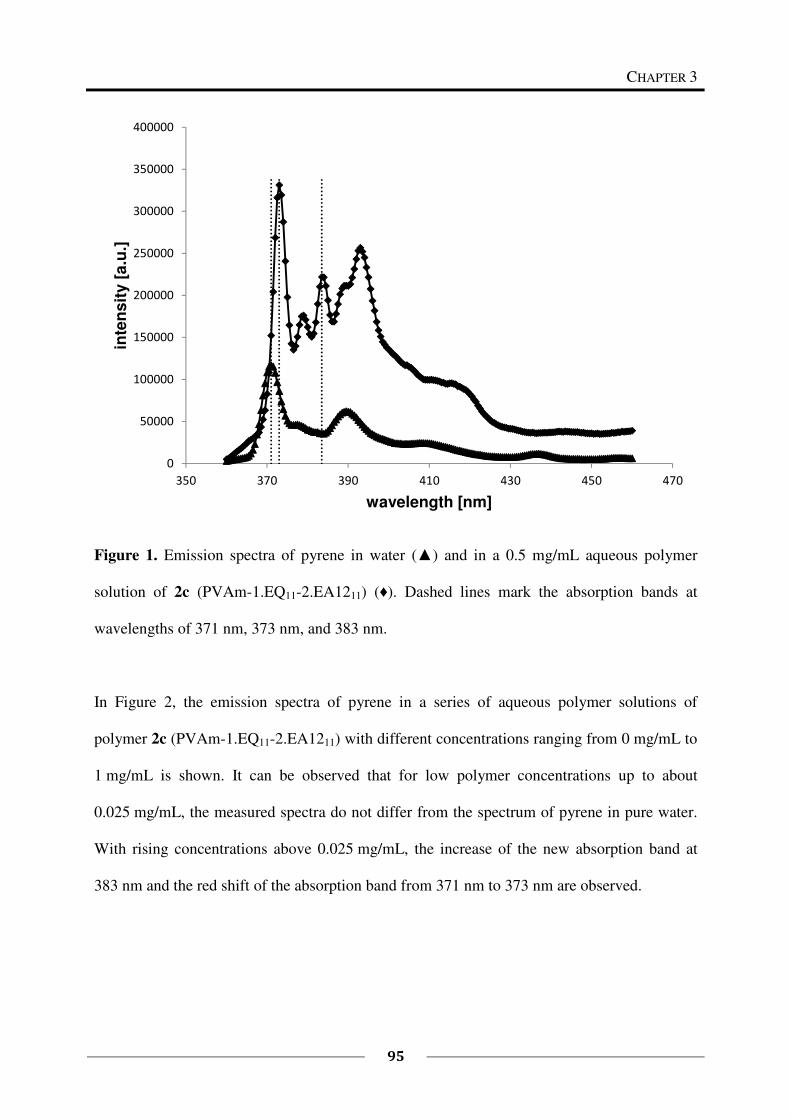
CHAPTER 3
95
Figure 1. Emission spectra of pyrene in water (▲) and in a 0.5 mg/mL aqueous polymer
solution of 2c (PVAm-1.EQ11-2.EA1211) (♦). Dashed lines mark the absorption bands at
wavelengths of 371 nm, 373 nm, and 383 nm.
In Figure 2, the emission spectra of pyrene in a series of aqueous polymer solutions of
polymer 2c (PVAm-1.EQ11-2.EA1211) with different concentrations ranging from 0 mg/mL to
1 mg/mL is shown. It can be observed that for low polymer concentrations up to about
0.025 mg/mL, the measured spectra do not differ from the spectrum of pyrene in pure water.
With rising concentrations above 0.025 mg/mL, the increase of the new absorption band at
383 nm and the red shift of the absorption band from 371 nm to 373 nm are observed.
0
50000
100000
150000
200000
250000
300000
350000
400000
350 370 390 410 430 450 470
inte
ns
ity [
a.u
.]
wavelength [nm]
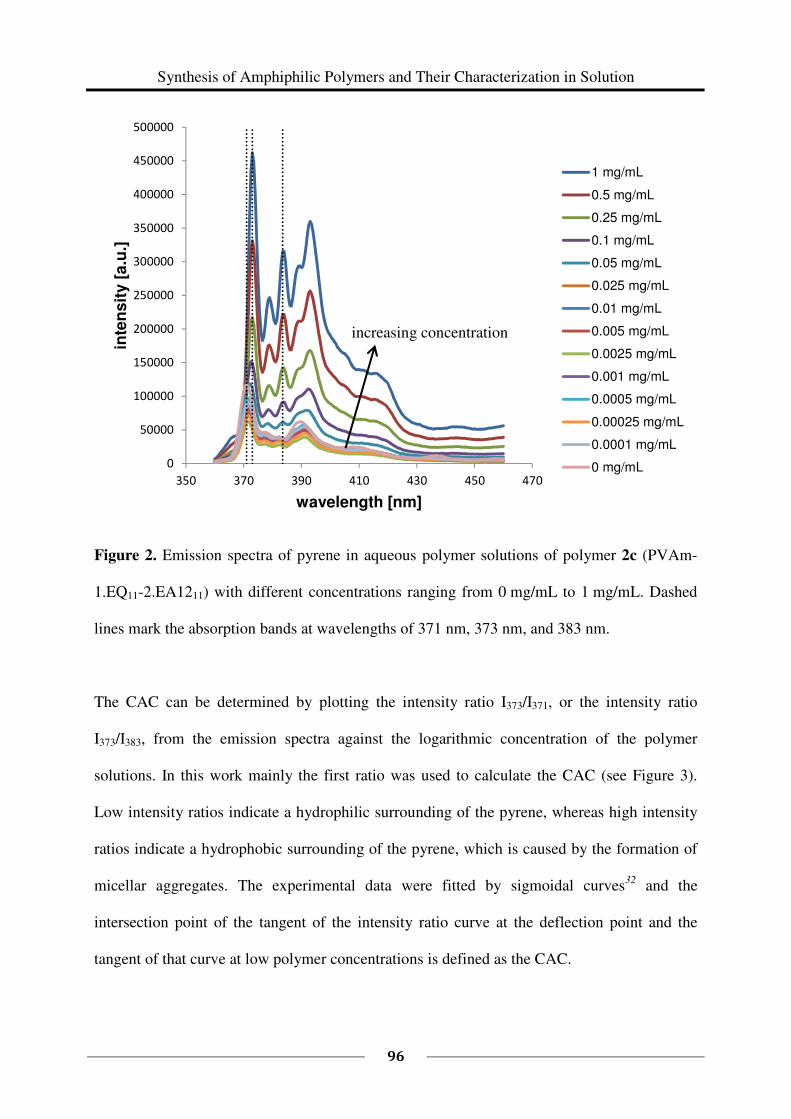
Synthesis of Amphiphilic Polymers and Their Characterization in Solution
96
Figure 2. Emission spectra of pyrene in aqueous polymer solutions of polymer 2c (PVAm-
1.EQ11-2.EA1211) with different concentrations ranging from 0 mg/mL to 1 mg/mL. Dashed
lines mark the absorption bands at wavelengths of 371 nm, 373 nm, and 383 nm.
The CAC can be determined by plotting the intensity ratio I373/I371, or the intensity ratio
I373/I383, from the emission spectra against the logarithmic concentration of the polymer
solutions. In this work mainly the first ratio was used to calculate the CAC (see Figure 3).
Low intensity ratios indicate a hydrophilic surrounding of the pyrene, whereas high intensity
ratios indicate a hydrophobic surrounding of the pyrene, which is caused by the formation of
micellar aggregates. The experimental data were fitted by sigmoidal curves32
and the
intersection point of the tangent of the intensity ratio curve at the deflection point and the
tangent of that curve at low polymer concentrations is defined as the CAC.
0
50000
100000
150000
200000
250000
300000
350000
400000
450000
500000
350 370 390 410 430 450 470
inte
ns
ity [
a.u
.]
wavelength [nm]
1 mg/mL
0.5 mg/mL
0.25 mg/mL
0.1 mg/mL
0.05 mg/mL
0.025 mg/mL
0.01 mg/mL
0.005 mg/mL
0.0025 mg/mL
0.001 mg/mL
0.0005 mg/mL
0.00025 mg/mL
0.0001 mg/mL
0 mg/mL
increasing concentration
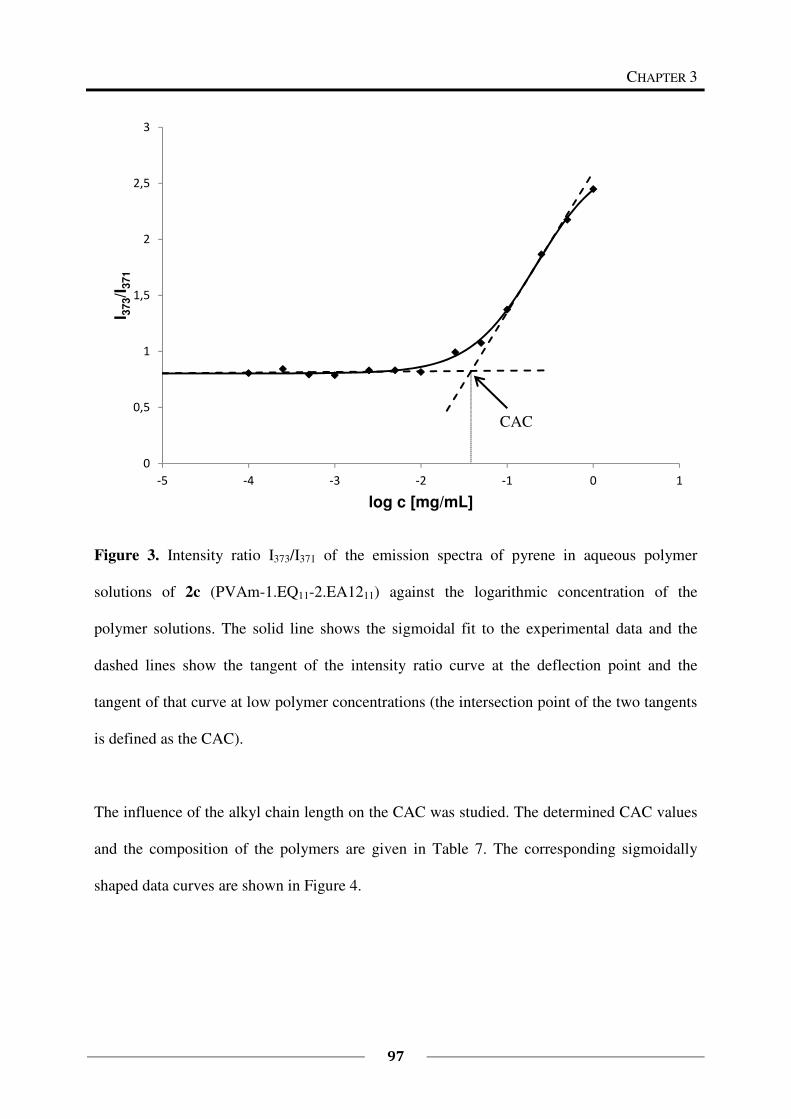
CHAPTER 3
97
Figure 3. Intensity ratio I373/I371 of the emission spectra of pyrene in aqueous polymer
solutions of 2c (PVAm-1.EQ11-2.EA1211) against the logarithmic concentration of the
polymer solutions. The solid line shows the sigmoidal fit to the experimental data and the
dashed lines show the tangent of the intensity ratio curve at the deflection point and the
tangent of that curve at low polymer concentrations (the intersection point of the two tangents
is defined as the CAC).
The influence of the alkyl chain length on the CAC was studied. The determined CAC values
and the composition of the polymers are given in Table 7. The corresponding sigmoidally
shaped data curves are shown in Figure 4.
0
0,5
1
1,5
2
2,5
3
-5 -4 -3 -2 -1 0 1
I 373/I
371
log c [mg/mL]
CAC
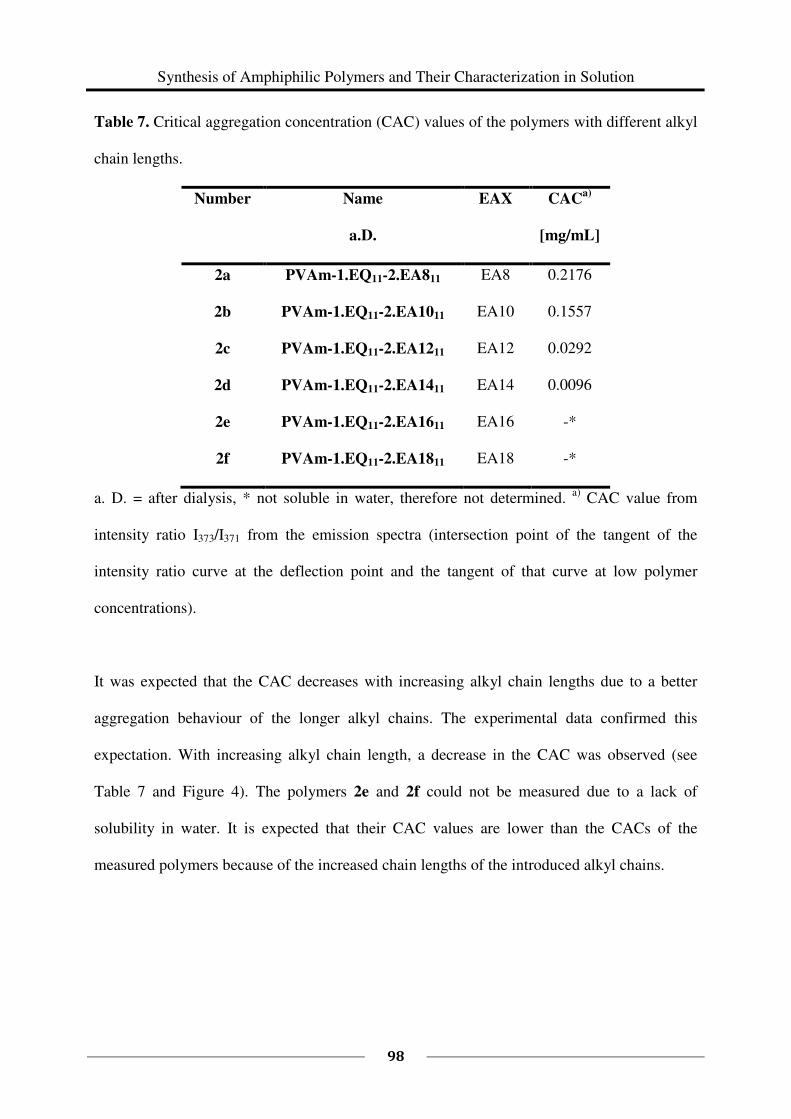
Synthesis of Amphiphilic Polymers and Their Characterization in Solution
98
Table 7. Critical aggregation concentration (CAC) values of the polymers with different alkyl
chain lengths.
Number Name EAX CACa)
a.D. [mg/mL]
2a PVAm-1.EQ11-2.EA811 EA8 0.2176
2b PVAm-1.EQ11-2.EA1011 EA10 0.1557
2c PVAm-1.EQ11-2.EA1211 EA12 0.0292
2d PVAm-1.EQ11-2.EA1411 EA14 0.0096
2e PVAm-1.EQ11-2.EA1611 EA16 -*
2f PVAm-1.EQ11-2.EA1811 EA18 -*
a. D. = after dialysis, * not soluble in water, therefore not determined. a)
CAC value from
intensity ratio I373/I371 from the emission spectra (intersection point of the tangent of the
intensity ratio curve at the deflection point and the tangent of that curve at low polymer
concentrations).
It was expected that the CAC decreases with increasing alkyl chain lengths due to a better
aggregation behaviour of the longer alkyl chains. The experimental data confirmed this
expectation. With increasing alkyl chain length, a decrease in the CAC was observed (see
Table 7 and Figure 4). The polymers 2e and 2f could not be measured due to a lack of
solubility in water. It is expected that their CAC values are lower than the CACs of the
measured polymers because of the increased chain lengths of the introduced alkyl chains.
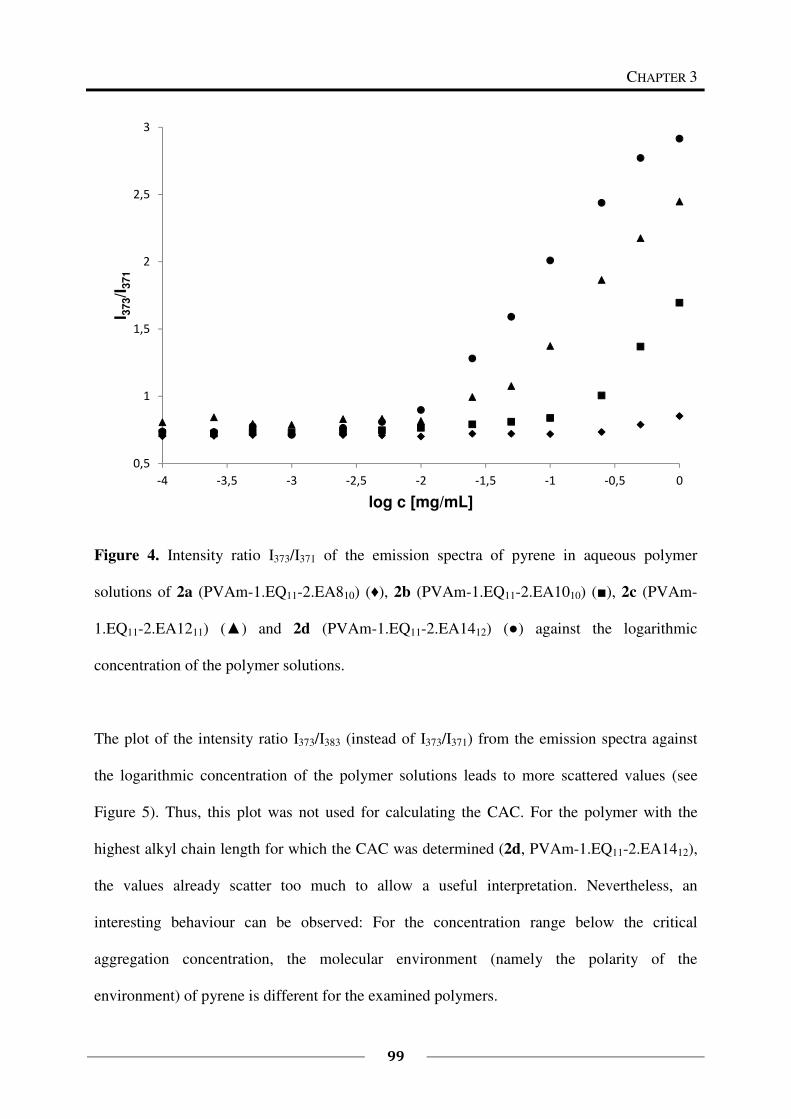
CHAPTER 3
99
Figure 4. Intensity ratio I373/I371 of the emission spectra of pyrene in aqueous polymer
solutions of 2a (PVAm-1.EQ11-2.EA810) (♦), 2b (PVAm-1.EQ11-2.EA1010) (■), 2c (PVAm-
1.EQ11-2.EA1211) (▲) and 2d (PVAm-1.EQ11-2.EA1412) (●) against the logarithmic
concentration of the polymer solutions.
The plot of the intensity ratio I373/I383 (instead of I373/I371) from the emission spectra against
the logarithmic concentration of the polymer solutions leads to more scattered values (see
Figure 5). Thus, this plot was not used for calculating the CAC. For the polymer with the
highest alkyl chain length for which the CAC was determined (2d, PVAm-1.EQ11-2.EA1412),
the values already scatter too much to allow a useful interpretation. Nevertheless, an
interesting behaviour can be observed: For the concentration range below the critical
aggregation concentration, the molecular environment (namely the polarity of the
environment) of pyrene is different for the examined polymers.
0,5
1
1,5
2
2,5
3
-4 -3,5 -3 -2,5 -2 -1,5 -1 -0,5 0
I 373/I
371
log c [mg/mL]
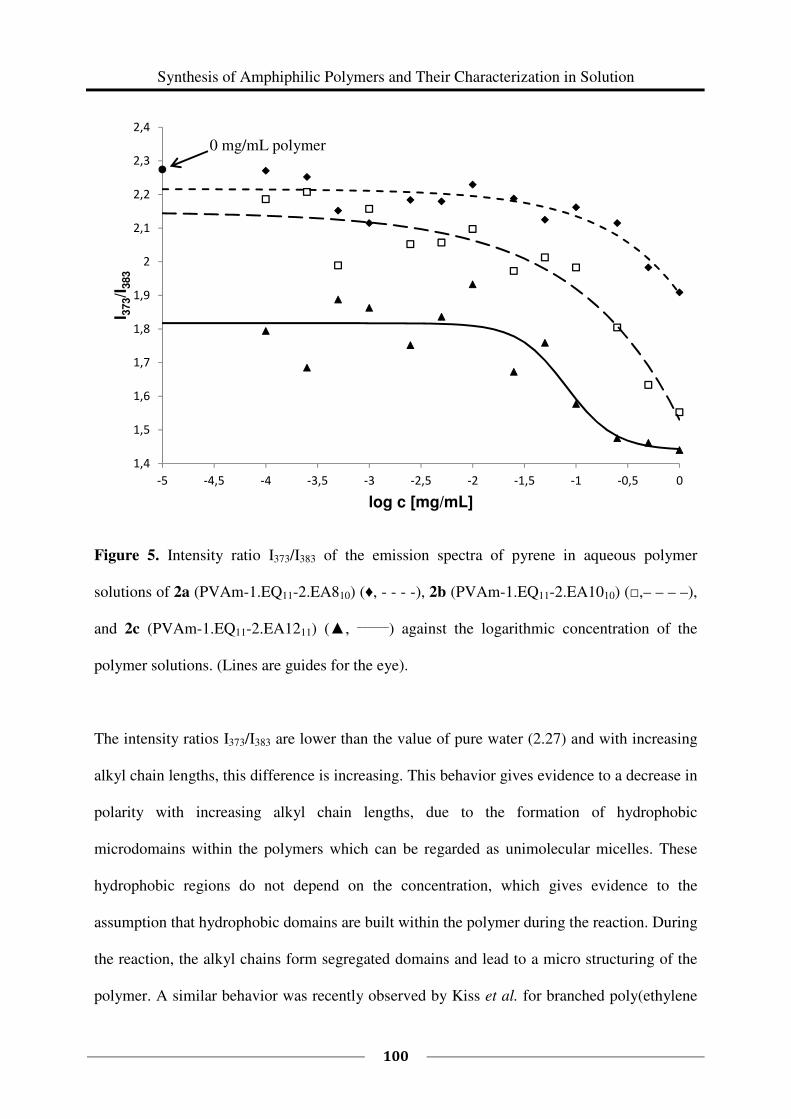
Synthesis of Amphiphilic Polymers and Their Characterization in Solution
100
Figure 5. Intensity ratio I373/I383 of the emission spectra of pyrene in aqueous polymer
solutions of 2a (PVAm-1.EQ11-2.EA810) (♦, - - - -), 2b (PVAm-1.EQ11-2.EA1010) (□,– – – –),
and 2c (PVAm-1.EQ11-2.EA1211) (▲, ______
) against the logarithmic concentration of the
polymer solutions. (Lines are guides for the eye).
The intensity ratios I373/I383 are lower than the value of pure water (2.27) and with increasing
alkyl chain lengths, this difference is increasing. This behavior gives evidence to a decrease in
polarity with increasing alkyl chain lengths, due to the formation of hydrophobic
microdomains within the polymers which can be regarded as unimolecular micelles. These
hydrophobic regions do not depend on the concentration, which gives evidence to the
assumption that hydrophobic domains are built within the polymer during the reaction. During
the reaction, the alkyl chains form segregated domains and lead to a micro structuring of the
polymer. A similar behavior was recently observed by Kiss et al. for branched poly(ethylene
1,4
1,5
1,6
1,7
1,8
1,9
2
2,1
2,2
2,3
2,4
-5 -4,5 -4 -3,5 -3 -2,5 -2 -1,5 -1 -0,5 0
I 373/I
383
log c [mg/mL]
0 mg/mL polymer
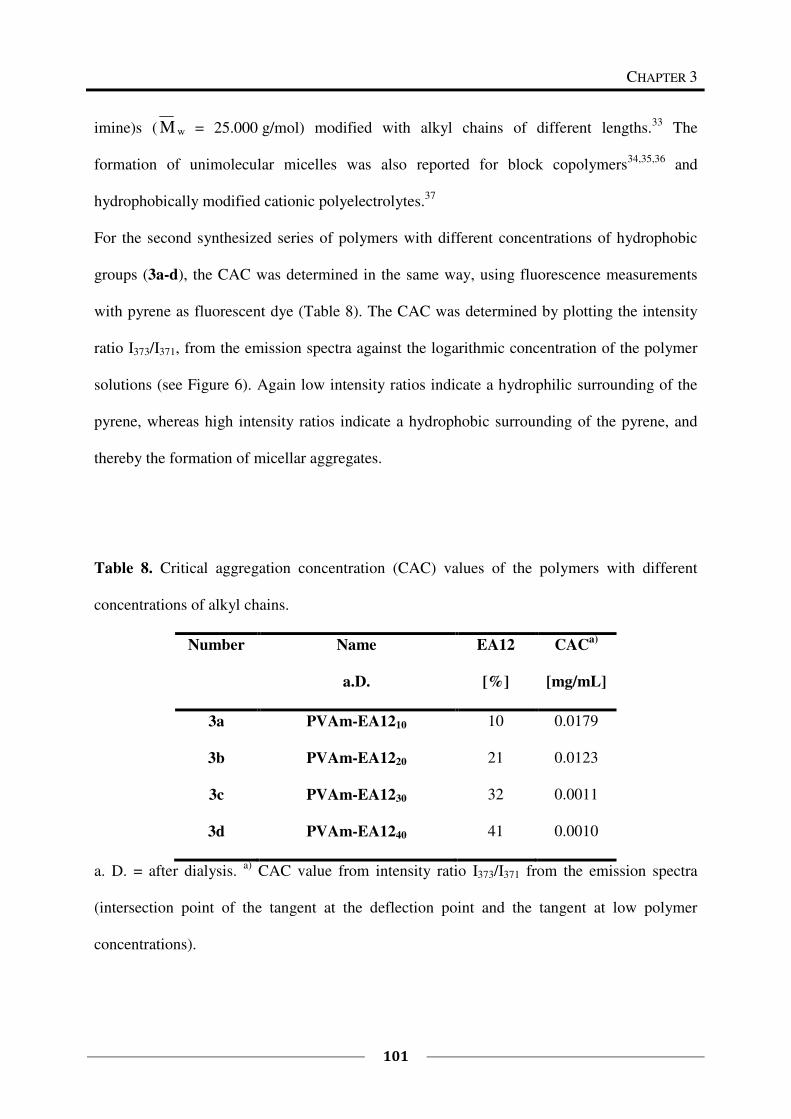
CHAPTER 3
101
imine)s ( M w = 25.000 g/mol) modified with alkyl chains of different lengths.33
The
formation of unimolecular micelles was also reported for block copolymers34,35,36
and
hydrophobically modified cationic polyelectrolytes.37
For the second synthesized series of polymers with different concentrations of hydrophobic
groups (3a-d), the CAC was determined in the same way, using fluorescence measurements
with pyrene as fluorescent dye (Table 8). The CAC was determined by plotting the intensity
ratio I373/I371, from the emission spectra against the logarithmic concentration of the polymer
solutions (see Figure 6). Again low intensity ratios indicate a hydrophilic surrounding of the
pyrene, whereas high intensity ratios indicate a hydrophobic surrounding of the pyrene, and
thereby the formation of micellar aggregates.
Table 8. Critical aggregation concentration (CAC) values of the polymers with different
concentrations of alkyl chains.
Number Name EA12 CACa)
a.D. [%] [mg/mL]
3a PVAm-EA1210 10 0.0179
3b PVAm-EA1220 21 0.0123
3c PVAm-EA1230 32 0.0011
3d PVAm-EA1240 41 0.0010
a. D. = after dialysis. a)
CAC value from intensity ratio I373/I371 from the emission spectra
(intersection point of the tangent at the deflection point and the tangent at low polymer
concentrations).
Synthesis of Amphiphilic Polymers and Their Characterization in Solution
102
The experimental data were fitted by sigmoidal curves32
and the intersection point of the
tangent of the intensity ratio curve at the deflection point and the tangent of that curve at low
polymer concentrations is defined as the CAC. With this second series of polymers the
influence of the concentration of hydrophobic groups within the polymer on the CAC was
investigated. The data curves (Figure 6), which are shifting to lower polymer concentrations
for higher alkyl chain concentrations, and the resulting CAC values show the decrease of the
CAC with increasing alkyl chain concentration. It is interesting to see in Figure 6 that
polymer 3a with 10 % alkyl chains and 3b with 21 % alkyl chains, respectively, possess
almost the same CAC values. The CAC of polymers 3c, which contains 32 % alkyl chains is
more than 10 times lower than the CAC values of polymer 3a and 3b and shares the same
CAC value with polymer 3d (41 % of alkyl chains). This means that the increase of the
concentration of alkyl chains from 10 % to 21 %, or from 32 % to 41 %, respectively, has no
influence on the ability of the polymer to form micelles. In contrast, the increase from 21 % to
32 % alkyl chains seems to be a crucial step for increasing the ability of the polymer to form
micelles.
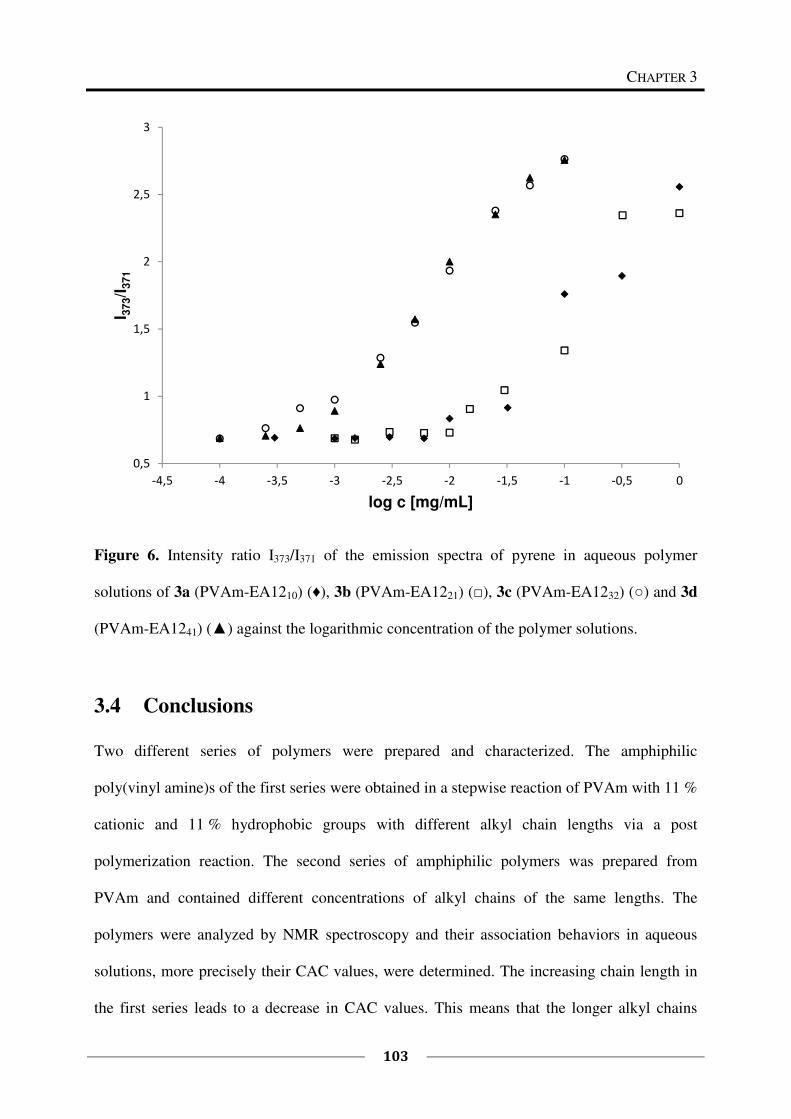
CHAPTER 3
103
Figure 6. Intensity ratio I373/I371 of the emission spectra of pyrene in aqueous polymer
solutions of 3a (PVAm-EA1210) (♦), 3b (PVAm-EA1221) (□), 3c (PVAm-EA1232) (○) and 3d
(PVAm-EA1241) (▲) against the logarithmic concentration of the polymer solutions.
3.4 Conclusions
Two different series of polymers were prepared and characterized. The amphiphilic
poly(vinyl amine)s of the first series were obtained in a stepwise reaction of PVAm with 11 %
cationic and 11 % hydrophobic groups with different alkyl chain lengths via a post
polymerization reaction. The second series of amphiphilic polymers was prepared from
PVAm and contained different concentrations of alkyl chains of the same lengths. The
polymers were analyzed by NMR spectroscopy and their association behaviors in aqueous
solutions, more precisely their CAC values, were determined. The increasing chain length in
the first series leads to a decrease in CAC values. This means that the longer alkyl chains
0,5
1
1,5
2
2,5
3
-4,5 -4 -3,5 -3 -2,5 -2 -1,5 -1 -0,5 0
I 373/I
371
log c [mg/mL]
Synthesis of Amphiphilic Polymers and Their Characterization in Solution
104
build more rapidly and more easily bigger hydrophobic domains within the polymer than the
shorter alkyl chains. It was additionally found that at concentrations below the CAC,
unimolecular micelles are built and an increasing alkyl chain length leads to larger (and thus
eventually more stable) unimolecular micelles. In the second series of polymers, no linear but
a stepwise decrease of the CAC value with increasing concentration of alkyl chains was
found. Raising the concentration of alkyl chains from 21 % to 32 % decreases the CAC value
by a factor larger than 10. The other changes in alkyl chain concentration only have a
marginal influence on the CAC. This indicates that the increase from 21 % to 32 % alkyl
chains seems to be a crucial step to increase the ability of the polymer to form micelles. This
is expected to be different for varying chain lengths.
3.5 Literature
1 Technisches Merkblatt N-Vinylformamid, Mitsubishi Kasai, Japan, 1997.
2 R. K. Pinschmidt Jr., D. J. Sagl, Polymeric Materials Encyclopedia; Ed.: Salamone, J. C.; CRC Press New
York 1996, 7095 ff.
3 L. Gu, S. Zhu, A. N. Hrymak, R. H. Pelton, Polymer 2001, 42, 3077–3086.
4 L. Gu, S. Zhu, A. N. Hrymak, J. Appl. Polym. Sci. 2002, 86, 3412–3419.
5 M. Kröner, J. Dupuis, M. Winter, J. Prakt. Chem. 2000, 342, 115–131.
6 Produkt-Informationsbroschüre zu Lupaminen®, BASF AG, Ludwigshafen, 2000.
7 B. Martel, A. Pollet, M. Morcellet, Macromolecules 1994, 27, 5258–5262.
8 F. Brunnmueller, R. Schneider, M. Kroener, H. Mueller, F. Linhart, H. Burkert, K.-H. Beyer, Patent 1982,
EP 071050.
9 F. Linhart and W. Auhorn, Das Papier 1992, 10A, V38–V45.
10 U. Riebeling, A. De Clercq, A. Stange, N. Sendhoff, C. Nilz, M. Kröner, Patent 1990, EP 553135.
11 F. Wang, H. Tanaka, J. Appl. Polym. Sci. 2000, 78, 1805–1810.
12 S. Kobayashi, K. D. Suh and Y. Shirokura, Macromolecules 1989, 22, 2363–2366.
CHAPTER 3
105
13 R. K Pinschmidt Jr, B. R. Vijayendran, Ta.-W. Lai, Patent 1992, US 5085787.
14 R. K. Pinschmidt, Patent 1990, US 4931194.
15 P. Shu, Patent 1992, US 5134176.
16 S. Stinson, Chem. Eng. News 1993, 71 (36), 32.
17 D. Monech, H. Hartmann, E. Freudenberg, A. Stange, Patent 1993, US 5262008; W. Auhorn, F. Linhart, P.
Lorencak, M. Kroener, N. Sendhoff, W. Deninger, H. Hartmann, Patent 1992, US 5145559; S. Pfohl, M.
Kroener, H. Hartmann, W. Denzinger, Patents 1989, US 4978427, US 4880497 and 1988, US 4774285.
18 H. Burkert, F. Brunnmueller, K. Beyer, M. Kroener, H. Mueller, Patent 1984, US 4444667.
19 D. Monech, H. Hartmann, K. Buechner, Patent 1993, US 5225088.
20 R.K. Pinschmidt Jr., T. Lai, Patent 1990, US 4931194.
21 T. Beihoffer, M. Mitchell, L. T. Truzpek, J. W. Darlington, M. Anderson, Patent 2001, US 6194631.
22 T. Beihoffer, M. Mitchell, J. W. Darlington, M. Anderson, Patent 1997, WO 99/25745.
23 T. Beihoffer, M. Mitchell, Patent 2000, US 6159591.
24 T. Beihoffer, M. Mitchell, Patent 2001, US 6235965.
25 D. Dawson, R. D. Gless, R. E. Wingard Jr., J. Am. Chem. Soc. 1976, 98, 5996–6000.
26 K. Hofmann, S. Brumm, C. Mende, K. Nagel, A. Seifert, I. Roth, D. Schaarschmidt, H. Lang, S. Spange, New
J. Chem. 2012, 36, 1655–1664
27 Y. Qui, T. Zang, M. Ruegsegger, R. E. Marchant, Macromolecules 1998, 31, 165–171.
28 M. Wilhelm, C-L. Zhao, Y. Wang, R. Xu, M. A. Winnik, Macromolecules 1991, 24, 1033-1040
29 K. Kalyanasundaram, Langmuir 1988, 4, 942.
30 K. Kalyanasundaram, J. K. Thomas, J. Am. Chem. Soc. 1977, 99, 2039-2044.
31 J. Z. Du, D. P. Chen, Y. C. Wang, C. S. Xiao, Y. L. Lu, J. Wang, G. Z. Zhang, Biomacromolecules 2006, 7,
1898-1904.
32 J. Aguiar, P. Carpena, J.A. Molina-Bolívar, C. Carnero Ruiz, Journal of Colloid and Interface Science 2003,
258, 116–122.
33 É. Kiss, E. T. Heine, K. Hill, Y.-C. He, N. Keusgen, C. B. Pénzes, D. Schnöller, G. Gyulai, A. Mendrek, H.
Keul, M. Moeller, Macromol. Biosci. 2012, 12 (9), 1181–1189.
34 F. M. Winnik, S. T. A. Regismond, Colloids Surf. A 1996, 118, 1.
Synthesis of Amphiphilic Polymers and Their Characterization in Solution
106
35 K. Nakashima, P. Bahadur, Adv. Colloid Interface Sci. 2006, 123-126, 75.
36 M. Burkhardt, N. Martinez-Castro, S. Tea, M. Drechsler, I. Babin, I. Grishagin, R. Schweins, D. V.
Pergushov, M. Gradzielski, A. B. Zezin, A. H. E. Müller, Langmuir 2007, 23, 12864.
37 P. Deo, N. Deo, P. Somasundaran, S. Jockusch, N. J. Turro, J. Phys. Chem. B 2005, 109, 20714.
CHAPTER 4
107
AMPHIPHILIC POLYMERS WITH ANTIMICROBIAL
ACTIVITY
4.1 Introduction
Multi-resistant bacteria and increasing antibiotic resistances are nowadays a growing problem
especially in the medical sector.1,2,3,4,5,6,7,8
The demand for new antimicrobial systems is
rising.9,10
Polymers with antimicrobial activity which can be used for molecular surface
engineering are therefore of enlarging interest. They can be used as high molecular weight
substances for functional coatings on surfaces and thereby help to overcome the problem of
excessive bacterial growth and spreading which would result in increased health risks.
Besides the modification of the surface, modifying the whole bulk material to obtain an
antimicrobial effect is possible, but such an approach shows several disadvantages. By such a
modification, the bulk properties like hardness, density, strength of the material, elasticity,
stiffness, and resistance to corrosion to name only some, can be changed significantly. In
addition, an antimicrobial effect inside the material is not needed and noticeably rises the
price of the material. Functional coatings have the advantage that valuable bulk properties are
maintained while an antimicrobial barrier to the environment is built at the same time.
Antimicrobial coatings can be very important to avoid bacterial contaminations.11
Such
contaminations can cause severe risks for the human health, especially in the fields of
fostering and sick care, for example for textiles for hospitals and nursing homes, bandages
and ortheses or for non-regularly accessible textile materials like stationary mounted felts,
filters, insulations or door linings, or for poorly reachable surfaces in the household.
Amphiphilic Polymers with Antimicrobial Activity
108
A drawback of common antimicrobial coatings is that these coatings often release their active
component (like triclosan or Ag+ ions) into the environment.
12 This causes two (negative)
effects: 1. the antimicrobial effect is lost over time and 2. the long term effect on the
environment – like, e.g., accumulation of the active component and its effect on the flora and
fauna, as well as the development of microbial resistances due to too low concentrations of
the active agent – is often not known. In comparison to release systems, non-release systems
have the advantage that they are not consumed over time and therefore don’t need to be
renewed. Furthermore, if the active compound is not released, it can only be active in the
desired region and not accumulate in the environment. Thus it is desirable to develop non-
leaching coatings. In this context, antimicrobial polymers play an important role because they
can be immobilized on surfaces without the risk to release low molecular weight compounds.
According to Klibanov, another advantage of antimicrobial polymers, in contrast to
antibiotics, is that polymers render the development of resistances unlikely due to their mode
of action.13
Furthermore, antimicrobial polymers possess, concerning to Tashiro, a higher
efficiency against bacteria in comparison to their monomeric equivalents.14
Poly(vinyl amine) (PVAm) has a linear structure with up to 100 % primary amine groups, one
per repeating unit. It is a weak cationic polyelectrolyte and possesses the highest actually
known charge density for a technical polymer. The high number of primary amine groups in
PVAm opens the door to various possibilities of functionalization by post polymerization
modification. The unmodified polymer is already antimicrobial active to some extent. To
improve the antimicrobial effect, long alkyl chains and quaternary ammonium groups were
introduced into the polymer. For this modification, the reaction of PVAm with functional
epoxides was used. More details on the synthesis of multifunctional PVAm are given in
Chapter 2.
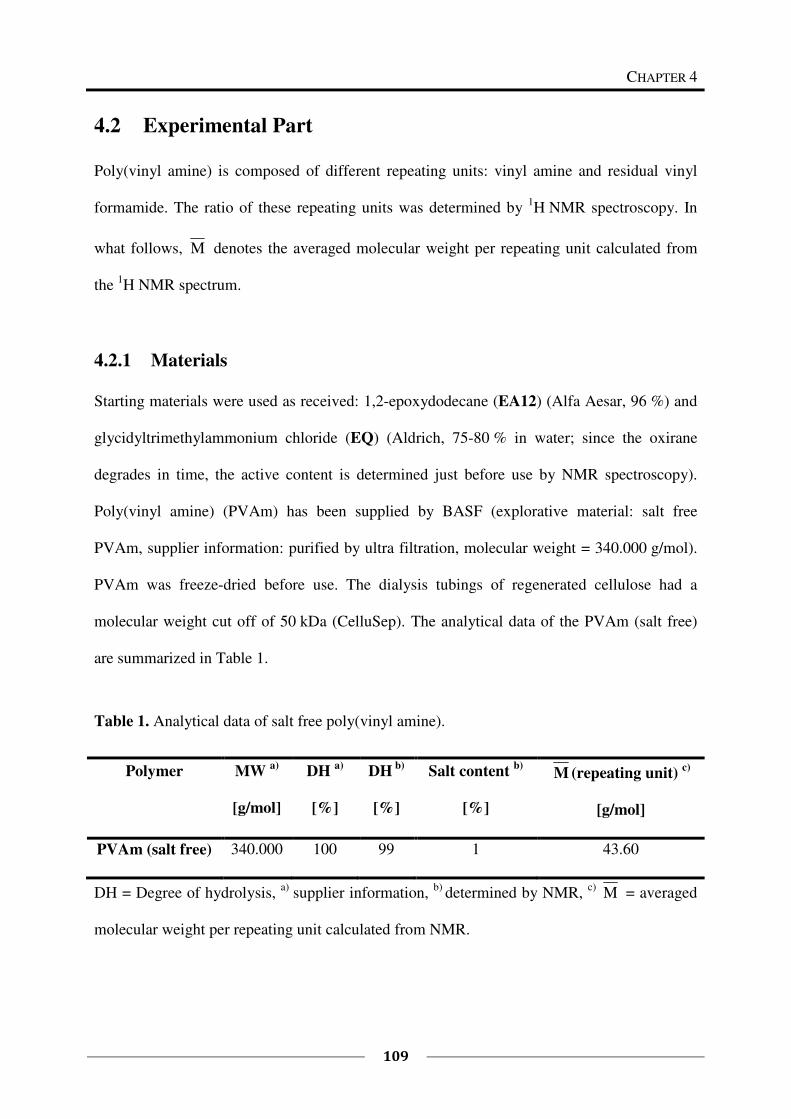
CHAPTER 4
109
4.2 Experimental Part
Poly(vinyl amine) is composed of different repeating units: vinyl amine and residual vinyl
formamide. The ratio of these repeating units was determined by 1H NMR spectroscopy. In
what follows, M denotes the averaged molecular weight per repeating unit calculated from
the 1H NMR spectrum.
4.2.1 Materials
Starting materials were used as received: 1,2-epoxydodecane (EA12) (Alfa Aesar, 96 %) and
glycidyltrimethylammonium chloride (EQ) (Aldrich, 75-80 % in water; since the oxirane
degrades in time, the active content is determined just before use by NMR spectroscopy).
Poly(vinyl amine) (PVAm) has been supplied by BASF (explorative material: salt free
PVAm, supplier information: purified by ultra filtration, molecular weight = 340.000 g/mol).
PVAm was freeze-dried before use. The dialysis tubings of regenerated cellulose had a
molecular weight cut off of 50 kDa (CelluSep). The analytical data of the PVAm (salt free)
are summarized in Table 1.
Table 1. Analytical data of salt free poly(vinyl amine).
Polymer
MW a)
[g/mol]
DH a)
[%]
DH b)
[%]
Salt content b)
[%]
M (repeating unit) c)
[g/mol]
PVAm (salt free) 340.000 100 99 1 43.60
DH = Degree of hydrolysis, a)
supplier information, b)
determined by NMR, c)
M = averaged
molecular weight per repeating unit calculated from NMR.
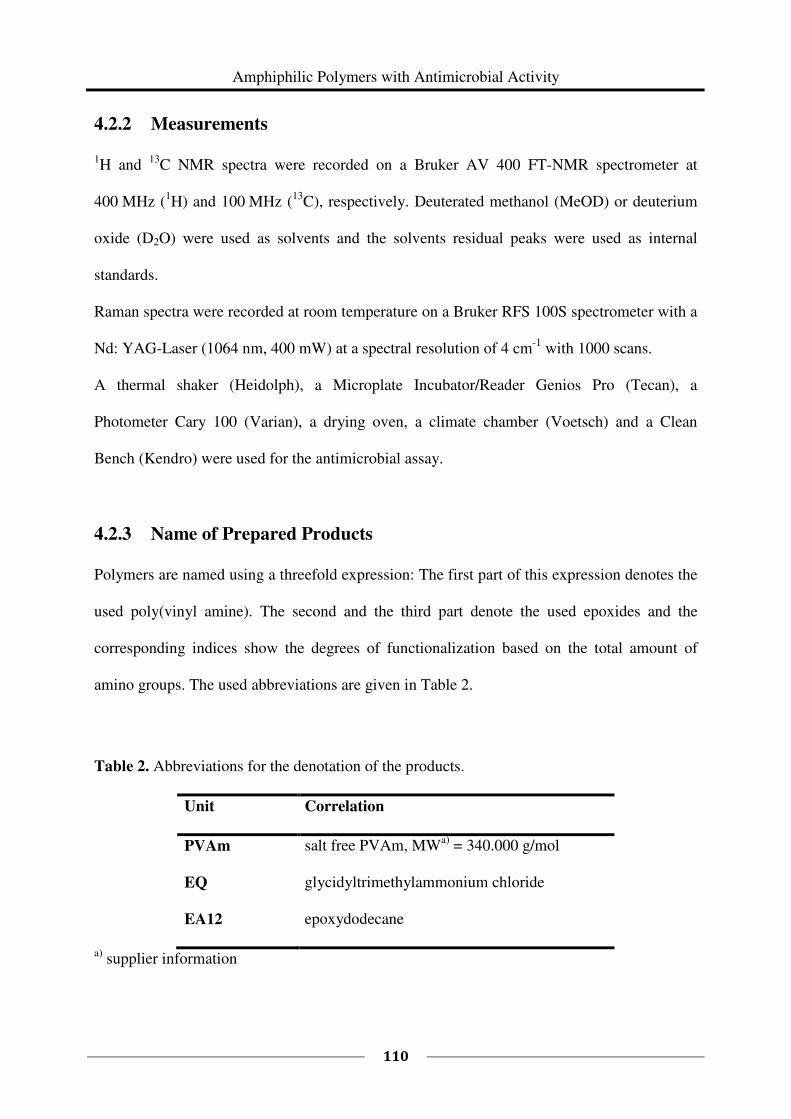
Amphiphilic Polymers with Antimicrobial Activity
110
4.2.2 Measurements
1H and
13C NMR spectra were recorded on a Bruker AV 400 FT-NMR spectrometer at
400 MHz (1H) and 100 MHz (
13C), respectively. Deuterated methanol (MeOD) or deuterium
oxide (D2O) were used as solvents and the solvents residual peaks were used as internal
standards.
Raman spectra were recorded at room temperature on a Bruker RFS 100S spectrometer with a
Nd: YAG-Laser (1064 nm, 400 mW) at a spectral resolution of 4 cm-1
with 1000 scans.
A thermal shaker (Heidolph), a Microplate Incubator/Reader Genios Pro (Tecan), a
Photometer Cary 100 (Varian), a drying oven, a climate chamber (Voetsch) and a Clean
Bench (Kendro) were used for the antimicrobial assay.
4.2.3 Name of Prepared Products
Polymers are named using a threefold expression: The first part of this expression denotes the
used poly(vinyl amine). The second and the third part denote the used epoxides and the
corresponding indices show the degrees of functionalization based on the total amount of
amino groups. The used abbreviations are given in Table 2.
Table 2. Abbreviations for the denotation of the products.
Unit Correlation
PVAm salt free PVAm, MWa)
= 340.000 g/mol
EQ glycidyltrimethylammonium chloride
EA12 epoxydodecane
a) supplier information
CHAPTER 4
111
For example, PVAm-EQ15-EA1210 stands for the functionalization of salt free PVAm with
15 % EQ and 10 % EA12.
4.2.4 Microorganisms
The antimicrobial activity of the polymers was tested against the Gram-negative bacterium
Escherichia coli (DSMZ 498).
4.2.5 Bacterial Culture
The nutrient solution (NL1, pH 7) contained 5 g peptone and 3 g meat extract per liter
bidistilled water. The phosphate-buffered saline (PBS) contained 9.0 g NaCl per liter of 0.1 M
disodium hydrogenophosphate/sodium dihydrogenophosphate buffer solution adjusted to
pH 6.5. Soft agar was prepared from 10.0 g peptone, 3.0 g meat extract, 6.0 g NaCl, and 7.0 g
agar-agar per liter of bidistilled water. All solutions were autoclaved for 15 min at 120 °C
prior to use. The bacteria were suspended in nutrient solution and in PBS, respectively. The
final suspension in nutrient solution or PBS contained DOW (superwetting agent
Q2-5211 from DOW Chemicals) in a concentration of 0.01 % and 2 × 10⁶ colony forming
units per mL (cfu/mL). All solutions were autoclaved for 15 min at 120 °C prior to
inoculation.
4.2.6 Surface Coating
Glass substrates (Marienfeld, 18 mm × 18 mm) or silicon wafer cut into pieces (15 mm ×
15 mm) were used as model surfaces. The substrates were ultrasonically cleaned in acetone
(p.a.), dist. water, and isopropanol (p.a.) for 5 minutes each and afterwards dried under
nitrogen-flush. After cleaning, the substrates were directly used for coating.
Amphiphilic Polymers with Antimicrobial Activity
112
Drop Casting
150 µL of a methanolic polymer solution (1 wt% (w/w), 0.1 wt% (w/w), 0.05 wt% (w/w))
were uniformly casted onto a glass substrate and the solvent was allowed to evaporate
overnight.
Spin Coating
100 µL of a methanolic polymer solution (1 wt% (w/w)) were applied onto the silicon wafer
and rotated with 2000 rpm for 30 seconds.
Annealing in Methanol Atmosphere
The bottom of an exsiccator was filled with methanol up to a level of about 1 cm. The
exsiccator was closed and stored for two days at RT so that a methanol atmosphere had built.
The coated substrates were placed into the exsiccator, annealed in methanol atmosphere and
removed after defined times.
4.2.7 Antimicrobial Assessment of the Functional Polymers
Antimicrobial Test of Coated Surfaces
The antimicrobial effect was tested both under growth (bacteria suspension in nutrient
solution) and under non-growth (bacteria suspension in PBS) conditions. All tests were
carried out at least twice. To ensure a complete wetting of the surface, enabling the bacteria to
interact with the coated polymer the wetting agents DOW (Q2-5211; 3-(polyoxy-
ethylene)propylheptamethyltrisiloxane) or Triton X-100 (octylphenolpoly(ethylene-
glycolether)x) were added to the test solutions and their effect was compared. Substrates
coated with functionalized PVAm (non sterilized) were placed into Petri dishes (Ø = 3 cm)
and 20 µL bacteria suspension of E. coli (2 × 10⁶ colony forming units per mL (cfu/mL)) were
CHAPTER 4
113
inoculated onto each surface (parallel samples a and b). As reference an uncoated substrate
was exposed to 20 µL bacteria suspension of E. coli (2 × 10⁶ cfu/mL). As sterility control, a
coated substrate was exposed to 20 µL of nutrient solution or PBS (in the absence of
bacteria), for the testing under growth and under non-growth conditions, respectively (sample
c). The exposure was performed in a climate chamber at 25 °C and 97 % rH (relative
humidity) for 2.5 h or 22 h. Thereafter, 1 mL of the nutrient solution was pipetted (dilution
1 : 50) in every Petri dish (a – c) and the samples were shaken at RT for 30 min with
150 revolutions per minute (rpm). Then, from each Petri dish 200 µL solution were
transferred to a well plate to monitor the residual growth.
Leaching test: 180 µL of the shake solution of the sterility control (sample c) were transferred
to a well plate, inoculated with 20 µL bacteria suspension of E. coli (2 × 10⁶ cfu/mL), and the
bacterial growth was monitored. This leaching test served as a proof that during the growth
test no inhibition is caused due to an amount of polymer transferred from the coated surface to
the well plate of the growth test, i.e., as a proof that the growth test is valid and the growth
inhibition is only due to the influence of the polymer on E. coli during the exposure on the
surface.
Real leaching: Real leaching from the surface was tested with three methods.
(i) The antimicrobial effect of higher concentrated extracts of the coatings was measured. Six
coated substrates were each exposed for 2.5 h (25 °C) to 30 µL nutrient solution, containing
DOW in a concentration of 0.01 %. After the exposure the nutrient solution was collected
from each substrate and the substrates were washed with a total amount of 60 µL nutrient
solution. From the combined exposure and washing solution (in total 240 µL), 120 µL were
transferred to a well plate, inoculated with 20 µL bacteria suspension of E. coli
(2 × 10⁶ cfu/mL) and the residual growth was monitored.
Amphiphilic Polymers with Antimicrobial Activity
114
(ii) The leaching was tested by measuring the residual antimicrobial effect of the coated
surfaces before and after washing. For washing, the samples were shaken three times with
1 mL of sterile bidistilled water for 30 min at 170 rpm. Afterwards the samples were dried
overnight lying on filter papers in open petri dishes in the clean bench.
(iii) The leaching was tested via patching the coated surfaces onto nutrient agar inoculated
with E. coli, followed by incubation. For the patching of the coated surfaces onto agar plates
the coated glass substrates were placed into Petri dishes (Ø = 3 cm) and exposed to 25 µL
nutrient solution (containing DOW in a concentration of 0.05 %). The exposure was
performed in a climate chamber at 25 °C and 95 % relative humidity (rH) for 2.5 h. 200 µL
bacteria suspension of E. coli (5 × 10⁵ colony forming units per mL (cfu/mL)) were pipetted
and plated onto agar plates. The inoculated agar plates were incubated for 30 min at 37 °C.
The exposed coated surfaces were patched with their upside onto the inoculated agar plates
and afterwards incubated at 37 °C overnight, or the coated surfaces were removed after 60
seconds followed by an incubation of the inoculated agar plates (37 °C, overnight). The
colony growth was documented and the plates were checked for the appearance of a zone of
inhibition.
Growth test: The growth of the bacteria was followed by measuring the optical density (OD)
of the solutions (transferred to the well plates) at 612 nm overnight at 37 °C in the micro well
plate incubator/reader. To insert oxygen into the solution (for the bacterial metabolism) and to
assure the homogeneity of the OD measurement, the solutions were shaken for 1000 seconds
once per measuring cycle of 30 min. This test does not discriminate whether the substance is
bactericidal or bacteriostatic.
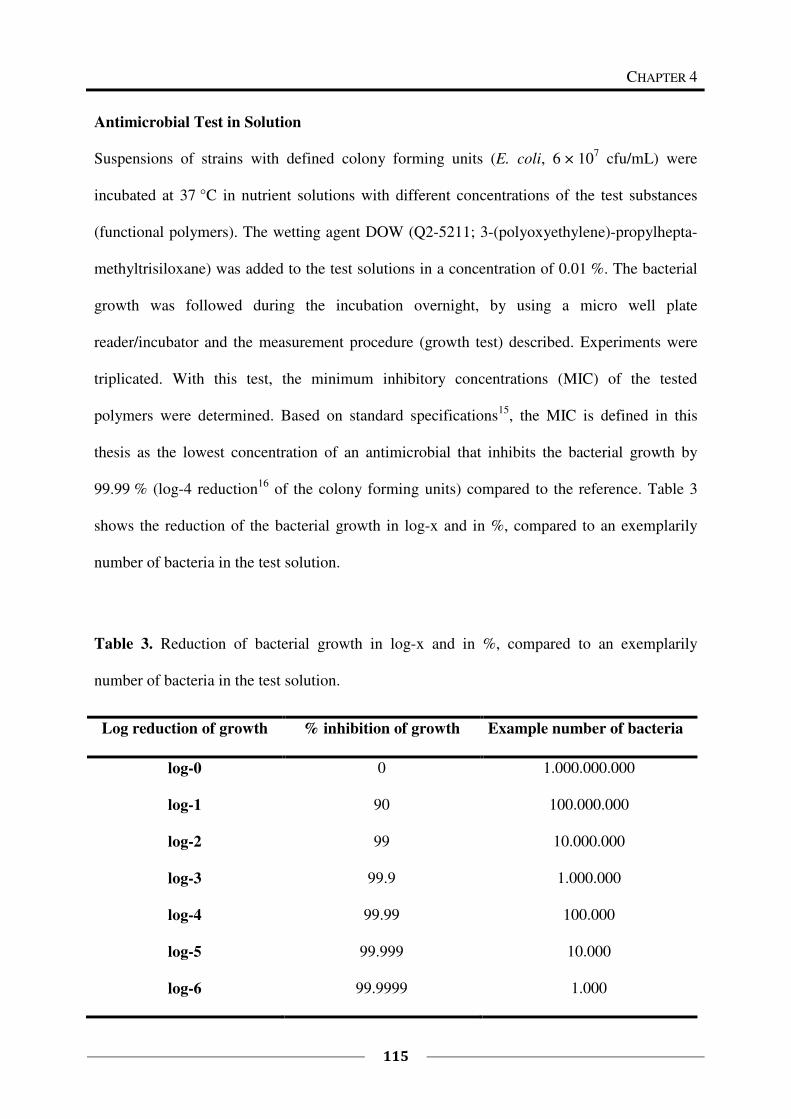
CHAPTER 4
115
Antimicrobial Test in Solution
Suspensions of strains with defined colony forming units (E. coli, 6 × 10⁷ cfu/mL) were
incubated at 37 °C in nutrient solutions with different concentrations of the test substances
(functional polymers). The wetting agent DOW (Q2-5211; 3-(polyoxyethylene)-propylhepta-
methyltrisiloxane) was added to the test solutions in a concentration of 0.01 %. The bacterial
growth was followed during the incubation overnight, by using a micro well plate
reader/incubator and the measurement procedure (growth test) described. Experiments were
triplicated. With this test, the minimum inhibitory concentrations (MIC) of the tested
polymers were determined. Based on standard specifications15
, the MIC is defined in this
thesis as the lowest concentration of an antimicrobial that inhibits the bacterial growth by
99.99 % (log-4 reduction16
of the colony forming units) compared to the reference. Table 3
shows the reduction of the bacterial growth in log-x and in %, compared to an exemplarily
number of bacteria in the test solution.
Table 3. Reduction of bacterial growth in log-x and in %, compared to an exemplarily
number of bacteria in the test solution.
Log reduction of growth % inhibition of growth Example number of bacteria
log-0 0 1.000.000.000
log-1 90 100.000.000
log-2 99 10.000.000
log-3 99.9 1.000.000
log-4 99.99 100.000
log-5 99.999 10.000
log-6 99.9999 1.000
Amphiphilic Polymers with Antimicrobial Activity
116
4.2.8 Langmuir Film Experiments
The preparation of the lipid layers and the penetration experiments were carried out using a
Langmuir trough (KSV MiniMicro, 5 × 20 × 0.6 cm3) with two barriers to provide a
symmetric film compression. The surface pressure was recorded with an accuracy of
± 0.05 mN/m with the aid of a Wilhelmy plate made of chromatography paper (Whatman
Chr1) which was connected to a force transducer. The trough was made of teflon while the
barriers were made of polyoxymethylene (POM), which is suggested for lipid layers.17
Dichloromethane (purity ≥ 99.9 %, Spectrum-3D Kft. Hungary) and methanol (purity
≥ 99.9 %, Sigma-Aldrich Kft. Hungary) were used for cleaning the Langmuir trough and the
POM barriers, respectively. Afterwards, the trough and the barriers were rinsed with water.
The trough was placed on a thermo-regulated plate and into a box of plexiglass in order to
minimize air turbulence and possible contaminations. All measurements were performed at
23 ± 0.5 °C. As subphase, double distilled water, which was checked by its conductivity
(< 5 mS) and surface tension (> 72.0 mN/m at 23 ± 0.5 °C) values, was used.
DPPC (Dipalmitoylphosphatidylcholine) was used as lipid for the Langmuir layers. For the
preparation of the lipid layers, 13 µL of the lipid solution (1.0 g/L in chloroform (purity
> 99.8 %, Fisher Chemicals)) were spread onto the aqueous subphase and the solvent was
allowed to evaporate for 10 min before the compression to form the molecular lipid layer on
the surface. Before the penetration experiment surface pressure-area isotherms were
determined at a barrier speed of 10 cm2/min. The reason for this preliminary process is to
bring the lipid layer into a reproducible state (compactness, ordering of chains). For the
penetration experiments the lipid monolayer was compressed to a given surface pressure of
20 mN/m. At a fixed barrier position, the aqueous solution of the polymer was injected below
the lipid layer to reach a final polymer concentration of 0.025 mg/mL or 0.075 mg/mL in the
subphase (concentration of the polymer solution = 1 and 3 mg/mL, injected volume: 2.4 mL).
CHAPTER 4
117
The change in surface pressure (∆π) as indicator of the lipid/polymer interaction was recorded
as a function of time for 1 h. The result of the penetration of the polymer into the lipid
monolayer (the saturation value after 1 h of the increase of the surface pressure, ∆π) was
given as the average of two independent measurements with an estimated error of
± 0.5 mN/m.
4.2.9 Syntheses
The reaction of PVAm with functional epoxides was optimized to the following procedure.
More details on the synthesis of multifunctional PVAm are given in Chapter 2.
General Procedure for the Functionalization of PVAm with Functional Epoxides
To a solution of freeze-dried salt free PVAm (200 mg) in dist. water/methanol (p.a.)
(2 mL/4 mL) at 60 °C, a solution of the desired functional epoxides in methanol (p.a., 8 mL)
was added. The solution was stirred at 60 °C for 2 d. The reaction solution was then dialyzed
against dist. water to remove impurities originating from the educts (especially from EQ). The
water was exchanged several times. The product was then isolated by freeze-drying. The
freeze-dried products were all soluble in methanol, in some cases swellable in water and in
some cases soluble in water. Along this route, long alkyl chains and quaternary ammonium
groups were introduced into the polymer in different ratios. For more details on the synthesis
see Chapter 2.
4.3 Results and Discussion
Based on the grafting-to strategy described in Chapter 2, five series of multifunctional
amphiphilic poly(vinyl amine)s were prepared. Different concentrations of cationic and
hydrophobic groups were introduced into the polymer. The goal of this study was to get new
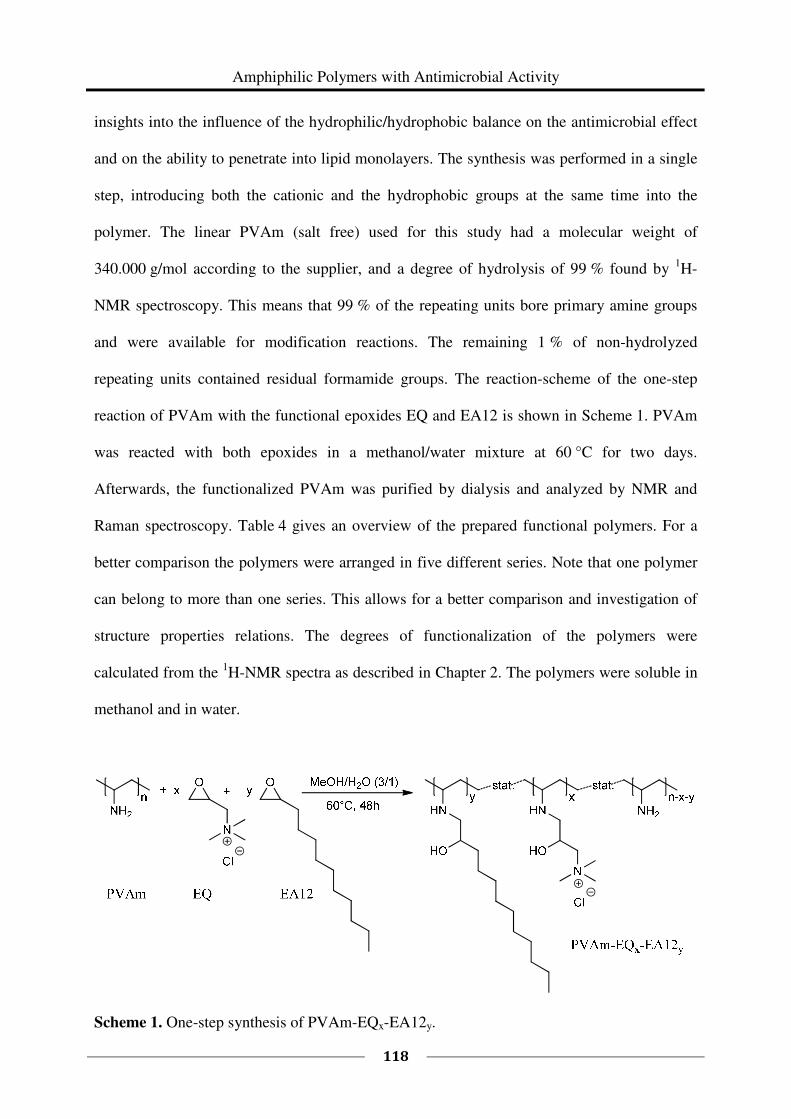
Amphiphilic Polymers with Antimicrobial Activity
118
insights into the influence of the hydrophilic/hydrophobic balance on the antimicrobial effect
and on the ability to penetrate into lipid monolayers. The synthesis was performed in a single
step, introducing both the cationic and the hydrophobic groups at the same time into the
polymer. The linear PVAm (salt free) used for this study had a molecular weight of
340.000 g/mol according to the supplier, and a degree of hydrolysis of 99 % found by 1H-
NMR spectroscopy. This means that 99 % of the repeating units bore primary amine groups
and were available for modification reactions. The remaining 1 % of non-hydrolyzed
repeating units contained residual formamide groups. The reaction-scheme of the one-step
reaction of PVAm with the functional epoxides EQ and EA12 is shown in Scheme 1. PVAm
was reacted with both epoxides in a methanol/water mixture at 60 °C for two days.
Afterwards, the functionalized PVAm was purified by dialysis and analyzed by NMR and
Raman spectroscopy. Table 4 gives an overview of the prepared functional polymers. For a
better comparison the polymers were arranged in five different series. Note that one polymer
can belong to more than one series. This allows for a better comparison and investigation of
structure properties relations. The degrees of functionalization of the polymers were
calculated from the 1H-NMR spectra as described in Chapter 2. The polymers were soluble in
methanol and in water.
Scheme 1. One-step synthesis of PVAm-EQx-EA12y.
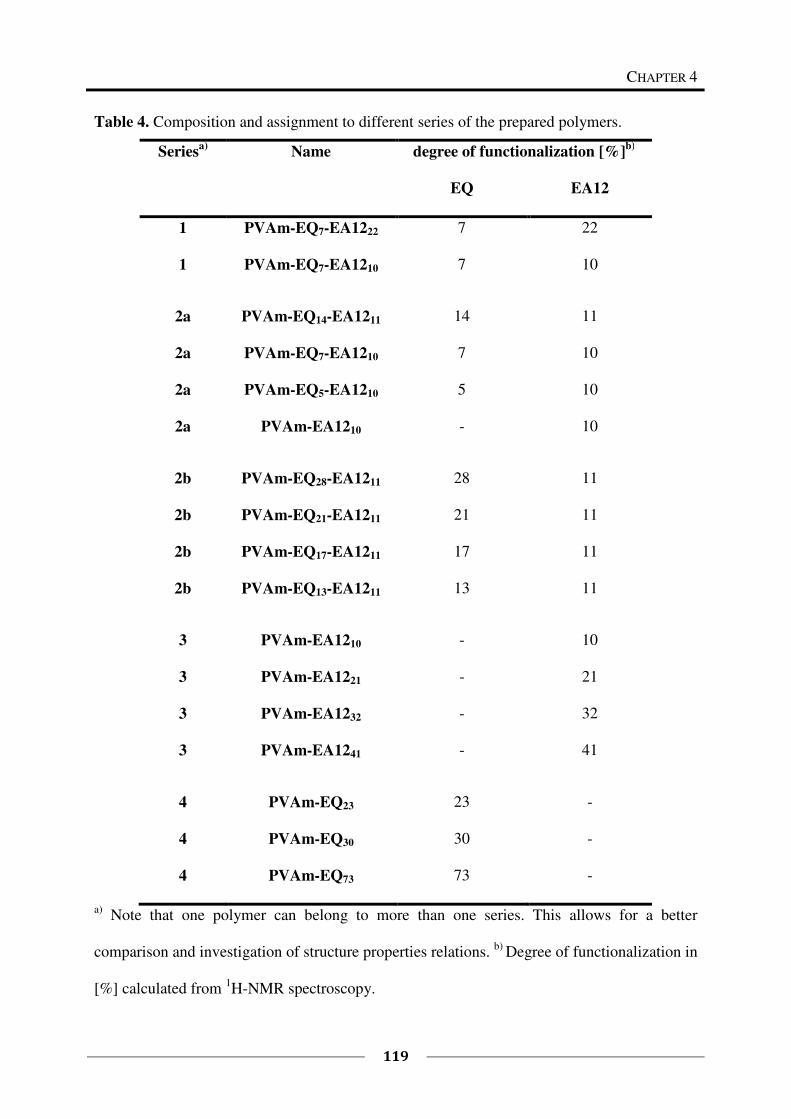
CHAPTER 4
119
Table 4. Composition and assignment to different series of the prepared polymers.
Seriesa)
Name degree of functionalization [%]b)
EQ EA12
1 PVAm-EQ7-EA1222 7 22
1 PVAm-EQ7-EA1210 7 10
2a PVAm-EQ14-EA1211 14 11
2a PVAm-EQ7-EA1210 7 10
2a PVAm-EQ5-EA1210 5 10
2a PVAm-EA1210 - 10
2b PVAm-EQ28-EA1211 28 11
2b PVAm-EQ21-EA1211 21 11
2b PVAm-EQ17-EA1211 17 11
2b PVAm-EQ13-EA1211 13 11
3 PVAm-EA1210 - 10
3 PVAm-EA1221 - 21
3 PVAm-EA1232 - 32
3 PVAm-EA1241 - 41
4 PVAm-EQ23 23 -
4 PVAm-EQ30 30 -
4 PVAm-EQ73 73 -
a) Note that one polymer can belong to more than one series. This allows for a better
comparison and investigation of structure properties relations. b)
Degree of functionalization in
[%] calculated from 1H-NMR spectroscopy.
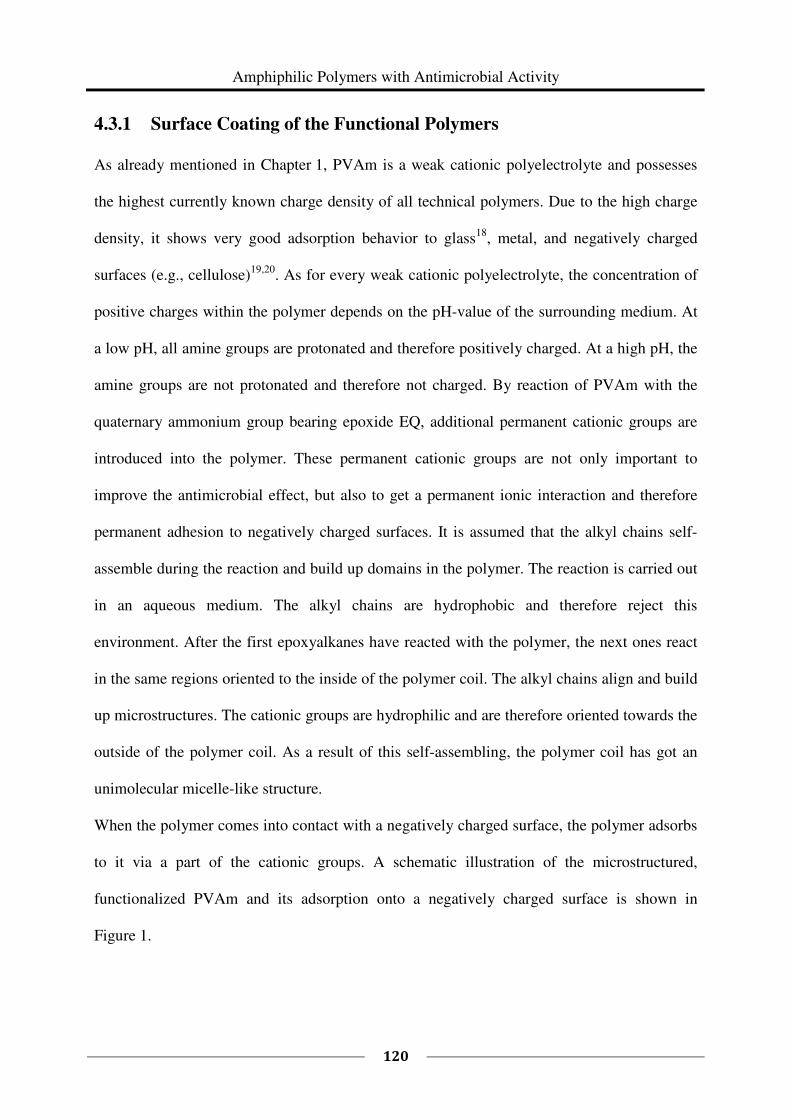
Amphiphilic Polymers with Antimicrobial Activity
120
4.3.1 Surface Coating of the Functional Polymers
As already mentioned in Chapter 1, PVAm is a weak cationic polyelectrolyte and possesses
the highest currently known charge density of all technical polymers. Due to the high charge
density, it shows very good adsorption behavior to glass18
, metal, and negatively charged
surfaces (e.g., cellulose)19,20
. As for every weak cationic polyelectrolyte, the concentration of
positive charges within the polymer depends on the pH-value of the surrounding medium. At
a low pH, all amine groups are protonated and therefore positively charged. At a high pH, the
amine groups are not protonated and therefore not charged. By reaction of PVAm with the
quaternary ammonium group bearing epoxide EQ, additional permanent cationic groups are
introduced into the polymer. These permanent cationic groups are not only important to
improve the antimicrobial effect, but also to get a permanent ionic interaction and therefore
permanent adhesion to negatively charged surfaces. It is assumed that the alkyl chains self-
assemble during the reaction and build up domains in the polymer. The reaction is carried out
in an aqueous medium. The alkyl chains are hydrophobic and therefore reject this
environment. After the first epoxyalkanes have reacted with the polymer, the next ones react
in the same regions oriented to the inside of the polymer coil. The alkyl chains align and build
up microstructures. The cationic groups are hydrophilic and are therefore oriented towards the
outside of the polymer coil. As a result of this self-assembling, the polymer coil has got an
unimolecular micelle-like structure.
When the polymer comes into contact with a negatively charged surface, the polymer adsorbs
to it via a part of the cationic groups. A schematic illustration of the microstructured,
functionalized PVAm and its adsorption onto a negatively charged surface is shown in
Figure 1.
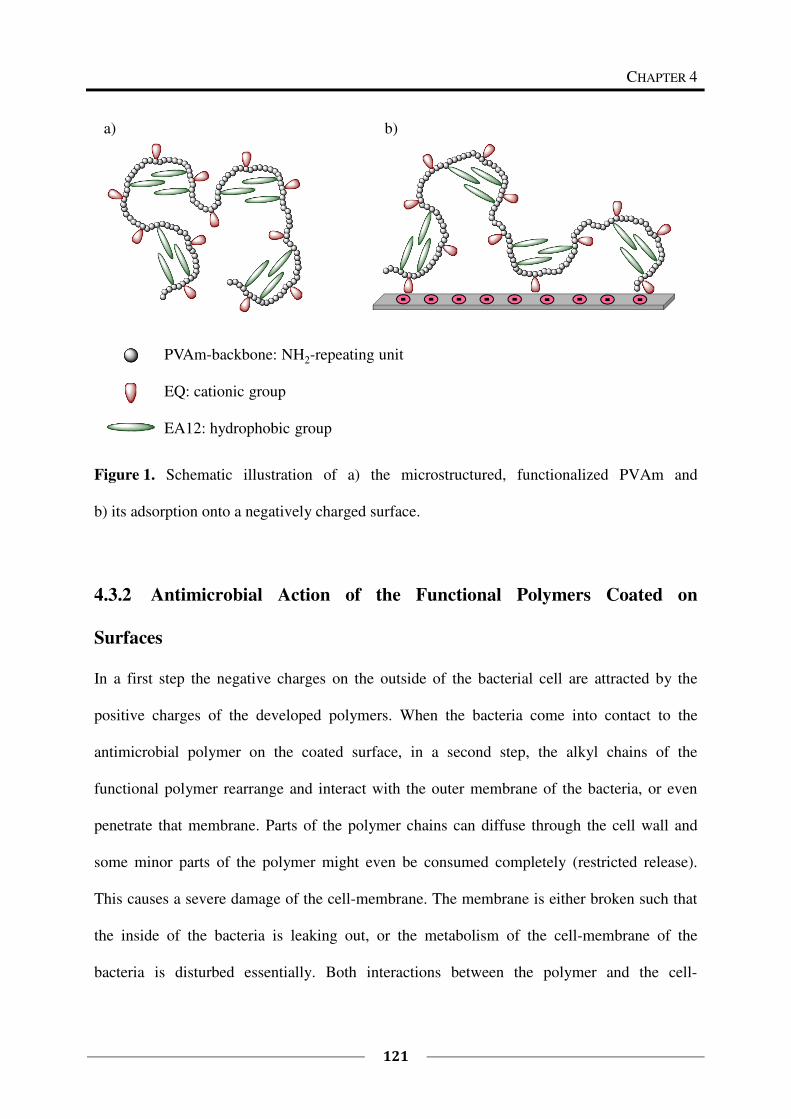
CHAPTER 4
121
Figure 1. Schematic illustration of a) the microstructured, functionalized PVAm and
b) its adsorption onto a negatively charged surface.
4.3.2 Antimicrobial Action of the Functional Polymers Coated on
Surfaces
In a first step the negative charges on the outside of the bacterial cell are attracted by the
positive charges of the developed polymers. When the bacteria come into contact to the
antimicrobial polymer on the coated surface, in a second step, the alkyl chains of the
functional polymer rearrange and interact with the outer membrane of the bacteria, or even
penetrate that membrane. Parts of the polymer chains can diffuse through the cell wall and
some minor parts of the polymer might even be consumed completely (restricted release).
This causes a severe damage of the cell-membrane. The membrane is either broken such that
the inside of the bacteria is leaking out, or the metabolism of the cell-membrane of the
bacteria is disturbed essentially. Both interactions between the polymer and the cell-
b) a)
PVAm-backbone: NH2-repeating unit
EQ: cationic group
EA12: hydrophobic group
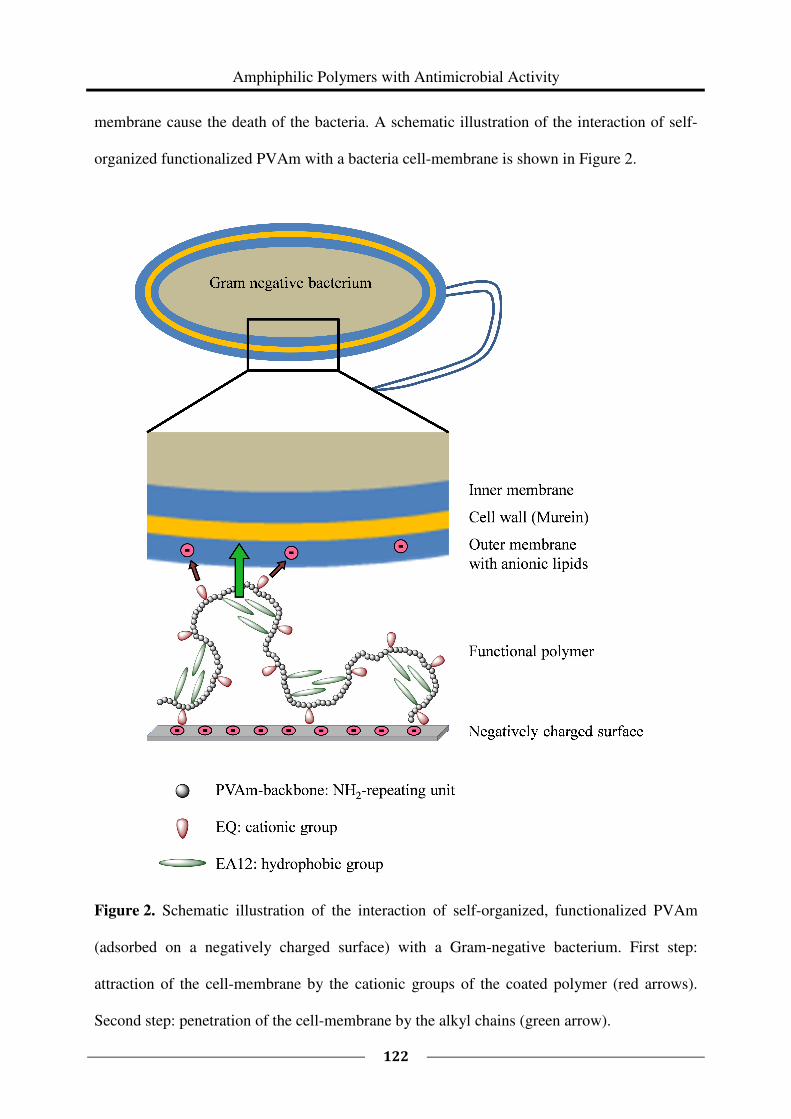
Amphiphilic Polymers with Antimicrobial Activity
122
membrane cause the death of the bacteria. A schematic illustration of the interaction of self-
organized functionalized PVAm with a bacteria cell-membrane is shown in Figure 2.
Figure 2. Schematic illustration of the interaction of self-organized, functionalized PVAm
(adsorbed on a negatively charged surface) with a Gram-negative bacterium. First step:
attraction of the cell-membrane by the cationic groups of the coated polymer (red arrows).
Second step: penetration of the cell-membrane by the alkyl chains (green arrow).
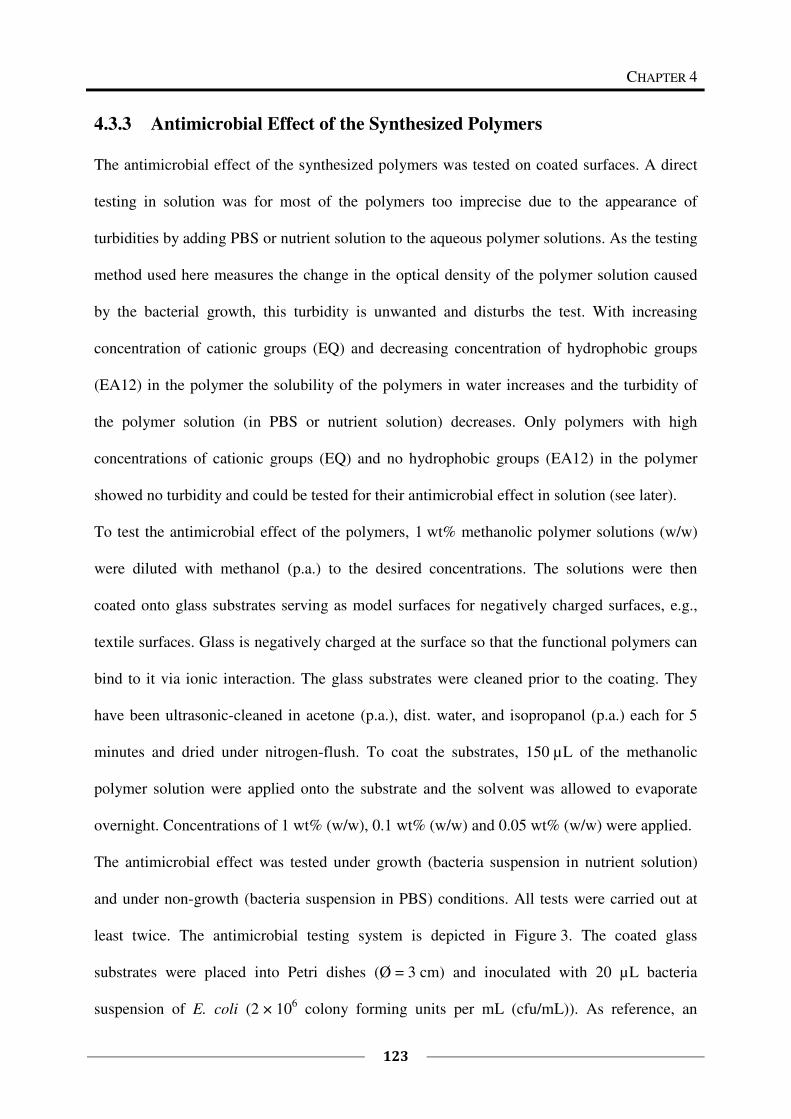
CHAPTER 4
123
4.3.3 Antimicrobial Effect of the Synthesized Polymers
The antimicrobial effect of the synthesized polymers was tested on coated surfaces. A direct
testing in solution was for most of the polymers too imprecise due to the appearance of
turbidities by adding PBS or nutrient solution to the aqueous polymer solutions. As the testing
method used here measures the change in the optical density of the polymer solution caused
by the bacterial growth, this turbidity is unwanted and disturbs the test. With increasing
concentration of cationic groups (EQ) and decreasing concentration of hydrophobic groups
(EA12) in the polymer the solubility of the polymers in water increases and the turbidity of
the polymer solution (in PBS or nutrient solution) decreases. Only polymers with high
concentrations of cationic groups (EQ) and no hydrophobic groups (EA12) in the polymer
showed no turbidity and could be tested for their antimicrobial effect in solution (see later).
To test the antimicrobial effect of the polymers, 1 wt% methanolic polymer solutions (w/w)
were diluted with methanol (p.a.) to the desired concentrations. The solutions were then
coated onto glass substrates serving as model surfaces for negatively charged surfaces, e.g.,
textile surfaces. Glass is negatively charged at the surface so that the functional polymers can
bind to it via ionic interaction. The glass substrates were cleaned prior to the coating. They
have been ultrasonic-cleaned in acetone (p.a.), dist. water, and isopropanol (p.a.) each for 5
minutes and dried under nitrogen-flush. To coat the substrates, 150 µL of the methanolic
polymer solution were applied onto the substrate and the solvent was allowed to evaporate
overnight. Concentrations of 1 wt% (w/w), 0.1 wt% (w/w) and 0.05 wt% (w/w) were applied.
The antimicrobial effect was tested under growth (bacteria suspension in nutrient solution)
and under non-growth (bacteria suspension in PBS) conditions. All tests were carried out at
least twice. The antimicrobial testing system is depicted in Figure 3. The coated glass
substrates were placed into Petri dishes (Ø = 3 cm) and inoculated with 20 µL bacteria
suspension of E. coli (2 × 10⁶ colony forming units per mL (cfu/mL)). As reference, an
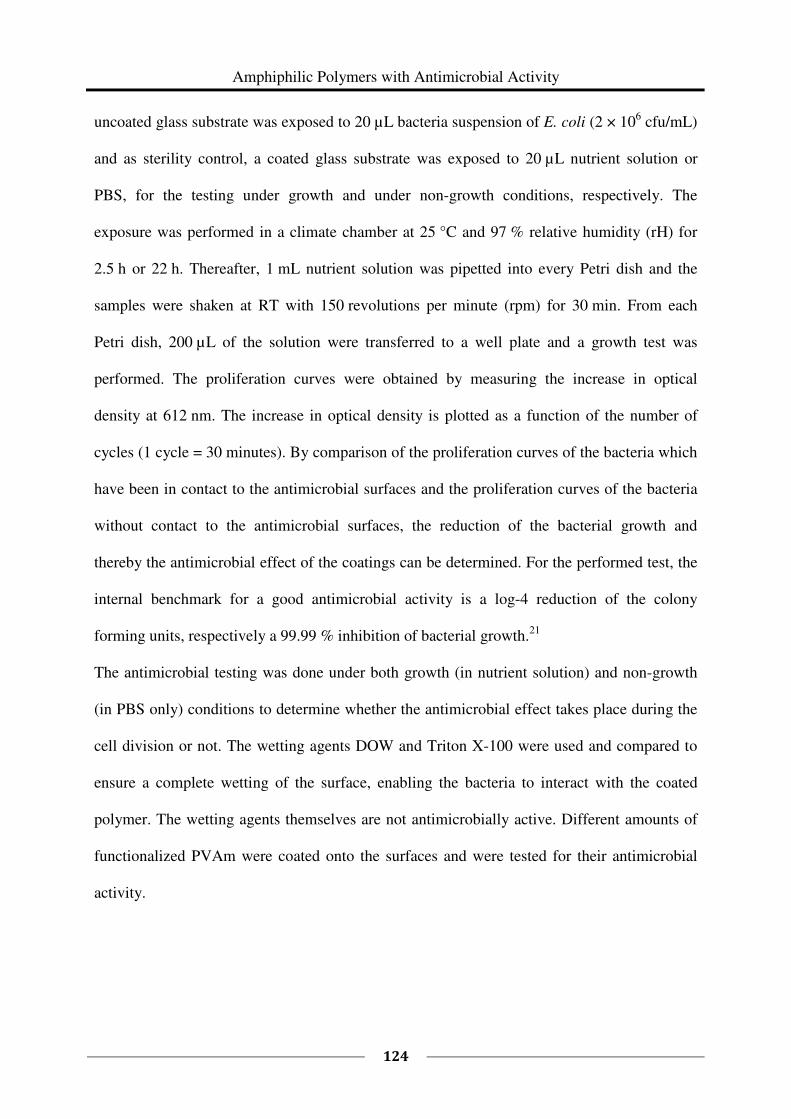
Amphiphilic Polymers with Antimicrobial Activity
124
uncoated glass substrate was exposed to 20 µL bacteria suspension of E. coli (2 × 10⁶ cfu/mL)
and as sterility control, a coated glass substrate was exposed to 20 µL nutrient solution or
PBS, for the testing under growth and under non-growth conditions, respectively. The
exposure was performed in a climate chamber at 25 °C and 97 % relative humidity (rH) for
2.5 h or 22 h. Thereafter, 1 mL nutrient solution was pipetted into every Petri dish and the
samples were shaken at RT with 150 revolutions per minute (rpm) for 30 min. From each
Petri dish, 200 µL of the solution were transferred to a well plate and a growth test was
performed. The proliferation curves were obtained by measuring the increase in optical
density at 612 nm. The increase in optical density is plotted as a function of the number of
cycles (1 cycle = 30 minutes). By comparison of the proliferation curves of the bacteria which
have been in contact to the antimicrobial surfaces and the proliferation curves of the bacteria
without contact to the antimicrobial surfaces, the reduction of the bacterial growth and
thereby the antimicrobial effect of the coatings can be determined. For the performed test, the
internal benchmark for a good antimicrobial activity is a log-4 reduction of the colony
forming units, respectively a 99.99 % inhibition of bacterial growth.21
The antimicrobial testing was done under both growth (in nutrient solution) and non-growth
(in PBS only) conditions to determine whether the antimicrobial effect takes place during the
cell division or not. The wetting agents DOW and Triton X-100 were used and compared to
ensure a complete wetting of the surface, enabling the bacteria to interact with the coated
polymer. The wetting agents themselves are not antimicrobially active. Different amounts of
functionalized PVAm were coated onto the surfaces and were tested for their antimicrobial
activity.
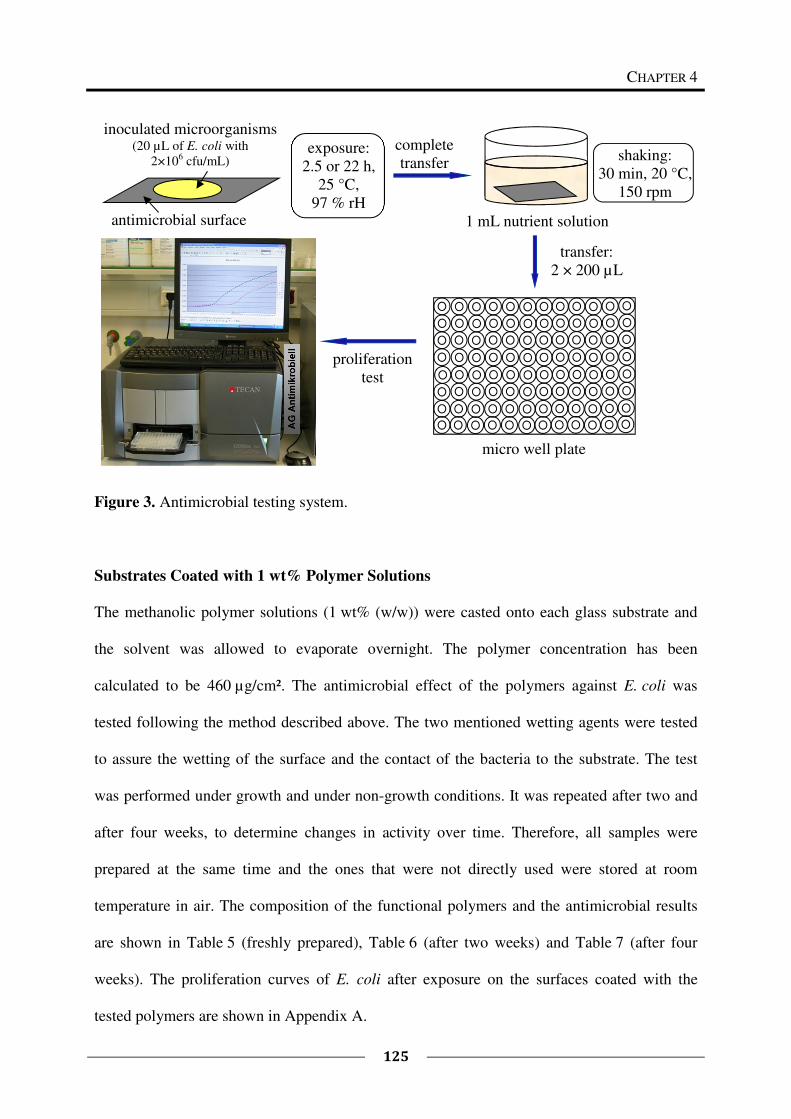
CHAPTER 4
125
Figure 3. Antimicrobial testing system.
Substrates Coated with 1 wt% Polymer Solutions
The methanolic polymer solutions (1 wt% (w/w)) were casted onto each glass substrate and
the solvent was allowed to evaporate overnight. The polymer concentration has been
calculated to be 460 µg/cm². The antimicrobial effect of the polymers against E. coli was
tested following the method described above. The two mentioned wetting agents were tested
to assure the wetting of the surface and the contact of the bacteria to the substrate. The test
was performed under growth and under non-growth conditions. It was repeated after two and
after four weeks, to determine changes in activity over time. Therefore, all samples were
prepared at the same time and the ones that were not directly used were stored at room
temperature in air. The composition of the functional polymers and the antimicrobial results
are shown in Table 5 (freshly prepared), Table 6 (after two weeks) and Table 7 (after four
weeks). The proliferation curves of E. coli after exposure on the surfaces coated with the
tested polymers are shown in Appendix A.
antimicrobial surface
micro well plate
inoculated microorganisms (20 µL of E. coli with
2×10⁶ cfu/mL)
exposure:
2.5 or 22 h,
25 °C,
97 % rH
shaking:
30 min, 20 °C,
150 rpm
transfer:
2 × 200 µL
proliferation
test
complete
transfer
1 mL nutrient solution
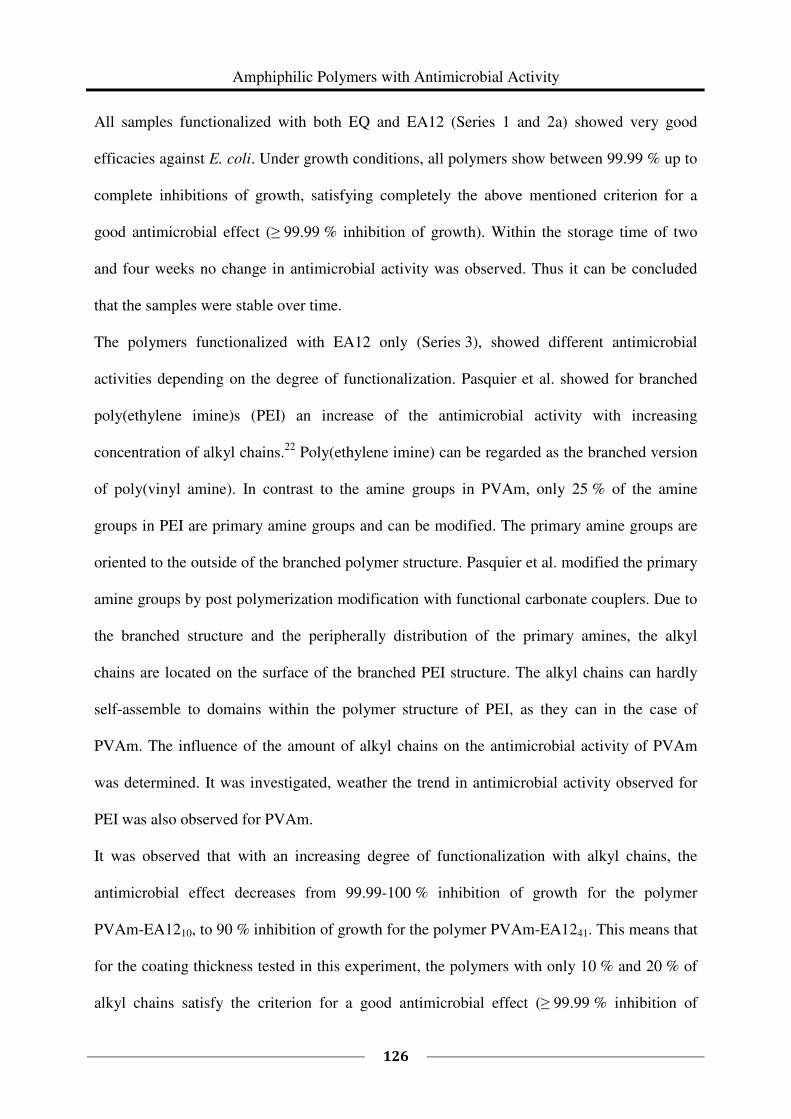
Amphiphilic Polymers with Antimicrobial Activity
126
All samples functionalized with both EQ and EA12 (Series 1 and 2a) showed very good
efficacies against E. coli. Under growth conditions, all polymers show between 99.99 % up to
complete inhibitions of growth, satisfying completely the above mentioned criterion for a
good antimicrobial effect (≥ 99.99 % inhibition of growth). Within the storage time of two
and four weeks no change in antimicrobial activity was observed. Thus it can be concluded
that the samples were stable over time.
The polymers functionalized with EA12 only (Series 3), showed different antimicrobial
activities depending on the degree of functionalization. Pasquier et al. showed for branched
poly(ethylene imine)s (PEI) an increase of the antimicrobial activity with increasing
concentration of alkyl chains.22
Poly(ethylene imine) can be regarded as the branched version
of poly(vinyl amine). In contrast to the amine groups in PVAm, only 25 % of the amine
groups in PEI are primary amine groups and can be modified. The primary amine groups are
oriented to the outside of the branched polymer structure. Pasquier et al. modified the primary
amine groups by post polymerization modification with functional carbonate couplers. Due to
the branched structure and the peripherally distribution of the primary amines, the alkyl
chains are located on the surface of the branched PEI structure. The alkyl chains can hardly
self-assemble to domains within the polymer structure of PEI, as they can in the case of
PVAm. The influence of the amount of alkyl chains on the antimicrobial activity of PVAm
was determined. It was investigated, weather the trend in antimicrobial activity observed for
PEI was also observed for PVAm.
It was observed that with an increasing degree of functionalization with alkyl chains, the
antimicrobial effect decreases from 99.99-100 % inhibition of growth for the polymer
PVAm-EA1210, to 90 % inhibition of growth for the polymer PVAm-EA1241. This means that
for the coating thickness tested in this experiment, the polymers with only 10 % and 20 % of
alkyl chains satisfy the criterion for a good antimicrobial effect (≥ 99.99 % inhibition of
CHAPTER 4
127
growth), whereas the polymers with higher concentrations of alkyl chains do not satisfy this
criterion anymore. The antimicrobial effect was again stable over time.
The results show that the linear structure of PVAm leads, compared to the branched structure
of PEI, to a completely different behavior in the antimicrobial activity. In case of the
functionalized PEI all introduced alkyl chains are located at the surface of the polymer and
available for an antimicrobial interaction with the bacterial membrane. In contrast, due to the
linear structure, the polymer chains of PVAm are very flexible and the alkyl chains can self-
assemble to domains within the polymer structure. The alkyl chains inside of the rigid
domains are not available for the antimicrobial activity. In addition, the formation of
hydrophobic domains leads to a reduced solubility of the polymers in aqueous media and
thereby to a reduction of the total availability of the polymers for antimicrobial interactions.
The antimicrobial effect was independent of the wetting agents (DOW or Triton) used. There
was also no difference in the antimicrobial effect if 0.01 % or 0.05 % DOW was used.
Therefore, it can be concluded, that the wetting of the surface was assured. All further
experiments were performed with a concentration of 0.01 % DOW as wetting agent. For all
samples, the measured antimicrobial activity was better under growth than under non-growth
conditions. This observation is a hint that the antimicrobial effect of the tested polymers takes
place more pronouncedly during the bacterial growth, i.e., during cell division and active
metabolism.
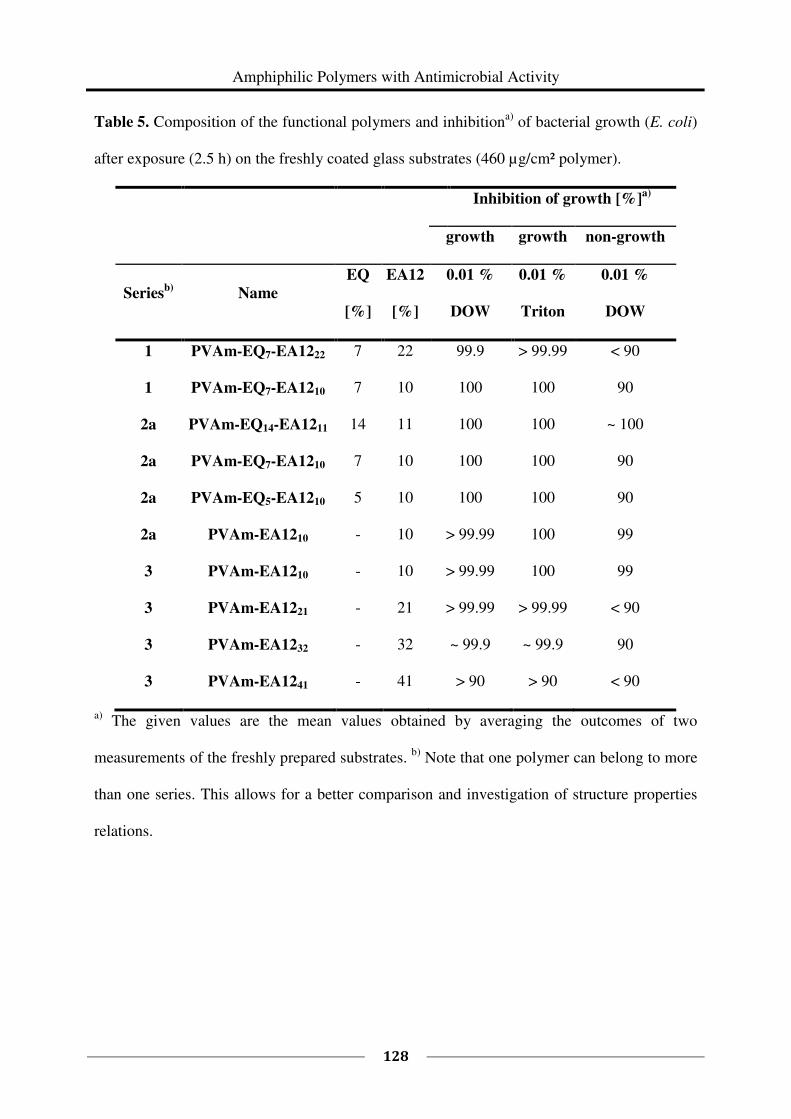
Amphiphilic Polymers with Antimicrobial Activity
128
Table 5. Composition of the functional polymers and inhibitiona)
of bacterial growth (E. coli)
after exposure (2.5 h) on the freshly coated glass substrates (460 µg/cm² polymer).
Inhibition of growth [%]a)
growth growth non-growth
Seriesb)
Name
EQ
[%]
EA12
[%]
0.01 %
DOW
0.01 %
Triton
0.01 %
DOW
1 PVAm-EQ7-EA1222 7 22 99.9 > 99.99 < 90
1 PVAm-EQ7-EA1210 7 10 100 100 90
2a PVAm-EQ14-EA1211 14 11 100 100 ~ 100
2a PVAm-EQ7-EA1210 7 10 100 100 90
2a PVAm-EQ5-EA1210 5 10 100 100 90
2a PVAm-EA1210 - 10 > 99.99 100 99
3 PVAm-EA1210 - 10 > 99.99 100 99
3 PVAm-EA1221 - 21 > 99.99 > 99.99 < 90
3 PVAm-EA1232 - 32 ~ 99.9 ~ 99.9 90
3 PVAm-EA1241 - 41 > 90 > 90 < 90
a) The given values are the mean values obtained by averaging the outcomes of two
measurements of the freshly prepared substrates. b)
Note that one polymer can belong to more
than one series. This allows for a better comparison and investigation of structure properties
relations.
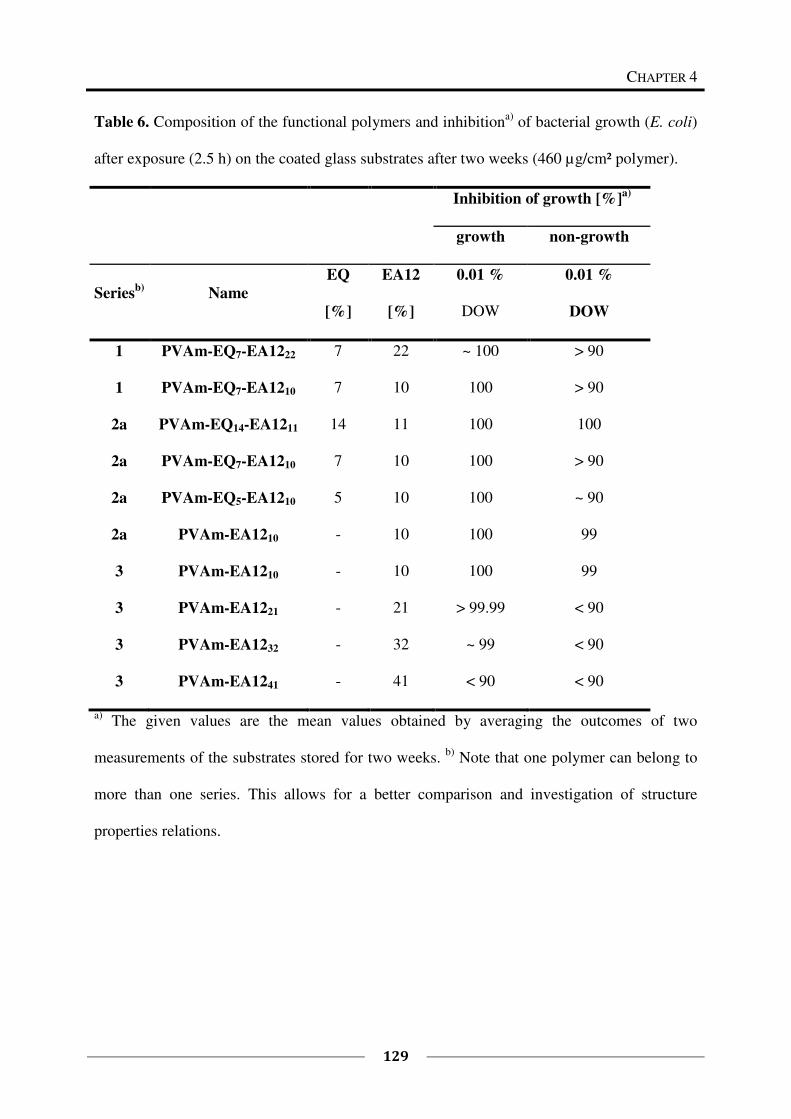
CHAPTER 4
129
Table 6. Composition of the functional polymers and inhibitiona)
of bacterial growth (E. coli)
after exposure (2.5 h) on the coated glass substrates after two weeks (460 µg/cm² polymer).
Inhibition of growth [%]a)
growth non-growth
Seriesb)
Name
EQ
[%]
EA12
[%]
0.01 %
DOW
0.01 %
DOW
1 PVAm-EQ7-EA1222 7 22 ~ 100 > 90
1 PVAm-EQ7-EA1210 7 10 100 > 90
2a PVAm-EQ14-EA1211 14 11 100 100
2a PVAm-EQ7-EA1210 7 10 100 > 90
2a PVAm-EQ5-EA1210 5 10 100 ~ 90
2a PVAm-EA1210 - 10 100 99
3 PVAm-EA1210 - 10 100 99
3 PVAm-EA1221 - 21 > 99.99 < 90
3 PVAm-EA1232 - 32 ~ 99 < 90
3 PVAm-EA1241 - 41 < 90 < 90
a) The given values are the mean values obtained by averaging the outcomes of two
measurements of the substrates stored for two weeks. b)
Note that one polymer can belong to
more than one series. This allows for a better comparison and investigation of structure
properties relations.
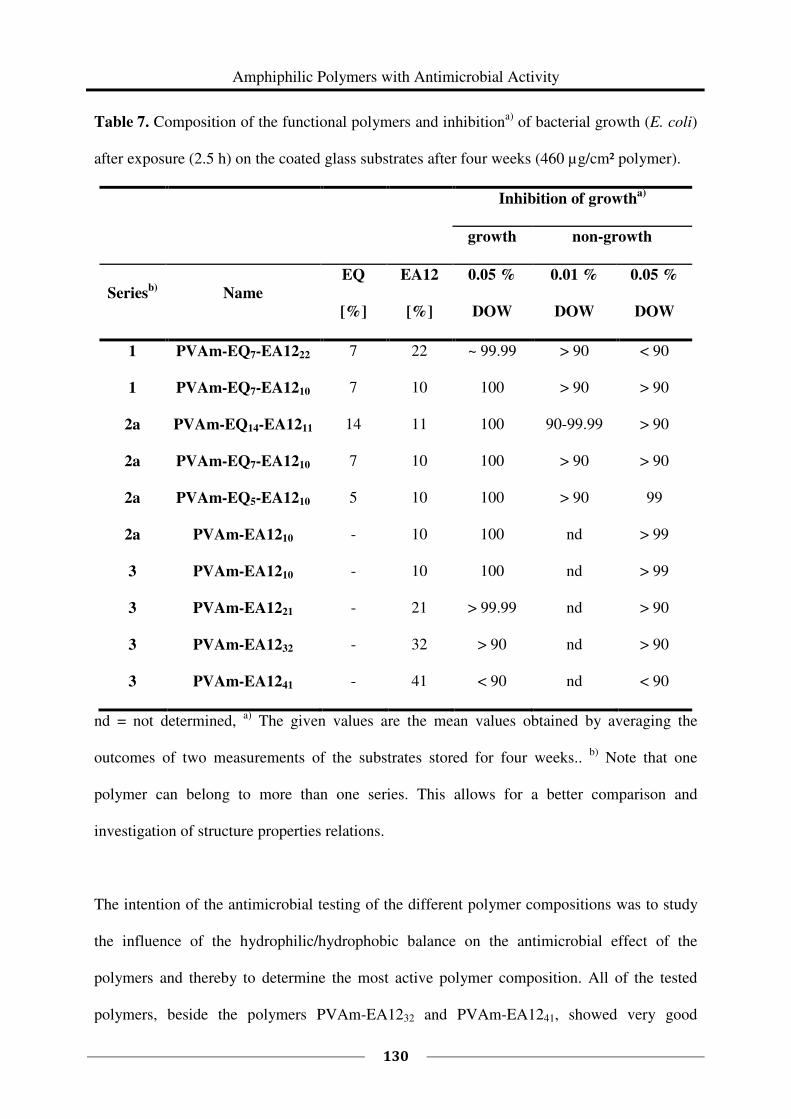
Amphiphilic Polymers with Antimicrobial Activity
130
Table 7. Composition of the functional polymers and inhibitiona)
of bacterial growth (E. coli)
after exposure (2.5 h) on the coated glass substrates after four weeks (460 µg/cm² polymer).
Inhibition of growtha)
growth non-growth
Seriesb)
Name
EQ
[%]
EA12
[%]
0.05 %
DOW
0.01 %
DOW
0.05 %
DOW
1 PVAm-EQ7-EA1222 7 22 ~ 99.99 > 90 < 90
1 PVAm-EQ7-EA1210 7 10 100 > 90 > 90
2a PVAm-EQ14-EA1211 14 11 100 90-99.99 > 90
2a PVAm-EQ7-EA1210 7 10 100 > 90 > 90
2a PVAm-EQ5-EA1210 5 10 100 > 90 99
2a PVAm-EA1210 - 10 100 nd > 99
3 PVAm-EA1210 - 10 100 nd > 99
3 PVAm-EA1221 - 21 > 99.99 nd > 90
3 PVAm-EA1232 - 32 > 90 nd > 90
3 PVAm-EA1241 - 41 < 90 nd < 90
nd = not determined, a)
The given values are the mean values obtained by averaging the
outcomes of two measurements of the substrates stored for four weeks.. b)
Note that one
polymer can belong to more than one series. This allows for a better comparison and
investigation of structure properties relations.
The intention of the antimicrobial testing of the different polymer compositions was to study
the influence of the hydrophilic/hydrophobic balance on the antimicrobial effect of the
polymers and thereby to determine the most active polymer composition. All of the tested
polymers, beside the polymers PVAm-EA1232 and PVAm-EA1241, showed very good
CHAPTER 4
131
antimicrobial results for the tested amount of polymer per cm². The inhibition of growth was
so high that no tendencies with regard to antimicrobial efficiency and degree of
functionalization could be detected. It seems that the amount of the polymer per cm² and
therefore the thickness of the coating has been too high to detect differences. Therefore, the
coating solutions were diluted with methanol (p.a.), coated onto glass substrates and tested
again. With a lower coating thickness, it should be possible to detect differences in the
antimicrobial activity of the tested polymers. Furthermore, in a thinner coating the entire
polymer is in close contact to the surface and is therefore stronger bound to it by ionic
interaction than in a thicker coating. Such a thinner coating thereby makes a leaching of the
material more unlikely.
Substrates Coated with 0.1 wt% and 0.05 wt% Polymer Solutions
To study the influence of the amount of polymer per cm², glass substrates coated with
46 µg/cm² polymer (0.1 wt% polymer solutions) and 23 µg/cm² polymer (0.05 wt% polymer
solutions) were prepared. The antimicrobial effect of the polymers against E. coli was then
tested following the above described method. A concentration of 0.01 % of the wetting agent
DOW was used for all the tests. The test was performed under growth and under non-growth
conditions.
To study the influence of the degree of functionalization with EA12 on the antimicrobial
effect in more detail, Series 3 with different concentrations of EA12 ranging from 10 % to
40 % was tested again. In the test of the coating thickness of 460 µg/cm² polymer, a trend in
the antimicrobial effect had already been observed, but it was not possible to distinguish
between the two polymers with 10 % and 20 % of alkyl chains. Both polymers showed almost
the same antimicrobial effect and had a growth inhibition of > 99.99 % up to a complete
inhibition of growth. To obtain a more distinct trend, these two polymers were tested again
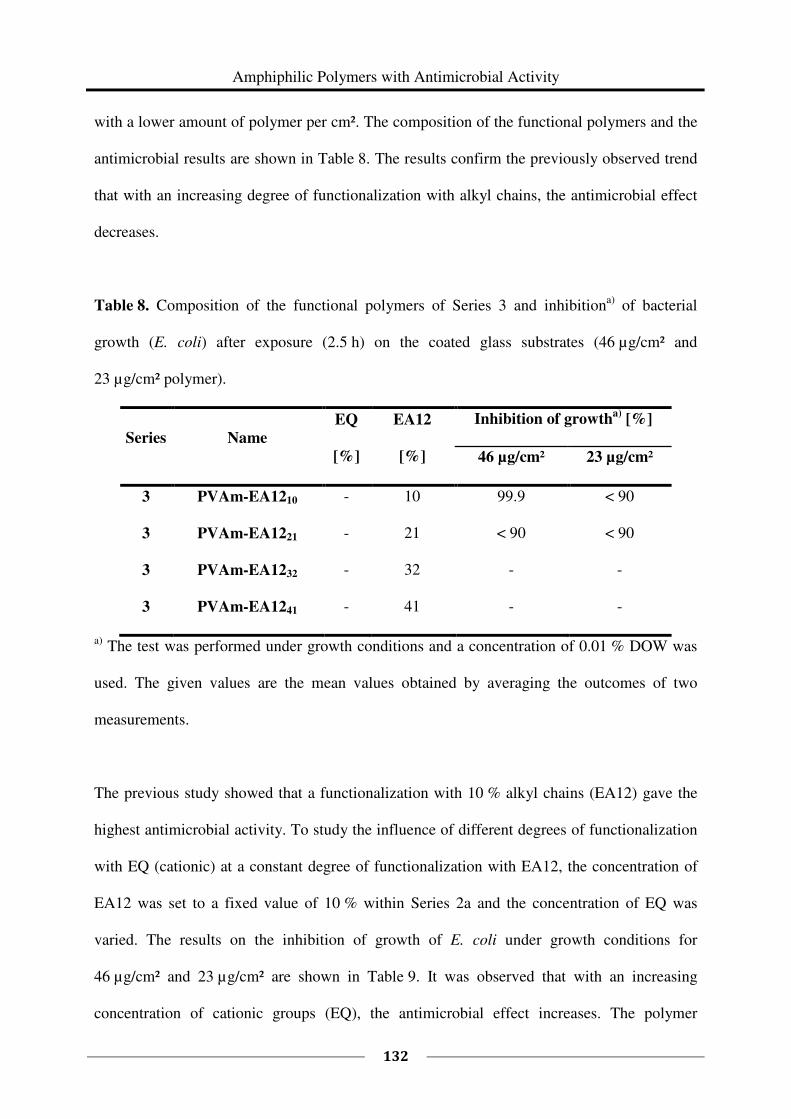
Amphiphilic Polymers with Antimicrobial Activity
132
with a lower amount of polymer per cm². The composition of the functional polymers and the
antimicrobial results are shown in Table 8. The results confirm the previously observed trend
that with an increasing degree of functionalization with alkyl chains, the antimicrobial effect
decreases.
Table 8. Composition of the functional polymers of Series 3 and inhibitiona)
of bacterial
growth (E. coli) after exposure (2.5 h) on the coated glass substrates (46 µg/cm² and
23 µg/cm² polymer).
Series Name
EQ
[%]
EA12
[%]
Inhibition of growtha)
[%]
46 µg/cm² 23 µg/cm²
3 PVAm-EA1210 - 10 99.9 < 90
3 PVAm-EA1221 - 21 < 90 < 90
3 PVAm-EA1232 - 32 - -
3 PVAm-EA1241 - 41 - -
a) The test was performed under growth conditions and a concentration of 0.01 % DOW was
used. The given values are the mean values obtained by averaging the outcomes of two
measurements.
The previous study showed that a functionalization with 10 % alkyl chains (EA12) gave the
highest antimicrobial activity. To study the influence of different degrees of functionalization
with EQ (cationic) at a constant degree of functionalization with EA12, the concentration of
EA12 was set to a fixed value of 10 % within Series 2a and the concentration of EQ was
varied. The results on the inhibition of growth of E. coli under growth conditions for
46 µg/cm² and 23 µg/cm² are shown in Table 9. It was observed that with an increasing
concentration of cationic groups (EQ), the antimicrobial effect increases. The polymer
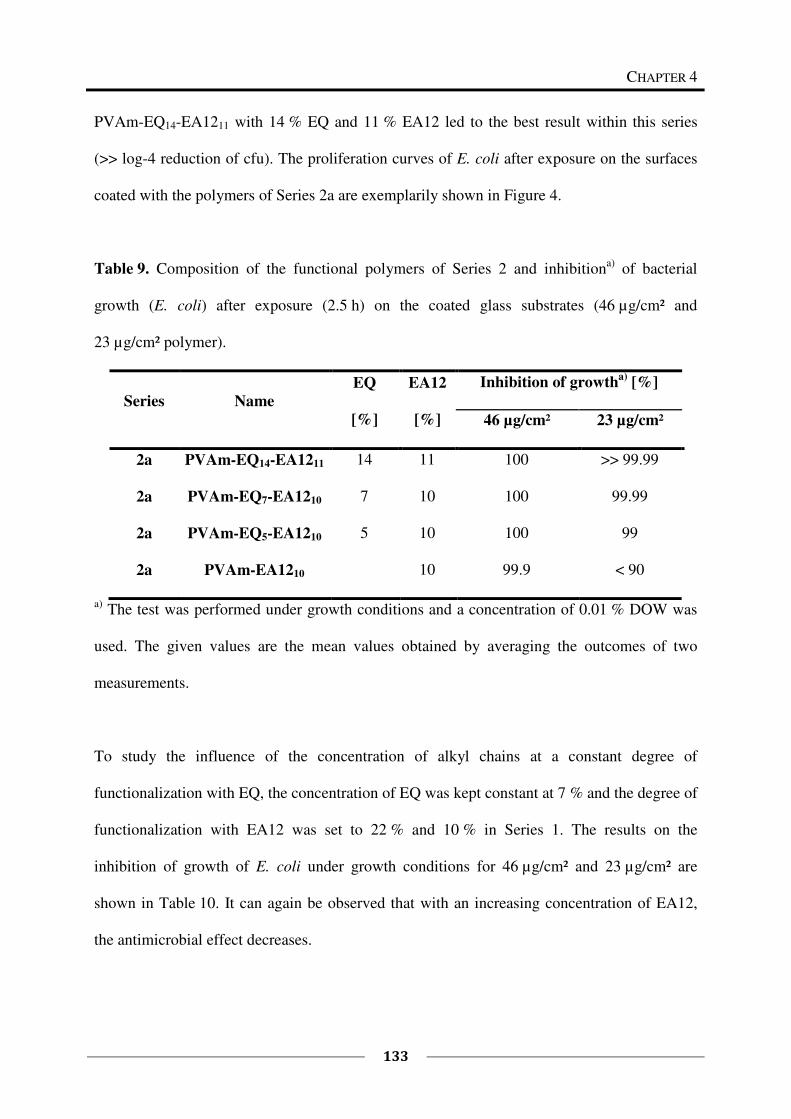
CHAPTER 4
133
PVAm-EQ14-EA1211 with 14 % EQ and 11 % EA12 led to the best result within this series
(>> log-4 reduction of cfu). The proliferation curves of E. coli after exposure on the surfaces
coated with the polymers of Series 2a are exemplarily shown in Figure 4.
Table 9. Composition of the functional polymers of Series 2 and inhibitiona)
of bacterial
growth (E. coli) after exposure (2.5 h) on the coated glass substrates (46 µg/cm² and
23 µg/cm² polymer).
Series Name
EQ
[%]
EA12
[%]
Inhibition of growtha)
[%]
46 µg/cm² 23 µg/cm²
2a PVAm-EQ14-EA1211 14 11 100 >> 99.99
2a PVAm-EQ7-EA1210 7 10 100 99.99
2a PVAm-EQ5-EA1210 5 10 100 99
2a PVAm-EA1210 10 99.9 < 90
a) The test was performed under growth conditions and a concentration of 0.01 % DOW was
used. The given values are the mean values obtained by averaging the outcomes of two
measurements.
To study the influence of the concentration of alkyl chains at a constant degree of
functionalization with EQ, the concentration of EQ was kept constant at 7 % and the degree of
functionalization with EA12 was set to 22 % and 10 % in Series 1. The results on the
inhibition of growth of E. coli under growth conditions for 46 µg/cm² and 23 µg/cm² are
shown in Table 10. It can again be observed that with an increasing concentration of EA12,
the antimicrobial effect decreases.
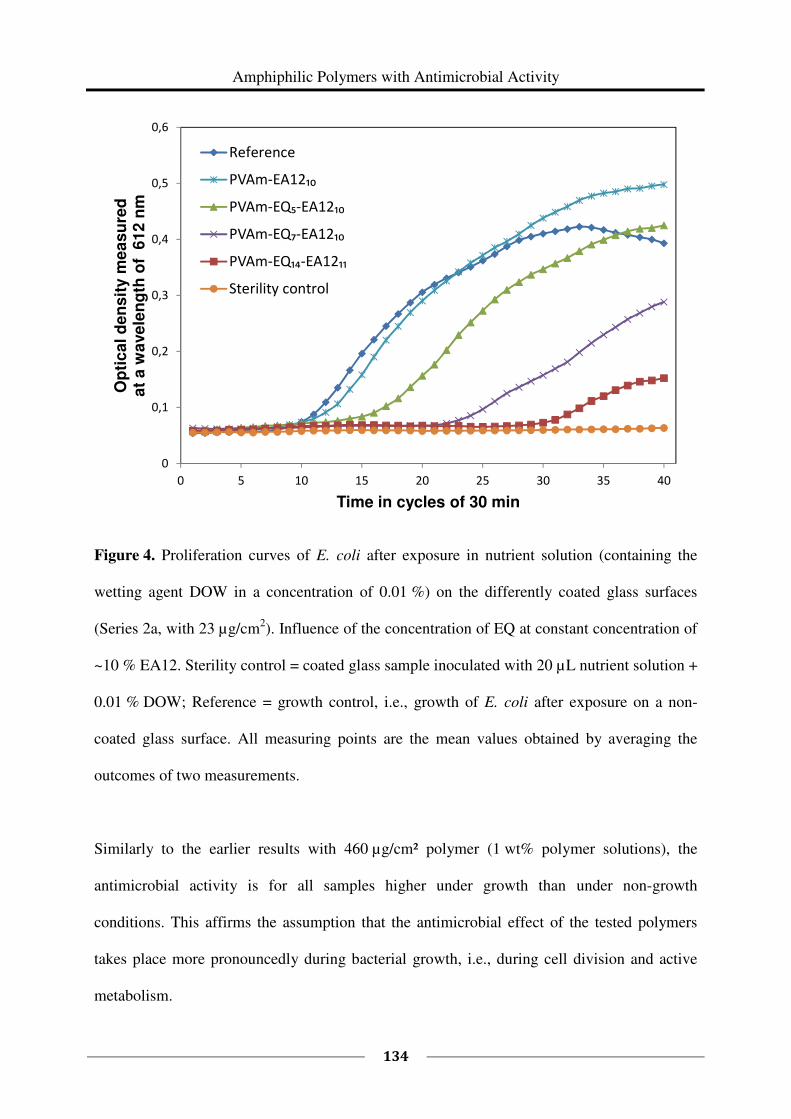
Amphiphilic Polymers with Antimicrobial Activity
134
Figure 4. Proliferation curves of E. coli after exposure in nutrient solution (containing the
wetting agent DOW in a concentration of 0.01 %) on the differently coated glass surfaces
(Series 2a, with 23 µg/cm2). Influence of the concentration of EQ at constant concentration of
~10 % EA12. Sterility control = coated glass sample inoculated with 20 µL nutrient solution +
0.01 % DOW; Reference = growth control, i.e., growth of E. coli after exposure on a non-
coated glass surface. All measuring points are the mean values obtained by averaging the
outcomes of two measurements.
Similarly to the earlier results with 460 µg/cm² polymer (1 wt% polymer solutions), the
antimicrobial activity is for all samples higher under growth than under non-growth
conditions. This affirms the assumption that the antimicrobial effect of the tested polymers
takes place more pronouncedly during bacterial growth, i.e., during cell division and active
metabolism.
0
0,1
0,2
0,3
0,4
0,5
0,6
0 5 10 15 20 25 30 35 40
Op
tic
al d
en
sit
y m
ea
su
red
a
t a
wa
ve
len
gth
of
61
2 n
m
Time in cycles of 30 min
Reference
PVAm-EA12₁₀
PVAm-EQ₅-EA12₁₀
PVAm-EQ₇-EA12₁₀
PVAm-EQ₁₄-EA12₁₁
Sterility control
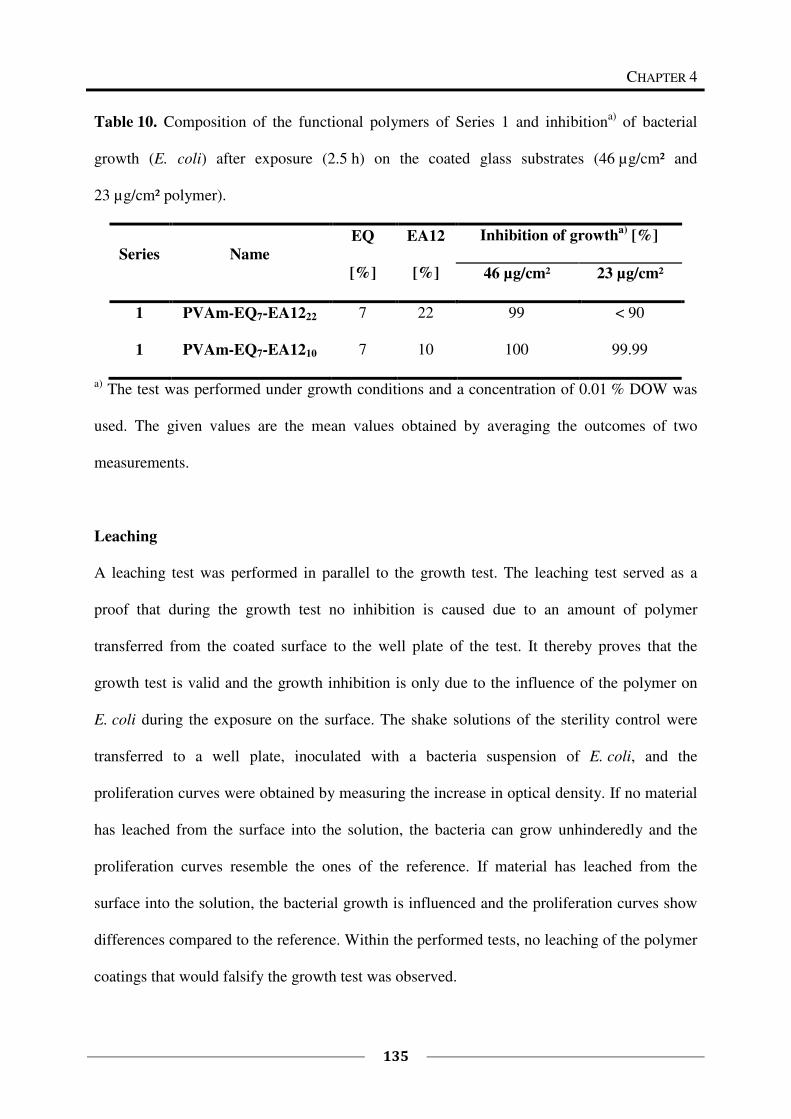
CHAPTER 4
135
Table 10. Composition of the functional polymers of Series 1 and inhibitiona)
of bacterial
growth (E. coli) after exposure (2.5 h) on the coated glass substrates (46 µg/cm² and
23 µg/cm² polymer).
Series Name
EQ
[%]
EA12
[%]
Inhibition of growtha)
[%]
46 µg/cm² 23 µg/cm²
1 PVAm-EQ7-EA1222 7 22 99 < 90
1 PVAm-EQ7-EA1210 7 10 100 99.99
a) The test was performed under growth conditions and a concentration of 0.01 % DOW was
used. The given values are the mean values obtained by averaging the outcomes of two
measurements.
Leaching
A leaching test was performed in parallel to the growth test. The leaching test served as a
proof that during the growth test no inhibition is caused due to an amount of polymer
transferred from the coated surface to the well plate of the test. It thereby proves that the
growth test is valid and the growth inhibition is only due to the influence of the polymer on
E. coli during the exposure on the surface. The shake solutions of the sterility control were
transferred to a well plate, inoculated with a bacteria suspension of E. coli, and the
proliferation curves were obtained by measuring the increase in optical density. If no material
has leached from the surface into the solution, the bacteria can grow unhinderedly and the
proliferation curves resemble the ones of the reference. If material has leached from the
surface into the solution, the bacterial growth is influenced and the proliferation curves show
differences compared to the reference. Within the performed tests, no leaching of the polymer
coatings that would falsify the growth test was observed.
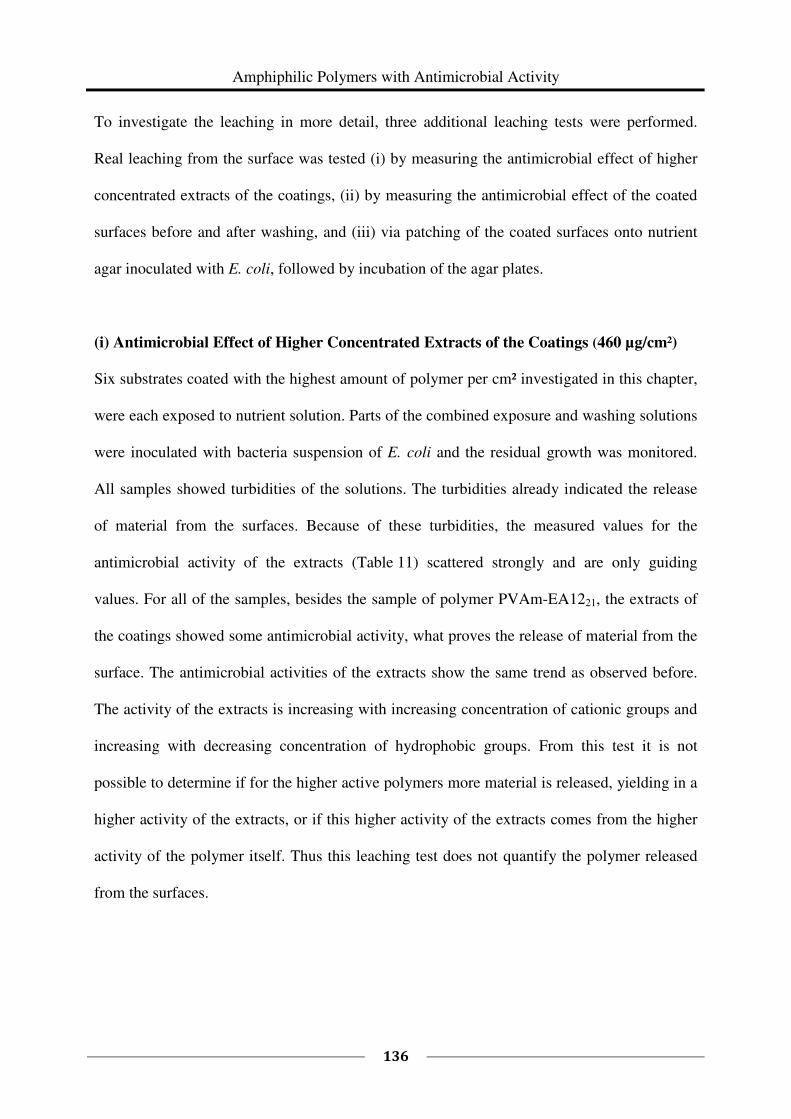
Amphiphilic Polymers with Antimicrobial Activity
136
To investigate the leaching in more detail, three additional leaching tests were performed.
Real leaching from the surface was tested (i) by measuring the antimicrobial effect of higher
concentrated extracts of the coatings, (ii) by measuring the antimicrobial effect of the coated
surfaces before and after washing, and (iii) via patching of the coated surfaces onto nutrient
agar inoculated with E. coli, followed by incubation of the agar plates.
(i) Antimicrobial Effect of Higher Concentrated Extracts of the Coatings (460 µg/cm²)
Six substrates coated with the highest amount of polymer per cm² investigated in this chapter,
were each exposed to nutrient solution. Parts of the combined exposure and washing solutions
were inoculated with bacteria suspension of E. coli and the residual growth was monitored.
All samples showed turbidities of the solutions. The turbidities already indicated the release
of material from the surfaces. Because of these turbidities, the measured values for the
antimicrobial activity of the extracts (Table 11) scattered strongly and are only guiding
values. For all of the samples, besides the sample of polymer PVAm-EA1221, the extracts of
the coatings showed some antimicrobial activity, what proves the release of material from the
surface. The antimicrobial activities of the extracts show the same trend as observed before.
The activity of the extracts is increasing with increasing concentration of cationic groups and
increasing with decreasing concentration of hydrophobic groups. From this test it is not
possible to determine if for the higher active polymers more material is released, yielding in a
higher activity of the extracts, or if this higher activity of the extracts comes from the higher
activity of the polymer itself. Thus this leaching test does not quantify the polymer released
from the surfaces.
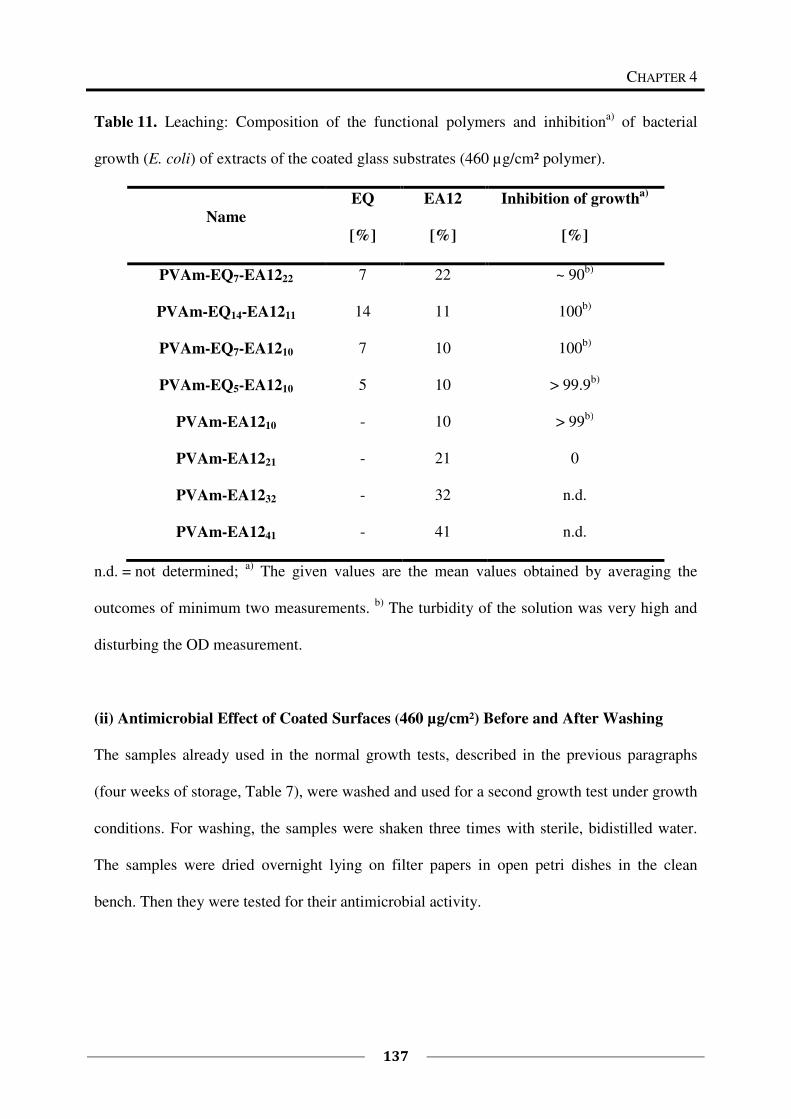
CHAPTER 4
137
Table 11. Leaching: Composition of the functional polymers and inhibitiona)
of bacterial
growth (E. coli) of extracts of the coated glass substrates (460 µg/cm² polymer).
Name
EQ
[%]
EA12
[%]
Inhibition of growtha)
[%]
PVAm-EQ7-EA1222 7 22 ~ 90b)
PVAm-EQ14-EA1211 14 11 100b)
PVAm-EQ7-EA1210 7 10 100b)
PVAm-EQ5-EA1210 5 10 > 99.9b)
PVAm-EA1210 - 10 > 99b)
PVAm-EA1221 - 21 0
PVAm-EA1232 - 32 n.d.
PVAm-EA1241 - 41 n.d.
n.d. = not determined; a)
The given values are the mean values obtained by averaging the
outcomes of minimum two measurements. b)
The turbidity of the solution was very high and
disturbing the OD measurement.
(ii) Antimicrobial Effect of Coated Surfaces (460 µg/cm²) Before and After Washing
The samples already used in the normal growth tests, described in the previous paragraphs
(four weeks of storage, Table 7), were washed and used for a second growth test under growth
conditions. For washing, the samples were shaken three times with sterile, bidistilled water.
The samples were dried overnight lying on filter papers in open petri dishes in the clean
bench. Then they were tested for their antimicrobial activity.
Amphiphilic Polymers with Antimicrobial Activity
138
Table 12. Composition of the functional polymers and inhibitiona)
of bacterial growth
(E. coli, 0.05 % DOW) after exposure under growth conditions (2.5 h) on the coated glass
substrates after washing with sterile bidistilled water (460 µg/cm² polymer, four weeks of
storage).
Name
EQ
[%]
EA12
[%]
Inhibition of growtha)
[%]
before washing after washing
PVAm-EQ7-EA1222 7 22 ~99.99 99
PVAm-EQ14-EA1211 14 11 100 100
PVAm-EQ7-EA1210 7 10 100 100
PVAm-EQ5-EA1210 5 10 100 100
PVAm-EA1210 - 10 100 99.999999
PVAm-EA1221 - 21 >99.99 90
PVAm-EA1232 - 32 >90 90
PVAm-EA1241 - 41 <90 0
a) The test was performed under growth conditions and a concentration of 0.05 % DOW was
used. The given values are the mean values obtained by averaging the outcomes of two
measurements.
The antimicrobial activities of the tested polymer coatings before and after washing are
summarized in Table 12. The samples coated with the polymers PVAm-EQ14-EA1211,
PVAm-EQ5-EA1210, and PVAm-EQ7-EA1210 swell strongly during the washing. The swollen
layers were partly detached through physical abrasion. However, although some material was
released, the growth of E. coli was completely inhibited. The coatings of the other polymers
(PVAm-EQ7-EA1222, PVAm-EA1210, PVAm-EA1221, PVAm-EA1232, and PVAm-EA1241)
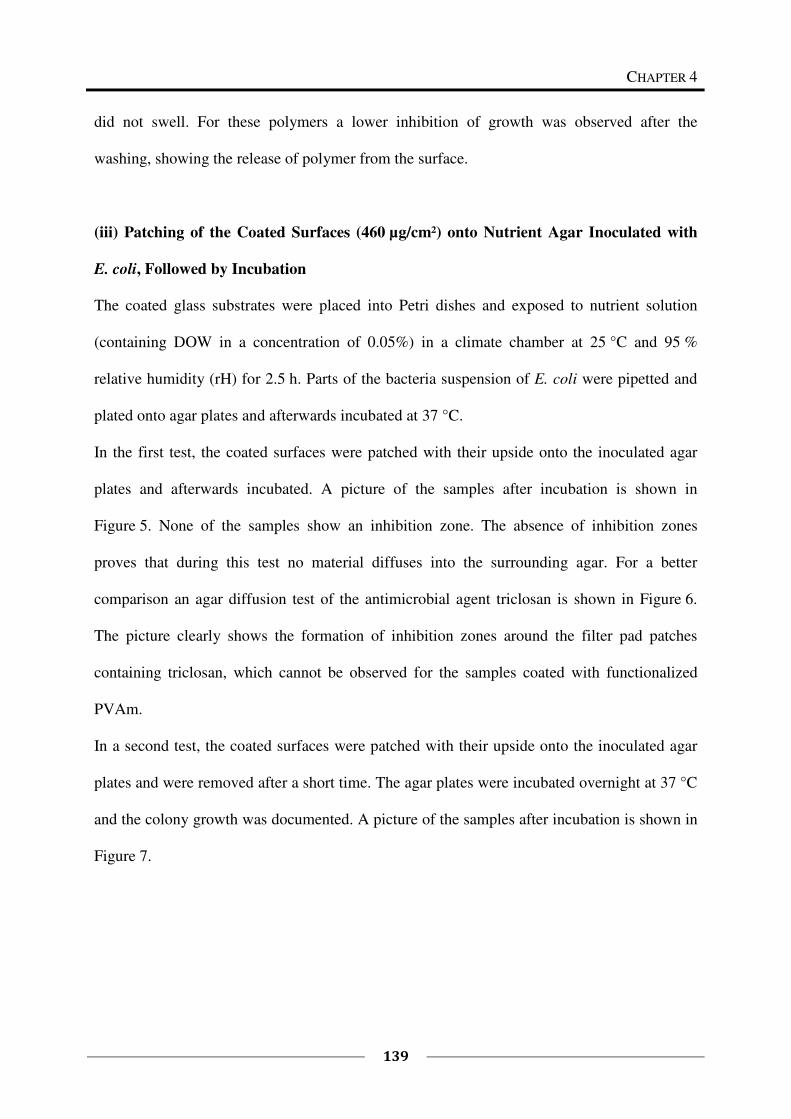
CHAPTER 4
139
did not swell. For these polymers a lower inhibition of growth was observed after the
washing, showing the release of polymer from the surface.
(iii) Patching of the Coated Surfaces (460 µg/cm²) onto Nutrient Agar Inoculated with
E. coli, Followed by Incubation
The coated glass substrates were placed into Petri dishes and exposed to nutrient solution
(containing DOW in a concentration of 0.05%) in a climate chamber at 25 °C and 95 %
relative humidity (rH) for 2.5 h. Parts of the bacteria suspension of E. coli were pipetted and
plated onto agar plates and afterwards incubated at 37 °C.
In the first test, the coated surfaces were patched with their upside onto the inoculated agar
plates and afterwards incubated. A picture of the samples after incubation is shown in
Figure 5. None of the samples show an inhibition zone. The absence of inhibition zones
proves that during this test no material diffuses into the surrounding agar. For a better
comparison an agar diffusion test of the antimicrobial agent triclosan is shown in Figure 6.
The picture clearly shows the formation of inhibition zones around the filter pad patches
containing triclosan, which cannot be observed for the samples coated with functionalized
PVAm.
In a second test, the coated surfaces were patched with their upside onto the inoculated agar
plates and were removed after a short time. The agar plates were incubated overnight at 37 °C
and the colony growth was documented. A picture of the samples after incubation is shown in
Figure 7.
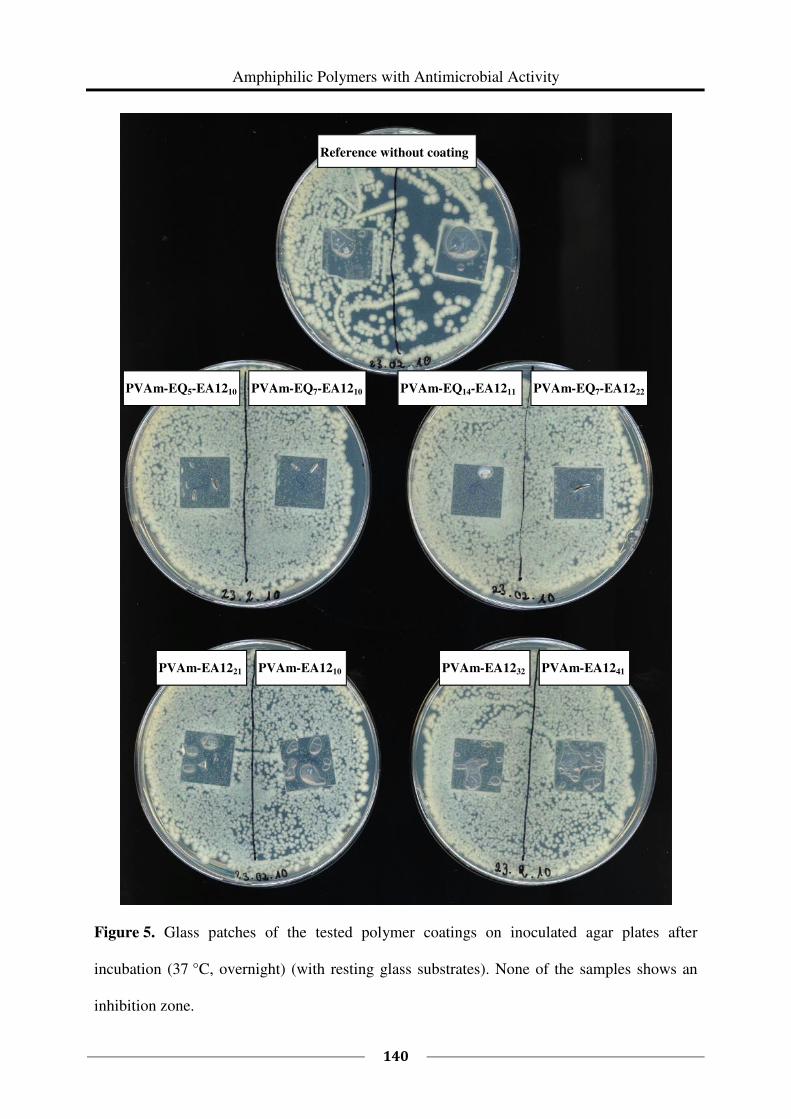
Amphiphilic Polymers with Antimicrobial Activity
140
Figure 5. Glass patches of the tested polymer coatings on inoculated agar plates after
incubation (37 °C, overnight) (with resting glass substrates). None of the samples shows an
inhibition zone.
Reference without coating
PVAm-EQ5-EA1210 PVAm-EQ7-EA1210 PVAm-EQ14-EA1211 PVAm-EQ7-EA1222
PVAm-EA1221 PVAm-EA1210 PVAm-EA1232 PVAm-EA1241
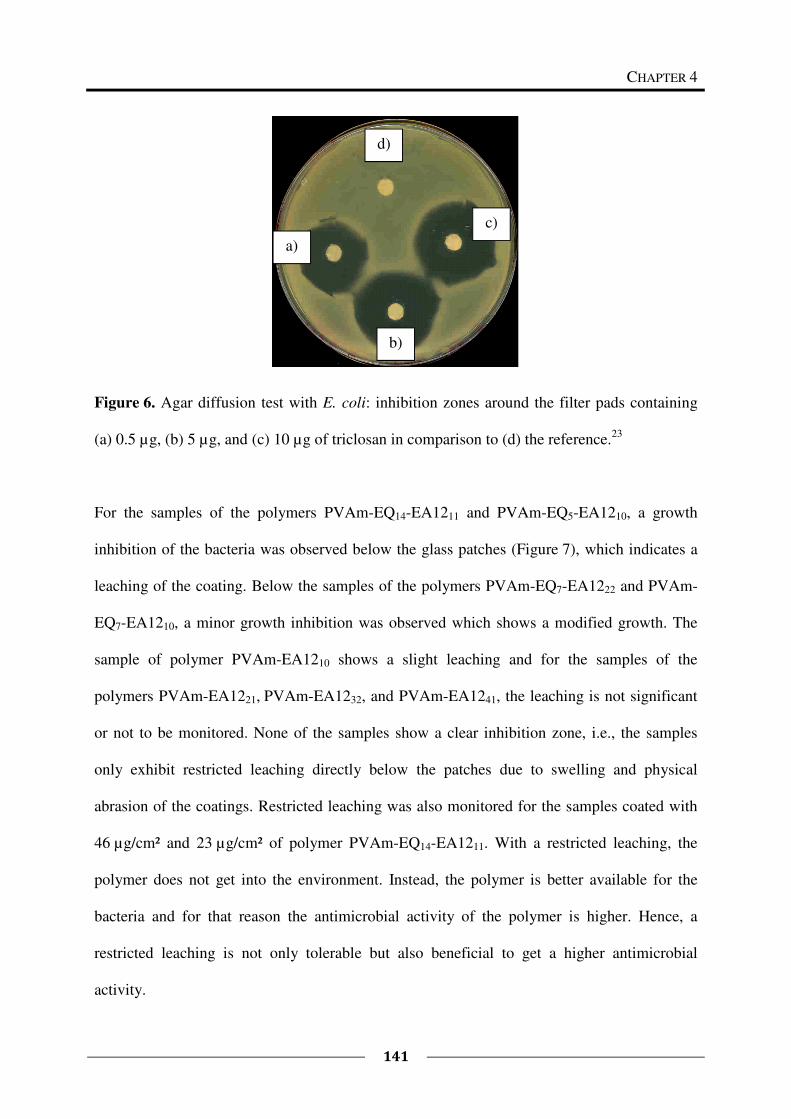
CHAPTER 4
141
Figure 6. Agar diffusion test with E. coli: inhibition zones around the filter pads containing
(a) 0.5 µg, (b) 5 µg, and (c) 10 µg of triclosan in comparison to (d) the reference.23
For the samples of the polymers PVAm-EQ14-EA1211 and PVAm-EQ5-EA1210, a growth
inhibition of the bacteria was observed below the glass patches (Figure 7), which indicates a
leaching of the coating. Below the samples of the polymers PVAm-EQ7-EA1222 and PVAm-
EQ7-EA1210, a minor growth inhibition was observed which shows a modified growth. The
sample of polymer PVAm-EA1210 shows a slight leaching and for the samples of the
polymers PVAm-EA1221, PVAm-EA1232, and PVAm-EA1241, the leaching is not significant
or not to be monitored. None of the samples show a clear inhibition zone, i.e., the samples
only exhibit restricted leaching directly below the patches due to swelling and physical
abrasion of the coatings. Restricted leaching was also monitored for the samples coated with
46 µg/cm² and 23 µg/cm² of polymer PVAm-EQ14-EA1211. With a restricted leaching, the
polymer does not get into the environment. Instead, the polymer is better available for the
bacteria and for that reason the antimicrobial activity of the polymer is higher. Hence, a
restricted leaching is not only tolerable but also beneficial to get a higher antimicrobial
activity.
a)
b)
c)
d)
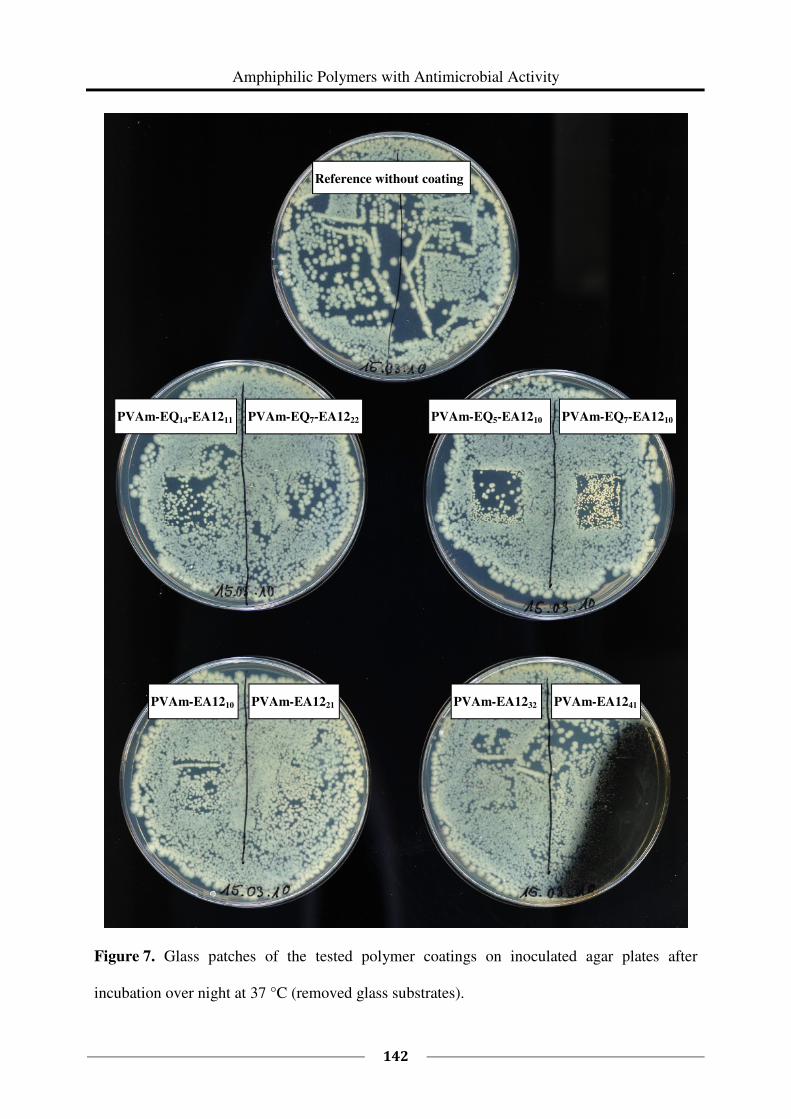
Amphiphilic Polymers with Antimicrobial Activity
142
Figure 7. Glass patches of the tested polymer coatings on inoculated agar plates after
incubation over night at 37 °C (removed glass substrates).
Reference without coating
PVAm-EQ14-EA1211 PVAm-EQ7-EA1222 PVAm-EQ5-EA1210 PVAm-EQ7-EA1210
PVAm-EA1210 PVAm-EA1221 PVAm-EA1232 PVAm-EA1241
CHAPTER 4
143
Spin Coated and Annealed Substrates
As observed and described in the previous paragraphs, the antimicrobial effect increases with
an increasing concentration of cationic groups (EQ) which are introduced into the polymer.
For 23 µg/cm² polymer (0.05 wt% solutions), the polymer PVAm-EQ14-EA1211 (Series 2a)
showed almost a complete inhibition of growth. With the previously described coating
technique of evaporating the solvent overnight, a thinner, homogeneous coating cannot be
obtained. To analyze tendencies within the antimicrobial effect of the polymers with more
than 14 % of cationic groups, a different coating technique was performed. To obtain thinner,
homogeneous coatings, the polymer solution was applied onto the substrates by spin coating.
Silicon wafers have been used as substrate. The silicon substrates were cleaned prior to their
use. The methanolic polymer solutions (1 wt% in MeOH) have been spin coated on the
substrates. To obtain a homogeneous surface and to give the polymer chains time to arrange
in a thermodynamically stable conformation, the coatings were annealed in a methanol
atmosphere for 5 h. The color of the coatings on the silicon wafer during the annealing
changed from a deep blue to green. After removal of the substrates from the methanol
atmosphere the blue color was recovered immediately. For more details on the influence of
the annealing time on the antimicrobial effect and on the reproducibility of the measurements
see Chapter 5. It was found that an annealing time of 5 h leads to homogeneous,
thermodynamically stable coatings and to very good reproducible antimicrobial results.
To perform ellipsometry measurements a reflective surface is needed. The surface of the
silicon wafers is reflective and almost similar to the glass substrates used in previous
experiments. The results are therefore comparable. A coating thickness of about 90 nm was
determined, which corresponds to an amount of 9 µg/cm² polymer. For details on the
ellipsometry measurements and the calculations please see Chapter 5.
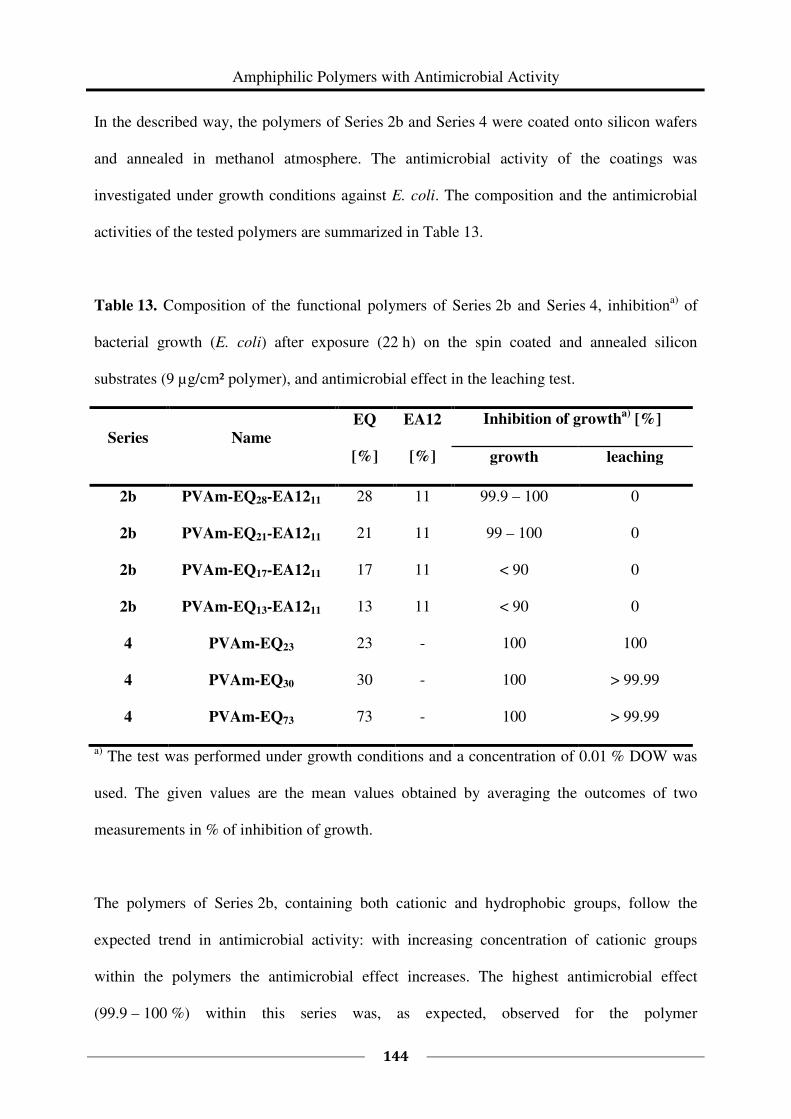
Amphiphilic Polymers with Antimicrobial Activity
144
In the described way, the polymers of Series 2b and Series 4 were coated onto silicon wafers
and annealed in methanol atmosphere. The antimicrobial activity of the coatings was
investigated under growth conditions against E. coli. The composition and the antimicrobial
activities of the tested polymers are summarized in Table 13.
Table 13. Composition of the functional polymers of Series 2b and Series 4, inhibitiona)
of
bacterial growth (E. coli) after exposure (22 h) on the spin coated and annealed silicon
substrates (9 µg/cm² polymer), and antimicrobial effect in the leaching test.
Series Name
EQ
[%]
EA12
[%]
Inhibition of growtha)
[%]
growth leaching
2b PVAm-EQ28-EA1211 28 11 99.9 – 100 0
2b PVAm-EQ21-EA1211 21 11 99 – 100 0
2b PVAm-EQ17-EA1211 17 11 < 90 0
2b PVAm-EQ13-EA1211 13 11 < 90 0
4 PVAm-EQ23 23 - 100 100
4 PVAm-EQ30 30 - 100 > 99.99
4 PVAm-EQ73 73 - 100 > 99.99
a) The test was performed under growth conditions and a concentration of 0.01 % DOW was
used. The given values are the mean values obtained by averaging the outcomes of two
measurements in % of inhibition of growth.
The polymers of Series 2b, containing both cationic and hydrophobic groups, follow the
expected trend in antimicrobial activity: with increasing concentration of cationic groups
within the polymers the antimicrobial effect increases. The highest antimicrobial effect
(99.9 – 100 %) within this series was, as expected, observed for the polymer
CHAPTER 4
145
PVAm-EQ28-EA1211 with the highest concentration of 28 % cationic groups. For Series 2b no
leaching was observed that would falsify the growth test. In contrast, the polymers of Series 4,
containing only cationic groups, show a complete inhibition of growth and a significant
leaching that falsifies the test. The measured antimicrobial effect of the coatings does not
come from the coatings alone. It is also caused by material, which was released from the
coatings and was transferred into the test solution. This different leaching behavior clearly
shows the influence of the introduced hydrophobic groups on the solubility of the polymers
and thereby on the stability of the coatings. Depending on the field of application, the
introduction of alkyl chains into the polymer is beneficial for a stable non leaching coating,
although it decreases the antimicrobial activity.
Antimicrobial Test in Solution
For most of the polymers a direct testing in solution was too imprecise due to the appearance
of turbidity by adding PBS or nutrient solution to the aqueous polymer solutions. With an
increasing concentration of cationic groups (EQ) in the polymer, the solubility in water
increases and the turbidity of the polymer solution (in PBS or nutrient solution) decreases. A
test in solution is therefore possible if the concentration of introduced cationic groups within
the polymer is high enough. The polymers of Series 2b (increasing concentration of cationic
groups at a constant concentration of 11 % alkyl chains) and Series 4 (only cationic groups
with increasing concentration) were tested in solution for their antimicrobial activity against
E. coli.
To determine the minimum inhibitory concentration (MIC) of the polymers, suspensions of
E. coli with defined colony forming units were incubated in nutrient solutions with different
concentrations of the functional polymers. The bacterial growth was followed during the
incubation overnight, by measuring the optical density (OD) of the solutions. Table 14 shows
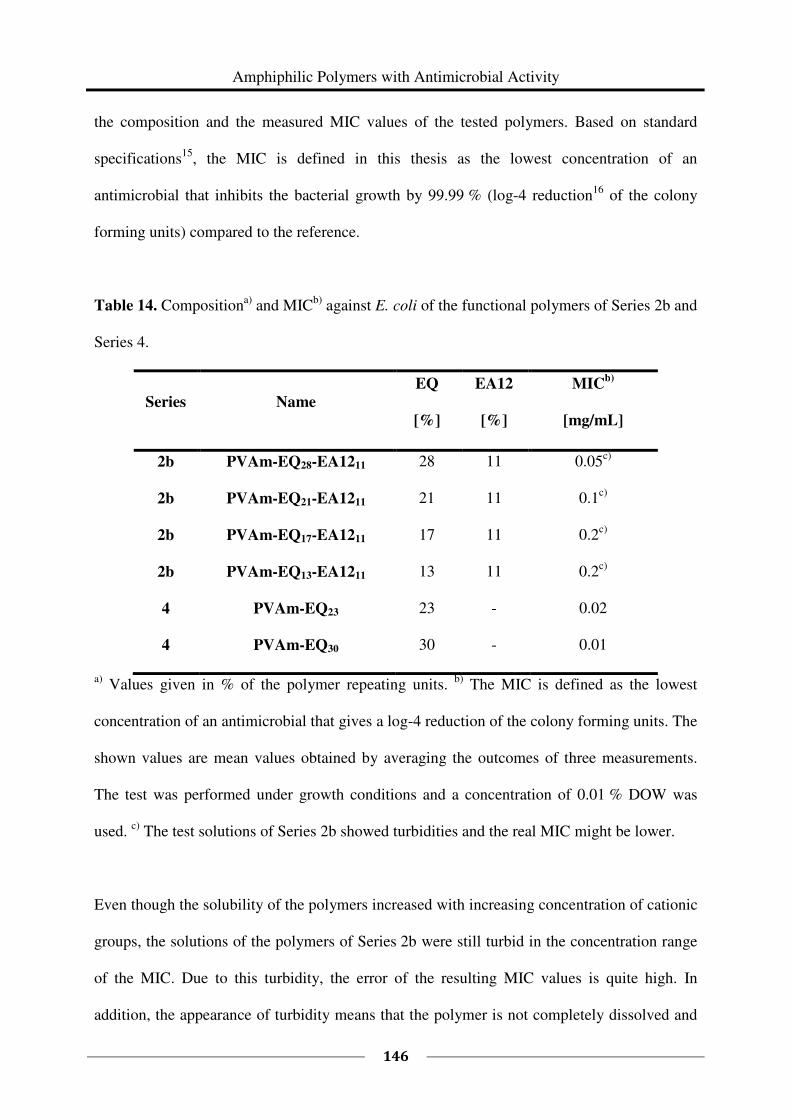
Amphiphilic Polymers with Antimicrobial Activity
146
the composition and the measured MIC values of the tested polymers. Based on standard
specifications15
, the MIC is defined in this thesis as the lowest concentration of an
antimicrobial that inhibits the bacterial growth by 99.99 % (log-4 reduction16
of the colony
forming units) compared to the reference.
Table 14. Compositiona)
and MICb)
against E. coli of the functional polymers of Series 2b and
Series 4.
Series Name
EQ
[%]
EA12
[%]
MICb)
[mg/mL]
2b PVAm-EQ28-EA1211 28 11 0.05c)
2b PVAm-EQ21-EA1211 21 11 0.1c)
2b PVAm-EQ17-EA1211 17 11 0.2c)
2b PVAm-EQ13-EA1211 13 11 0.2c)
4 PVAm-EQ23 23 - 0.02
4 PVAm-EQ30 30 - 0.01
a) Values given in % of the polymer repeating units.
b) The MIC is defined as the lowest
concentration of an antimicrobial that gives a log-4 reduction of the colony forming units. The
shown values are mean values obtained by averaging the outcomes of three measurements.
The test was performed under growth conditions and a concentration of 0.01 % DOW was
used. c)
The test solutions of Series 2b showed turbidities and the real MIC might be lower.
Even though the solubility of the polymers increased with increasing concentration of cationic
groups, the solutions of the polymers of Series 2b were still turbid in the concentration range
of the MIC. Due to this turbidity, the error of the resulting MIC values is quite high. In
addition, the appearance of turbidity means that the polymer is not completely dissolved and
CHAPTER 4
147
that not all of the polymer might be available for an antimicrobial interaction. The real MIC
values can therefore be lower. The solubility of the polymers of Series 4 was very high and
for these polymers no turbidity in the concentration range of the MIC was observed. These
values can therefore be assumed to be reliable.
With Series 2b, the influence of a rising concentration of cationic groups (EQ) (at a constant
concentration of ~11 % alkyl chains (EA12)) on the MIC was studied. As for the previous
studies on substrates, it was observed that with an increasing concentration of cationic groups
(EQ), the antimicrobial effect increases and the MIC values decrease from 0.2 mg/mL (10 %
EQ) to 0.05 mg/mL (28 % EQ). This trend was also observed in Series 4 (only cationic groups
and no alkyl chains) where the MIC decreases from 0.02 mg/mL (23 % EQ) to 0.01 mg/mL
(30 % EQ).
The comparison of the polymers PVAm-EQ21-EA1211 and PVAm-EQ28-EA1211 of Series 2b
with the polymers PVAm-EQ23 and PVAm-EQ30 of Series 4 shows that the introduction of
only 11 % alkyl chains into the polymer significantly decreases the solubility. Due to the
appearance of turbidities, the values of the two series are not directly comparable and can give
only trends. However, the measured MIC values of the polymers of Series 4 are much lower
than the MIC values of the respective polymers of Series 2b. This different activity confirms
the finding from the antimicrobial test on substrates, where it was found that the antimicrobial
activity is decreased by the introduction of alkyl chains.
The described structure solution properties show that for an application of the polymers in
solution, it might be better to introduce cationic groups only. For an application as coating, a
decreased solubility in aqueous solutions can, however, be appreciated and the introduction of
alkyl chains into the polymer can be beneficial to obtain a permanent coating.
Amphiphilic Polymers with Antimicrobial Activity
148
4.3.4 Membrane Penetration in Langmuir Film Experiments
The molecular interaction with lipid films or rather the ability of the developed polymers to
penetrate into membranes was tested for the polymers of Series 2b, Series 3, and Series 4 (for
the compositions of the polymers see Table 4). Therefore, the degree of penetration of the
polymers into Langmuir monolayers of neutral lipids was measured.
An ordered monomolecular lipid layer of DPPC (dipalmitoylphosphatidylcholine) on the
surface of bidistilled water (subphase) in a Langmuir trough was used as model membrane
system. The density of the lipid molecules in the surface monolayer was adjusted by
compression and indicated by the surface pressure of the film. Within this test, an initial
surface pressure of 20 mN/m was used. The layer was compressed with the Langmuir balance
to reach the initial surface pressure. Thereafter, the polymer solution was injected into the
subphase and the increase of surface pressure (mN/m) was recorded for 60 min (Figure 8).
After the 60 min a new equilibrium was established and the surface pressure was stable. An
increased surface pressure shows the adsorption of the polymer to the lipid layer and a
penetration into it. The increase of the surface pressure ∆π is the most widely used parameter
to characterize the membrane affinity/penetration ability of a molecule in Langmuir layer
studies.24,25,26,27,28
Series 2b and Series 4 were tested with two different polymer concentrations (0.025 mg/mL
and 0.075 mg/mL) in the subphase. Series 2b contains polymers with different concentrations
of EQ (cationic groups) and a constant concentration of 11 % EA12 (alkyl chains), whereas
the polymers in Series 4 only contain cationic groups (EQ) in different concentrations and no
alkyl chains. The increase of the surface pressure of the lipid film (∆π) as a result of the
penetration of the polymers into the monolayers of DPPC is shown together with the
concentration of cationic groups in the polymers in Figure 9.
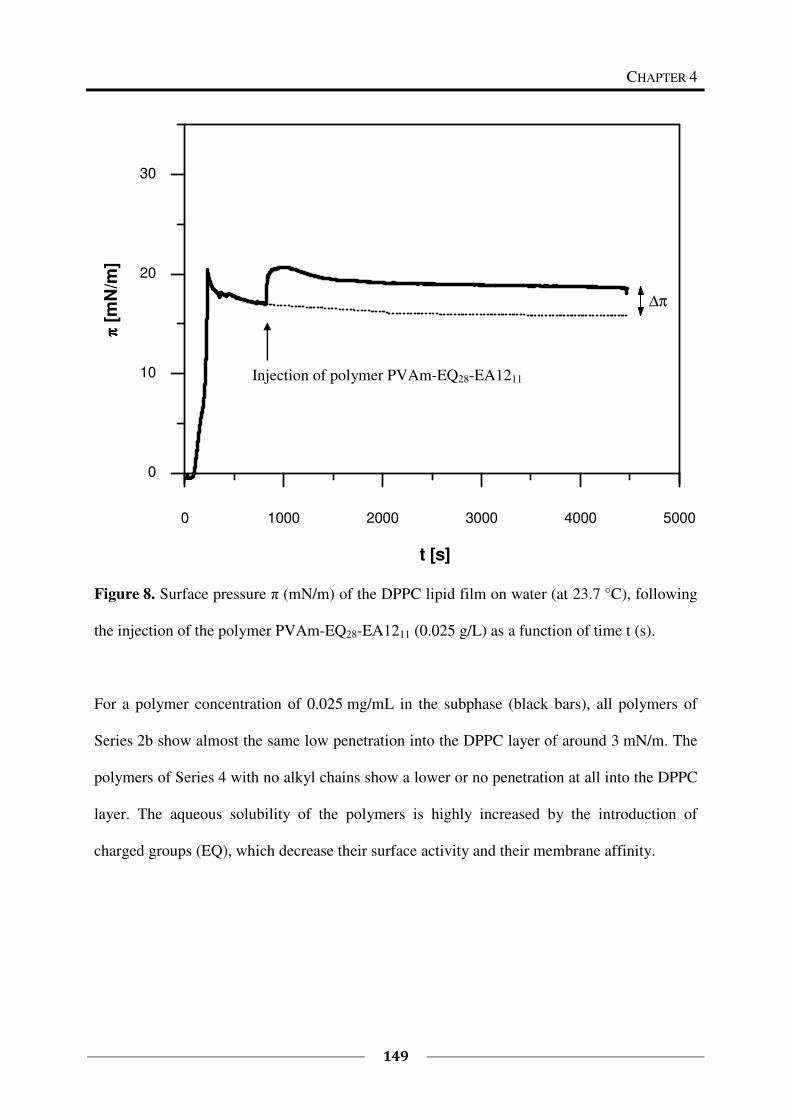
CHAPTER 4
149
Figure 8. Surface pressure π (mN/m) of the DPPC lipid film on water (at 23.7 °C), following
the injection of the polymer PVAm-EQ28-EA1211 (0.025 g/L) as a function of time t (s).
For a polymer concentration of 0.025 mg/mL in the subphase (black bars), all polymers of
Series 2b show almost the same low penetration into the DPPC layer of around 3 mN/m. The
polymers of Series 4 with no alkyl chains show a lower or no penetration at all into the DPPC
layer. The aqueous solubility of the polymers is highly increased by the introduction of
charged groups (EQ), which decrease their surface activity and their membrane affinity.
0 1000 2000 3000 4000 5000
0
10
20
30
ππ ππ [
mN
/m]
�
t [s]
∆π
Injection of polymer PVAm-EQ28-EA1211
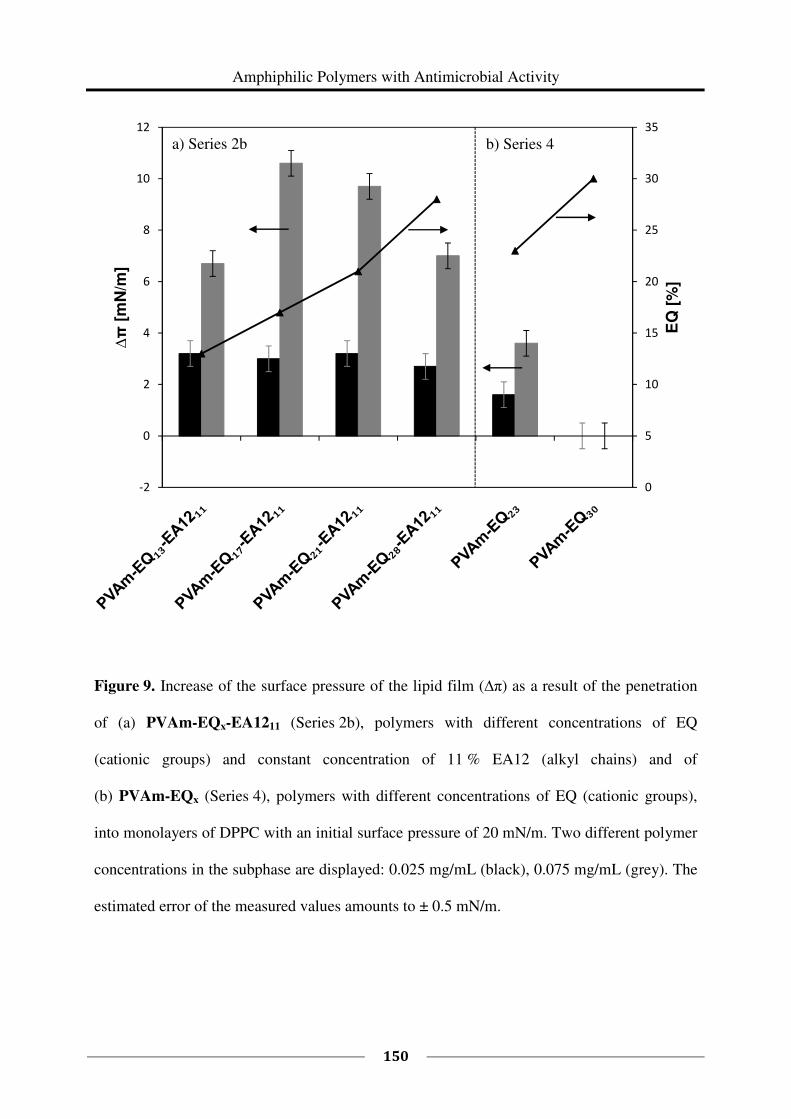
Amphiphilic Polymers with Antimicrobial Activity
150
Figure 9. Increase of the surface pressure of the lipid film (∆π) as a result of the penetration
of (a) PVAm-EQx-EA1211 (Series 2b), polymers with different concentrations of EQ
(cationic groups) and constant concentration of 11 % EA12 (alkyl chains) and of
(b) PVAm-EQx (Series 4), polymers with different concentrations of EQ (cationic groups),
into monolayers of DPPC with an initial surface pressure of 20 mN/m. Two different polymer
concentrations in the subphase are displayed: 0.025 mg/mL (black), 0.075 mg/mL (grey). The
estimated error of the measured values amounts to ± 0.5 mN/m.
0
5
10
15
20
25
30
35
-2
0
2
4
6
8
10
12
EQ
[%
]
∆π
[mN
/m]
a) Series 2b b) Series 4
CHAPTER 4
151
The measurements were repeated with a polymer concentration of 0.075 mg/mL in the
subphase (grey bars). For this higher concentration, a relation between the polymer
composition and the ability of the polymer to penetrate into a lipid membrane can be
observed. The increase in surface pressure (∆π) and therefore the membrane affinity of the
polymers of Series 2b rises in the beginning (with an increasing concentration of cationic
groups) to 10.6 mN/m for the polymer PVAm-EQ17-EA1211 with 17 % EQ. With a further
increasing concentration of cationic groups, the penetration ability decreases. This behavior
shows that the penetration ability reaches a maximum at a concentration of 17 % cationic
groups in the polymer. The membrane affinity is in general higher for the polymers of
Series 2b containing 11 % alkyl chains compared to the polymers of Series 4 without alkyl
chains.
The polymers of Series 3 with different concentrations of EA12 (alkyl chains) were tested
with a polymer concentration of 0.025 mg/mL in the subphase. The increase of the surface
pressure of the lipid film (∆π) as a result of the penetration of the polymers into the
monolayers of DPPC is shown together with the concentration of alkyl chains in the polymers
in Figure 10. A clear trend in the degree of penetration is observable. The penetration ability
of the polymers is a function of the concentration of alkyl chains in the polymer. The
penetration ability increases with an increasing concentration of alkyl chains in the polymer.
It is expected that this trend continues for higher concentrations of alkyl chains and that for
higher concentrations of the polymer in the subphase, higher penetration values can be
reached. A direct test of higher polymer concentrations and higher degrees of
functionalization with alkyl chains was not possible, as the solubility of the polymers in water
decreases with increasing concentration of alkyl chains.
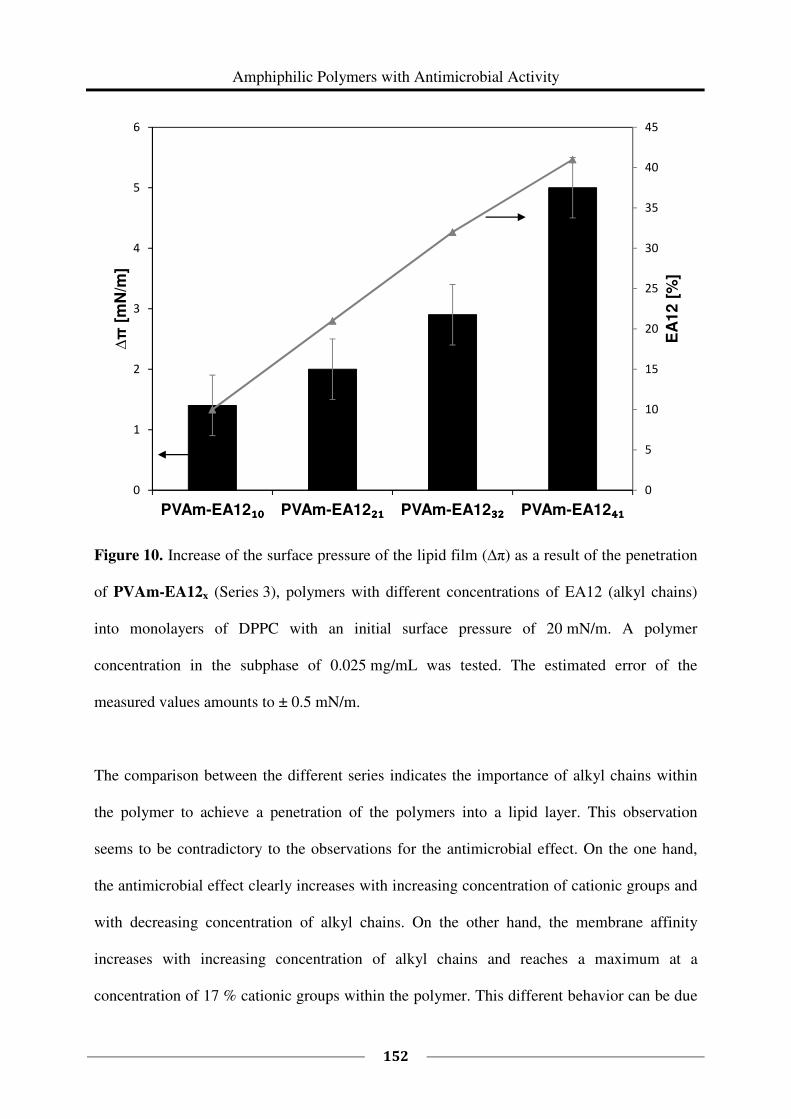
Amphiphilic Polymers with Antimicrobial Activity
152
Figure 10. Increase of the surface pressure of the lipid film (∆π) as a result of the penetration
of PVAm-EA12x (Series 3), polymers with different concentrations of EA12 (alkyl chains)
into monolayers of DPPC with an initial surface pressure of 20 mN/m. A polymer
concentration in the subphase of 0.025 mg/mL was tested. The estimated error of the
measured values amounts to ± 0.5 mN/m.
The comparison between the different series indicates the importance of alkyl chains within
the polymer to achieve a penetration of the polymers into a lipid layer. This observation
seems to be contradictory to the observations for the antimicrobial effect. On the one hand,
the antimicrobial effect clearly increases with increasing concentration of cationic groups and
with decreasing concentration of alkyl chains. On the other hand, the membrane affinity
increases with increasing concentration of alkyl chains and reaches a maximum at a
concentration of 17 % cationic groups within the polymer. This different behavior can be due
0
5
10
15
20
25
30
35
40
45
0
1
2
3
4
5
6
PVAm-EA12₁₀₁₀₁₀₁₀ PVAm-EA12₂₁₂₁₂₁₂₁ PVAm-EA12₃₂₃₂₃₂₃₂ PVAm-EA12₄₁₄₁₄₁₄₁
EA
12
[%
]
∆π
[mN
/m]
CHAPTER 4
153
to different membrane polarities. The DPPC monolayer used for the penetration experiment is
neutral in charge, whereas the bacterial membrane has negative charges on its surface. Thus,
in the case of the DPPC layer, the hydrophobic interaction plays the major role in the
interaction between the polymer and the model membrane system. In contrast, in the case of
the real bacterial membrane, the hydrophilic interaction is essential for the antimicrobial
effect. In the polymer system presented here, the concentration of cationic groups (EQ) (and
thereby the ionic interactions of the polymer with the bacteria) has a greater impact on the
antimicrobial effect than the concentration of alkyl chains in the polymer. The antimicrobial
effect is not caused by the penetration of the alkyl chains into the lipid layer alone. As
described in Chapter 1 there are several ways of antimicrobial action and the penetration into
the lipid layer is only one of them. The antimicrobial effect of the here developed polymers is
caused by a combination of effects and their activity is determined by their hydrophilic-
hydrophobic balance.
4.4 Conclusions
The amphiphilic multifunctional poly(vinyl amine)s were tested for their antimicrobial
activities and the influence of the hydrophilic/hydrophobic balance on the antimicrobial
activity was investigated. It was found that the coating thickness of the polymers has an
impact on the antimicrobial activity. The activity increases with increasing coating thickness.
First the polymers coated on glass surfaces were tested. It was found that with 460 µg/cm² of
functional polymer (on model glass surfaces) for all the polymers (with the exception of the
polymers PVAm-EA1232 and PVAm-EA1241) the inhibition of growth was 99.99 % up to a
complete inhibition of growth. For 23 µg/cm² of functional polymer, it was possible to
determine the influence of the hydrophilic/hydrophobic balance on the antimicrobial effect.
The antimicrobial activity increases with an increasing degree of functionalization with the
Amphiphilic Polymers with Antimicrobial Activity
154
quaternary ammonium group bearing epoxide EQ and decreases with an increasing degree of
functionalization with the long alkyl chain containing epoxide EA12. The polymer PVAm-
EQ14-EA1211 of Series 2a, which contains the highest concentration of cationic groups within
this series, showed the best antimicrobial activity under the polymers tested on coated
substrates prepared by drop casting. Among the substrates which were coated with the lowest
amount of polymer (23 µg/cm²), the polymer PVAm-EQ14-EA1211 gave the highest
antimicrobial activity (>> 99.99 % up to a complete inhibition of growth under growth
conditions). As discussed above, a lower thickness of the coating leading to the same
antimicrobial effect is valuable, because it means that less polymer is needed to achieve the
antimicrobial effect what makes a later application cheaper.
In the second part of the investigation of the antimicrobial effect, the polymers with higher
concentrations of cationic groups were tested on coated substrates prepared by spin coating
followed by annealing in methanol atmosphere, which yields much lower coating thicknesses
than the coating by drop casting. The tests were also carried out in aqueous solution. The
trend already discovered for the substrates coated by drop casting was reconfirmed and
studied in more detail for higher concentrations of cationic groups. For both, the coated
substrates and the aqueous solutions, the antimicrobial effect increases again with an
increasing concentration of cationic groups and a decreasing concentration of alkyl chains.
This shows that the behavior on coated surfaces and in solution is comparable. With an
increasing concentration of cationic groups the solubility of the polymers increased. The
polymers without hydrophobic groups leached from the surface during the antimicrobial test,
whereas the polymers with about 10 % hydrophobic groups were stable on the surface such
that the antimicrobial test was not falsified by a leaching of the material. The polymer
PVAm-EQ28-EA1211 of Series 2b showed with 99.9 % up to a complete inhibition of growth
the highest antimicrobial activity of the polymer coatings which were prepared by spin
CHAPTER 4
155
coating (9 µg/cm²), containing both cationic and hydrophobic groups. The polymers
containing only cationic groups showed higher activities, with complete inhibitions of growth,
but also showed a strong leaching of the coated material from the surface that falsified the
antimicrobial test. The polymers were tested in aqueous solutions and showed low MIC
values down to 0.01 mg/mL for the polymer PVAm-EQ30. It is expected that higher
concentrations of cationic groups give even lower MIC values.
The polymers were tested in Langmuir film experiments for their membrane
affinity/penetration ability of a molecule into a neutral lipid layer of DPPC. It was found that
for this membrane system, the ability of the polymer to penetrate into the lipid layer is
maximal for a concentration of 17 % cationic groups within the polymer and increases with an
increasing concentration of alkyl chains in the polymer. This tendency is different to the trend
in the antimicrobial activity. This difference can be due to distinctions between the membrane
polarity of the model system DPPC (neutral) and the natural bacterial membrane (negative).
The different membrane polarities lead to differences in the interaction of the polymer and the
membrane. In the neutral DPPC lipid layer system, hydrophobic interactions play the major
role, whereas in the case of the negative bacterial membrane, ionic interactions play the
crucial role in the polymer membrane interaction.
Amphiphilic Polymers with Antimicrobial Activity
156
4.5 Literature
1 Infectious Diseases Society of America (IDSA), Clin. Infect. Dis. 2012, 55 (8), 1031-1046.
2 M. E. Falagas, I. A. Bliziotis, Int. J. Antimicrob. Agents 2007, 29, 630–636.
3 M. E. Falagas, P. I. Rafailidis, D. K. Matthaiou, S. Virtzili, D. Nikita, A. Michalopoulos, Int. J. Antimicrob.
Agents 2008, 32, 450–454.
4 R. Valencia, L. A. Arroyo, M. Conde, Infect. Control. Hosp. Epidemiol. 2009, 30, 257–263.
5 M. S. Hoffmann, M. R. Eber, R. Laxminarayan, Infect. Control Hosp. Epidemiol. 2010, 31, 196–197.
6 M. D. Adams, G. C. Nickel, S. Bajaksouzian, Antimicrob. Agents Chemother. 2009, 53, 3628–3634.
7 E. Lautenbach, M. Synnestvedt, M. G. Weiner, Infect. Control Hosp. Epidemiol. 2009, 30, 1186–1192.
8 S. Navon-Venezia, A. Leavitt, Y. Carmeli, J. Antimicrob. Chemother. 2007, 59, 772–774.
9 E. F. Palermo, K. Kuroda, Appl Microbiol Biotechnol 2010, 87, 1605–1615.
10 H. W. Boucher, G. H. Talbot, J. S. Bradley, J. E. Edwards, D. Gilbert, L. B. Rice, M. Scheld, B. Spellberg, J.
Bartlett, Clin. Infect. Dis. 2009, 48, 1–12.
11 P. A. Tran, T. J. Webster, Nanotechnology 2013, 24, 155101/1-155101/7.
12 E. M. Hetrick, M. H. Schoenfisch, Chem. Soc. Rev. 2006, 35, 780-789
13 A. Klibanov, J. Mater. Chem. 2007, 17, 2479–2482.
14 T. Tashiro, Macromol. Mater. Eng. 2001, 286, 63-87.
15 DIN EN ISO 14160:2011-10, German Version EN ISO 14160:2011.
16 Log-Reduction-Fact-Sheet: http://www.garnerdecontaminationsolutions.com/resources/HFI-Log-Reduction-
Chart.pdf.
17 N. J. Hardy, T. H. Richardson, F. Grunfeld, Colloids Surf. A 2006, 202, 284.
18 E. Poptoshev, M. W. Rutland, P. M. Claesson, Langmuir 2000, 16, 1987–1992.
19 A. Shulga, J. Widmaier, E. Pefferkorn, S. Champ, H. Auweter, Journal of Colloid and Interface Science 2003,
258, 219–227.
20 A. Shulga, J. Widmaier, E. Pefferkorn, S. Champ, H. Auweter, Journal of Colloid and Interface Science 2003,
258, 228–234.
21 Antimicrobial testing method for coated substrates developed by DWI an der RWTH Aachen e.V.: EXPOSE.
The testing method was developed on the basis of DIN EN ISO 20743 (a).
CHAPTER 4
157
22 N. Pasquier, Multi-Functional Polymers from Polyamines and Functional Five-Membered Cyclic Carbonates,
In: Dissertation, ITMC, RWTH Aachen 2008.
23 Result shown with permission from: E. Heine, AiF 12865.
24 W. R. Glomm, S. Volden, O. Halskau, Jr., M.-H. G. Ese, Anal. Chem. 2009, 81, 3042.
25 É. Kiss, E. T. Heine, K. Hill, Y-C. He, N. Keusgen, Cs. B. Pénzes, D. Schnöller, G. Gyulai, A. Mendrek, H.
Keul, M. Möller, Macromolecular Bioscience 2012, 12 (9), 1181–1189.
26 Cs. B. Pénzes, D. Schnöller, K. Horváti, Sz. Bősze, G. Mező, É. Kiss, Colloids Surf. A 2012, 413, 142– 148.
27 K. Hill, Cs. B. Pénzes, D. Schnöller, K. Horváti, Sz. Bősze, F. Hudecz, T. Keszthelyi, É. Kiss, Phys. Chem.
Chem. Phys. 2010, 12, 11498–11506.
28 K. Hill, Cs. B. Pénzes, B. G. Vértessy, Z. Szabadka, V. Grolmusz, É. Kiss, Progr. Colloid Polymer Sci. 2008,
135, 87-92.
Amphiphilic Polymers with Antimicrobial Activity
158
CHAPTER 5
159
SYNTHESIS AND CHARACTERIZATION OF POLYMERS
WITH THE SAME COMPOSITION BUT DIFFERENT
MICROSTRUCTURES
5.1 Introduction
In the last decades an increasing interest arose in the structure – antimicrobial property
relation of synthetic polymers. Many of these polymers have been designed to mimic natural
host-defense proteins, such as, e.g., magainins and cecropins.1,2,3,4,5,6,7,8,9,10,11,12,13,14
Such
proteins are produced in all higher forms of life to protect against bacterial infections.15
The
human body produces defensins as host-defense proteins. Defensins are amphiphilic peptides
with a high number of cationic and hydrophobic amino acid residues.16,17,18,19
These residues
build a hydrophobic face and a spatially opposing hydrophilic face in the peptide. The
hydrophilic face can selectively act on bacterial cell membranes which have an overall
negative charge. The mechanism of the antimicrobial action is not yet completely
understood.15
In contrast to synthetic polymers, natural proteins exhibit defined secondary and
tertiary structures beside the defined primary structures. The association of two or more
proteins can result in distinctive quaternary structures. The thereby defined three-dimensional
structure is characteristic and crucial for the biological function of each protein. Vast research
efforts are focusing on the folding principles of sequence-specific heteropolymers (e.g.,
peptoids) with the goal to realize defined three-dimensional structures and to mimic the
functions of natural proteins.20,21,22,23,24,25,26,27,28
The rules governing the kinetics and
thermodynamics of the folding process of the polymer chains into stable secondary and
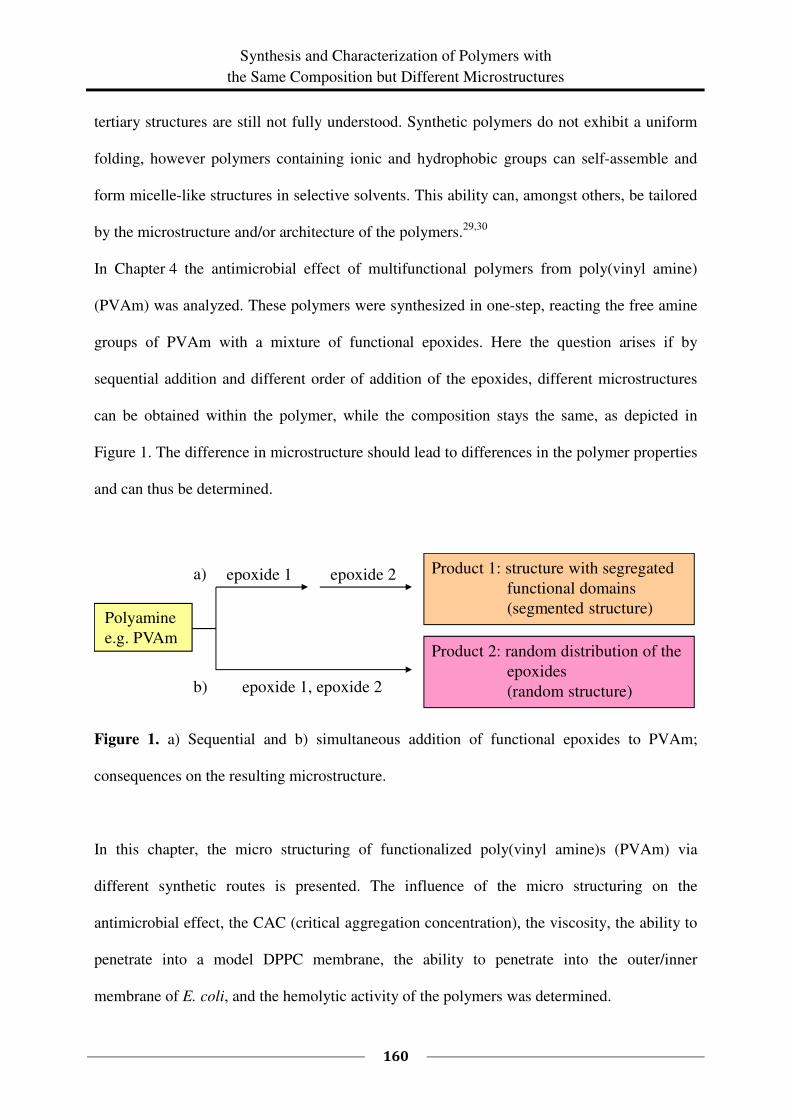
Synthesis and Characterization of Polymers with
the Same Composition but Different Microstructures
160
tertiary structures are still not fully understood. Synthetic polymers do not exhibit a uniform
folding, however polymers containing ionic and hydrophobic groups can self-assemble and
form micelle-like structures in selective solvents. This ability can, amongst others, be tailored
by the microstructure and/or architecture of the polymers.29,30
In Chapter 4 the antimicrobial effect of multifunctional polymers from poly(vinyl amine)
(PVAm) was analyzed. These polymers were synthesized in one-step, reacting the free amine
groups of PVAm with a mixture of functional epoxides. Here the question arises if by
sequential addition and different order of addition of the epoxides, different microstructures
can be obtained within the polymer, while the composition stays the same, as depicted in
Figure 1. The difference in microstructure should lead to differences in the polymer properties
and can thus be determined.
Figure 1. a) Sequential and b) simultaneous addition of functional epoxides to PVAm;
consequences on the resulting microstructure.
In this chapter, the micro structuring of functionalized poly(vinyl amine)s (PVAm) via
different synthetic routes is presented. The influence of the micro structuring on the
antimicrobial effect, the CAC (critical aggregation concentration), the viscosity, the ability to
penetrate into a model DPPC membrane, the ability to penetrate into the outer/inner
membrane of E. coli, and the hemolytic activity of the polymers was determined.
Polyamine
e.g. PVAm
epoxide 1 epoxide 2
epoxide 1, epoxide 2
Product 2: random distribution of the
epoxides
(random structure)
a)
b)
Product 1: structure with segregated
functional domains
(segmented structure)
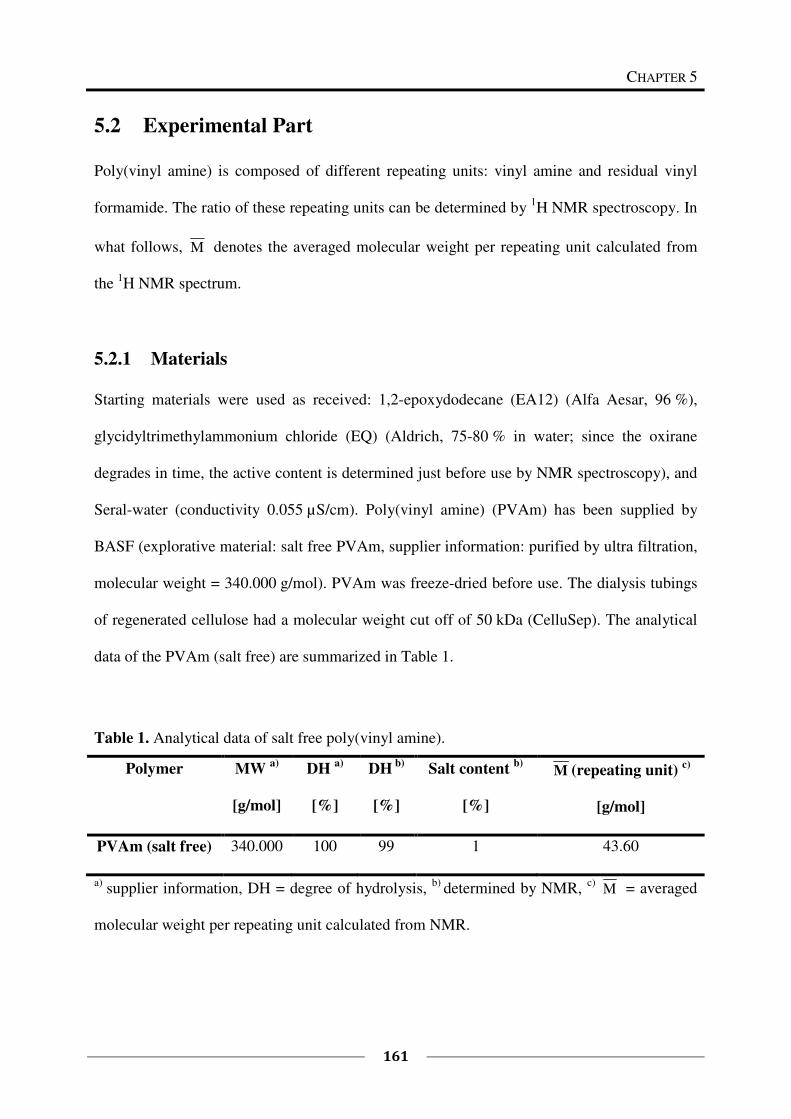
CHAPTER 5
161
5.2 Experimental Part
Poly(vinyl amine) is composed of different repeating units: vinyl amine and residual vinyl
formamide. The ratio of these repeating units can be determined by 1H NMR spectroscopy. In
what follows, M denotes the averaged molecular weight per repeating unit calculated from
the 1H NMR spectrum.
5.2.1 Materials
Starting materials were used as received: 1,2-epoxydodecane (EA12) (Alfa Aesar, 96 %),
glycidyltrimethylammonium chloride (EQ) (Aldrich, 75-80 % in water; since the oxirane
degrades in time, the active content is determined just before use by NMR spectroscopy), and
Seral-water (conductivity 0.055 µS/cm). Poly(vinyl amine) (PVAm) has been supplied by
BASF (explorative material: salt free PVAm, supplier information: purified by ultra filtration,
molecular weight = 340.000 g/mol). PVAm was freeze-dried before use. The dialysis tubings
of regenerated cellulose had a molecular weight cut off of 50 kDa (CelluSep). The analytical
data of the PVAm (salt free) are summarized in Table 1.
Table 1. Analytical data of salt free poly(vinyl amine).
Polymer
MW a)
[g/mol]
DH a)
[%]
DH b)
[%]
Salt content b)
[%]
M (repeating unit) c)
[g/mol]
PVAm (salt free) 340.000 100 99 1 43.60
a) supplier information, DH = degree of hydrolysis,
b) determined by NMR,
c) M = averaged
molecular weight per repeating unit calculated from NMR.
Synthesis and Characterization of Polymers with
the Same Composition but Different Microstructures
162
5.2.2 Measurements
1H and
13C NMR spectra were recorded on a Bruker AV 400 FT-NMR spectrometer at
400 MHz and 100 MHz, respectively. Deuterated methanol (MeOD) was used as solvent and
the solvent’s residual peak was used as internal standard.
The Raman spectra were recorded at room temperature on a Bruker RFS 100S spectrometer
with a Nd: YAG-Laser (1064 nm, 400 mW) at a spectral resolution of 4 cm-1
with 1000 scans.
Fluorescence spectroscopy measurements were performed on a Fluoromax-4P
spectrofluorometer (HORIBA Jobin Yvon). Air-saturated solutions (at 20 °C) were measured
with 90° geometry and a slit opening of 1 nm. An emission wavelength of λEm = 390 nm was
chosen for fluorescence excitation spectra while an excitation wavelength of λEx = 339 nm
was chosen for fluorescence emission spectra. Spectra were accumulated with an integration
time of 30 nm/min.
To prepare the samples for the fluorescence measurements, first a solution of pyrene in
acetone with a concentration of 6 × 10⁻³
mol/L and polymer solutions of 1 mg/mL and
0.01 mg/mL in Seral-water were prepared. To dissolve the polymers, the solutions were
stirred over night at 60 °C. Each sample solution was prepared by adding the pyrene solution
(1 mL, 6 × 10⁻⁶
mol) into an empty vial, evaporating the acetone for 12 h at room temperature,
adding the polymer solution (10 mL) and shaking the solutions for 12 h at 60 °C in a
“Thermoshaker (GFL 3032)”. Samples with polymer concentrations ranging from 1 mg/mL to
0.0001 mg/mL were prepared. For the fluorescence measurements, the solution (ca. 3 mL)
was placed in a quartz cell with a base area of 1.0 × 1.0 cm² and tempered for 15 minutes at
20 °C prior to measurement.
The ellipsometry measurements were performed with an OMT instrument, using the VisuEl
software version 3.4.1 (Optische Messtechnik GmbH) at an angle of incidence of 70º and a
spectral method in the wavelength range from 460 to 870 nm. In order to measure ultrathin
CHAPTER 5
163
coatings, the azimuthal angle was set to 15º. The resulting thickness is obtained by taking the
average of at least 5 measurements from different areas of the silicon substrate.
The contact angle measurements were performed using the sessile drop method with a G40
contact angle measuring instrument (Krüss GmbH), using the DSAII software (drop shape
analyzer). A minimum number of 5 droplets of dist. water were applied onto each sample.
From each droplet, 10 independent sessile drop measurements were performed and the
average contact angles were calculated.
The surface topology of spin coated, thin polymer films was investigated using an atomic
force microscope (AFM) (Nanoscope Multimode IIIa, Digital Instruments, Santa Barbara,
CA, USA). The tapping mode imaging was performed with standard silicon cantilevers
(Nanosensors, Wetzlar, Germany). The force constant and the resonant frequency were
reported by the manufacturer as 42 N/m and 320 kHz, respectively.
The viscosity measurements were performed with an Ubbelohde viscometer for different
polymer concentrations in Seral-water. The resulting measurement points are the mean values
obtained by averaging the outcomes of at least six independent measurements at a constant
temperature of 20 °C.
5.2.3 Name of Prepared Products
Polymers are named using a threefold expression: The first part of this expression denotes the
used poly(vinyl amine). The second and the third part denote the used epoxides and the
corresponding indices show the degrees of functionalization based on the total amount of
amino groups. A number in front of the second and third part assigns the order in which the
epoxides were added to the reaction solution. If there is no number, the epoxides were added
simultaneously. The used abbreviations are given in Table 2.
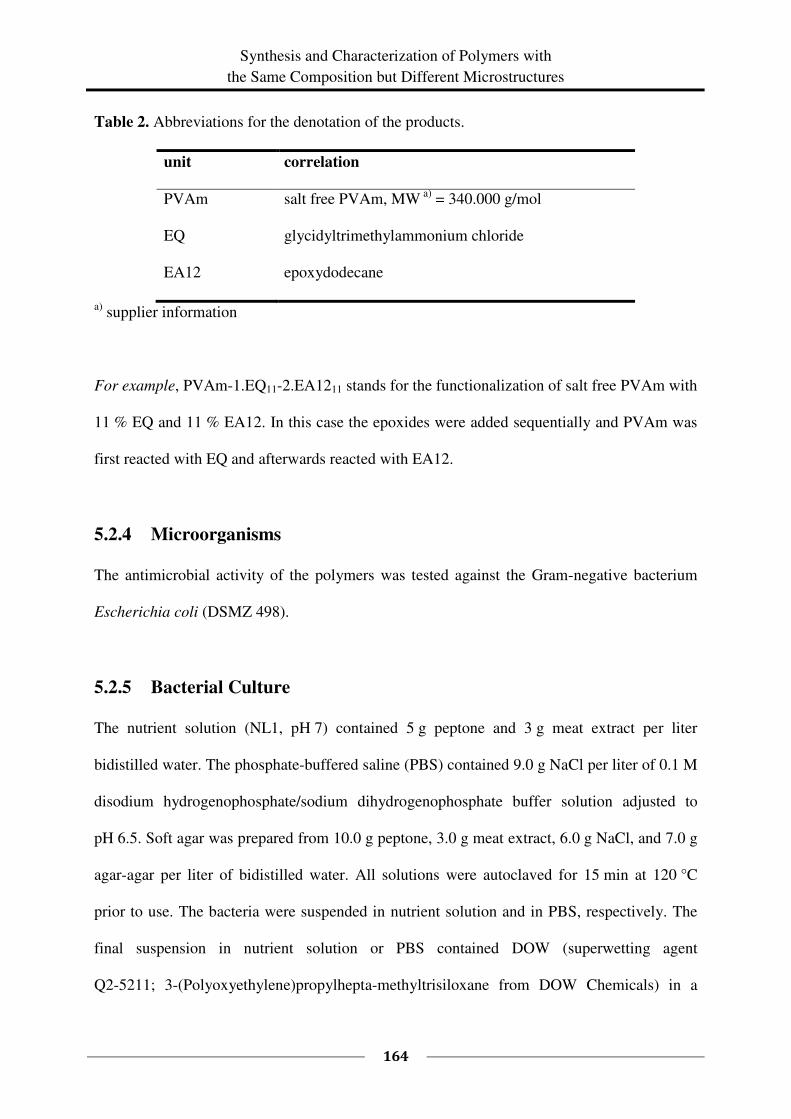
Synthesis and Characterization of Polymers with
the Same Composition but Different Microstructures
164
Table 2. Abbreviations for the denotation of the products.
unit correlation
PVAm salt free PVAm, MW a)
= 340.000 g/mol
EQ glycidyltrimethylammonium chloride
EA12 epoxydodecane
a) supplier information
For example, PVAm-1.EQ11-2.EA1211 stands for the functionalization of salt free PVAm with
11 % EQ and 11 % EA12. In this case the epoxides were added sequentially and PVAm was
first reacted with EQ and afterwards reacted with EA12.
5.2.4 Microorganisms
The antimicrobial activity of the polymers was tested against the Gram-negative bacterium
Escherichia coli (DSMZ 498).
5.2.5 Bacterial Culture
The nutrient solution (NL1, pH 7) contained 5 g peptone and 3 g meat extract per liter
bidistilled water. The phosphate-buffered saline (PBS) contained 9.0 g NaCl per liter of 0.1 M
disodium hydrogenophosphate/sodium dihydrogenophosphate buffer solution adjusted to
pH 6.5. Soft agar was prepared from 10.0 g peptone, 3.0 g meat extract, 6.0 g NaCl, and 7.0 g
agar-agar per liter of bidistilled water. All solutions were autoclaved for 15 min at 120 °C
prior to use. The bacteria were suspended in nutrient solution and in PBS, respectively. The
final suspension in nutrient solution or PBS contained DOW (superwetting agent
Q2-5211; 3-(Polyoxyethylene)propylhepta-methyltrisiloxane from DOW Chemicals) in a
CHAPTER 5
165
concentration of 0.01 % and 2 × 10⁶ colony forming units per mL (cfu/mL). All solutions
were autoclaved for 15 min at 120 °C prior to inoculation.
5.2.6 Surface Coating
Glass substrates (Marienfeld, 18 mm × 18 mm) or silicon wafer cut into pieces (15 mm ×
15 mm) were used as model surfaces. The substrates were ultrasonically cleaned in acetone
(p.a.), dist. water, and isopropanol (p.a.) for 5 minutes each and afterwards dried under
nitrogen-flush. After cleaning, the substrates were directly used for coating.
Drop Casting
150 µL of a methanolic polymer solution (0.05 wt% (w/w), and 0.025wt% (w/w)) were
uniformly casted onto a glass substrate and the solvent was allowed to evaporate overnight.
The polymer concentration can be calculated to be 23 µg/cm² (for the 0.05 wt% polymer
solution) and 11.5 µg/cm² (for the 0.025 wt% polymer solution).
Spin Coating
100 µL of a methanolic polymer solution (1 wt% (w/w)) were applied onto the silicon wafer
and rotated with 2000 revolutions per minute (rpm) for 30 sec.
Annealing in Methanol Atmosphere
The bottom of an exsiccator was filled with methanol up to a level of about 1 cm. The
exsiccator was closed and stored for two days at RT so that a methanol atmosphere had built.
The coated substrates were placed into the exsiccator, annealed in methanol atmosphere, and
removed after defined times.
Synthesis and Characterization of Polymers with
the Same Composition but Different Microstructures
166
5.2.7 Antimicrobial Assessment of Polymer Coatings
Antimicrobial Test of Coated Surfaces
The antimicrobial effect was tested under growth (bacteria suspension in nutrient solution)
conditions. All tests were carried out at least twice (in order to reduce statistical artifacts). To
ensure a complete wetting of the surface enabling the bacteria to interact with the coated
polymer, the wetting agent DOW (Q2-5211; 3-(polyoxyethylene)propylheptamethyltri-
siloxane) was added to the test solutions in a concentration of 0.01 %. The antimicrobial
testing system for coated surfaces is depicted in Figure 2. Substrates coated with
functionalized PVAm (non sterilized) were placed into Petri dishes (Ø = 3 cm) and 20 µL
bacteria suspension of E. coli (2 × 10⁶ colony forming units per mL (cfu/mL)) were
inoculated onto each surface (parallel samples a and b) and covered with a coverslip. As
reference, an uncoated substrate was exposed to 20 µL bacteria suspension of E. coli
(2 × 10⁶ cfu/mL). As sterility control, a coated substrate was exposed to 20 µL of nutrient
solution or PBS, for the testing under growth and under non-growth conditions, respectively
(sample c). The exposure was performed in a climate chamber at 25 °C and 97 % rH (relative
humidity) for 22 h. Thereafter, 1 mL of the nutrient solution was pipetted (dilution 1 : 50) in
every Petri dish (a – c) and the samples were shaken at RT for 30 min with 150 rpm. Then
200 µL solution were transferred from each Petri dish to a well plate in order to monitor the
residual growth (growth test).
Leaching test: 180 µL of the shake solution of sample c (sterility control) were transferred to a
well plate and inoculated with 20 µL bacteria suspension of E. coli (2 × 10⁶ cfu/mL). This
leaching test served as a proof that during the growth test, no inhibition is caused due to an
amount of polymer transferred from the coated surface to the well plate of the growth test,
i.e., as a proof that the growth test is valid and the growth inhibition is only due to the
influence of the polymer on E. coli during the exposure on the surface.
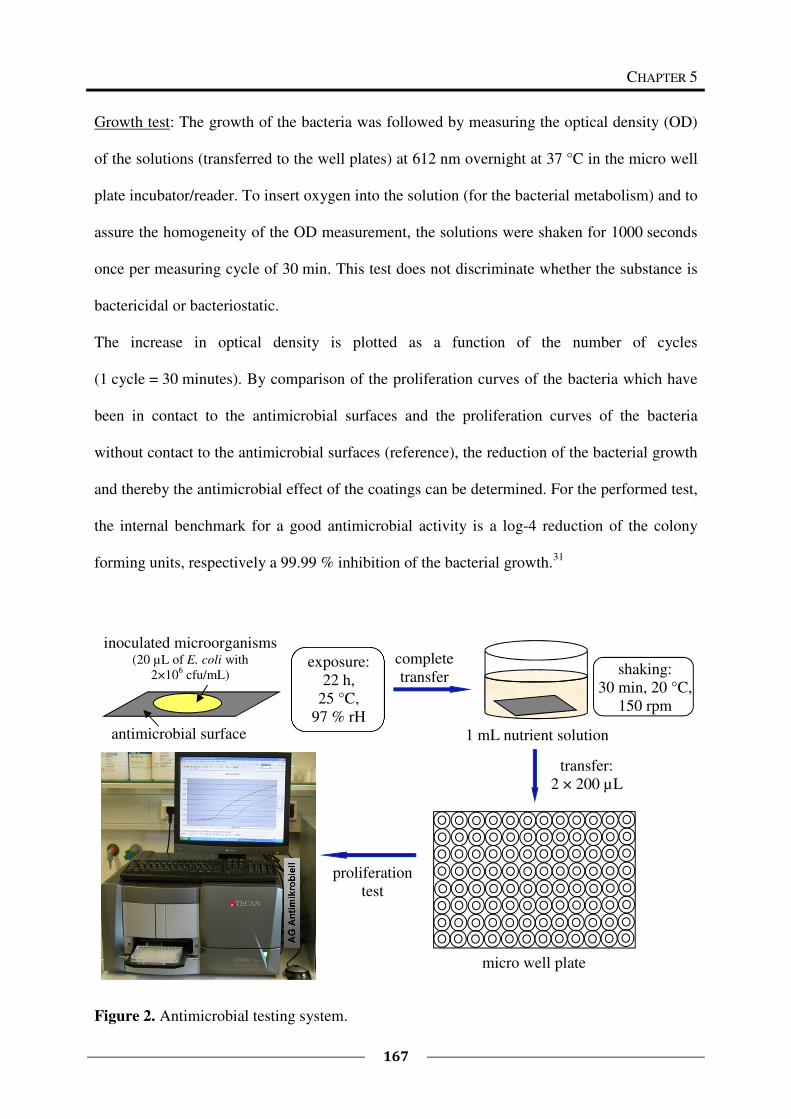
CHAPTER 5
167
Growth test: The growth of the bacteria was followed by measuring the optical density (OD)
of the solutions (transferred to the well plates) at 612 nm overnight at 37 °C in the micro well
plate incubator/reader. To insert oxygen into the solution (for the bacterial metabolism) and to
assure the homogeneity of the OD measurement, the solutions were shaken for 1000 seconds
once per measuring cycle of 30 min. This test does not discriminate whether the substance is
bactericidal or bacteriostatic.
The increase in optical density is plotted as a function of the number of cycles
(1 cycle = 30 minutes). By comparison of the proliferation curves of the bacteria which have
been in contact to the antimicrobial surfaces and the proliferation curves of the bacteria
without contact to the antimicrobial surfaces (reference), the reduction of the bacterial growth
and thereby the antimicrobial effect of the coatings can be determined. For the performed test,
the internal benchmark for a good antimicrobial activity is a log-4 reduction of the colony
forming units, respectively a 99.99 % inhibition of the bacterial growth.31
Figure 2. Antimicrobial testing system.
antimicrobial surface
micro well plate
inoculated microorganisms (20 µL of E. coli with
2×10⁶ cfu/mL)
exposure:
22 h,
25 °C,
97 % rH
shaking:
30 min, 20 °C,
150 rpm
transfer:
2 × 200 µL
proliferation
test
complete
transfer
1 mL nutrient solution
Synthesis and Characterization of Polymers with
the Same Composition but Different Microstructures
168
Antimicrobial Test in Solution
Suspensions of strains with defined colony forming units (E. coli, 6 × 10⁷ cfu/mL) were
incubated at 37 °C in nutrient solutions with different concentrations of the test substances
(functional polymers). The wetting agent DOW (Q2-5211; 3-(Polyoxyethylene)-propylhepta-
methyltrisiloxane) was added to the test solutions in a concentration of 0.01 %. The bacterial
growth was followed during the incubation overnight, by using a micro well plate
reader/incubator and the measurement procedure (growth test) described above. The
experiments were triplicated.
With this test, the minimum inhibitory concentrations (MIC) of the tested polymers were
determined. Based on standard specifications32
, the MIC is defined in this thesis as the lowest
concentration of an antimicrobial that inhibits the bacterial growth by 99.99 % (log-4
reduction33
of the colony forming units) compared to the reference.
5.2.8 Hemolytic Activity
The assessment of the hemolytic activity of the polymers coated onto substrates was
performed by a hemoglobin release assay according to the literature.34
Human erythrocytes
(red blood cells (RBC), blood type 0, Rh positive) were obtained by the centrifugation of
whole blood (3000 rpm, 10 min) to remove the plasma. The RBC were washed three times in
PBS and finally diluted into PBS to obtain a stock suspension containing 3.5 × 10⁸ RBC/mL.
The hemolytic activity of the coated substrates was tested directly on the surface and in
extracts of the substrates. The final amount of RBC in the suspension was 1.2 × 10⁸ RBC/mL.
The RBC were exposed to the surfaces for 3 h at 37 °C, thereafter centrifuged (4000 rpm,
10 min) and the absorption of the supernatant was determined at a wavelength of 414 nm. As
reference solutions, (i) PBS for spontaneous hemolysis and (ii) 1 % Triton X100 for 100 %
hemolysis (positive control) were used.
CHAPTER 5
169
The hemolysis was plotted as a function of the polymer concentration and the hemolytic
activity was defined as the polymer concentration that causes 50 % hemolysis of the human
RBC relative to the positive control (EC50). All experiments were triplicated.
Test Directly on the Surface35
For the test of the hemolytic activity directly on the coated surfaces, the coated samples with a
size of 2.25 cm² were covered with 1.14 mL RBC in PBS (1.2 × 10⁸ RBC/mL) at 37 °C.
Every 30 min, the samples were gently shaken to assure a complete wetting. After 3 h of
incubation, the liquor was separated from the surfaces and was centrifuged for 10 min at
4000 rpm. The supernatant was removed and measured at a wavelength of 414 nm in the
photometer. As positive control (100 % lysis), glass substrates were covered with Triton
X100, dried and incubated with RBC in the same way as the coated samples. Uncoated silicon
wafers, uncoated glass substrates, and PBS buffer were used as further controls.
Test of Surface Extracts36
To test the hemolytic activity of the substrate extracts, the coated substrates were incubated
overnight at 37 °C in 2.28 mL of a 0.01 M PBS solution. Every hour, the vessels were shaken
for 30 min at 120 rpm to assure a full wetting of the surfaces. After 24 h, the extracts were
removed and their hemolysis was tested. Therefore, the extracts were pipetted into 500 µL of
the RBC stock suspension and incubated at 37 °C. The final amount of RBC in the suspension
was 1.2 × 10⁸ RBC/mL. Every 30 min, the samples were gently shaken to assure a complete
wetting. After 3 h of incubation, the RBC suspension was centrifuged (4000 rpm, 10 min) and
the absorption of the supernatant was determined at a wavelength of 414 nm.
Synthesis and Characterization of Polymers with
the Same Composition but Different Microstructures
170
5.2.9 Langmuir Film Experiments
The preparation of the lipid layers and the penetration experiments were carried out37
using a
Langmuir trough (KSV MiniMicro, 5 × 20 × 0.6 cm3) with two barriers to provide a
symmetric film compression. The surface pressure was recorded with an accuracy of
± 0.05 mN/m with the aid of a Wilhelmy plate made of chromatography paper (Whatman
Chr1) which was connected to a force transducer. The trough was made of teflon while the
barriers were made of polyoxymethylene (POM), which has been suggested for lipid layers.38
Dichloromethane (purity ≥ 99.9 %, Spectrum-3D Kft., Hungary) and methanol (purity
≥ 99.9 %, Sigma-Aldrich Kft., Hungary) were used for cleaning the Langmuir trough and the
POM barriers, respectively. Afterwards, the trough and the barriers were rinsed with water.
The trough was placed on a thermo-regulated plate and into a box of plexiglass in order to
minimize air turbulences and possible contaminations. All measurements were performed at
23 ± 0.5 °C. As subphase, bidistilled water, which was checked by its conductivity (< 5 mS)
and surface tension (> 72.0 mN/m at 23 ± 0.5 °C) values, was used.
DPPC (dipalmitoylphosphatidylcholine) was used as lipid for the neutral Langmuir layers and
a mixture of 75 mol% DPPC and 25 mol% DPPG (dipalmitoylphosphatidylglycerol) was used
as lipids for the charged Langmuir layers. For the preparation of the Langmuir layers, 13 µL
of the lipid solution (1.0 g/L in chloroform (purity > 99.8 %, Fisher Chemicals)) were spread
onto the aqueous subphase and the solvent was allowed to evaporate for 10 min before the
compression forming the molecular lipid layer on the surface. Before the penetration
experiment, surface pressure-area isotherms were determined at a barrier speed of
10 cm2/min. The reason for this preliminary process is to bring the lipid layer into a
reproducible state (compactness, ordering of chains). For the penetration experiments, the
lipid monolayer was compressed to a given surface pressure of 20 mN/m. At a fixed barrier
position, the aqueous solution of the polymer was injected below the lipid layer to reach a
CHAPTER 5
171
final polymer concentration of 0.025 mg/mL or 0.075 mg/mL in the subphase (concentration
of the polymer solution = 1 or 3 mg/mL, injected volume: 2.4 mL). The change in surface
pressure (∆π) as indicator of the lipid/polymer interaction was recorded as a function of time
over a period of 1 h. The result of the penetration of the polymer into the lipid monolayer (the
saturation value after 1 h of the increase in surface pressure ∆π) was given as the average of
two independent measurements with an estimated error of ± 0.5 mN/m.
5.2.10 Membrane Permeabilization of E. coli
The permeabilization of the outer/inner membrane was investigated by using the ONPG
hydrolysis assay39
(ONPG = o-Nitrophenyl-β-D-galactopyranosid). The bacterial cells (E. coli
ML35 strain (ATCC 43827)) were grown at 38 °C to mid-log (middle of the exponential
growth phase) in a nutrient solution, containing 5 g/L yeast extract, 10 g/L tryptone and
0.5 g/L sodium chloride. Afterwards, the cells were centrifugated and washed twice with an
equal volume of PBS. The cells were then diluted in PBS to 107 cfu/mL (OD600 ∼ 0.5–0.7)
and 15 µL (∼105 cfu/mL) of this bacteria suspension were added to 165 µL of PBS which
contained 1.5 mM ONPG and between 0.2 mg/mL and 0.5 mg/mL of the respective polymers.
The rate of permeabilization was evaluated by following the hydrolysis of ONPG to o-
nitrophenol (ONP) with a measurement of the absorbance at a wavelength of 405 nm on a
microplate reader (Tecan Infinite 200, Tecan Group Ltd., Switzerland). The maximal
permeabilization (corresponding to 100 % lysis) was determined by evaluating cells which
were pretreated with PopCulture®
reagent (1 – 10 dilution of the bacteria suspension), for
10 min. As positive control (normal bacterial growth), one experiment was performed without
polymer and with only bacteria suspension added whereas as negative control (no bacterial
growth), one experiment was performed with PBS only.
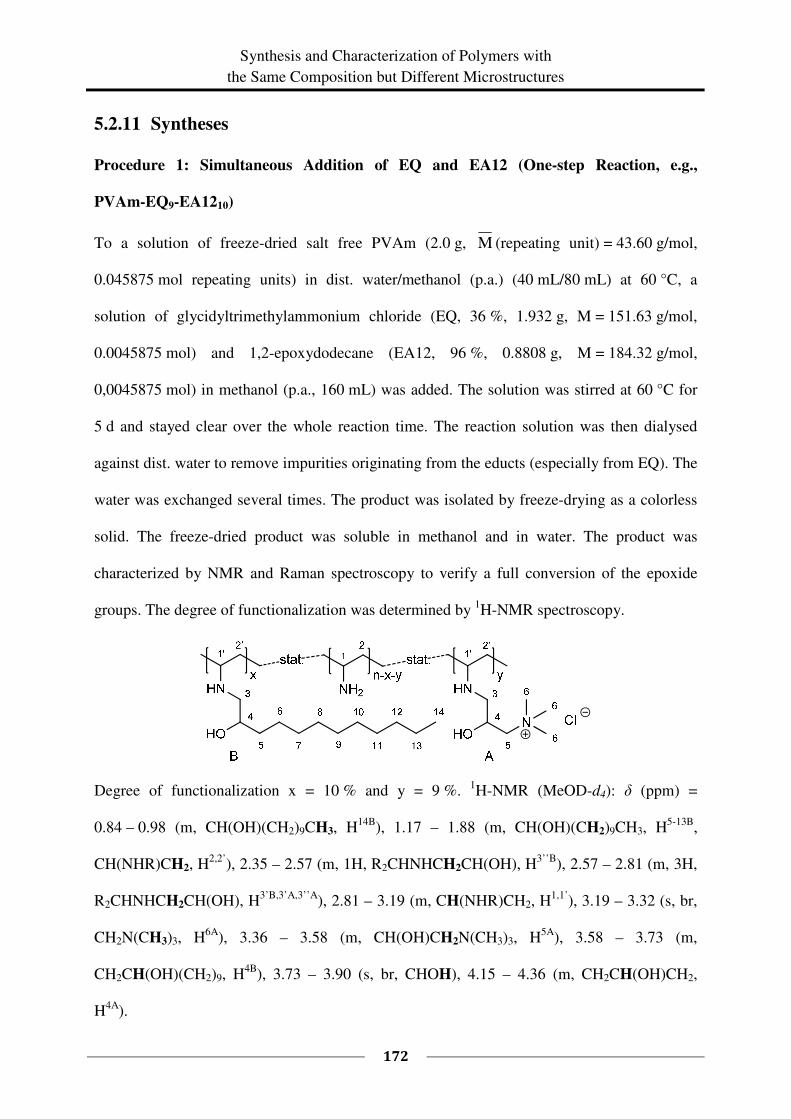
Synthesis and Characterization of Polymers with
the Same Composition but Different Microstructures
172
5.2.11 Syntheses
Procedure 1: Simultaneous Addition of EQ and EA12 (One-step Reaction, e.g.,
PVAm-EQ9-EA1210)
To a solution of freeze-dried salt free PVAm (2.0 g, M (repeating unit) = 43.60 g/mol,
0.045875 mol repeating units) in dist. water/methanol (p.a.) (40 mL/80 mL) at 60 °C, a
solution of glycidyltrimethylammonium chloride (EQ, 36 %, 1.932 g, M = 151.63 g/mol,
0.0045875 mol) and 1,2-epoxydodecane (EA12, 96 %, 0.8808 g, M = 184.32 g/mol,
0,0045875 mol) in methanol (p.a., 160 mL) was added. The solution was stirred at 60 °C for
5 d and stayed clear over the whole reaction time. The reaction solution was then dialysed
against dist. water to remove impurities originating from the educts (especially from EQ). The
water was exchanged several times. The product was isolated by freeze-drying as a colorless
solid. The freeze-dried product was soluble in methanol and in water. The product was
characterized by NMR and Raman spectroscopy to verify a full conversion of the epoxide
groups. The degree of functionalization was determined by 1H-NMR spectroscopy.
Degree of functionalization x = 10 % and y = 9 %. 1H-NMR (MeOD-d4): δ (ppm) =
0.84 – 0.98 (m, CH(OH)(CH2)9CH3, H14B
), 1.17 – 1.88 (m, CH(OH)(CH2)9CH3, H5-13B
,
CH(NHR)CH2, H2,2’
), 2.35 – 2.57 (m, 1H, R2CHNHCH2CH(OH), H3’’B
), 2.57 – 2.81 (m, 3H,
R2CHNHCH2CH(OH), H3’B,3’A,3’’A
), 2.81 – 3.19 (m, CH(NHR)CH2, H1,1’
), 3.19 – 3.32 (s, br,
CH2N(CH3)3, H6A
), 3.36 – 3.58 (m, CH(OH)CH2N(CH3)3, H5A
), 3.58 – 3.73 (m,
CH2CH(OH)(CH2)9, H4B
), 3.73 – 3.90 (s, br, CHOH), 4.15 – 4.36 (m, CH2CH(OH)CH2,
H4A
).
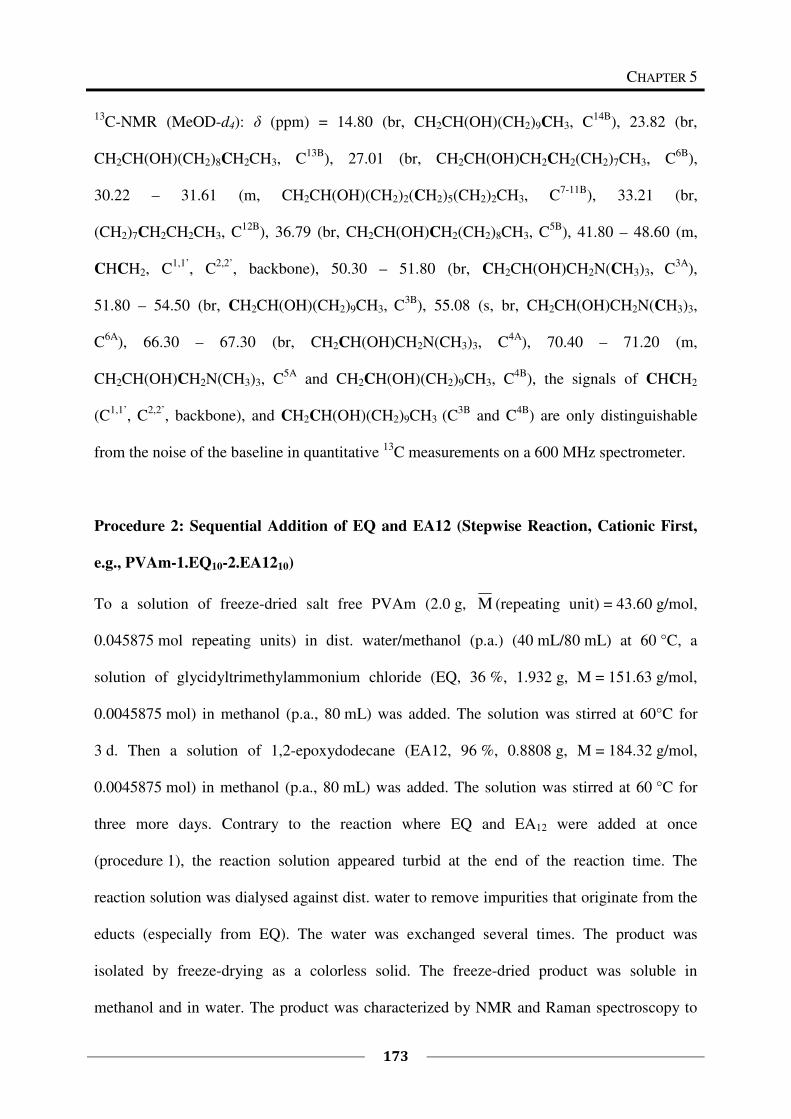
CHAPTER 5
173
13C-NMR (MeOD-d4): δ (ppm) = 14.80 (br, CH2CH(OH)(CH2)9CH3, C
14B), 23.82 (br,
CH2CH(OH)(CH2)8CH2CH3, C13B
), 27.01 (br, CH2CH(OH)CH2CH2(CH2)7CH3, C6B
),
30.22 – 31.61 (m, CH2CH(OH)(CH2)2(CH2)5(CH2)2CH3, C7-11B
), 33.21 (br,
(CH2)7CH2CH2CH3, C12B
), 36.79 (br, CH2CH(OH)CH2(CH2)8CH3, C5B
), 41.80 – 48.60 (m,
CHCH2, C1,1’
, C2,2’
, backbone), 50.30 – 51.80 (br, CH2CH(OH)CH2N(CH3)3, C3A
),
51.80 – 54.50 (br, CH2CH(OH)(CH2)9CH3, C3B
), 55.08 (s, br, CH2CH(OH)CH2N(CH3)3,
C6A
), 66.30 – 67.30 (br, CH2CH(OH)CH2N(CH3)3, C4A
), 70.40 – 71.20 (m,
CH2CH(OH)CH2N(CH3)3, C5A
and CH2CH(OH)(CH2)9CH3, C4B
), the signals of CHCH2
(C1,1’
, C2,2’
, backbone), and CH2CH(OH)(CH2)9CH3 (C3B
and C4B
) are only distinguishable
from the noise of the baseline in quantitative 13
C measurements on a 600 MHz spectrometer.
Procedure 2: Sequential Addition of EQ and EA12 (Stepwise Reaction, Cationic First,
e.g., PVAm-1.EQ10-2.EA1210)
To a solution of freeze-dried salt free PVAm (2.0 g, M (repeating unit) = 43.60 g/mol,
0.045875 mol repeating units) in dist. water/methanol (p.a.) (40 mL/80 mL) at 60 °C, a
solution of glycidyltrimethylammonium chloride (EQ, 36 %, 1.932 g, M = 151.63 g/mol,
0.0045875 mol) in methanol (p.a., 80 mL) was added. The solution was stirred at 60°C for
3 d. Then a solution of 1,2-epoxydodecane (EA12, 96 %, 0.8808 g, M = 184.32 g/mol,
0.0045875 mol) in methanol (p.a., 80 mL) was added. The solution was stirred at 60 °C for
three more days. Contrary to the reaction where EQ and EA12 were added at once
(procedure 1), the reaction solution appeared turbid at the end of the reaction time. The
reaction solution was dialysed against dist. water to remove impurities that originate from the
educts (especially from EQ). The water was exchanged several times. The product was
isolated by freeze-drying as a colorless solid. The freeze-dried product was soluble in
methanol and in water. The product was characterized by NMR and Raman spectroscopy to
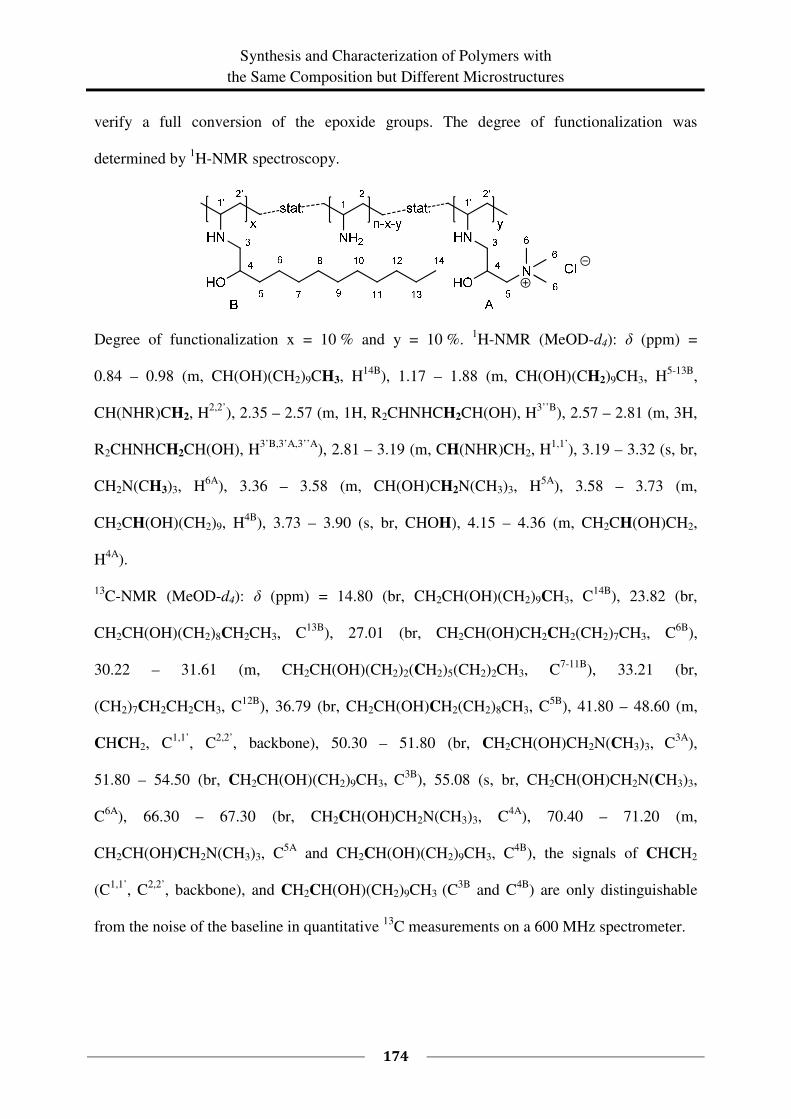
Synthesis and Characterization of Polymers with
the Same Composition but Different Microstructures
174
verify a full conversion of the epoxide groups. The degree of functionalization was
determined by 1H-NMR spectroscopy.
Degree of functionalization x = 10 % and y = 10 %. 1H-NMR (MeOD-d4): δ (ppm) =
0.84 – 0.98 (m, CH(OH)(CH2)9CH3, H14B
), 1.17 – 1.88 (m, CH(OH)(CH2)9CH3, H5-13B
,
CH(NHR)CH2, H2,2’
), 2.35 – 2.57 (m, 1H, R2CHNHCH2CH(OH), H3’’B
), 2.57 – 2.81 (m, 3H,
R2CHNHCH2CH(OH), H3’B,3’A,3’’A
), 2.81 – 3.19 (m, CH(NHR)CH2, H1,1’
), 3.19 – 3.32 (s, br,
CH2N(CH3)3, H6A
), 3.36 – 3.58 (m, CH(OH)CH2N(CH3)3, H5A
), 3.58 – 3.73 (m,
CH2CH(OH)(CH2)9, H4B
), 3.73 – 3.90 (s, br, CHOH), 4.15 – 4.36 (m, CH2CH(OH)CH2,
H4A
).
13C-NMR (MeOD-d4): δ (ppm) = 14.80 (br, CH2CH(OH)(CH2)9CH3, C
14B), 23.82 (br,
CH2CH(OH)(CH2)8CH2CH3, C13B
), 27.01 (br, CH2CH(OH)CH2CH2(CH2)7CH3, C6B
),
30.22 – 31.61 (m, CH2CH(OH)(CH2)2(CH2)5(CH2)2CH3, C7-11B
), 33.21 (br,
(CH2)7CH2CH2CH3, C12B
), 36.79 (br, CH2CH(OH)CH2(CH2)8CH3, C5B
), 41.80 – 48.60 (m,
CHCH2, C1,1’
, C2,2’
, backbone), 50.30 – 51.80 (br, CH2CH(OH)CH2N(CH3)3, C3A
),
51.80 – 54.50 (br, CH2CH(OH)(CH2)9CH3, C3B
), 55.08 (s, br, CH2CH(OH)CH2N(CH3)3,
C6A
), 66.30 – 67.30 (br, CH2CH(OH)CH2N(CH3)3, C4A
), 70.40 – 71.20 (m,
CH2CH(OH)CH2N(CH3)3, C5A
and CH2CH(OH)(CH2)9CH3, C4B
), the signals of CHCH2
(C1,1’
, C2,2’
, backbone), and CH2CH(OH)(CH2)9CH3 (C3B
and C4B
) are only distinguishable
from the noise of the baseline in quantitative 13
C measurements on a 600 MHz spectrometer.
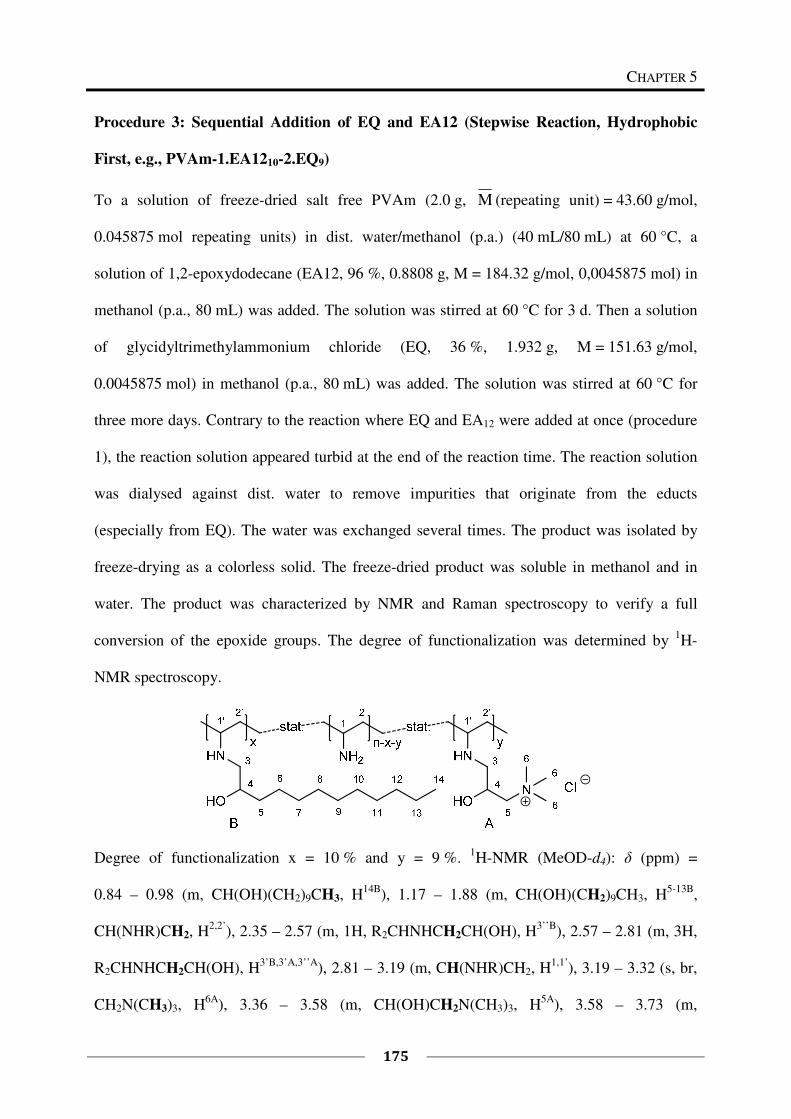
CHAPTER 5
175
Procedure 3: Sequential Addition of EQ and EA12 (Stepwise Reaction, Hydrophobic
First, e.g., PVAm-1.EA1210-2.EQ9)
To a solution of freeze-dried salt free PVAm (2.0 g, M (repeating unit) = 43.60 g/mol,
0.045875 mol repeating units) in dist. water/methanol (p.a.) (40 mL/80 mL) at 60 °C, a
solution of 1,2-epoxydodecane (EA12, 96 %, 0.8808 g, M = 184.32 g/mol, 0,0045875 mol) in
methanol (p.a., 80 mL) was added. The solution was stirred at 60 °C for 3 d. Then a solution
of glycidyltrimethylammonium chloride (EQ, 36 %, 1.932 g, M = 151.63 g/mol,
0.0045875 mol) in methanol (p.a., 80 mL) was added. The solution was stirred at 60 °C for
three more days. Contrary to the reaction where EQ and EA12 were added at once (procedure
1), the reaction solution appeared turbid at the end of the reaction time. The reaction solution
was dialysed against dist. water to remove impurities that originate from the educts
(especially from EQ). The water was exchanged several times. The product was isolated by
freeze-drying as a colorless solid. The freeze-dried product was soluble in methanol and in
water. The product was characterized by NMR and Raman spectroscopy to verify a full
conversion of the epoxide groups. The degree of functionalization was determined by 1H-
NMR spectroscopy.
Degree of functionalization x = 10 % and y = 9 %. 1H-NMR (MeOD-d4): δ (ppm) =
0.84 – 0.98 (m, CH(OH)(CH2)9CH3, H14B
), 1.17 – 1.88 (m, CH(OH)(CH2)9CH3, H5-13B
,
CH(NHR)CH2, H2,2’
), 2.35 – 2.57 (m, 1H, R2CHNHCH2CH(OH), H3’’B
), 2.57 – 2.81 (m, 3H,
R2CHNHCH2CH(OH), H3’B,3’A,3’’A
), 2.81 – 3.19 (m, CH(NHR)CH2, H1,1’
), 3.19 – 3.32 (s, br,
CH2N(CH3)3, H6A
), 3.36 – 3.58 (m, CH(OH)CH2N(CH3)3, H5A
), 3.58 – 3.73 (m,
Synthesis and Characterization of Polymers with
the Same Composition but Different Microstructures
176
CH2CH(OH)(CH2)9, H4B
), 3.73 – 3.90 (s, br, CHOH), 4.15 – 4.36 (m, CH2CH(OH)CH2,
H4A
).
13C-NMR (MeOD-d4): δ (ppm) = 14.80 (br, CH2CH(OH)(CH2)9CH3, C
14B), 23.82 (br,
CH2CH(OH)(CH2)8CH2CH3, C13B
), 27.01 (br, CH2CH(OH)CH2CH2(CH2)7CH3, C6B
),
30.22 – 31.61 (m, CH2CH(OH)(CH2)2(CH2)5(CH2)2CH3, C7-11B
), 33.21 (br,
(CH2)7CH2CH2CH3, C12B
), 36.79 (br, CH2CH(OH)CH2(CH2)8CH3, C5B
), 41.80 – 48.60 (m,
CHCH2, C1,1’
, C2,2’
, backbone), 50.30 – 51.80 (br, CH2CH(OH)CH2N(CH3)3, C3A
),
51.80 – 54.50 (br, CH2CH(OH)(CH2)9CH3, C3B
), 55.08 (s, br, CH2CH(OH)CH2N(CH3)3,
C6A
), 66.30 – 67.30 (br, CH2CH(OH)CH2N(CH3)3, C4A
), 70.40 – 71.20 (m,
CH2CH(OH)CH2N(CH3)3, C5A
and CH2CH(OH)(CH2)9CH3, C4B
), the signals of CHCH2
(C1,1’
, C2,2’
, backbone), and CH2CH(OH)(CH2)9CH3 (C3B
and C4B
) are only distinguishable
from the noise of the baseline in quantitative 13
C measurements on a 600 MHz spectrometer.
5.3 Results and Discussion
In the previous chapters the synthesis of multifunctional poly(vinyl amine)s was optimized
and discussed in detail. In this chapter, the goal is to introduce different microstructures into
the polymers having the same chemical composition. The sequential and simultaneous
addition of the monomers (EQ and EA12) was chosen as approach. The effect of the
microstructure on the antimicrobial effect, the CAC (critical aggregation concentration), the
viscosity, the ability to penetrate into a model DPPC membrane, the ability to penetrate into
the outer/inner membrane of E. coli, and the hemolytic activity of the polymers were
determined.
CHAPTER 5
177
5.3.1 Syntheses
Functional poly(vinyl amine)s with different microstructures were prepared by simultaneous
and sequential addition of functional epoxides. Following this approach three different types
of polymers were prepared (Scheme 1) and named following the threefold expression
explained in section 5.2.3:
1) PVAm was reacted simultaneously with the epoxides EQ (cationic) and EA12
(hydrophobic): PVAm-EQx-EA12y.
2) In the first step PVAm was reacted with the cationic epoxide EQ and in the next step
with the hydrophobic epoxide EA12: PVAm-1.EQx-2.EA12y.
3) In the first step PVAm was reacted with the hydrophobic epoxide EA12 and in the
second step with the cationic epoxide EQ: PVAm-1.EA12x-2.EQy.
PVAm was reacted with the two epoxides and afterwards purified by dialysis. NMR and
Raman spectra showed only the expected signals and the degree of functionalization was
determined by 1H-NMR spectroscopy as already described in Chapter 2. In order to obtain
polymers with the same chemical composition but different microstructures, a series of
polymers was prepared in different ways, starting with the same amounts of educts. The series
aimed at degrees of functionalization of 10 % EQ and 10 % EA12. In Table 3, the obtained
degrees of functionalization are listed. During the reaction some differences between the
sequential and the simultaneous addition of the epoxides have already been observed. After
the sequential addition of the epoxides the reaction solution appeared turbid, whereas after the
simultaneous addition of the epoxides, a clear solution was obtained. This observation already
indicated that differences in the resulting products of the simultaneous and the sequential
addition of the epoxides could be expected.
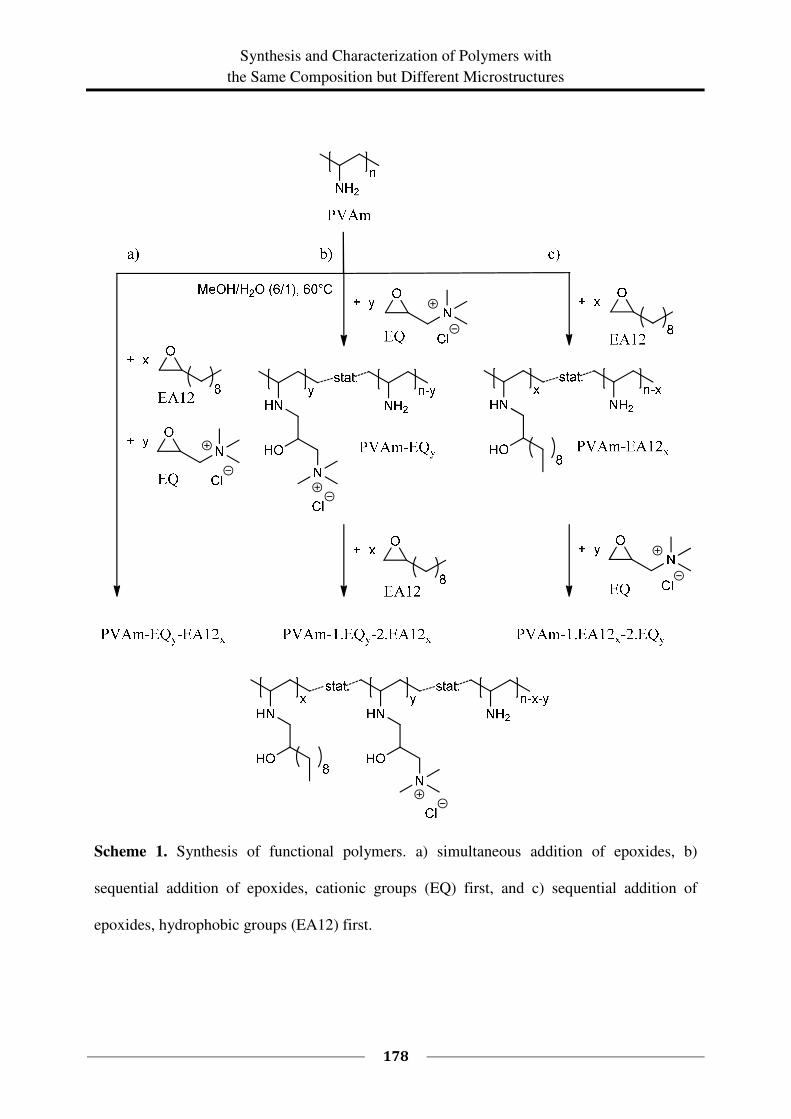
Synthesis and Characterization of Polymers with
the Same Composition but Different Microstructures
178
Scheme 1. Synthesis of functional polymers. a) simultaneous addition of epoxides, b)
sequential addition of epoxides, cationic groups (EQ) first, and c) sequential addition of
epoxides, hydrophobic groups (EA12) first.
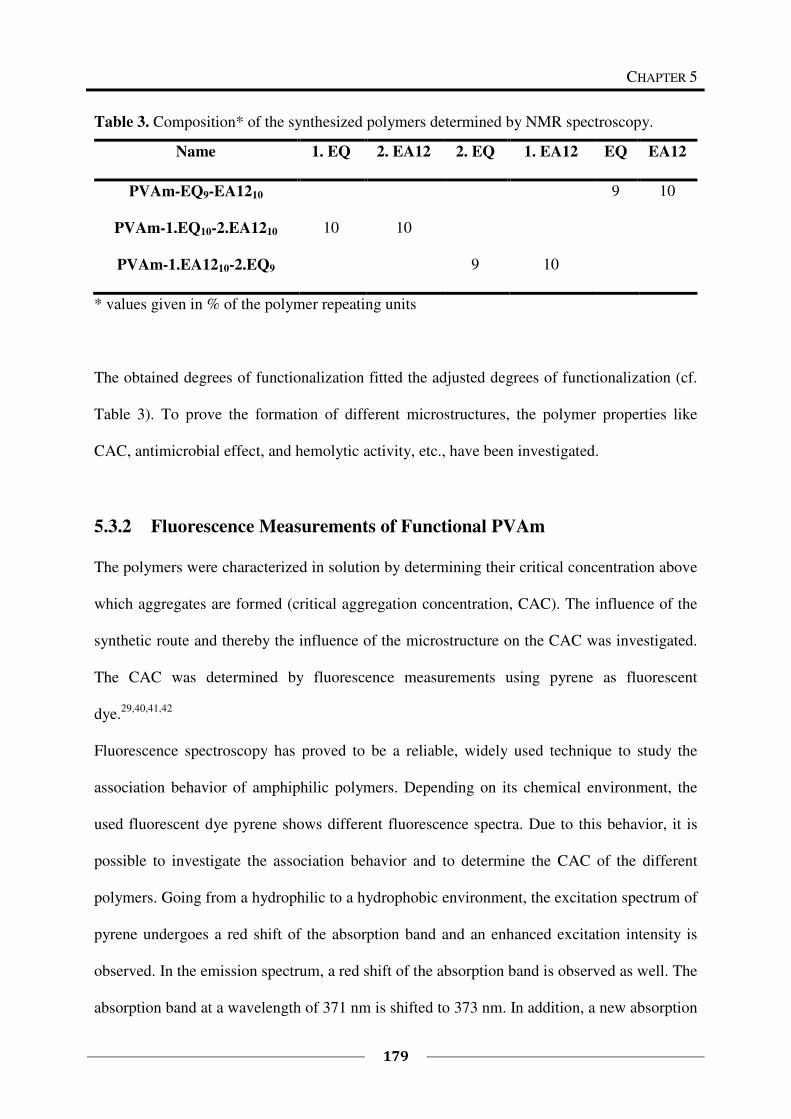
CHAPTER 5
179
Table 3. Composition* of the synthesized polymers determined by NMR spectroscopy.
Name 1. EQ 2. EA12 2. EQ 1. EA12 EQ EA12
PVAm-EQ9-EA1210 9 10
PVAm-1.EQ10-2.EA1210 10 10
PVAm-1.EA1210-2.EQ9 9 10
* values given in % of the polymer repeating units
The obtained degrees of functionalization fitted the adjusted degrees of functionalization (cf.
Table 3). To prove the formation of different microstructures, the polymer properties like
CAC, antimicrobial effect, and hemolytic activity, etc., have been investigated.
5.3.2 Fluorescence Measurements of Functional PVAm
The polymers were characterized in solution by determining their critical concentration above
which aggregates are formed (critical aggregation concentration, CAC). The influence of the
synthetic route and thereby the influence of the microstructure on the CAC was investigated.
The CAC was determined by fluorescence measurements using pyrene as fluorescent
dye.29,40,41,42
Fluorescence spectroscopy has proved to be a reliable, widely used technique to study the
association behavior of amphiphilic polymers. Depending on its chemical environment, the
used fluorescent dye pyrene shows different fluorescence spectra. Due to this behavior, it is
possible to investigate the association behavior and to determine the CAC of the different
polymers. Going from a hydrophilic to a hydrophobic environment, the excitation spectrum of
pyrene undergoes a red shift of the absorption band and an enhanced excitation intensity is
observed. In the emission spectrum, a red shift of the absorption band is observed as well. The
absorption band at a wavelength of 371 nm is shifted to 373 nm. In addition, a new absorption
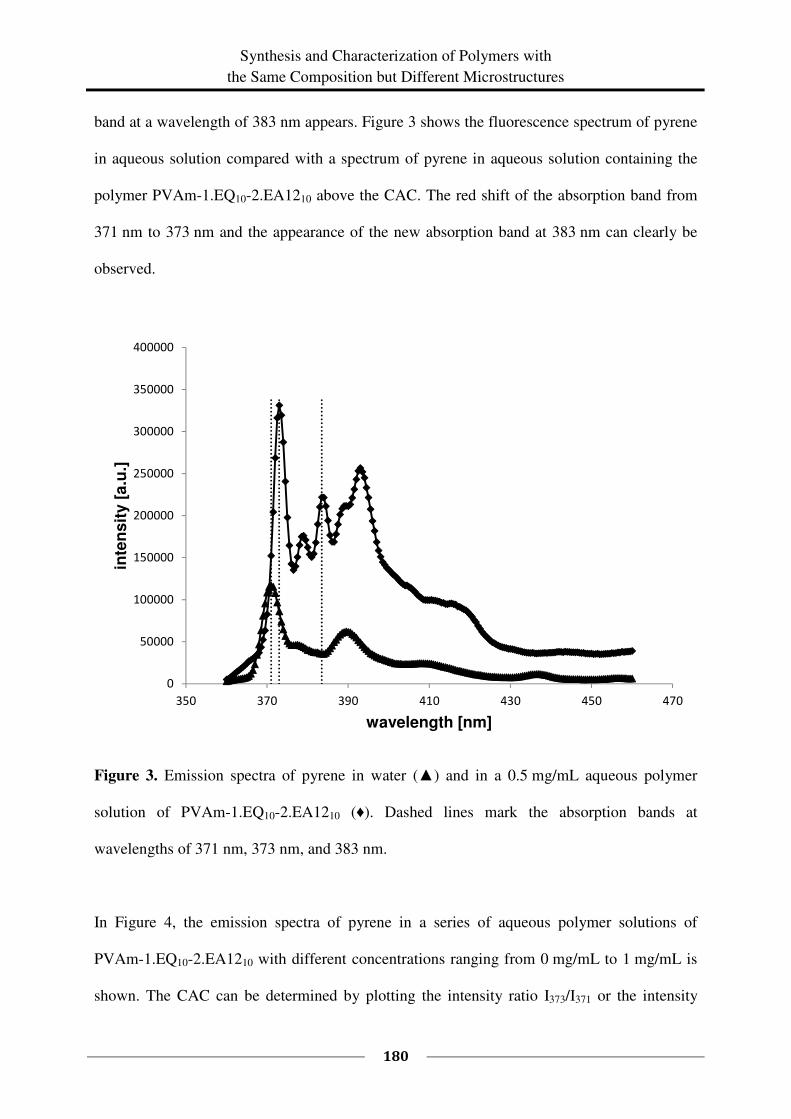
Synthesis and Characterization of Polymers with
the Same Composition but Different Microstructures
180
band at a wavelength of 383 nm appears. Figure 3 shows the fluorescence spectrum of pyrene
in aqueous solution compared with a spectrum of pyrene in aqueous solution containing the
polymer PVAm-1.EQ10-2.EA1210 above the CAC. The red shift of the absorption band from
371 nm to 373 nm and the appearance of the new absorption band at 383 nm can clearly be
observed.
Figure 3. Emission spectra of pyrene in water (▲) and in a 0.5 mg/mL aqueous polymer
solution of PVAm-1.EQ10-2.EA1210 (♦). Dashed lines mark the absorption bands at
wavelengths of 371 nm, 373 nm, and 383 nm.
In Figure 4, the emission spectra of pyrene in a series of aqueous polymer solutions of
PVAm-1.EQ10-2.EA1210 with different concentrations ranging from 0 mg/mL to 1 mg/mL is
shown. The CAC can be determined by plotting the intensity ratio I373/I371 or the intensity
0
50000
100000
150000
200000
250000
300000
350000
400000
350 370 390 410 430 450 470
inte
ns
ity [
a.u
.]
wavelength [nm]
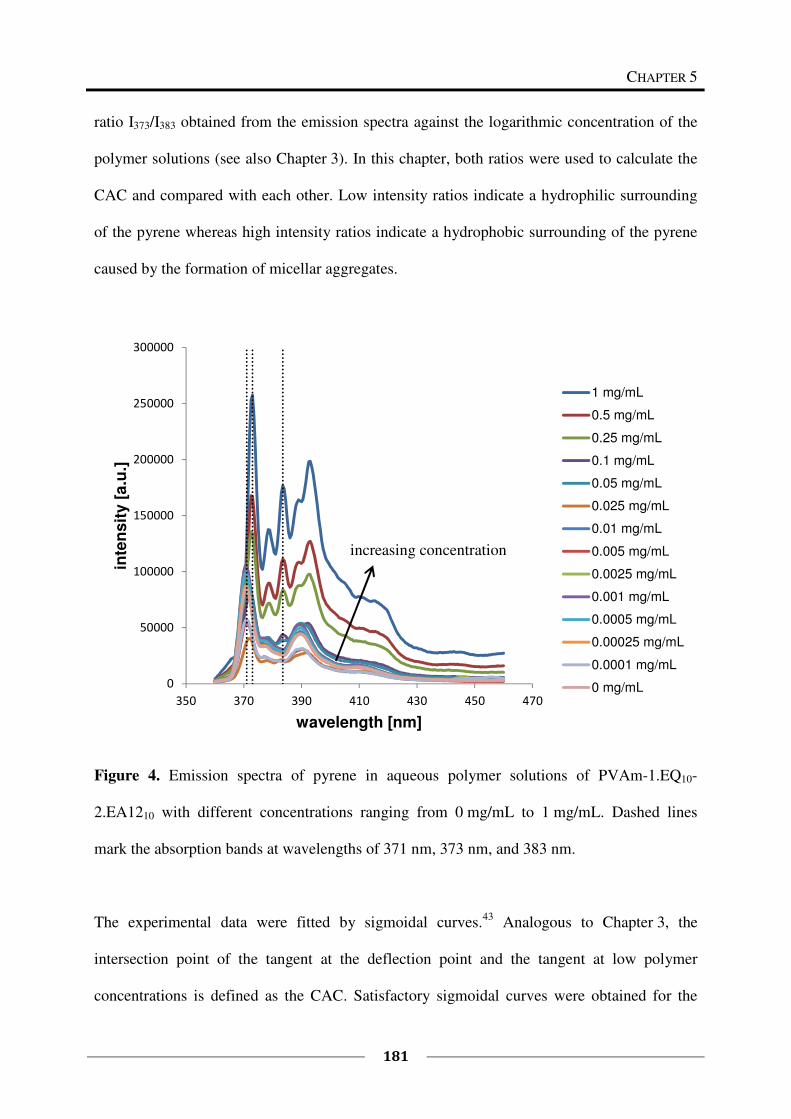
CHAPTER 5
181
ratio I373/I383 obtained from the emission spectra against the logarithmic concentration of the
polymer solutions (see also Chapter 3). In this chapter, both ratios were used to calculate the
CAC and compared with each other. Low intensity ratios indicate a hydrophilic surrounding
of the pyrene whereas high intensity ratios indicate a hydrophobic surrounding of the pyrene
caused by the formation of micellar aggregates.
Figure 4. Emission spectra of pyrene in aqueous polymer solutions of PVAm-1.EQ10-
2.EA1210 with different concentrations ranging from 0 mg/mL to 1 mg/mL. Dashed lines
mark the absorption bands at wavelengths of 371 nm, 373 nm, and 383 nm.
The experimental data were fitted by sigmoidal curves.43
Analogous to Chapter 3, the
intersection point of the tangent at the deflection point and the tangent at low polymer
concentrations is defined as the CAC. Satisfactory sigmoidal curves were obtained for the
0
50000
100000
150000
200000
250000
300000
350 370 390 410 430 450 470
inte
ns
ity [
a.u
.]
wavelength [nm]
1 mg/mL
0.5 mg/mL
0.25 mg/mL
0.1 mg/mL
0.05 mg/mL
0.025 mg/mL
0.01 mg/mL
0.005 mg/mL
0.0025 mg/mL
0.001 mg/mL
0.0005 mg/mL
0.00025 mg/mL
0.0001 mg/mL
0 mg/mL
increasing concentration
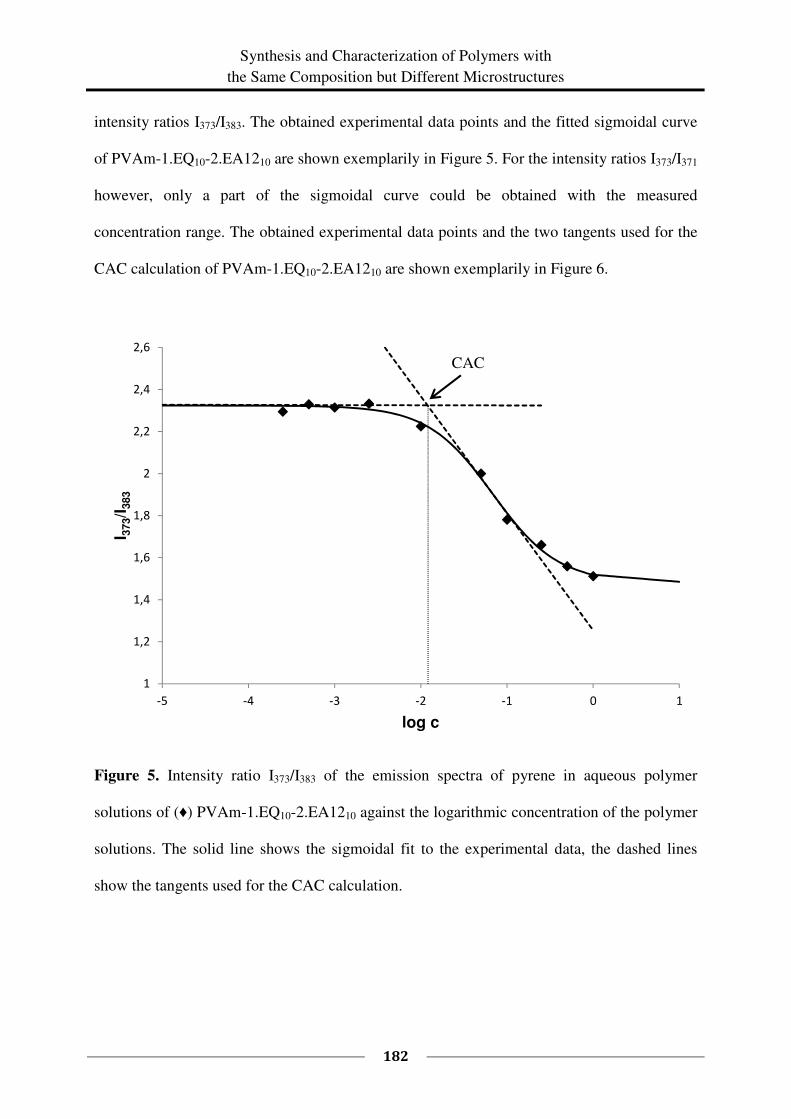
Synthesis and Characterization of Polymers with
the Same Composition but Different Microstructures
182
intensity ratios I373/I383. The obtained experimental data points and the fitted sigmoidal curve
of PVAm-1.EQ10-2.EA1210 are shown exemplarily in Figure 5. For the intensity ratios I373/I371
however, only a part of the sigmoidal curve could be obtained with the measured
concentration range. The obtained experimental data points and the two tangents used for the
CAC calculation of PVAm-1.EQ10-2.EA1210 are shown exemplarily in Figure 6.
Figure 5. Intensity ratio I373/I383 of the emission spectra of pyrene in aqueous polymer
solutions of (♦) PVAm-1.EQ10-2.EA1210 against the logarithmic concentration of the polymer
solutions. The solid line shows the sigmoidal fit to the experimental data, the dashed lines
show the tangents used for the CAC calculation.
1
1,2
1,4
1,6
1,8
2
2,2
2,4
2,6
-5 -4 -3 -2 -1 0 1
I 373/I
383
log c
CAC
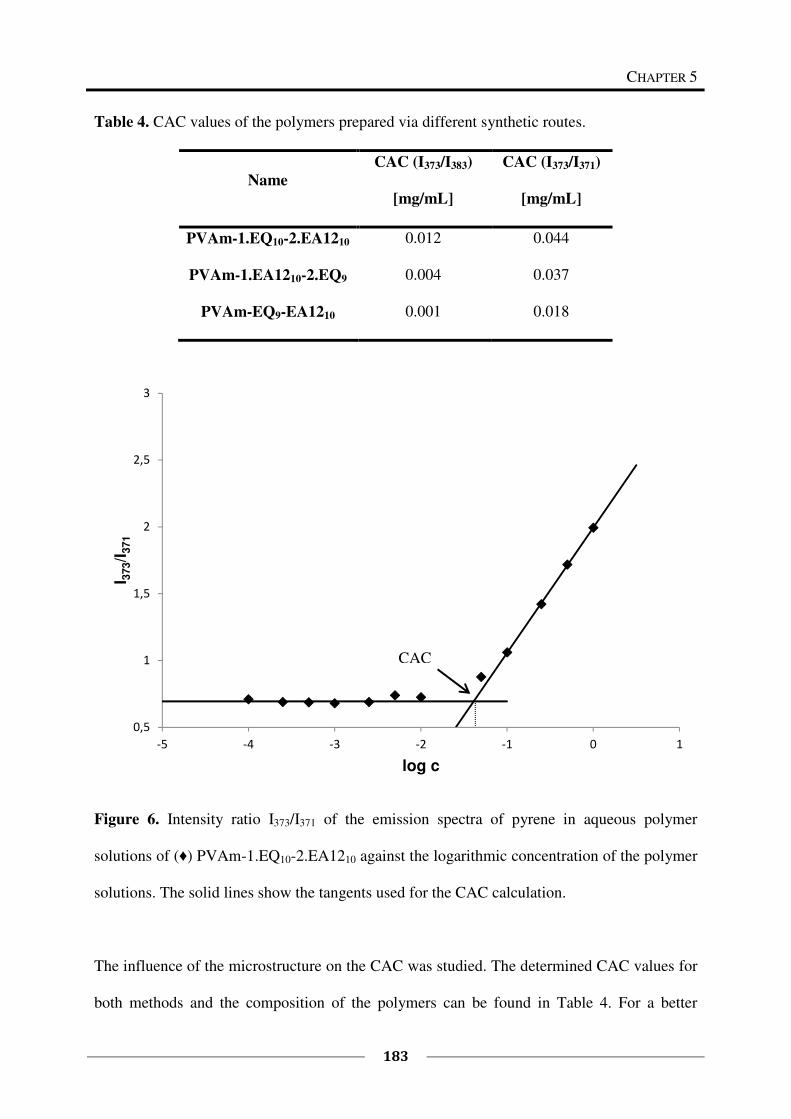
CHAPTER 5
183
Table 4. CAC values of the polymers prepared via different synthetic routes.
Name
CAC (I373/I383)
[mg/mL]
CAC (I373/I371)
[mg/mL]
PVAm-1.EQ10-2.EA1210 0.012 0.044
PVAm-1.EA1210-2.EQ9 0.004 0.037
PVAm-EQ9-EA1210 0.001 0.018
Figure 6. Intensity ratio I373/I371 of the emission spectra of pyrene in aqueous polymer
solutions of (♦) PVAm-1.EQ10-2.EA1210 against the logarithmic concentration of the polymer
solutions. The solid lines show the tangents used for the CAC calculation.
The influence of the microstructure on the CAC was studied. The determined CAC values for
both methods and the composition of the polymers can be found in Table 4. For a better
0,5
1
1,5
2
2,5
3
-5 -4 -3 -2 -1 0 1
I 373/I
371
log c
CAC
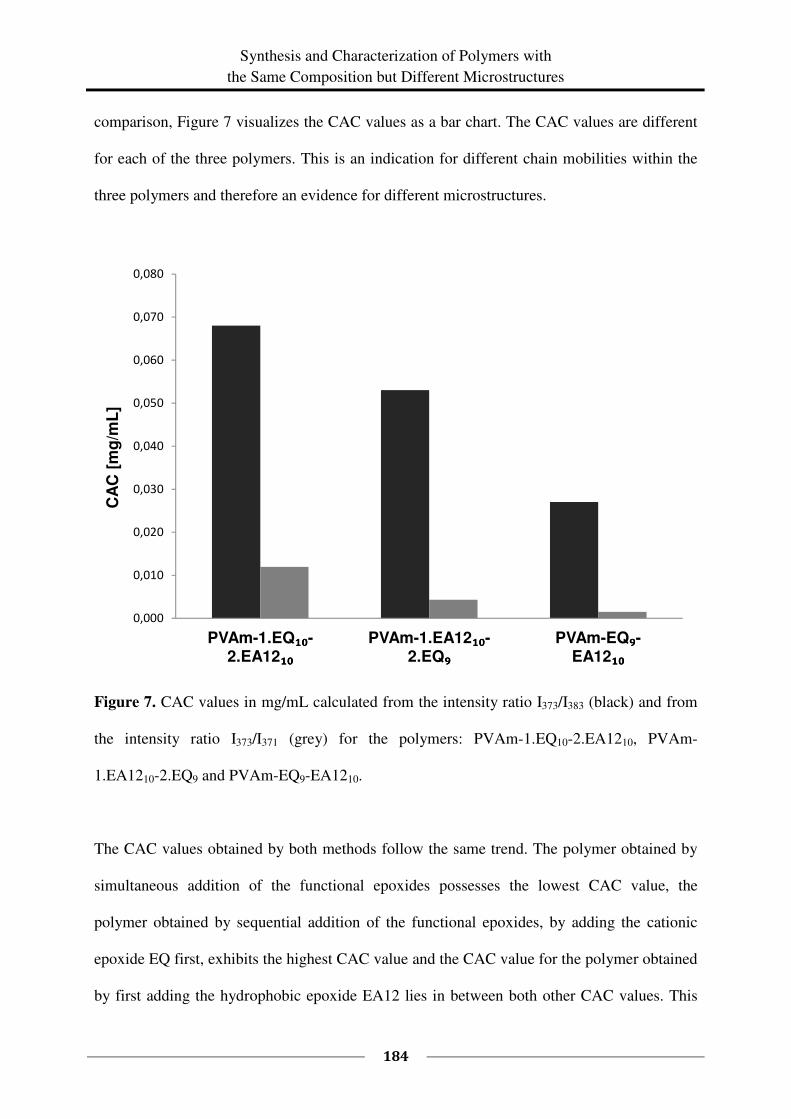
Synthesis and Characterization of Polymers with
the Same Composition but Different Microstructures
184
comparison, Figure 7 visualizes the CAC values as a bar chart. The CAC values are different
for each of the three polymers. This is an indication for different chain mobilities within the
three polymers and therefore an evidence for different microstructures.
Figure 7. CAC values in mg/mL calculated from the intensity ratio I373/I383 (black) and from
the intensity ratio I373/I371 (grey) for the polymers: PVAm-1.EQ10-2.EA1210, PVAm-
1.EA1210-2.EQ9 and PVAm-EQ9-EA1210.
The CAC values obtained by both methods follow the same trend. The polymer obtained by
simultaneous addition of the functional epoxides possesses the lowest CAC value, the
polymer obtained by sequential addition of the functional epoxides, by adding the cationic
epoxide EQ first, exhibits the highest CAC value and the CAC value for the polymer obtained
by first adding the hydrophobic epoxide EA12 lies in between both other CAC values. This
0,000
0,010
0,020
0,030
0,040
0,050
0,060
0,070
0,080
PVAm-1.EQ₁₀₁₀₁₀₁₀-2.EA12₁₀₁₀₁₀₁₀
PVAm-1.EA12₁₀₁₀₁₀₁₀-2.EQ₉₉₉₉
PVAm-EQ₉₉₉₉-EA12₁₀₁₀₁₀₁₀
CA
C [
mg
/mL
]
CHAPTER 5
185
shows that the polymer obtained by simultaneous addition of the epoxides possesses the
highest chain mobility and can build micelles more easily than the polymers obtained by
sequential addition of the epoxides. This is due to the formation of segregated domains within
the polymers during the sequential reaction. These segregated domains are relatively rigid and
the polymers cannot easily rearrange to form micelles.
5.3.3 Antimicrobial Effect of the Synthesized Polymers
Test in Solution
The antimicrobial effect of the synthesized polymers was tested in aqueous solution. To
investigate the influence of the pH on the antimicrobial effect, the pH of the clear aqueous
polymer solutions (pH ~ 10) was adjusted with acetic acid to pH = 5.5 and pH = 8.0. The
clear polymer solutions were diluted to the testing concentrations by adding nutrient solution.
During this addition, some turbidities appeared. To determine the minimum inhibitory
concentration (MIC) of the polymers, suspensions of E. coli with defined colony forming
units were incubated at 37 °C in nutrient solutions with different concentrations of the test
substances (functional polymers). The bacterial growth was monitored overnight during the
incubation by measuring the optical density (OD) of the solutions. Table 5 shows the
composition and the measured MIC values of the tested polymers. Based on standard
specifications32
, the MIC is defined in this thesis as the lowest concentration of an
antimicrobial agent that inhibits the bacterial growth by 99.99 % (log-4 reduction33
of the
colony forming units) compared to the reference. All test solutions showed turbidities above a
polymer concentration of 0.05 – 0.1 mg/mL. Since with values of about 0.2 mg/mL, the
measured MIC values lie in a concentration range above 0.1 mg/mL, these turbidities disturb
the measurement of the antimicrobial activity in solution, which relies on the optical density
to detect the bacterial growth. In addition, the polymers might not be completely available for
Synthesis and Characterization of Polymers with
the Same Composition but Different Microstructures
186
the antimicrobial interaction and the real MIC values can thus be lower than the measured
values. The obtained MIC values are therefore imprecise and the slight differences in the
antimicrobial activity between the polymer solutions with pH = 5.5 and pH = 8.0 are not
significant. The MIC values show no differences between the activities of the three polymers.
Table 5. MIC against E. coli (under growth conditions) of the synthesized polymers.
MIC [mg/mL]a)
Name pH = 5.5 pH = 8.0
PVAm-EQ9-EA1210 > 0.2 0.2
PVAm-1.EQ10-2.EA1210 > 0.2 0.2
PVAm-1.EA1210-2.EQ9 > 0.2 0.2
a) The MIC is defined as the lowest concentration of an antimicrobial that gives a log-4
reduction of the colony forming units. The shown values are the mean values obtained by
averaging the outcomes of three independent measurements. The test was performed under
growth conditions and a concentration of 0.01 % DOW was used. The test solutions showed
turbidities and the real MIC might thus be lower.
Test on Substrate
Since the antimicrobial test in solution measures only relative and no absolute values due to
the turbidity of the test solutions, the antimicrobial effect was also tested on surfaces. The
developed polymers can be coated and adhered to negatively charged surfaces via ionic
interaction. A test on surfaces is also interesting for later applications of the polymers, e.g., as
textile coatings. The different coating strategies (drop casting, spin coating, and spin coating
followed by annealing in methanol atmosphere) used for the antimicrobial testing are depicted
in Figure 8 and described in the following paragraphs.
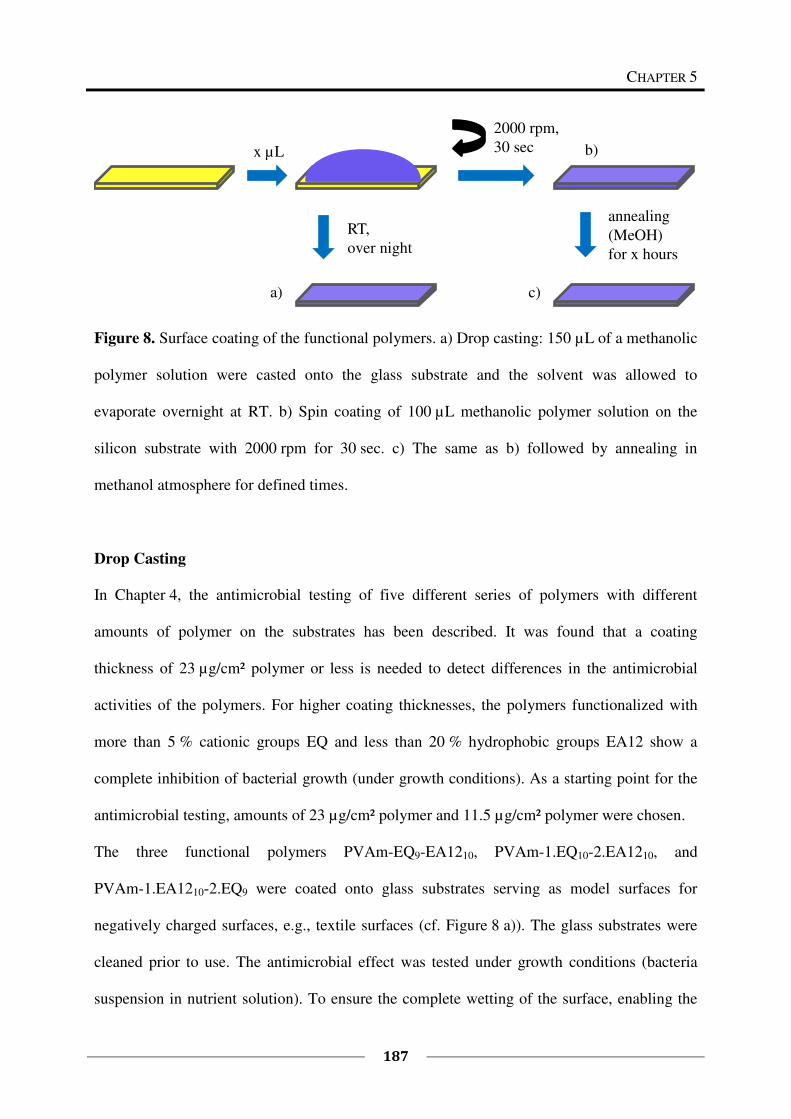
CHAPTER 5
187
Figure 8. Surface coating of the functional polymers. a) Drop casting: 150 µL of a methanolic
polymer solution were casted onto the glass substrate and the solvent was allowed to
evaporate overnight at RT. b) Spin coating of 100 µL methanolic polymer solution on the
silicon substrate with 2000 rpm for 30 sec. c) The same as b) followed by annealing in
methanol atmosphere for defined times.
Drop Casting
In Chapter 4, the antimicrobial testing of five different series of polymers with different
amounts of polymer on the substrates has been described. It was found that a coating
thickness of 23 µg/cm² polymer or less is needed to detect differences in the antimicrobial
activities of the polymers. For higher coating thicknesses, the polymers functionalized with
more than 5 % cationic groups EQ and less than 20 % hydrophobic groups EA12 show a
complete inhibition of bacterial growth (under growth conditions). As a starting point for the
antimicrobial testing, amounts of 23 µg/cm² polymer and 11.5 µg/cm² polymer were chosen.
The three functional polymers PVAm-EQ9-EA1210, PVAm-1.EQ10-2.EA1210, and
PVAm-1.EA1210-2.EQ9 were coated onto glass substrates serving as model surfaces for
negatively charged surfaces, e.g., textile surfaces (cf. Figure 8 a)). The glass substrates were
cleaned prior to use. The antimicrobial effect was tested under growth conditions (bacteria
suspension in nutrient solution). To ensure the complete wetting of the surface, enabling the
RT,
over night
a)
b)
c)
annealing
(MeOH)
for x hours
2000 rpm,
30 secx µL
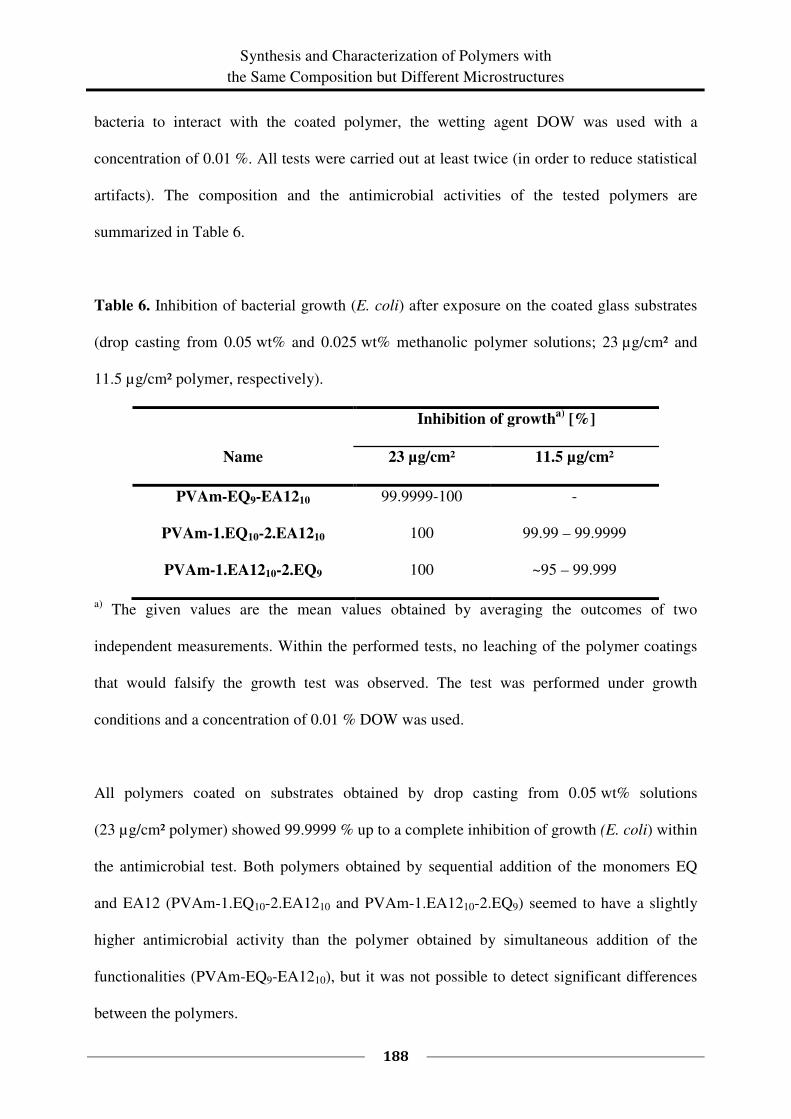
Synthesis and Characterization of Polymers with
the Same Composition but Different Microstructures
188
bacteria to interact with the coated polymer, the wetting agent DOW was used with a
concentration of 0.01 %. All tests were carried out at least twice (in order to reduce statistical
artifacts). The composition and the antimicrobial activities of the tested polymers are
summarized in Table 6.
Table 6. Inhibition of bacterial growth (E. coli) after exposure on the coated glass substrates
(drop casting from 0.05 wt% and 0.025 wt% methanolic polymer solutions; 23 µg/cm² and
11.5 µg/cm² polymer, respectively).
Inhibition of growtha)
[%]
Name 23 µg/cm² 11.5 µg/cm²
PVAm-EQ9-EA1210 99.9999-100 -
PVAm-1.EQ10-2.EA1210 100 99.99 – 99.9999
PVAm-1.EA1210-2.EQ9 100 ~95 – 99.999
a) The given values are the mean values obtained by averaging the outcomes of two
independent measurements. Within the performed tests, no leaching of the polymer coatings
that would falsify the growth test was observed. The test was performed under growth
conditions and a concentration of 0.01 % DOW was used.
All polymers coated on substrates obtained by drop casting from 0.05 wt% solutions
(23 µg/cm² polymer) showed 99.9999 % up to a complete inhibition of growth (E. coli) within
the antimicrobial test. Both polymers obtained by sequential addition of the monomers EQ
and EA12 (PVAm-1.EQ10-2.EA1210 and PVAm-1.EA1210-2.EQ9) seemed to have a slightly
higher antimicrobial activity than the polymer obtained by simultaneous addition of the
functionalities (PVAm-EQ9-EA1210), but it was not possible to detect significant differences
between the polymers.
CHAPTER 5
189
The substrates coated with 0.025 wt% polymer solutions (11.5 µg/cm² polymer) showed very
high standard deviations for the measured inhibitions of growth. Thus the difference between
the polymers cannot be regarded as significant. An explanation for the high standard
deviations can be found in the coating method. During the evaporation of the solvent, drying
effects occurred. For this low polymer concentration, these drying effects led to defects in the
coating. The coating was not sufficiently homogeneous to obtain reproducible results in the
antimicrobial tests.
Spin Coating
To obtain reproducible antimicrobial results, a homogeneous surface coating is required.
Therefore, another coating method (spin coating) was performed to obtain homogeneous
coatings for polymer concentrations lower than 23 µg/cm².
Silicon wafers have been used as substrates for the spin coating (cf. Figure 8 b)). The silicon
substrates were cleaned prior to use. Silicon wafers have been chosen as substrate because
their surface is almost similar to the surface of the glass substrates. Therefore the
antimicrobial results on glass and on silicon surfaces are comparable. The advantage of the
silicon wafers, compared to glass substrates, is their reflective surface. This reflective surface
enables the analysis of the coated substrates with ellipsometry in order to determine the
thickness of the coatings (cf. Table 7). The coating thickness of the substrates obtained by
spin coating from 1 wt% solutions lies around 90 nm for all of the polymers. Other lower
polymer concentrations lead to lower coating thicknesses. For each concentration, the
thickness values are similar for all of the tested polymers. This is important for the
antimicrobial testing because the obtained results are only comparable if the test is carried out
under the same testing conditions for each polymer.
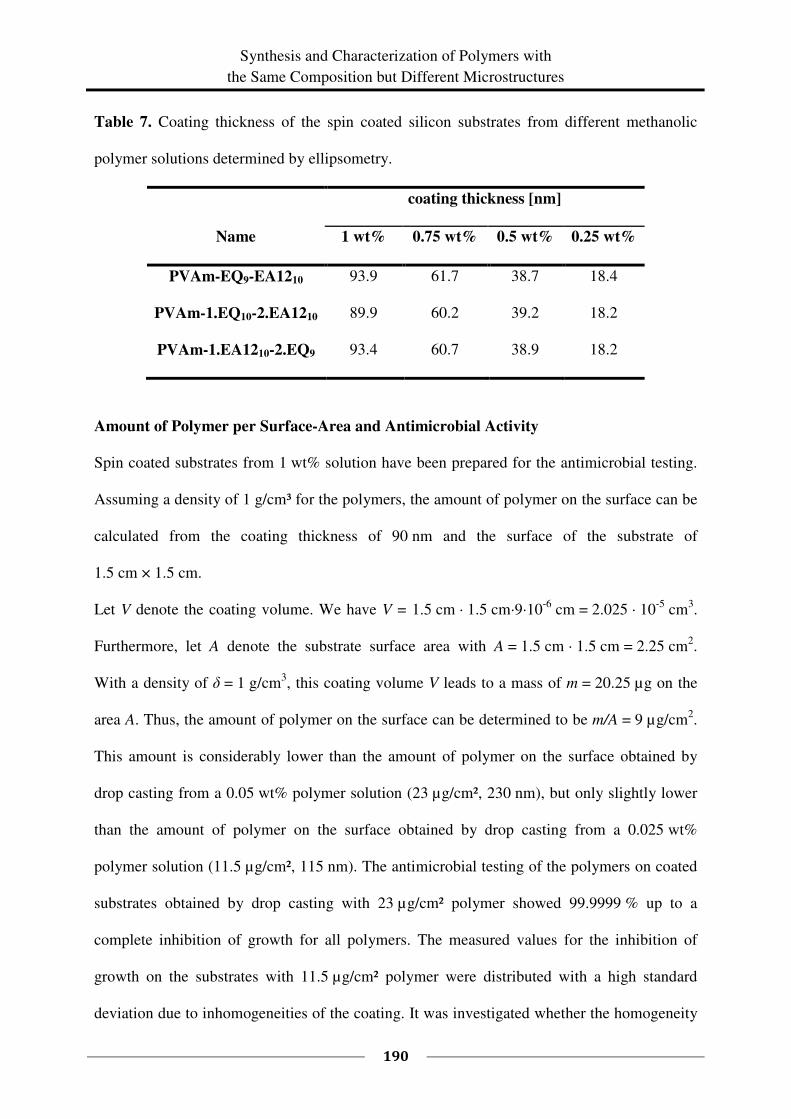
Synthesis and Characterization of Polymers with
the Same Composition but Different Microstructures
190
Table 7. Coating thickness of the spin coated silicon substrates from different methanolic
polymer solutions determined by ellipsometry.
coating thickness [nm]
Name 1 wt% 0.75 wt% 0.5 wt% 0.25 wt%
PVAm-EQ9-EA1210 93.9 61.7 38.7 18.4
PVAm-1.EQ10-2.EA1210 89.9 60.2 39.2 18.2
PVAm-1.EA1210-2.EQ9 93.4 60.7 38.9 18.2
Amount of Polymer per Surface-Area and Antimicrobial Activity
Spin coated substrates from 1 wt% solution have been prepared for the antimicrobial testing.
Assuming a density of 1 g/cm³ for the polymers, the amount of polymer on the surface can be
calculated from the coating thickness of 90 nm and the surface of the substrate of
1.5 cm × 1.5 cm.
Let V denote the coating volume. We have V = 1.5 cm · 1.5 cm·9·10-6
cm = 2.025 · 10-5
cm3.
Furthermore, let A denote the substrate surface area with A = 1.5 cm · 1.5 cm = 2.25 cm2.
With a density of δ = 1 g/cm3, this coating volume V leads to a mass of m = 20.25 µg on the
area A. Thus, the amount of polymer on the surface can be determined to be m/A = 9 µg/cm2.
This amount is considerably lower than the amount of polymer on the surface obtained by
drop casting from a 0.05 wt% polymer solution (23 µg/cm², 230 nm), but only slightly lower
than the amount of polymer on the surface obtained by drop casting from a 0.025 wt%
polymer solution (11.5 µg/cm², 115 nm). The antimicrobial testing of the polymers on coated
substrates obtained by drop casting with 23 µg/cm² polymer showed 99.9999 % up to a
complete inhibition of growth for all polymers. The measured values for the inhibition of
growth on the substrates with 11.5 µg/cm² polymer were distributed with a high standard
deviation due to inhomogeneities of the coating. It was investigated whether the homogeneity
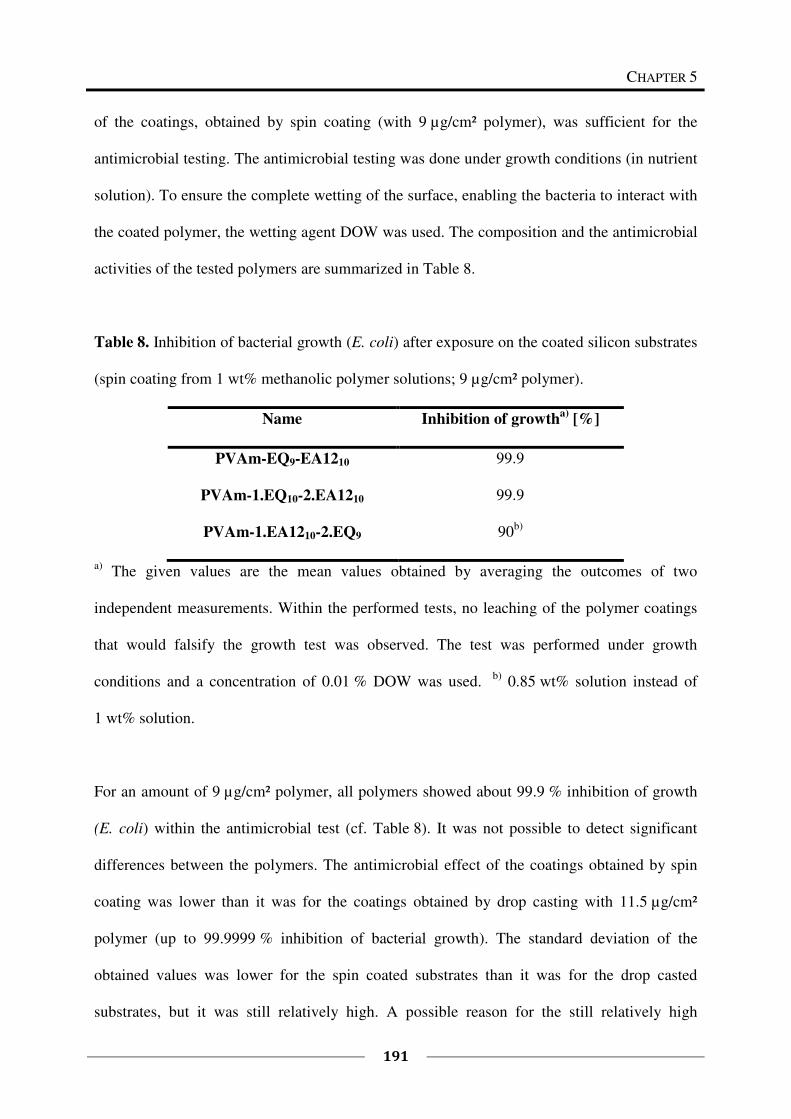
CHAPTER 5
191
of the coatings, obtained by spin coating (with 9 µg/cm² polymer), was sufficient for the
antimicrobial testing. The antimicrobial testing was done under growth conditions (in nutrient
solution). To ensure the complete wetting of the surface, enabling the bacteria to interact with
the coated polymer, the wetting agent DOW was used. The composition and the antimicrobial
activities of the tested polymers are summarized in Table 8.
Table 8. Inhibition of bacterial growth (E. coli) after exposure on the coated silicon substrates
(spin coating from 1 wt% methanolic polymer solutions; 9 µg/cm² polymer).
Name Inhibition of growtha)
[%]
PVAm-EQ9-EA1210 99.9
PVAm-1.EQ10-2.EA1210 99.9
PVAm-1.EA1210-2.EQ9 90b)
a) The given values are the mean values obtained by averaging the outcomes of two
independent measurements. Within the performed tests, no leaching of the polymer coatings
that would falsify the growth test was observed. The test was performed under growth
conditions and a concentration of 0.01 % DOW was used. b)
0.85 wt% solution instead of
1 wt% solution.
For an amount of 9 µg/cm² polymer, all polymers showed about 99.9 % inhibition of growth
(E. coli) within the antimicrobial test (cf. Table 8). It was not possible to detect significant
differences between the polymers. The antimicrobial effect of the coatings obtained by spin
coating was lower than it was for the coatings obtained by drop casting with 11.5 µg/cm²
polymer (up to 99.9999 % inhibition of bacterial growth). The standard deviation of the
obtained values was lower for the spin coated substrates than it was for the drop casted
substrates, but it was still relatively high. A possible reason for the still relatively high
Synthesis and Characterization of Polymers with
the Same Composition but Different Microstructures
192
standard deviation of the values could have been the different orientation of the polymer
chains at the surface, although the surface obtained by spin coating was very homogeneous
compared to a surface coated by drop casting. During the drop casting, the polymer chains
had much more time (evaporation overnight) to orient in a thermodynamically stable
conformation than during the spin coating process where they had only 30 seconds to orient.
This short orientation time led to a mixture of conformations on the spin coated surface. Some
of these conformations were more active against bacteria than others. Thereby the mixture of
conformations caused the variance of the measured values. To overcome this problem, an
annealing in methanol atmosphere was performed after the spin coating (cf. Figure 8 c)). This
annealing gave the polymer chains the opportunity to orient in a thermodynamically more
stable conformation. During the annealing, the color of the coatings on the silicon wafers
changed from a deep blue to green. After the removal of the substrates from the methanol
atmosphere, the blue color was recovered immediately.
Influence of the Annealing Time
The antimicrobial activity of the coatings was exemplarily investigated for the polymer
PVAm-EQ9-EA1210 after 0 h, 1 h, 2 h, 3 h, and 4 h of annealing in methanol atmosphere. The
antimicrobial test was performed under growth conditions (in nutrient solution). To ensure the
complete wetting of the surface, enabling the bacteria to interact with the coated polymer, the
wetting agent DOW was used. The proliferation curves are shown together with the standard
deviations of the growth tests after the different annealing times in Figure 9. The results on
the inhibition of growth of E. coli for the different annealing times are shown in Table 9.
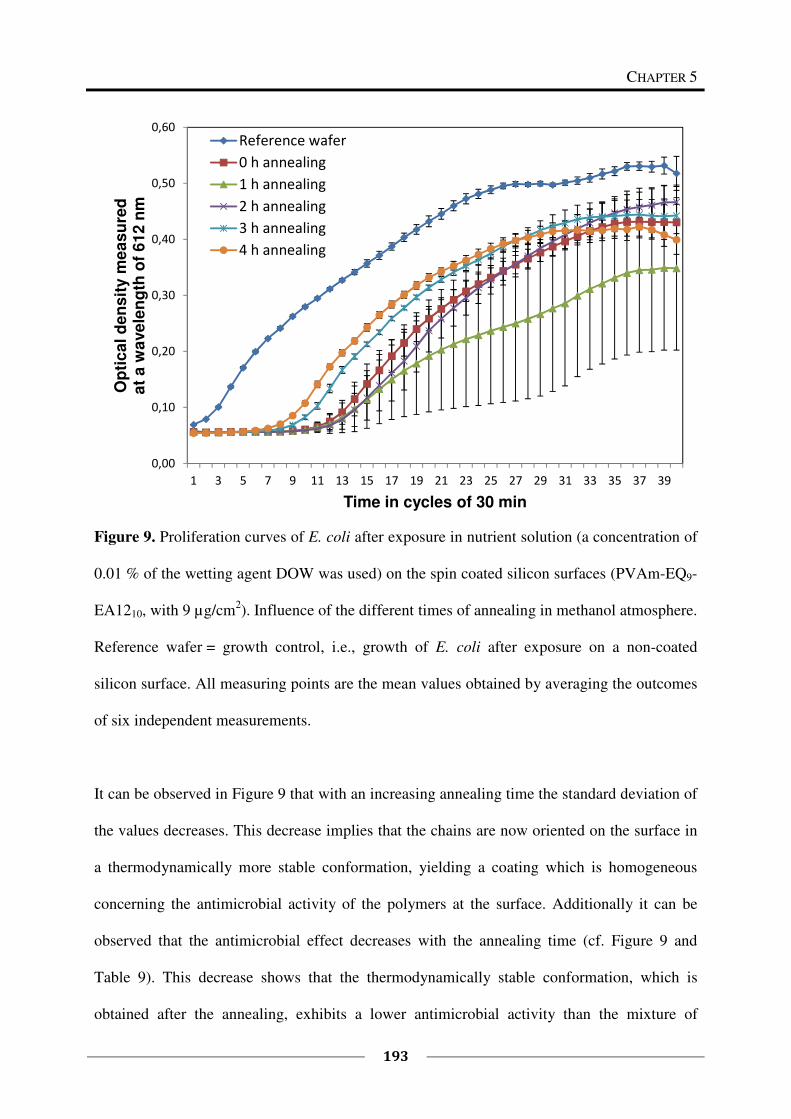
CHAPTER 5
193
Figure 9. Proliferation curves of E. coli after exposure in nutrient solution (a concentration of
0.01 % of the wetting agent DOW was used) on the spin coated silicon surfaces (PVAm-EQ9-
EA1210, with 9 µg/cm2). Influence of the different times of annealing in methanol atmosphere.
Reference wafer = growth control, i.e., growth of E. coli after exposure on a non-coated
silicon surface. All measuring points are the mean values obtained by averaging the outcomes
of six independent measurements.
It can be observed in Figure 9 that with an increasing annealing time the standard deviation of
the values decreases. This decrease implies that the chains are now oriented on the surface in
a thermodynamically more stable conformation, yielding a coating which is homogeneous
concerning the antimicrobial activity of the polymers at the surface. Additionally it can be
observed that the antimicrobial effect decreases with the annealing time (cf. Figure 9 and
Table 9). This decrease shows that the thermodynamically stable conformation, which is
obtained after the annealing, exhibits a lower antimicrobial activity than the mixture of
0,00
0,10
0,20
0,30
0,40
0,50
0,60
1 3 5 7 9 11 13 15 17 19 21 23 25 27 29 31 33 35 37 39
Op
tic
al d
en
sit
y m
ea
su
red
a
t a
wa
ve
len
gth
of
61
2 n
m
Time in cycles of 30 min
Reference wafer
0 h annealing
1 h annealing
2 h annealing
3 h annealing
4 h annealing
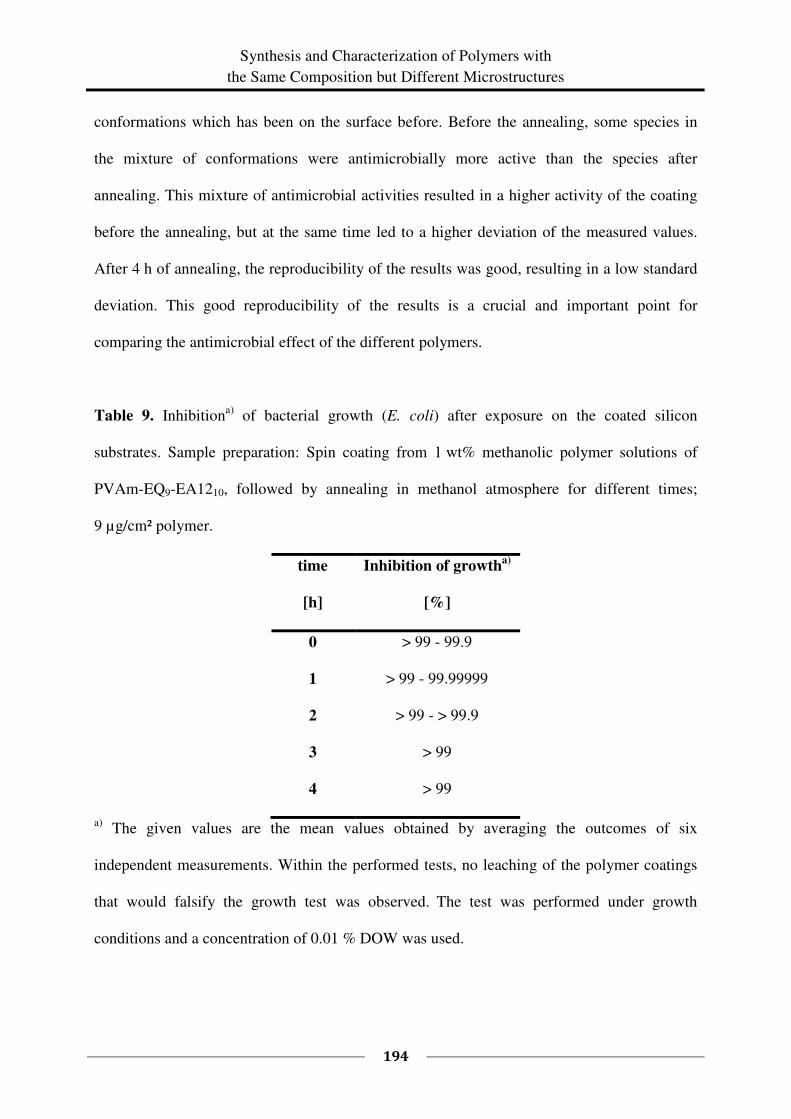
Synthesis and Characterization of Polymers with
the Same Composition but Different Microstructures
194
conformations which has been on the surface before. Before the annealing, some species in
the mixture of conformations were antimicrobially more active than the species after
annealing. This mixture of antimicrobial activities resulted in a higher activity of the coating
before the annealing, but at the same time led to a higher deviation of the measured values.
After 4 h of annealing, the reproducibility of the results was good, resulting in a low standard
deviation. This good reproducibility of the results is a crucial and important point for
comparing the antimicrobial effect of the different polymers.
Table 9. Inhibitiona)
of bacterial growth (E. coli) after exposure on the coated silicon
substrates. Sample preparation: Spin coating from 1 wt% methanolic polymer solutions of
PVAm-EQ9-EA1210, followed by annealing in methanol atmosphere for different times;
9 µg/cm² polymer.
time
[h]
Inhibition of growtha)
[%]
0 > 99 - 99.9
1 > 99 - 99.99999
2 > 99 - > 99.9
3 > 99
4 > 99
a) The given values are the mean values obtained by averaging the outcomes of six
independent measurements. Within the performed tests, no leaching of the polymer coatings
that would falsify the growth test was observed. The test was performed under growth
conditions and a concentration of 0.01 % DOW was used.
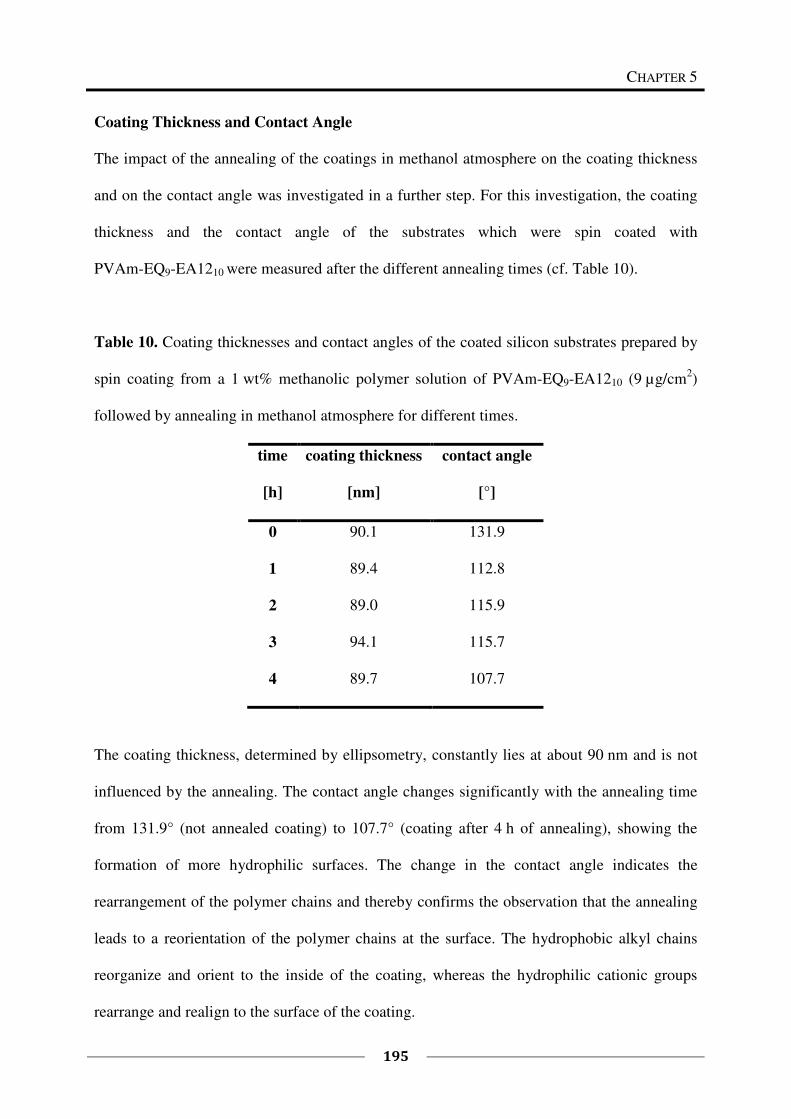
CHAPTER 5
195
Coating Thickness and Contact Angle
The impact of the annealing of the coatings in methanol atmosphere on the coating thickness
and on the contact angle was investigated in a further step. For this investigation, the coating
thickness and the contact angle of the substrates which were spin coated with
PVAm-EQ9-EA1210 were measured after the different annealing times (cf. Table 10).
Table 10. Coating thicknesses and contact angles of the coated silicon substrates prepared by
spin coating from a 1 wt% methanolic polymer solution of PVAm-EQ9-EA1210 (9 µg/cm2)
followed by annealing in methanol atmosphere for different times.
time
[h]
coating thickness
[nm]
contact angle
[°]
0 90.1 131.9
1 89.4 112.8
2 89.0 115.9
3 94.1 115.7
4 89.7 107.7
The coating thickness, determined by ellipsometry, constantly lies at about 90 nm and is not
influenced by the annealing. The contact angle changes significantly with the annealing time
from 131.9° (not annealed coating) to 107.7° (coating after 4 h of annealing), showing the
formation of more hydrophilic surfaces. The change in the contact angle indicates the
rearrangement of the polymer chains and thereby confirms the observation that the annealing
leads to a reorientation of the polymer chains at the surface. The hydrophobic alkyl chains
reorganize and orient to the inside of the coating, whereas the hydrophilic cationic groups
rearrange and realign to the surface of the coating.
Synthesis and Characterization of Polymers with
the Same Composition but Different Microstructures
196
The change of the contact angle to lower values, showing the rearrangement of the alkyl
chains to the inside of the coating, together with the decreased antimicrobial activity after the
annealing, can give a hint on the antimicrobial interaction of the polymer with the bacteria.
The changes show that the alkyl chains lying at the surface or even pointing away from the
surface towards the bacteria are important for the antimicrobial interaction. After the
annealing, the alkyl chains are oriented more to the inside of the coating so that both the
contact angle and the antimicrobial activity decrease. Since surfaces with contact angles
above 90° are defined as hydrophobic, the surface with a contact angle of 107.7° is still
hydrophobic after the annealing. The hydrophobic surface indicates that there are still alkyl
chains at the surface which are available for an antimicrobial interaction. On the other hand,
this observation is contradictory to an observation made in Chapter 4, where it was found that
the antimicrobial activity increases with decreasing concentration of alkyl chains. The
orientation of the alkyl chains to the inside of the coating decreases the concentration of the
alkyl chains at the surface and should therefore lead to an increased antimicrobial activity.
The opposite was observed: the antimicrobial activity decreased. Thus, all the observations
show that not only the composition of the material is important, but also the orientation of the
polymer chains on the surface is important for the antimicrobial activity. It is not easily
possible to give overall conclusions about what composition a polymer should have to obtain
a good antimicrobial effect in a coating. Besides the hydrophilic/hydrophobic balance, several
other factors exist, including the orientation of the polymer chains at the surface and the chain
mobility. These other factors play a role for the antimicrobial activity of a polymer in a
surface coating.
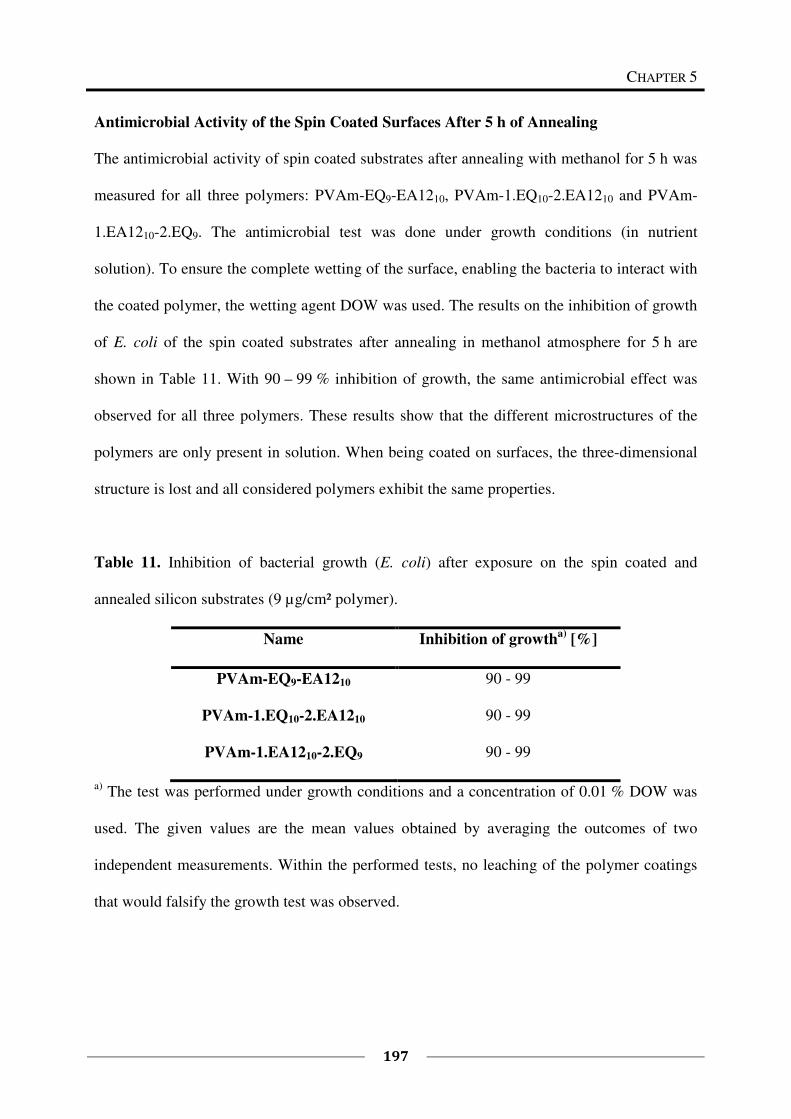
CHAPTER 5
197
Antimicrobial Activity of the Spin Coated Surfaces After 5 h of Annealing
The antimicrobial activity of spin coated substrates after annealing with methanol for 5 h was
measured for all three polymers: PVAm-EQ9-EA1210, PVAm-1.EQ10-2.EA1210 and PVAm-
1.EA1210-2.EQ9. The antimicrobial test was done under growth conditions (in nutrient
solution). To ensure the complete wetting of the surface, enabling the bacteria to interact with
the coated polymer, the wetting agent DOW was used. The results on the inhibition of growth
of E. coli of the spin coated substrates after annealing in methanol atmosphere for 5 h are
shown in Table 11. With 90 – 99 % inhibition of growth, the same antimicrobial effect was
observed for all three polymers. These results show that the different microstructures of the
polymers are only present in solution. When being coated on surfaces, the three-dimensional
structure is lost and all considered polymers exhibit the same properties.
Table 11. Inhibition of bacterial growth (E. coli) after exposure on the spin coated and
annealed silicon substrates (9 µg/cm² polymer).
Name Inhibition of growtha)
[%]
PVAm-EQ9-EA1210 90 - 99
PVAm-1.EQ10-2.EA1210 90 - 99
PVAm-1.EA1210-2.EQ9 90 - 99
a) The test was performed under growth conditions and a concentration of 0.01 % DOW was
used. The given values are the mean values obtained by averaging the outcomes of two
independent measurements. Within the performed tests, no leaching of the polymer coatings
that would falsify the growth test was observed.
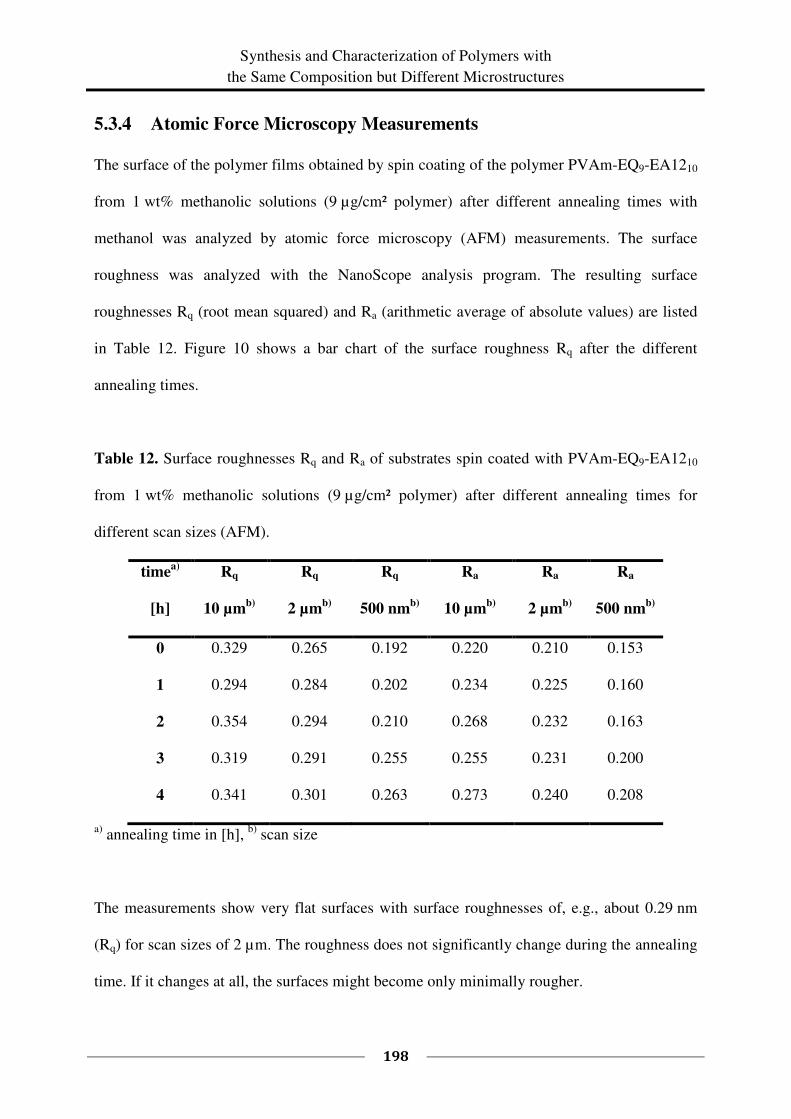
Synthesis and Characterization of Polymers with
the Same Composition but Different Microstructures
198
5.3.4 Atomic Force Microscopy Measurements
The surface of the polymer films obtained by spin coating of the polymer PVAm-EQ9-EA1210
from 1 wt% methanolic solutions (9 µg/cm² polymer) after different annealing times with
methanol was analyzed by atomic force microscopy (AFM) measurements. The surface
roughness was analyzed with the NanoScope analysis program. The resulting surface
roughnesses Rq (root mean squared) and Ra (arithmetic average of absolute values) are listed
in Table 12. Figure 10 shows a bar chart of the surface roughness Rq after the different
annealing times.
Table 12. Surface roughnesses Rq and Ra of substrates spin coated with PVAm-EQ9-EA1210
from 1 wt% methanolic solutions (9 µg/cm² polymer) after different annealing times for
different scan sizes (AFM).
timea)
Rq Rq Rq Ra Ra Ra
[h] 10 µmb)
2 µmb)
500 nmb)
10 µmb)
2 µmb)
500 nmb)
0 0.329 0.265 0.192 0.220 0.210 0.153
1 0.294 0.284 0.202 0.234 0.225 0.160
2 0.354 0.294 0.210 0.268 0.232 0.163
3 0.319 0.291 0.255 0.255 0.231 0.200
4 0.341 0.301 0.263 0.273 0.240 0.208
a) annealing time in [h],
b) scan size
The measurements show very flat surfaces with surface roughnesses of, e.g., about 0.29 nm
(Rq) for scan sizes of 2 µm. The roughness does not significantly change during the annealing
time. If it changes at all, the surfaces might become only minimally rougher.
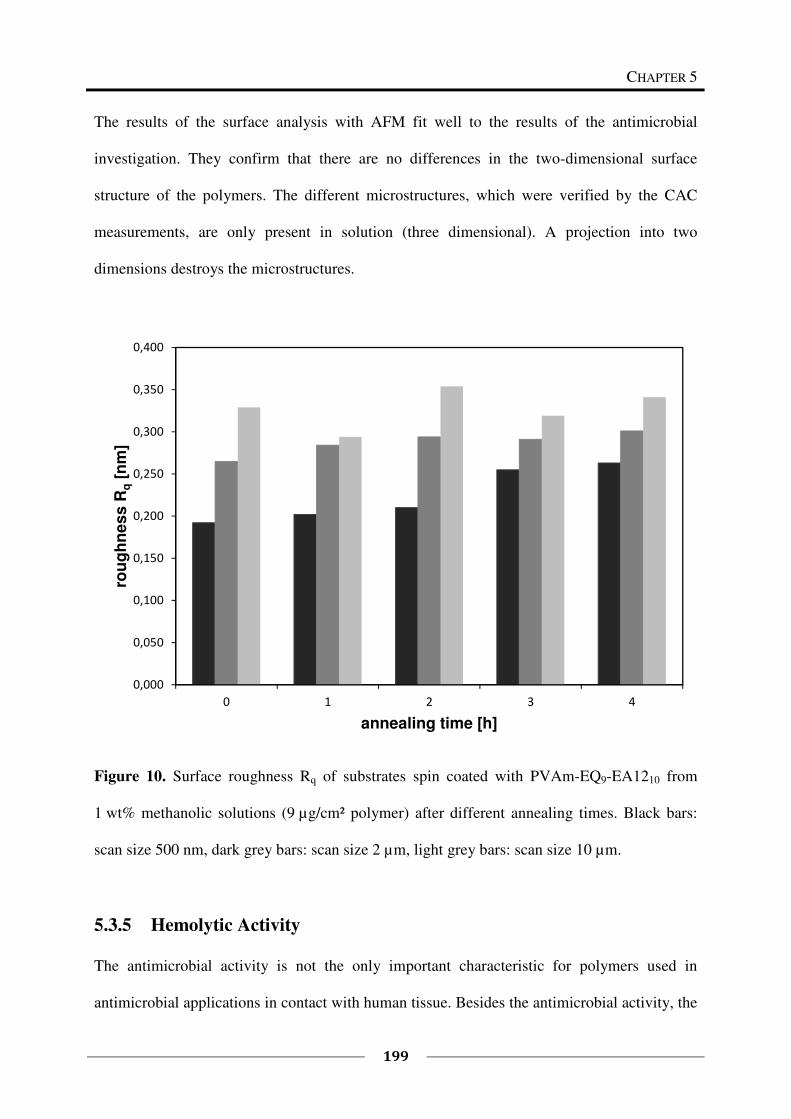
CHAPTER 5
199
The results of the surface analysis with AFM fit well to the results of the antimicrobial
investigation. They confirm that there are no differences in the two-dimensional surface
structure of the polymers. The different microstructures, which were verified by the CAC
measurements, are only present in solution (three dimensional). A projection into two
dimensions destroys the microstructures.
Figure 10. Surface roughness Rq of substrates spin coated with PVAm-EQ9-EA1210 from
1 wt% methanolic solutions (9 µg/cm² polymer) after different annealing times. Black bars:
scan size 500 nm, dark grey bars: scan size 2 µm, light grey bars: scan size 10 µm.
5.3.5 Hemolytic Activity
The antimicrobial activity is not the only important characteristic for polymers used in
antimicrobial applications in contact with human tissue. Besides the antimicrobial activity, the
0,000
0,050
0,100
0,150
0,200
0,250
0,300
0,350
0,400
0 1 2 3 4
rou
gh
ne
ss
Rq
[nm
]
annealing time [h]
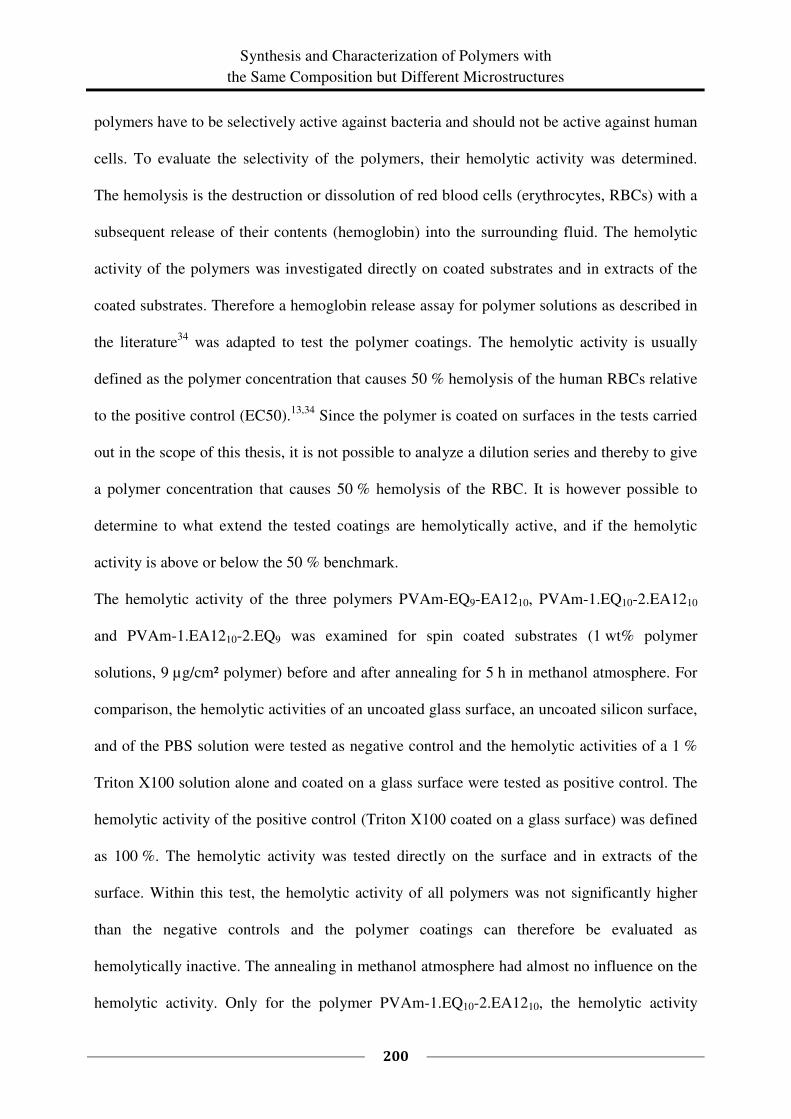
Synthesis and Characterization of Polymers with
the Same Composition but Different Microstructures
200
polymers have to be selectively active against bacteria and should not be active against human
cells. To evaluate the selectivity of the polymers, their hemolytic activity was determined.
The hemolysis is the destruction or dissolution of red blood cells (erythrocytes, RBCs) with a
subsequent release of their contents (hemoglobin) into the surrounding fluid. The hemolytic
activity of the polymers was investigated directly on coated substrates and in extracts of the
coated substrates. Therefore a hemoglobin release assay for polymer solutions as described in
the literature34
was adapted to test the polymer coatings. The hemolytic activity is usually
defined as the polymer concentration that causes 50 % hemolysis of the human RBCs relative
to the positive control (EC50).13,34
Since the polymer is coated on surfaces in the tests carried
out in the scope of this thesis, it is not possible to analyze a dilution series and thereby to give
a polymer concentration that causes 50 % hemolysis of the RBC. It is however possible to
determine to what extend the tested coatings are hemolytically active, and if the hemolytic
activity is above or below the 50 % benchmark.
The hemolytic activity of the three polymers PVAm-EQ9-EA1210, PVAm-1.EQ10-2.EA1210
and PVAm-1.EA1210-2.EQ9 was examined for spin coated substrates (1 wt% polymer
solutions, 9 µg/cm² polymer) before and after annealing for 5 h in methanol atmosphere. For
comparison, the hemolytic activities of an uncoated glass surface, an uncoated silicon surface,
and of the PBS solution were tested as negative control and the hemolytic activities of a 1 %
Triton X100 solution alone and coated on a glass surface were tested as positive control. The
hemolytic activity of the positive control (Triton X100 coated on a glass surface) was defined
as 100 %. The hemolytic activity was tested directly on the surface and in extracts of the
surface. Within this test, the hemolytic activity of all polymers was not significantly higher
than the negative controls and the polymer coatings can therefore be evaluated as
hemolytically inactive. The annealing in methanol atmosphere had almost no influence on the
hemolytic activity. Only for the polymer PVAm-1.EQ10-2.EA1210, the hemolytic activity
CHAPTER 5
201
before the annealing was slightly higher than it was after annealing. In addition, the hemolytic
activity of the polymer PVAm-1.EQ10-2.EA1210 was slightly higher before the annealing than
it was for the other polymers. Besides these observations, it was not possible to distinguish
between the three polymers. The results on the test of the hemolytic activity are shown in
Figure 11, they again show that a projection into two dimensions destroys the microstructures.
Figure 11. Hemolytic activity of the polymers 1 (PVAm-1.EQ10-2.EA1210), 2 (PVAm-
1.EA1210-2.EQ9), and 3 (PVAm-EQ9-EA1210), of the negative controls (glass surface, silicon
surface, PBS solution) and of the positive controls (1 % Triton X100 solution alone and on
glass surface). Blue (left bars): extracts of the surface, green (right bars): directly on the
surface, dotted line: EC50 = 50 % benchmark of the hemolytic activity.
0
10
20
30
40
50
60
70
80
90
100
he
mo
lyti
c a
cti
vit
y [
%]
extracts of the surface
directly on the surface
EC50
Synthesis and Characterization of Polymers with
the Same Composition but Different Microstructures
202
5.3.6 Membrane Penetration in Langmuir Film Experiments
The molecular interaction with lipid films or rather the ability of the developed polymers to
penetrate into membranes was tested for the three polymers PVAm-1.EQ10-2.EA1210, PVAm-
1.EA1210-2.EQ9 and PVAm-EQ9-EA1210. Therefore, the degree of penetration of the
polymers into Langmuir monolayers of neutral and of charged lipids was measured. The goal
was to determine differences in the penetration behavior of the three polymers and thereby to
get evidence for the existence of different microstructures within the polymers.
An ordered monomolecular lipid layer of DPPC (dipalmitoylphosphatidylcholine) on the
surface of bidistilled water (subphase) in a Langmuir trough with an initial surface pressure of
20 mN/m was used as neutral model membrane system. For the charged model membrane
system, an ordered monomolecular lipid layer consisting of 75 mol% DPPC and of 25 mol%
DPPG (dipalmitoylphosphatidylglycerol) was used. After the injection of the polymer
solution into the subphase, the increase of the surface pressure (mN/m) was recorded for
60 min until a new equilibrium was established. The increase of the surface pressure ∆π is the
most widely used parameter to characterize the membrane affinity/penetration ability of a
molecule in Langmuir layer studies.13,44,45,46,47
The polymers were tested with two different polymer concentrations (0.025 mg/mL and
0.075 mg/mL) in the subphase. All three polymers exhibit the same composition of 10 %
hydrophobic groups EA12 and about 9 % cationic groups EQ. The increase of the surface
pressure of the lipid film (∆π) as a result of the penetration of the polymers into the
monolayers of DPPC and of DPPC/DPPG, is shown for two different polymer concentrations
in Table 13 and as a bar chart in Figure 12. An increase of the surface pressure indicates the
adsorption of the polymers to the lipid monolayer and a substantial penetration into the
monolayer.
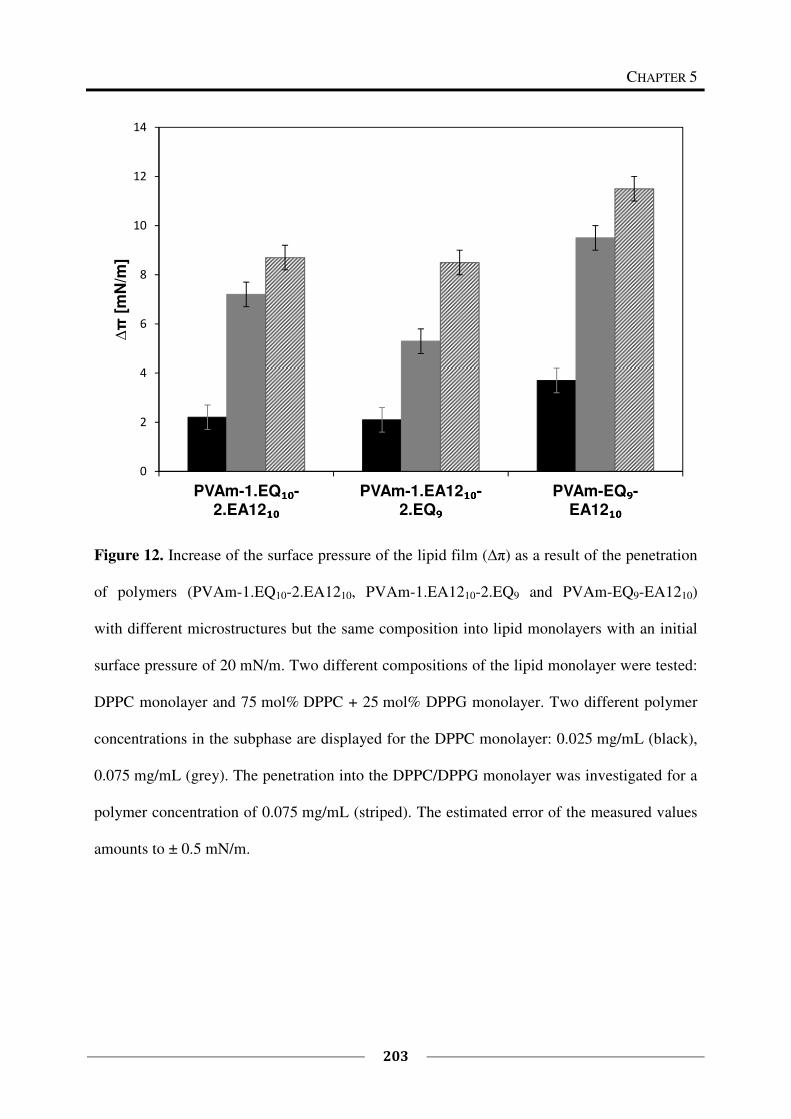
CHAPTER 5
203
Figure 12. Increase of the surface pressure of the lipid film (∆π) as a result of the penetration
of polymers (PVAm-1.EQ10-2.EA1210, PVAm-1.EA1210-2.EQ9 and PVAm-EQ9-EA1210)
with different microstructures but the same composition into lipid monolayers with an initial
surface pressure of 20 mN/m. Two different compositions of the lipid monolayer were tested:
DPPC monolayer and 75 mol% DPPC + 25 mol% DPPG monolayer. Two different polymer
concentrations in the subphase are displayed for the DPPC monolayer: 0.025 mg/mL (black),
0.075 mg/mL (grey). The penetration into the DPPC/DPPG monolayer was investigated for a
polymer concentration of 0.075 mg/mL (striped). The estimated error of the measured values
amounts to ± 0.5 mN/m.
0
2
4
6
8
10
12
14
PVAm-1.EQ₁₀₁₀₁₀₁₀-2.EA12₁₀₁₀₁₀₁₀
PVAm-1.EA12₁₀₁₀₁₀₁₀-2.EQ₉₉₉₉
PVAm-EQ₉₉₉₉-EA12₁₀₁₀₁₀₁₀
∆π
[mN
/m]
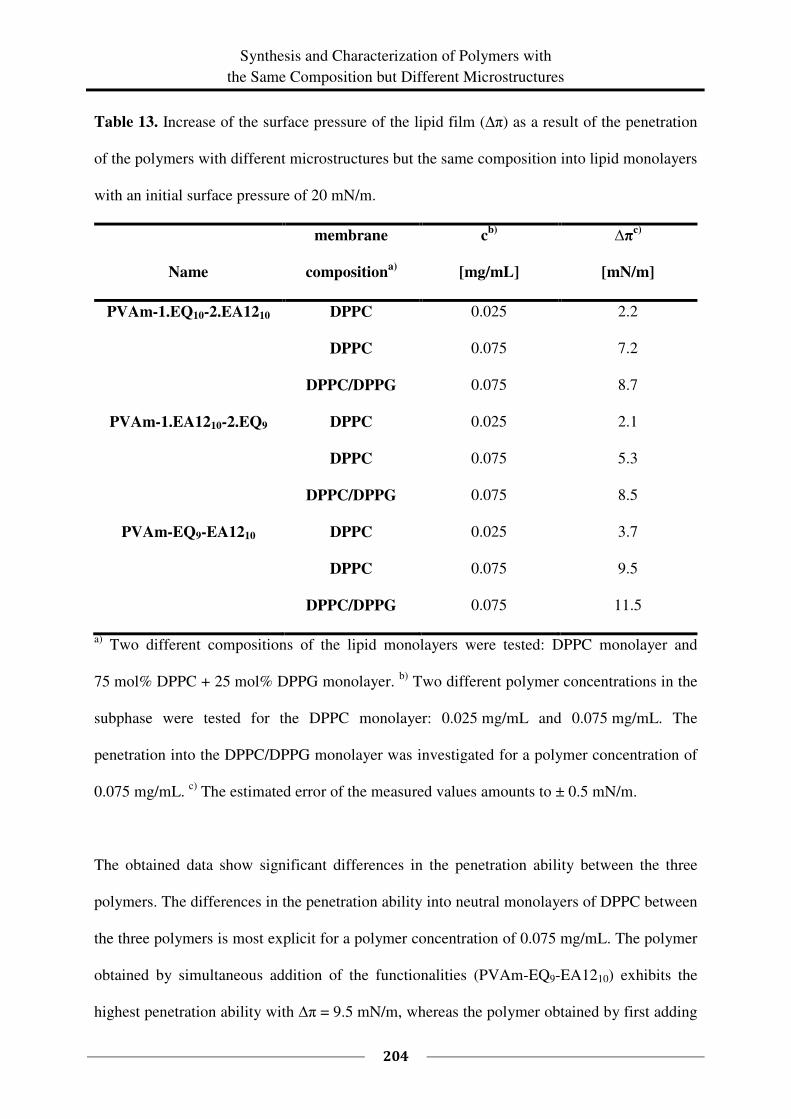
Synthesis and Characterization of Polymers with
the Same Composition but Different Microstructures
204
Table 13. Increase of the surface pressure of the lipid film (∆π) as a result of the penetration
of the polymers with different microstructures but the same composition into lipid monolayers
with an initial surface pressure of 20 mN/m.
membrane cb)
∆πc)
Name compositiona)
[mg/mL] [mN/m]
PVAm-1.EQ10-2.EA1210 DPPC 0.025 2.2
DPPC 0.075 7.2
DPPC/DPPG 0.075 8.7
PVAm-1.EA1210-2.EQ9 DPPC 0.025 2.1
DPPC 0.075 5.3
DPPC/DPPG 0.075 8.5
PVAm-EQ9-EA1210 DPPC 0.025 3.7
DPPC 0.075 9.5
DPPC/DPPG 0.075 11.5
a) Two different compositions of the lipid monolayers were tested: DPPC monolayer and
75 mol% DPPC + 25 mol% DPPG monolayer. b)
Two different polymer concentrations in the
subphase were tested for the DPPC monolayer: 0.025 mg/mL and 0.075 mg/mL. The
penetration into the DPPC/DPPG monolayer was investigated for a polymer concentration of
0.075 mg/mL. c)
The estimated error of the measured values amounts to ± 0.5 mN/m.
The obtained data show significant differences in the penetration ability between the three
polymers. The differences in the penetration ability into neutral monolayers of DPPC between
the three polymers is most explicit for a polymer concentration of 0.075 mg/mL. The polymer
obtained by simultaneous addition of the functionalities (PVAm-EQ9-EA1210) exhibits the
highest penetration ability with ∆π = 9.5 mN/m, whereas the polymer obtained by first adding
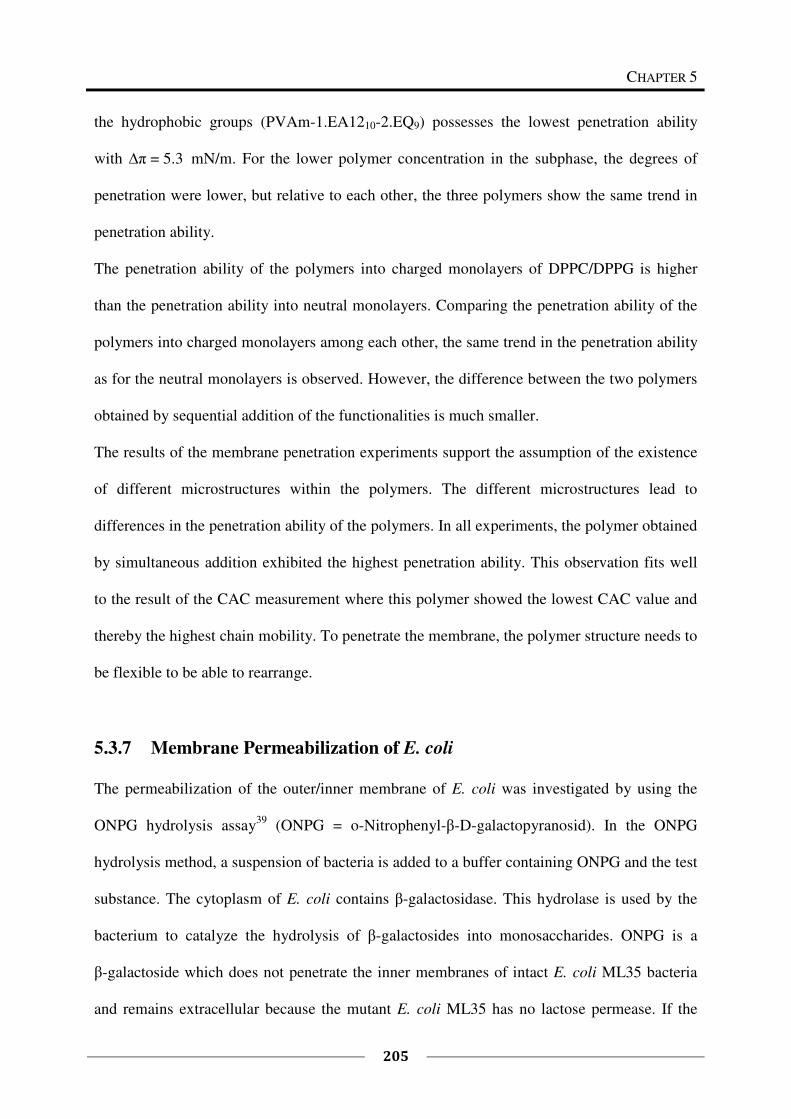
CHAPTER 5
205
the hydrophobic groups (PVAm-1.EA1210-2.EQ9) possesses the lowest penetration ability
with ∆π = 5.3 mN/m. For the lower polymer concentration in the subphase, the degrees of
penetration were lower, but relative to each other, the three polymers show the same trend in
penetration ability.
The penetration ability of the polymers into charged monolayers of DPPC/DPPG is higher
than the penetration ability into neutral monolayers. Comparing the penetration ability of the
polymers into charged monolayers among each other, the same trend in the penetration ability
as for the neutral monolayers is observed. However, the difference between the two polymers
obtained by sequential addition of the functionalities is much smaller.
The results of the membrane penetration experiments support the assumption of the existence
of different microstructures within the polymers. The different microstructures lead to
differences in the penetration ability of the polymers. In all experiments, the polymer obtained
by simultaneous addition exhibited the highest penetration ability. This observation fits well
to the result of the CAC measurement where this polymer showed the lowest CAC value and
thereby the highest chain mobility. To penetrate the membrane, the polymer structure needs to
be flexible to be able to rearrange.
5.3.7 Membrane Permeabilization of E. coli
The permeabilization of the outer/inner membrane of E. coli was investigated by using the
ONPG hydrolysis assay39
(ONPG = o-Nitrophenyl-β-D-galactopyranosid). In the ONPG
hydrolysis method, a suspension of bacteria is added to a buffer containing ONPG and the test
substance. The cytoplasm of E. coli contains β-galactosidase. This hydrolase is used by the
bacterium to catalyze the hydrolysis of β-galactosides into monosaccharides. ONPG is a
β-galactoside which does not penetrate the inner membranes of intact E. coli ML35 bacteria
and remains extracellular because the mutant E. coli ML35 has no lactose permease. If the
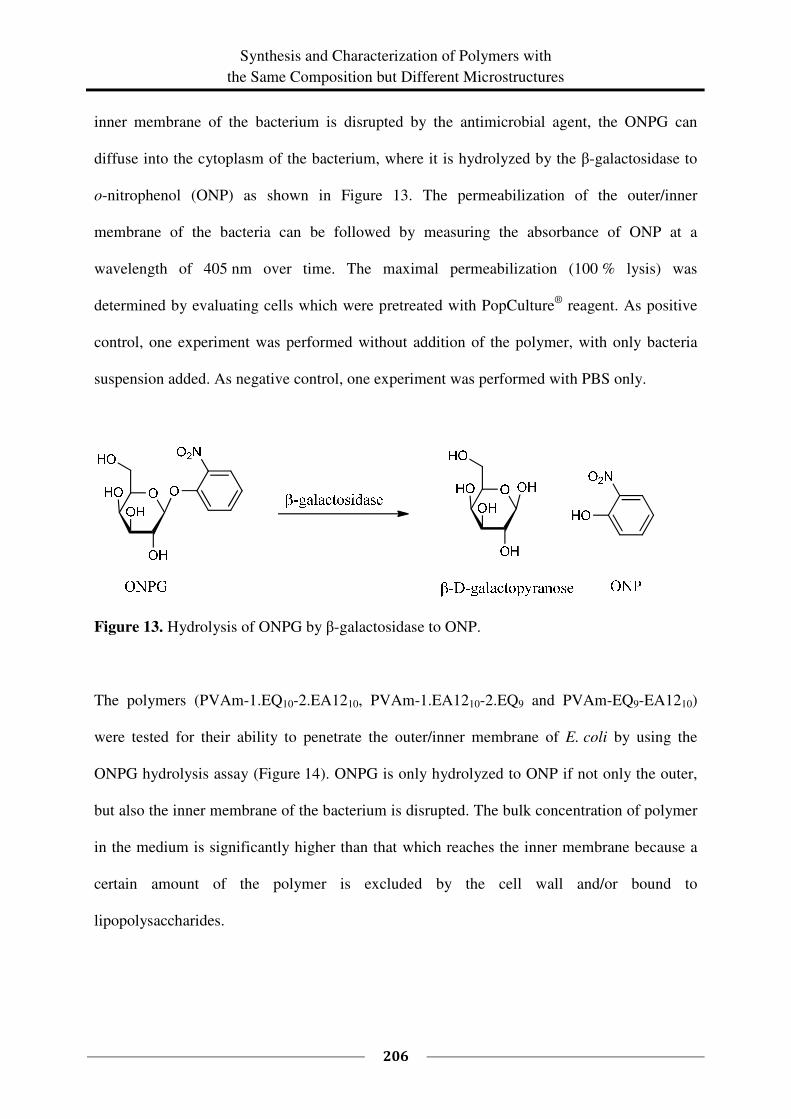
Synthesis and Characterization of Polymers with
the Same Composition but Different Microstructures
206
inner membrane of the bacterium is disrupted by the antimicrobial agent, the ONPG can
diffuse into the cytoplasm of the bacterium, where it is hydrolyzed by the β-galactosidase to
o-nitrophenol (ONP) as shown in Figure 13. The permeabilization of the outer/inner
membrane of the bacteria can be followed by measuring the absorbance of ONP at a
wavelength of 405 nm over time. The maximal permeabilization (100 % lysis) was
determined by evaluating cells which were pretreated with PopCulture®
reagent. As positive
control, one experiment was performed without addition of the polymer, with only bacteria
suspension added. As negative control, one experiment was performed with PBS only.
Figure 13. Hydrolysis of ONPG by β-galactosidase to ONP.
The polymers (PVAm-1.EQ10-2.EA1210, PVAm-1.EA1210-2.EQ9 and PVAm-EQ9-EA1210)
were tested for their ability to penetrate the outer/inner membrane of E. coli by using the
ONPG hydrolysis assay (Figure 14). ONPG is only hydrolyzed to ONP if not only the outer,
but also the inner membrane of the bacterium is disrupted. The bulk concentration of polymer
in the medium is significantly higher than that which reaches the inner membrane because a
certain amount of the polymer is excluded by the cell wall and/or bound to
lipopolysaccharides.
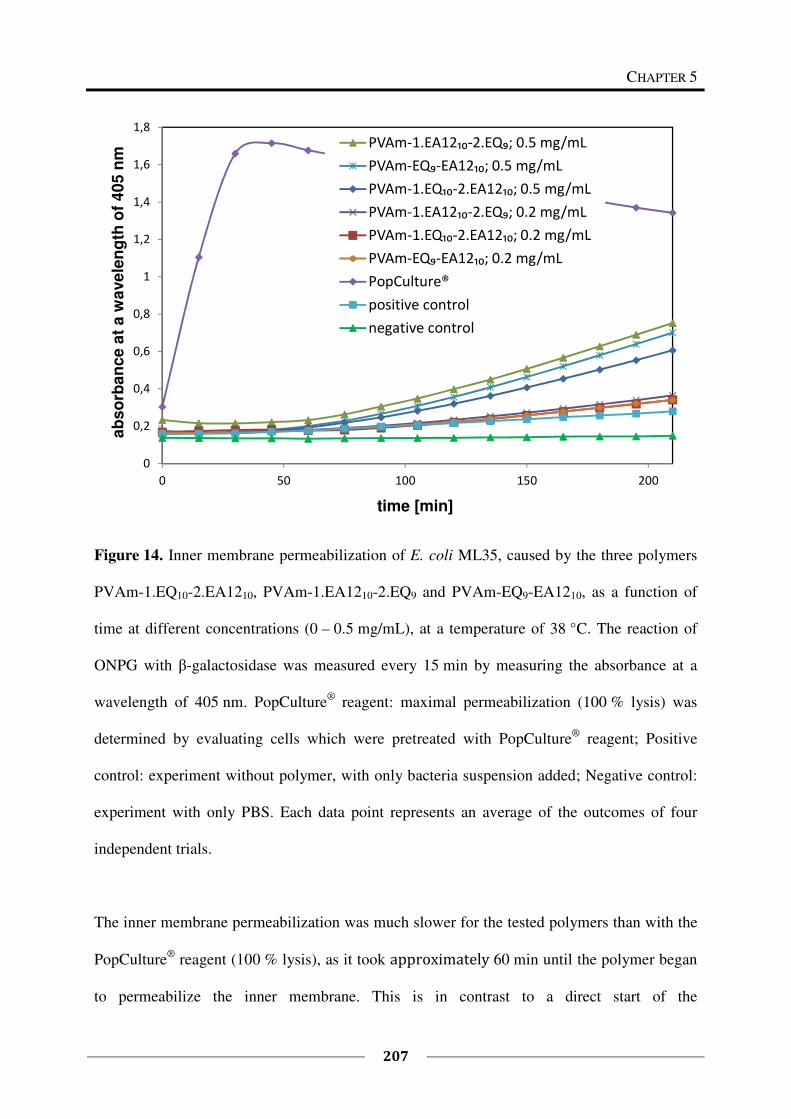
CHAPTER 5
207
Figure 14. Inner membrane permeabilization of E. coli ML35, caused by the three polymers
PVAm-1.EQ10-2.EA1210, PVAm-1.EA1210-2.EQ9 and PVAm-EQ9-EA1210, as a function of
time at different concentrations (0 – 0.5 mg/mL), at a temperature of 38 °C. The reaction of
ONPG with β-galactosidase was measured every 15 min by measuring the absorbance at a
wavelength of 405 nm. PopCulture®
reagent: maximal permeabilization (100 % lysis) was
determined by evaluating cells which were pretreated with PopCulture®
reagent; Positive
control: experiment without polymer, with only bacteria suspension added; Negative control:
experiment with only PBS. Each data point represents an average of the outcomes of four
independent trials.
The inner membrane permeabilization was much slower for the tested polymers than with the
PopCulture®
reagent (100 % lysis), as it took approximately 60 min until the polymer began
to permeabilize the inner membrane. This is in contrast to a direct start of the
0
0,2
0,4
0,6
0,8
1
1,2
1,4
1,6
1,8
0 50 100 150 200
ab
so
rba
nc
e a
t a
wa
ve
len
gth
of
40
5 n
m
time [min]
PVAm-1.EA12₁₀-2.EQ₉; 0.5 mg/mL
PVAm-EQ₉-EA12₁₀; 0.5 mg/mL
PVAm-1.EQ₁₀-2.EA12₁₀; 0.5 mg/mL
PVAm-1.EA12₁₀-2.EQ₉; 0.2 mg/mL
PVAm-1.EQ₁₀-2.EA12₁₀; 0.2 mg/mL
PVAm-EQ₉-EA12₁₀; 0.2 mg/mL
PopCulture®
positive control
negative control
Synthesis and Characterization of Polymers with
the Same Composition but Different Microstructures
208
permeabilization if the PopCulture®
reagent was used. Although there was only a small
amount of ONPG influx through the inner membrane into the cytoplasm, the increasing
absorbance, showing the formation of ONP, demonstrates that the polymers are capable of
damaging the inner membrane. Furthermore, the effectiveness of the polymers increases with
increasing polymer concentration.
For a concentration of 0.2 mg/mL, which is equal to the measured MIC value, the three
polymers only showed a slightly higher membrane permeabilization than the positive control.
The positive control was an experiment without polymer, with only bacteria suspension added
to the test solution. After an experiment duration of 60 min, a small increase in the absorbance
of the positive control that could be caused by some dying bacteria was observed as well. The
permeability of the inner membrane of dying bacteria increases over time and allows some
diffusion of molecules through the inner membrane. In addition, the absorbance of the
solution can be increased due to an increased turbidity, caused by the normal proliferation of
the bacteria.
For a concentration of 0.5 mg/mL, the polymers showed a clear membrane permeabilization
after 60 min. Only small differences in the membrane permeabilization were observed for the
three polymers. The polymer PVAm-1.EA1210-2.EQ9 has got a slightly higher activity,
followed by the polymer PVAm-EQ9-EA1210 which has a slightly lower activity, and the
polymer PVAm-1.EQ10-2.EA1210 which shows a slightly lower activity than both other
polymers.
5.3.8 Proposed Microstructures of the Synthesized Polymers
Based on the different polymer properties three different microstructures are proposed. The
microstructures of the polymers prepared via different routes with a ratio of EQ to EA12 of
1 : 1 will be explained and described in what follows:
CHAPTER 5
209
1) Addition of cationic groups first (e.g., PVAm-1.EQ10-2.EA1210)
During the reaction of the polymer with the cationic groups in the first reaction step, the
cationic charges repel each other so that the polymers conformation is expanded. The cationic
charges are homogeneously distributed along the polymer chain and they force the polymer
chain to a linear conformation with the highest possible distance between the charges. In the
second step of the reaction, the alkyl chains are introduced into the polymer. After the first
chains are attached to the polymer, the next ones will react in their neighborhood because of
the more hydrophobic surrounding. In this way, segregated domains of hydrophobic groups
will arise along the backbone of the polymer. The elongated conformation generated in the
first reaction step will be conserved as shown in Figure 15 a).
2) Addition of hydrophobic groups first (e.g., PVAm-1.EA1210-2.EQ9)
If in the first reaction step the alkyl chains are added to the polymer backbone, they will build
segregated micelle-like domains within the polymer and force the polymer into a strongly
accumulated conformation. The interaction within these domains is so strong that the
repulsion of the cationic groups added in the next step is not high enough to expand the
conformation (Figure 15 b)).
3) Addition of cationic and hydrophobic groups together (e.g., PVAm-EQ9-EA1210)
If both functional groups are added simultaneously, two opponent forces, the repulsive
expanding force of the cationic groups and the accumulating force of the hydrophobic groups,
are active at the same time. The emerging microstructure will be somewhere in between the
structure of the two sequential additions. The polymer chain will stay more flexible
(Figure 15 c)).
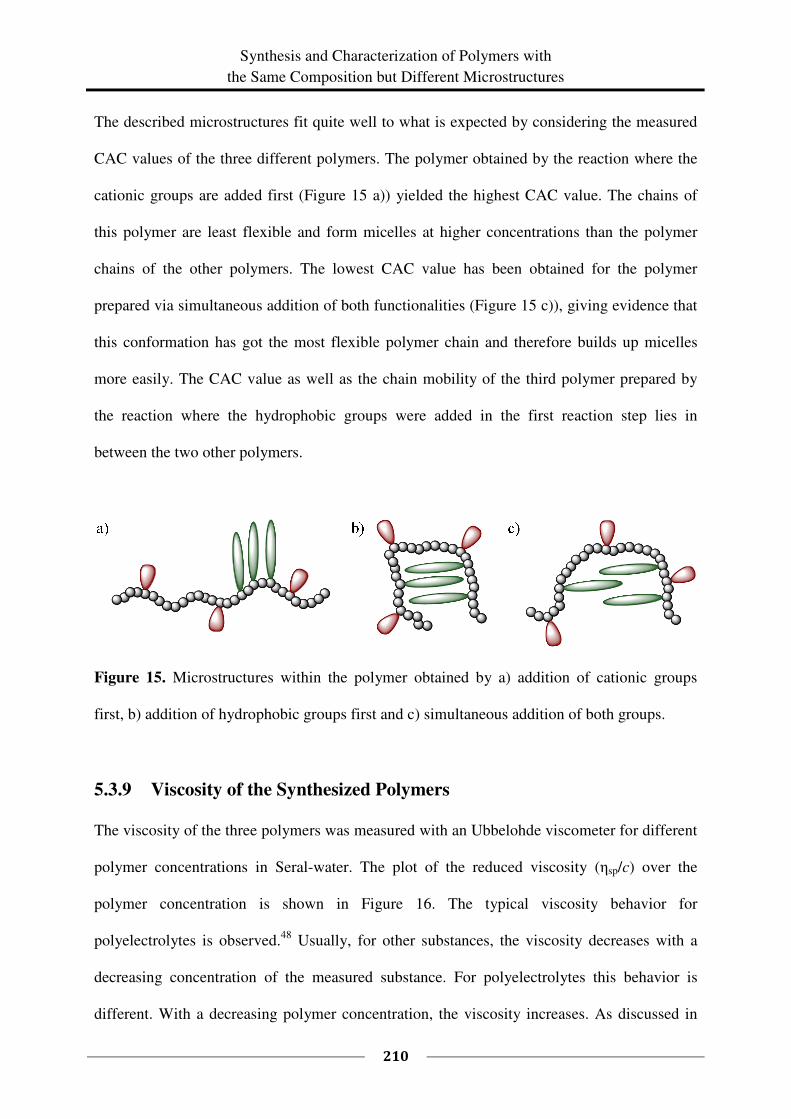
Synthesis and Characterization of Polymers with
the Same Composition but Different Microstructures
210
The described microstructures fit quite well to what is expected by considering the measured
CAC values of the three different polymers. The polymer obtained by the reaction where the
cationic groups are added first (Figure 15 a)) yielded the highest CAC value. The chains of
this polymer are least flexible and form micelles at higher concentrations than the polymer
chains of the other polymers. The lowest CAC value has been obtained for the polymer
prepared via simultaneous addition of both functionalities (Figure 15 c)), giving evidence that
this conformation has got the most flexible polymer chain and therefore builds up micelles
more easily. The CAC value as well as the chain mobility of the third polymer prepared by
the reaction where the hydrophobic groups were added in the first reaction step lies in
between the two other polymers.
Figure 15. Microstructures within the polymer obtained by a) addition of cationic groups
first, b) addition of hydrophobic groups first and c) simultaneous addition of both groups.
5.3.9 Viscosity of the Synthesized Polymers
The viscosity of the three polymers was measured with an Ubbelohde viscometer for different
polymer concentrations in Seral-water. The plot of the reduced viscosity (ηsp/c) over the
polymer concentration is shown in Figure 16. The typical viscosity behavior for
polyelectrolytes is observed.48
Usually, for other substances, the viscosity decreases with a
decreasing concentration of the measured substance. For polyelectrolytes this behavior is
different. With a decreasing polymer concentration, the viscosity increases. As discussed in
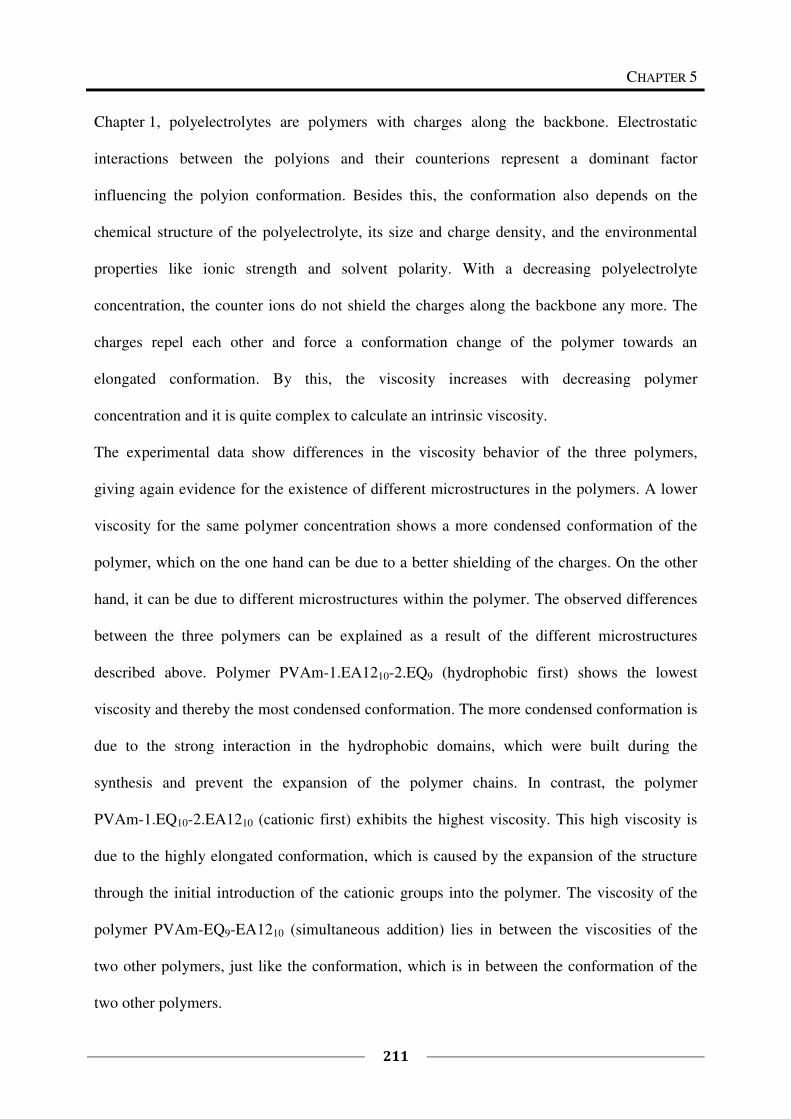
CHAPTER 5
211
Chapter 1, polyelectrolytes are polymers with charges along the backbone. Electrostatic
interactions between the polyions and their counterions represent a dominant factor
influencing the polyion conformation. Besides this, the conformation also depends on the
chemical structure of the polyelectrolyte, its size and charge density, and the environmental
properties like ionic strength and solvent polarity. With a decreasing polyelectrolyte
concentration, the counter ions do not shield the charges along the backbone any more. The
charges repel each other and force a conformation change of the polymer towards an
elongated conformation. By this, the viscosity increases with decreasing polymer
concentration and it is quite complex to calculate an intrinsic viscosity.
The experimental data show differences in the viscosity behavior of the three polymers,
giving again evidence for the existence of different microstructures in the polymers. A lower
viscosity for the same polymer concentration shows a more condensed conformation of the
polymer, which on the one hand can be due to a better shielding of the charges. On the other
hand, it can be due to different microstructures within the polymer. The observed differences
between the three polymers can be explained as a result of the different microstructures
described above. Polymer PVAm-1.EA1210-2.EQ9 (hydrophobic first) shows the lowest
viscosity and thereby the most condensed conformation. The more condensed conformation is
due to the strong interaction in the hydrophobic domains, which were built during the
synthesis and prevent the expansion of the polymer chains. In contrast, the polymer
PVAm-1.EQ10-2.EA1210 (cationic first) exhibits the highest viscosity. This high viscosity is
due to the highly elongated conformation, which is caused by the expansion of the structure
through the initial introduction of the cationic groups into the polymer. The viscosity of the
polymer PVAm-EQ9-EA1210 (simultaneous addition) lies in between the viscosities of the
two other polymers, just like the conformation, which is in between the conformation of the
two other polymers.
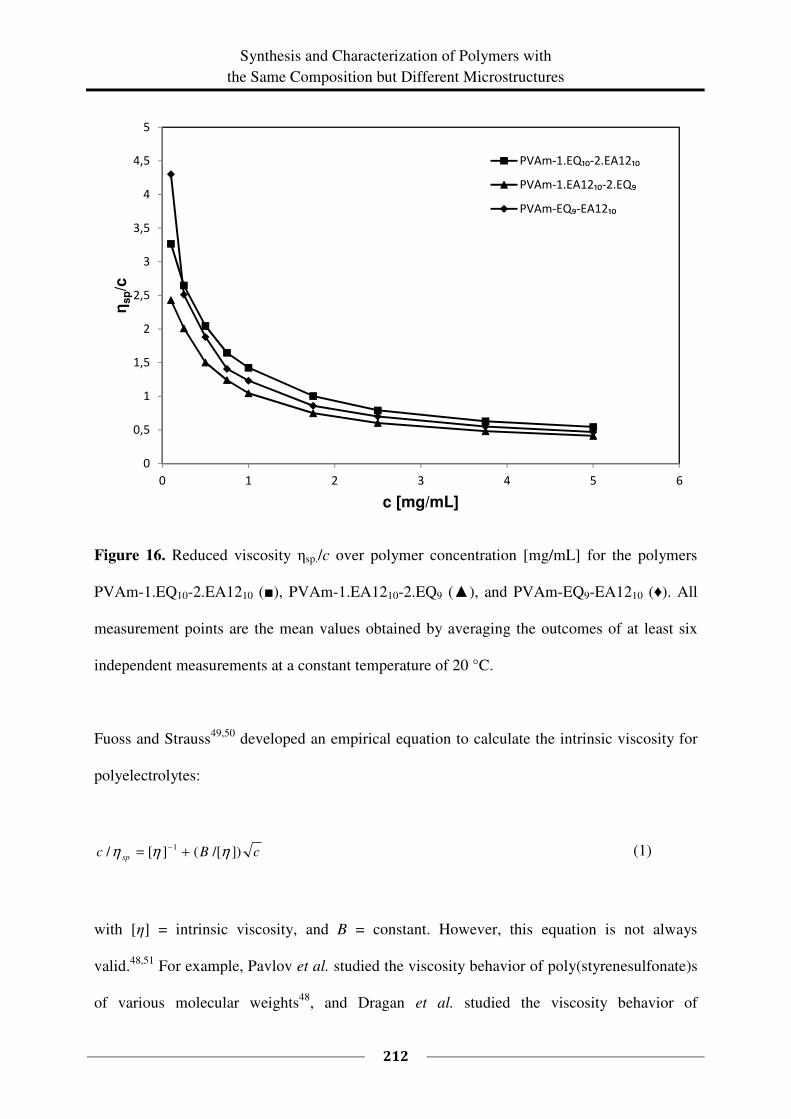
Synthesis and Characterization of Polymers with
the Same Composition but Different Microstructures
212
Figure 16. Reduced viscosity ηsp./c over polymer concentration [mg/mL] for the polymers
PVAm-1.EQ10-2.EA1210 (■), PVAm-1.EA1210-2.EQ9 (▲), and PVAm-EQ9-EA1210 (♦). All
measurement points are the mean values obtained by averaging the outcomes of at least six
independent measurements at a constant temperature of 20 °C.
Fuoss and Strauss49,50
developed an empirical equation to calculate the intrinsic viscosity for
polyelectrolytes:
cBc sp ])/[(][/ 1 ηηη += − (1)
with [η] = intrinsic viscosity, and B = constant. However, this equation is not always
valid.48,51
For example, Pavlov et al. studied the viscosity behavior of poly(styrenesulfonate)s
of various molecular weights48
, and Dragan et al. studied the viscosity behavior of
0
0,5
1
1,5
2
2,5
3
3,5
4
4,5
5
0 1 2 3 4 5 6
ηsp/c
c [mg/mL]
PVAm-1.EQ₁₀-2.EA12₁₀
PVAm-1.EA12₁₀-2.EQ₉
PVAm-EQ₉-EA12₁₀
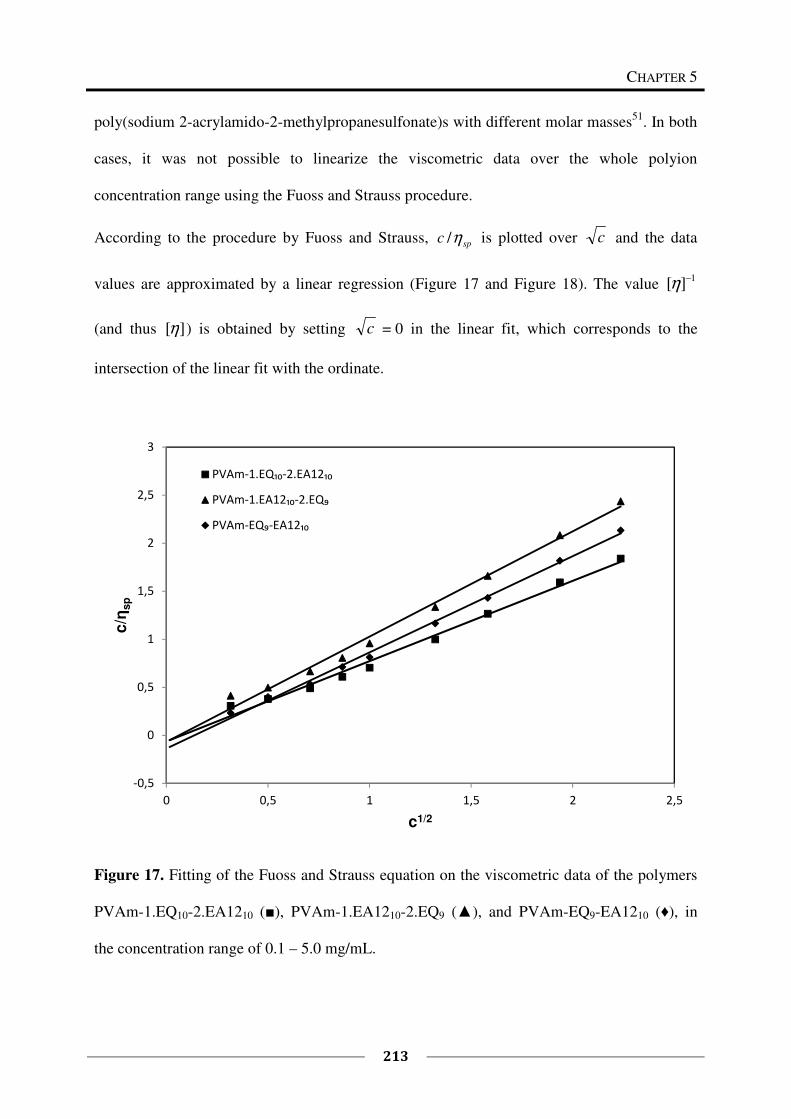
CHAPTER 5
213
poly(sodium 2-acrylamido-2-methylpropanesulfonate)s with different molar masses51
. In both
cases, it was not possible to linearize the viscometric data over the whole polyion
concentration range using the Fuoss and Strauss procedure.
According to the procedure by Fuoss and Strauss, spc η/ is plotted over c and the data
values are approximated by a linear regression (Figure 17 and Figure 18). The value 1][ −η
(and thus ][η ) is obtained by setting c = 0 in the linear fit, which corresponds to the
intersection of the linear fit with the ordinate.
Figure 17. Fitting of the Fuoss and Strauss equation on the viscometric data of the polymers
PVAm-1.EQ10-2.EA1210 (■), PVAm-1.EA1210-2.EQ9 (▲), and PVAm-EQ9-EA1210 (♦), in
the concentration range of 0.1 – 5.0 mg/mL.
-0,5
0
0,5
1
1,5
2
2,5
3
0 0,5 1 1,5 2 2,5
c/η
sp
c1/2
PVAm-1.EQ₁₀-2.EA12₁₀
PVAm-1.EA12₁₀-2.EQ₉
PVAm-EQ₉-EA12₁₀
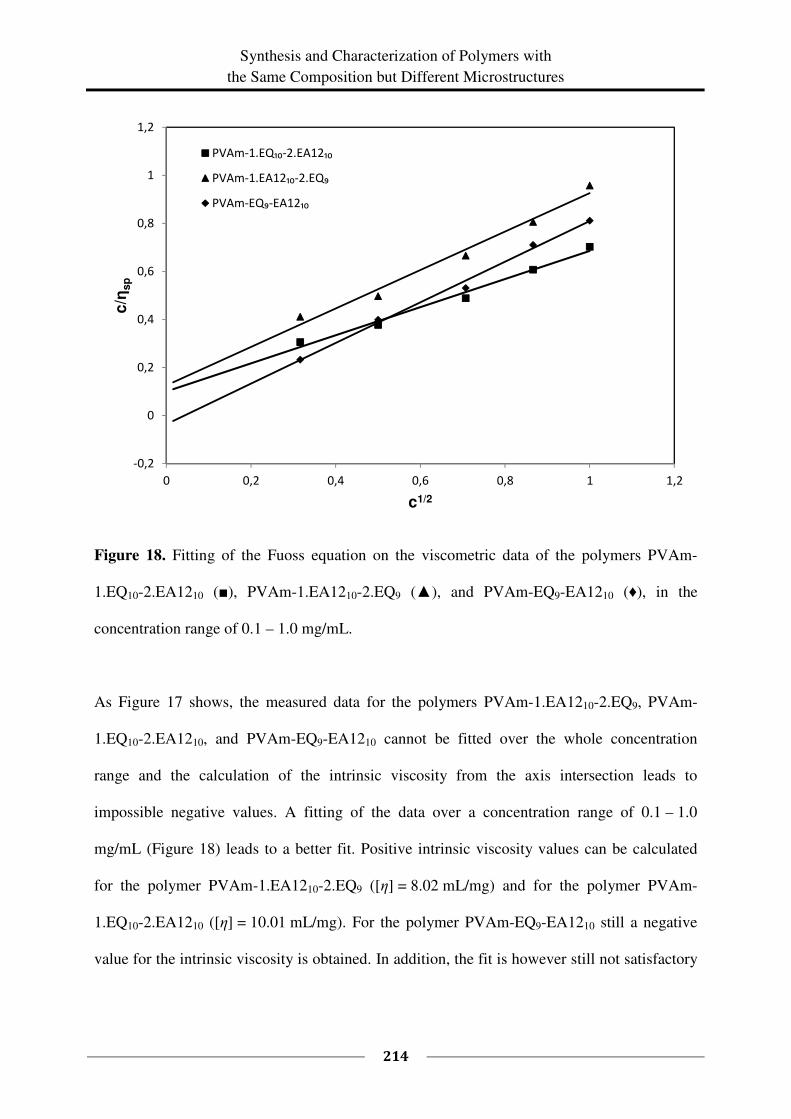
Synthesis and Characterization of Polymers with
the Same Composition but Different Microstructures
214
Figure 18. Fitting of the Fuoss equation on the viscometric data of the polymers PVAm-
1.EQ10-2.EA1210 (■), PVAm-1.EA1210-2.EQ9 (▲), and PVAm-EQ9-EA1210 (♦), in the
concentration range of 0.1 – 1.0 mg/mL.
As Figure 17 shows, the measured data for the polymers PVAm-1.EA1210-2.EQ9, PVAm-
1.EQ10-2.EA1210, and PVAm-EQ9-EA1210 cannot be fitted over the whole concentration
range and the calculation of the intrinsic viscosity from the axis intersection leads to
impossible negative values. A fitting of the data over a concentration range of 0.1 – 1.0
mg/mL (Figure 18) leads to a better fit. Positive intrinsic viscosity values can be calculated
for the polymer PVAm-1.EA1210-2.EQ9 ([η] = 8.02 mL/mg) and for the polymer PVAm-
1.EQ10-2.EA1210 ([η] = 10.01 mL/mg). For the polymer PVAm-EQ9-EA1210 still a negative
value for the intrinsic viscosity is obtained. In addition, the fit is however still not satisfactory
-0,2
0
0,2
0,4
0,6
0,8
1
1,2
0 0,2 0,4 0,6 0,8 1 1,2
c/η
sp
c1/2
PVAm-1.EQ₁₀-2.EA12₁₀
PVAm-1.EA12₁₀-2.EQ₉
PVAm-EQ₉-EA12₁₀
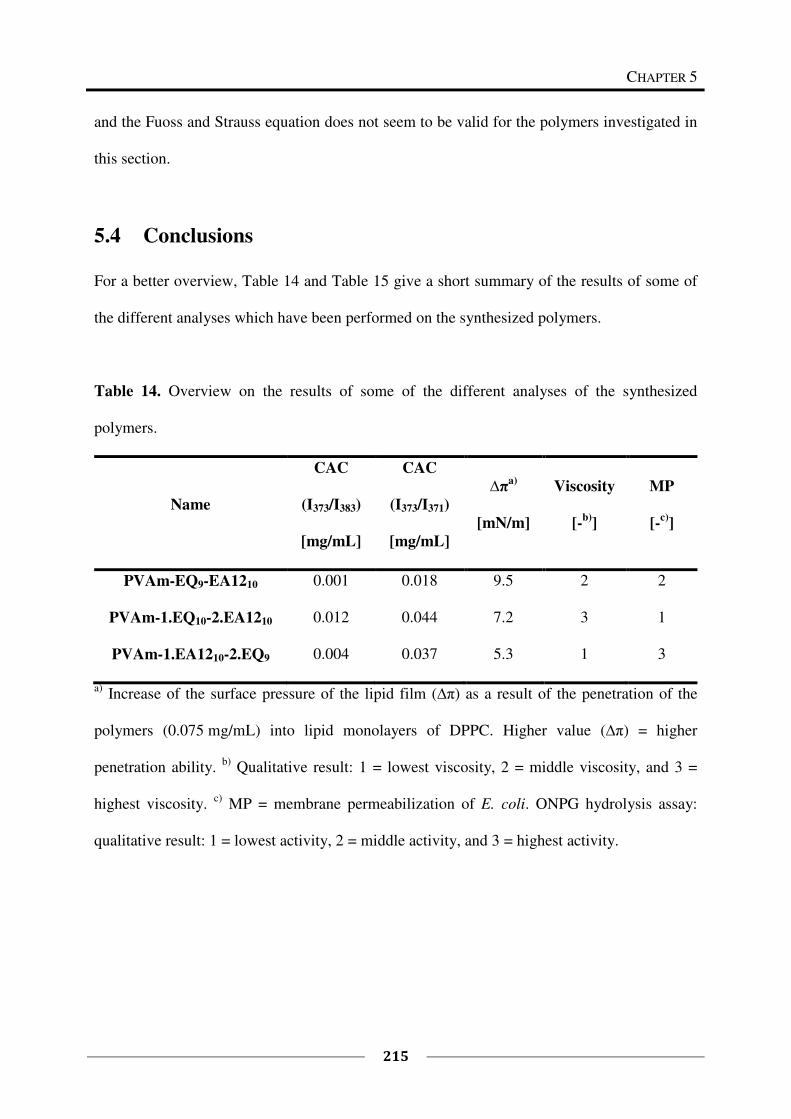
CHAPTER 5
215
and the Fuoss and Strauss equation does not seem to be valid for the polymers investigated in
this section.
5.4 Conclusions
For a better overview, Table 14 and Table 15 give a short summary of the results of some of
the different analyses which have been performed on the synthesized polymers.
Table 14. Overview on the results of some of the different analyses of the synthesized
polymers.
Name
CAC
(I373/I383)
[mg/mL]
CAC
(I373/I371)
[mg/mL]
∆πa)
[mN/m]
Viscosity
[-b)
]
MP
[-c)
]
PVAm-EQ9-EA1210 0.001 0.018 9.5 2 2
PVAm-1.EQ10-2.EA1210 0.012 0.044 7.2 3 1
PVAm-1.EA1210-2.EQ9 0.004 0.037 5.3 1 3
a) Increase of the surface pressure of the lipid film (∆π) as a result of the penetration of the
polymers (0.075 mg/mL) into lipid monolayers of DPPC. Higher value (∆π) = higher
penetration ability. b)
Qualitative result: 1 = lowest viscosity, 2 = middle viscosity, and 3 =
highest viscosity. c)
MP = membrane permeabilization of E. coli. ONPG hydrolysis assay:
qualitative result: 1 = lowest activity, 2 = middle activity, and 3 = highest activity.
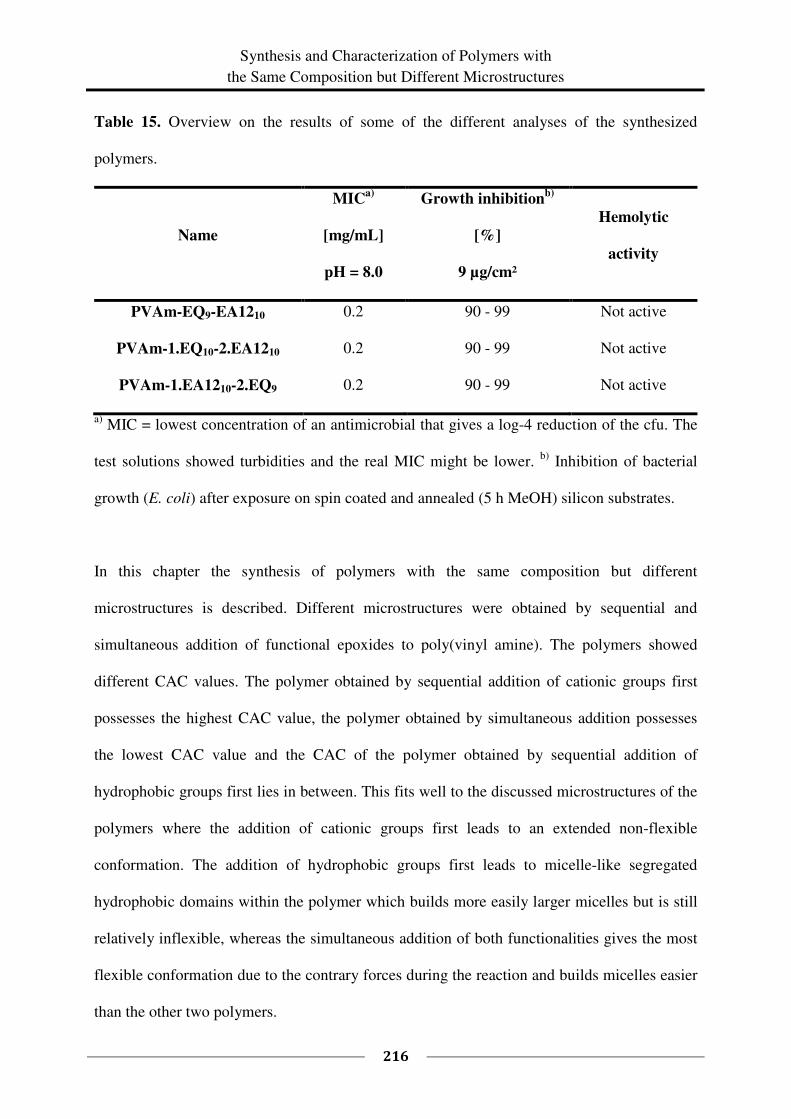
Synthesis and Characterization of Polymers with
the Same Composition but Different Microstructures
216
Table 15. Overview on the results of some of the different analyses of the synthesized
polymers.
Name
MICa)
[mg/mL]
pH = 8.0
Growth inhibitionb)
[%]
9 µg/cm²
Hemolytic
activity
PVAm-EQ9-EA1210 0.2 90 - 99 Not active
PVAm-1.EQ10-2.EA1210 0.2 90 - 99 Not active
PVAm-1.EA1210-2.EQ9 0.2 90 - 99 Not active
a) MIC = lowest concentration of an antimicrobial that gives a log-4 reduction of the cfu. The
test solutions showed turbidities and the real MIC might be lower. b)
Inhibition of bacterial
growth (E. coli) after exposure on spin coated and annealed (5 h MeOH) silicon substrates.
In this chapter the synthesis of polymers with the same composition but different
microstructures is described. Different microstructures were obtained by sequential and
simultaneous addition of functional epoxides to poly(vinyl amine). The polymers showed
different CAC values. The polymer obtained by sequential addition of cationic groups first
possesses the highest CAC value, the polymer obtained by simultaneous addition possesses
the lowest CAC value and the CAC of the polymer obtained by sequential addition of
hydrophobic groups first lies in between. This fits well to the discussed microstructures of the
polymers where the addition of cationic groups first leads to an extended non-flexible
conformation. The addition of hydrophobic groups first leads to micelle-like segregated
hydrophobic domains within the polymer which builds more easily larger micelles but is still
relatively inflexible, whereas the simultaneous addition of both functionalities gives the most
flexible conformation due to the contrary forces during the reaction and builds micelles easier
than the other two polymers.
CHAPTER 5
217
The polymers show differences in their viscosity behavior, which confirm the discussed
different microstructures. Polymer PVAm-1.EA1210-2.EQ9 shows the lowest viscosity and
thereby the most condensed conformation. Polymer PVAm-1.EQ10-2.EA1210 exhibits the
highest viscosity and thereby the most elongated conformation. The viscosity and the
conformation of polymer PVAm-EQ9-EA1210 lies in between the two other polymers.
The antimicrobial effect of the polymers was investigated in solution and on surface. Due to
the appearance of turbidity by adding PBS or nutrient solution to the aqueous polymer
solution the antimicrobial effect in solution could not be determined properly. All three
polymers showed MIC values of about 0.2 mg/mL. The real MIC values might be lower. The
antimicrobial effect of the polymers immobilized on surfaces was tested. Different ways of
film preparation were developed. Drop casting of 0.05 wt% solutions led to very good results
up to 100 % inhibition of growth, however, no differences between the polymers could be
detected. Lowering the amount of polymer in the casting solution to 0.025 wt% led to
inhomogeneities in the surface coating and a high variance in the measured values (up to
99.9999 % inhibition of growth) was obtained. Due to this high variance of the measured
values, no differences in antimicrobial activity between the three polymers could be detected
at this point. In the next step the surface coating was optimized and the properties of polymer
coatings obtained by spin coating and annealing in methanol atmosphere for different times
were determined. The coating thickness was determined by ellipsometry to be about 90 nm
and is not influenced by the annealing. Annealing with methanol for 4 h leads to
homogeneous surfaces. The antimicrobial effect decreases through the annealing from 99.9 %
to 99 % inhibition of growth, due to the formation of thermodynamically stable conformations
of the polymer chains, which have got a lower antimicrobial activity than the mixture of
conformations which has been on the surface before the annealing. However, the
antimicrobial results are very good reproducible and this is the most important point to
Synthesis and Characterization of Polymers with
the Same Composition but Different Microstructures
218
compare the properties of the developed polymers. Again it is not possible to distinguish
between the three polymers. Contact angle measurements showed that the surfaces are more
hydrophilic after annealing. This proves the rearrangement of the chains. The hydrophobic
parts go to the inside and the hydrophilic parts go to the outside of the coating.
The hemolytic activity of the polymers on spin coated surfaces before and after annealing was
studied directly on the surface and as an extract of the surface. Under all testing conditions the
polymers exhibit no significant hemolytic activity. The different microstructures do not lead
to differences in hemolytic activity.
The penetration ability of the polymers into membranes was tested (i) for Langmuir
monolayers of neutral and of charged lipids and (ii) by using the ONPG hydrolysis assay the
permeabilization of the outer/inner membrane of E. coli was investigated:
(i) It was found that the penetration ability of the polymers into charged monolayers of
DPPC/DPPG is higher than the penetration ability into neutral monolayers (DPPC). The
different microstructures lead to differences in the penetration ability of the polymers. The
polymer obtained by simultaneous addition of the functionalities (PVAm-EQ9-EA1210)
exhibits the highest penetration ability, whereas the polymer obtained by adding the
hydrophobic groups first (PVAm-1.EA1210-2.EQ9) possesses the lowest penetration ability.
(ii) The ONPG hydrolysis assay showed that it takes ∼ 60 min for the polymer to begin to
permeabilize the inner membrane. The formation of ONP demonstrates that the polymer is
capable of damaging the inner membrane. The different microstructures lead to only small
differences in permeabilization ability.
The differences in the polymer properties like CAC, penetration ability into membranes,
viscosity, and so on, prove the successful introduction of different microstructures into the
polymers.
CHAPTER 5
219
5.5 Literature
1 E. F. Palermo, K. Kuroda, Appl Microbiol Biotechnol 2010, 87, 1605–1615.
2 G. N. Tew, R. W. Scott, M. L. Klein, W. F. Degrado, Acc. Chem. Res. 2010 43, 30–39.
3 C. Z. S. Chen, S. L. Cooper, Adv Mater 2000, 12, 843–846.
4 M. F. Ilker, K. Nusslein, G. N. Tew, E. B. Coughlin, J. Am. Chem. Soc. 2004, 126, 15870–15875.
5 K. Kuroda, G. A. Caputo, W. F. DeGrado, Chem. Eur. J. 2009, 15, 1123–1133.
6 B. P. Mowery, S. E. Lee, D. A. Kissounko, R. F. Epand, R. M. Epand, B. Weisblum, S. S. Stahl, S. H.
Gellman, J. Am. Chem. Soc. 2007, 129, 15474.
7 B. P. Mowery, A. H. Lindner, B. Weisblum, S. S. Stahl, S. H. Gellman, J. Am. Chem. Soc. 2009, 131, 9735–
9745.
8 E. F. Palermo, K. Kuroda, Biomacromolecules 2009, 10, 1416–1428.
9 E. F. Palermo, I. Sovadinova, K. Kuroda, Biomacromolecules 2009, 10, 3098–3107.
10 P. H. Sellenet, B. Allison, B. M. Applegate, J. P. Youngblood, Biomacromolecules 2007, 8, 19–23.
11 T. R. Stratton, J. L. Rickus, J. P. Youngblood, Biomacromolecules 2009, 10, 2550–2555.
12 N. Pasquier, H. Keul, E. Heine, M. Moeller, B. Angelov, S. Linser, R. Willumeit, Macromol. Biosci. 2008, 8,
903–915.
13 É. Kiss, E. T. Heine, K. Hill, Y-C. He, N. Keusgen, Cs. B. Pénzes, D. Schnöller, G. Gyulai, A. Mendrek, H.
Keul, M. Möller, Macromolecular Bioscience 2012, 12 (9), 1181–1189.
14 Y. He, E. Heine, N. Keusgen, H. Keul*, M. Möller, Biomacromolecules 2012, 13 (3), 612–623.
15 B. Michaels, MPMN 2010, 26 (7), Synthetic Polymer Mimics Antimicrobial Properties of Host-Defense
Proteins.
16 D. M. Hoover, K. R. Rajashankar, R. Blumenthal, A. Puri, J. J. Oppenheim, O. Chertov, J. Lubkowski, J. Biol.
Chem. 2000, 275 (42), 32911–32918.
17 M. V. Sawai, H. P. Jia, L. Liu, V. Aseyev, J. M. Wiencek, P. B. McCray, Jr., T. Ganz, W. R. Kearney, B. F.
Tack, Biochemistry 2001, 40, 3810–3816.
18 F. Bauer, K. Schweimer, E. Klüver, J.-R. Conejo-Garcia, W.-G. Forssmann, P. Rösch, K. Adermann, H.
Sticht, Protein Sci. 2001, 10, 2470–2479.
19 D. Yang, A. Biragyn, L. W. Kwak, J. J. Oppenheim, Trends Immunol. 2002, 23 (6), 291–296.
Synthesis and Characterization of Polymers with
the Same Composition but Different Microstructures
220
20 G. L. Butterfoss, B. Yoo, I. Chorny, J. N. Jaworski, K. A. Dill, K. Kirshenbaum, R. Bonneau, R. N.
Zuckermann, V. A. Voelz, PNAS 2012, 109 (36), 14320-14325.
21 B.-C. Lee, T. K. Chu, K. A. Dill, R. N. Zuckermann, J. Am. Chem. Soc. 2008, 130, 8847-8855.
22 C. M. Goodman, S. Choi, S. Shandler, W. F. DeGrado, Nat. Chem. Biol. 2007, 3, 252-262.
23 K. Kirshenbaum, R. N. Zuckermann, K. A. Dill, Curr. Opin. Struct. Biol. 1999, 9, 530-535.
24 A. E. Barron, R. N. Zuckermann, Curr. Opin. Struct. Biol. 1999, 9, 681-687.
25 D. J. Hill, M. J. Mio, R. B. Prince, T. S. Hughes, J. S. Moore, Chem. Rev. 2001, 101, 3893-4012.
26 T. L. Raguse, J. R. Lai, P. R. LePlae, S. H. Gellman, Org. Lett. 2001, 3, 3963–3966.
27 B.-C. Lee, R. N. Zuckermann, K. A. Dill, J. Am. Chem. Soc. 2005, 127, 10999–11009.
28 J. L. Goodman, E. J. Petersson, D. S. Daniels, J. X. Qiu, A. Schepartz, J. Am. Chem. Soc. 2007, 129, 14746-
14751.
29 M. Wilhelm, C. L. Zhao, Y. Wang, R. Xu, M. A. Winnik, J. L. Mura, G. Riess, M. D. Croucher,
Macromolecules 1991, 24, 1033-1040.
30 A. Ramzi, M. Prager, D. Richter, V. Efstratiadis, N. Hadjichristidis, R. N. Young, J. B. Allgaier,
Macromolecules 1997, 30, 7171-7177.
31 Antimicrobial testing method for coated substrates developed by DWI an der RWTH Aachen e.V.: EXPOSE.
The testing method was developed on the basis of DIN EN ISO 20743 (a).
32 DIN EN ISO 14160:2011-10, German Version EN ISO 14160:2011.
33 Log-Reduction-Fact-Sheet: http://www.garnerdecontaminationsolutions.com/resources/HFI-Log-Reduction-
Chart.pdf.
34 Y. Wang, J. Xu, Y. Zhang, H. Yan, K. Liu, Macromol. Biosci. 2011, 11, 1499.
35 Test based on the Standard Practice for Assessment of Hemolytic Properties of Materials ASTM F756-08.
36 Test based on the Standard Practice for Extraction of Medical Plastics ASTM F619-03.
37 The Langmuir Film Experiments were carried out in cooperation with Kiss et al. at the Laboratory of
Interfaces and Nanostructures, Institute of Chemistry, Eötvös Loránd University, Budapest, Hungary.
38 N. J. Hardy, T. H. Richardson, F. Grunfeld, Colloids Surf. A 2006, 202, 284.
39 L. Silvestro, J. N. Weiser, P. H. Axelsen, Antimicrobial Agents and Chemotherapy 2000, 44 (3), 602-607.
40 K. Kalyanasundaram, Langmuir 1988, 4, 942.
CHAPTER 5
221
41 K. Kalyanasundaram, J. K. Thomas, J. Am. Chem. Soc. 1977, 99, 2039-2044.
42 J. Z. Du, D. P. Chen, Y. C. Wang, C. S. Xiao, Y. L. Lu, J. Wang, G. Z. Zhang, Biomacromolecules 2006, 7,
1898-1904.
43 J. Aguiar, P. Carpena, J.A. Molina-Bolívar, C. Carnero Ruiz, Journal of Colloid and Interface Science 2003,
258, 116–122.
44 W. R. Glomm, S. Volden, O. Halskau, Jr., M.-H. G. Ese, Anal. Chem. 2009, 81, 3042.
45 Cs. B. Pénzes, D. Schnöller, K. Horváti, Sz. Bősze, G. Mező, É. Kiss, Colloids Surf. A 2012, 413, 142– 148.
46 K. Hill, Cs. B. Pénzes, D. Schnöller, K. Horváti, Sz. Bősze, F. Hudecz, T. Keszthelyi, É. Kiss, Phys. Chem.
Chem. Phys. 2010, 12, 11498–11506.
47 K. Hill, Cs. B. Pénzes, B. G. Vértessy, Z. Szabadka, V. Grolmusz, É. Kiss, Progr. Colloid Polymer Sci. 2008,
135, 87-92.
48 G. M. Pavlov, A. S. Gubarev, I. I. Zaitseva, M. A. Sibileva, Russ. J. App. Chem. 2006, 79 (9), 1407 – 1412.
49 R. M. Fuoss, J. Polym. Sci. 1948, 3, 603.
50 R. M. Fuoss, U. P. Strauss, Ann. N. Y. Acad Sci, 1949, 51, 836.
51 S. Dragan, M. Mihai, L. Ghimici, Europ. Polym. J. 2003, 39, 1847-1854.
Synthesis and Characterization of Polymers with
the Same Composition but Different Microstructures
222
CHAPTER 6
223
SUMMARY
This thesis deals with the preparation and characterization of novel multifunctional poly(vinyl
amine)s. Poly(vinyl amine) was functionalized with quaternary ammonium groups and alkyl
groups with the goal to mimic natural antimicrobial peptides. The resulting materials can be
used as antimicrobial agents for surface coatings or textile finishings.
All polymer structures within this thesis are based on poly(vinyl amine) (PVAm), a linear
cationic polyelectrolyte bearing one primary amine group in each repeating unit. The post
polymerization modification with functional epoxides in a one-step reaction is a versatile
approach to introduce hydrophobic and hydrophilic functionalities into the polymer.
At first, Chapter 1 gives an overview on the used polymer poly(vinyl amine), the post
polymerization modification technique, as well as the constitution of bacteria and modes of
action of antimicrobial agents.
To study the post polymerization modification, PVAm was reacted with different
epoxyalkanes (-dodecane (EA12), -decane, and -octane) and the quaternary ammonium group
bearing epoxide glycidyltrimethylammonium chloride (EQ) in Chapter 2. These epoxides
were successfully introduced into the polymer with different degrees of functionalization. The
limit of the degree of functionalization with epoxyalkanes was found to be around 50 %,
probably due to sterical hindrance. Due to the repulsion of the cationic groups of EQ, the
degree of functionalization with quaternary ammonium groups is limited to around 70 %. For
degrees of functionalization below these limits, it is possible to obtain equimolar and
reproducible conversions of the educts. The degree of functionalization can easily be adjusted
Summary
224
by the ratio of functional epoxides to amine groups giving access to a high variety of
polymers. Fractionation experiments with NMR analysis proved a homogenous modification
of the polymers. Finally, the reaction was successfully transferred from the poly(vinyl amine)
of high purity to technically available poly(vinyl amine) (Lupamins) rendering a scale up of
the reaction for later applications possible.
In Chapter 3, the new functional poly(vinyl amine)s containing hydrophobic moieties were
studied with regard to their ability to form micelle-like aggregates in aqueous solution.
Critical aggregation concentrations (CAC) were determined as a function of the chain length.
In comparison to Chapter 2, the reaction was extended to include even longer alkyl chains
(chain lengths from 8 to 18, in steps of two carbon atoms). It turned out that an increasing
chain length induces a decrease of the CAC values (from 0.2176 mg/mL to 0.0096 mg/mL).
This shows that the longer alkyl chains form hydrophobic domains within the polymer more
rapidly and more easily than the shorter alkyl chains. It was found that at concentrations
below the CAC, unimolecular micelles are built and an increasing alkyl chain length leads to
larger (and thus eventually more stable) unimolecular micelles. These hydrophobic regions do
not depend on the concentration, giving evidence to the assumption that hydrophobic domains
are built within the polymer during the reaction. For the epoxides EA12, the CAC of the
resulting polymers was additionally determined as a function of the concentration (10 % to
40 %, in steps of 10 %) of the introduced alkyl chains. It was found that an increasing
concentration of alkyl chains leads to a stepwise decrease of the CAC. The increase of the
alkyl chain concentration from 20 % to 30 % seems to be a crucial step to increase the ability
of the polymers to form micelles. This is expected to be different for varying chain lengths.
Due to increasing resistances of bacteria towards common antimicrobial agents, there is a
significant need for new antimicrobial compounds. To illustrate the effectiveness of the newly
developed polymers as antimicrobial agents, their antimicrobial activity against E. coli was
CHAPTER 6
225
examined in solution and coated on substrates in Chapter 4. Different ways of film
preparation were developed for coating the polymers on surfaces and the antimicrobial
activity of each of these coatings was investigated. It was found that for very thin coatings,
the best results in terms of surface homogeneity and thereby reproducibility of the
antimicrobial results were obtained by spin coating and annealing in methanol atmosphere.
The influence of the hydrophilic/hydrophobic balance on the antimicrobial activity and on the
ability to penetrate into lipid monolayers was studied. This required the preparation and
testing of different series of polymers. In a first series of experiments, the antimicrobial effect
of the functional poly(vinyl amine)s was investigated as a function of different concentrations
of cationic groups (23 %, 30 %, (and 73 %)). In a second series, the antimicrobial effect was
studied as a function of varying concentrations of alkyl chains (EA12, 10 %, 21 %, 32 %, and
41 %). Afterwards, the antimicrobial activity of polymers containing both hydrophilic and
hydrophobic functionalities was examined. First, the concentration of alkyl chains was varied
(EA12, 10 %, 22 %) while keeping the concentration of cationic groups constant (7 %).
Second, the concentration of cationic groups was varied (0 %, 5 %, 7 %, 14 %, 17 %, 21 %,
and 28 %) at a constant concentration of alkyl chains (EA12, 11 %). The antimicrobial testing
of the polymer coatings revealed that the antimicrobial activity increases with an increasing
concentration of the cationic epoxide EQ and decreases with an increasing concentration of
the epoxyalkane EA12. It was observed that the coating thickness of the polymers has an
impact on the antimicrobial activity, which increases with increasing coating thickness. It
turned out that the solubility of the polymers in water increased with an increasing
concentration of cationic groups and that the polymers without introduced alkyl chains started
to leach from the surfaces. Therefore, the antimicrobial activity of the polymers containing
more than 13 % cationic groups was additionally tested in aqueous solution and the same
trend in antimicrobial activity as for the polymer coatings was observed. It was found that
Summary
226
among the polymers coated on surfaces, PVAm-EQ28-EA1211 showed the best antimicrobial
activity (99.9 % - 100 % inhibition of bacterial growth) without leaching of material. Among
the polymers tested in aqueous solution, PVAm-EQ30 showed the best antimicrobial activity
(100 % inhibition of growth), which was even higher than the activity of the coated polymers.
In the second part of this chapter, the ability of the polymer molecules to penetrate into a
neutral lipid layer of dipalmitoylphosphatidylcholine (DPPC) was tested in Langmuir film
experiments. The goal of these experiments was to investigate the influence of the
hydrophilic/hydrophobic balance on the penetration ability of the novel polymers. The
penetration ability was studied as a function of the concentration of cationic groups with and
without introduced alkyl chains (EA12, 11 %). The thorough analysis showed that the
penetration ability of the polymers reaches a maximum at a concentration of 17 % cationic
groups in the polymer. The additional introduction of 11 % alkyl chains led in general to
higher membrane affinities. In the next step, the penetration ability was studied as a function
of the concentration of alkyl chains (EA12). This analysis revealed that the penetration ability
increases with an increasing concentration of alkyl chains. This tendency stands in contrast to
the trend in the antimicrobial activity, which decreases with increasing concentration of alkyl
chains. This difference can be assigned to distinctions between the membrane polarity of the
model system DPPC (neutral) and the natural bacterial membrane (negative), leading to
differences in the interaction of the polymer and the membrane. In the neutral DPPC lipid
layer system, hydrophobic interactions play the major role, whereas in the case of the negative
bacterial membrane, ionic interactions play a crucial role in the polymer membrane
interaction. It was found that among the tested polymers, PVAm-EQ17-EA1211 shows the
highest membrane affinity with an increase in surface pressure (∆π) of 10.6 mN/m.
Since the antimicrobial mode of action of peptides containing cationic and hydrophobic
amino acid residues is not completely understood to this date, the structure-properties
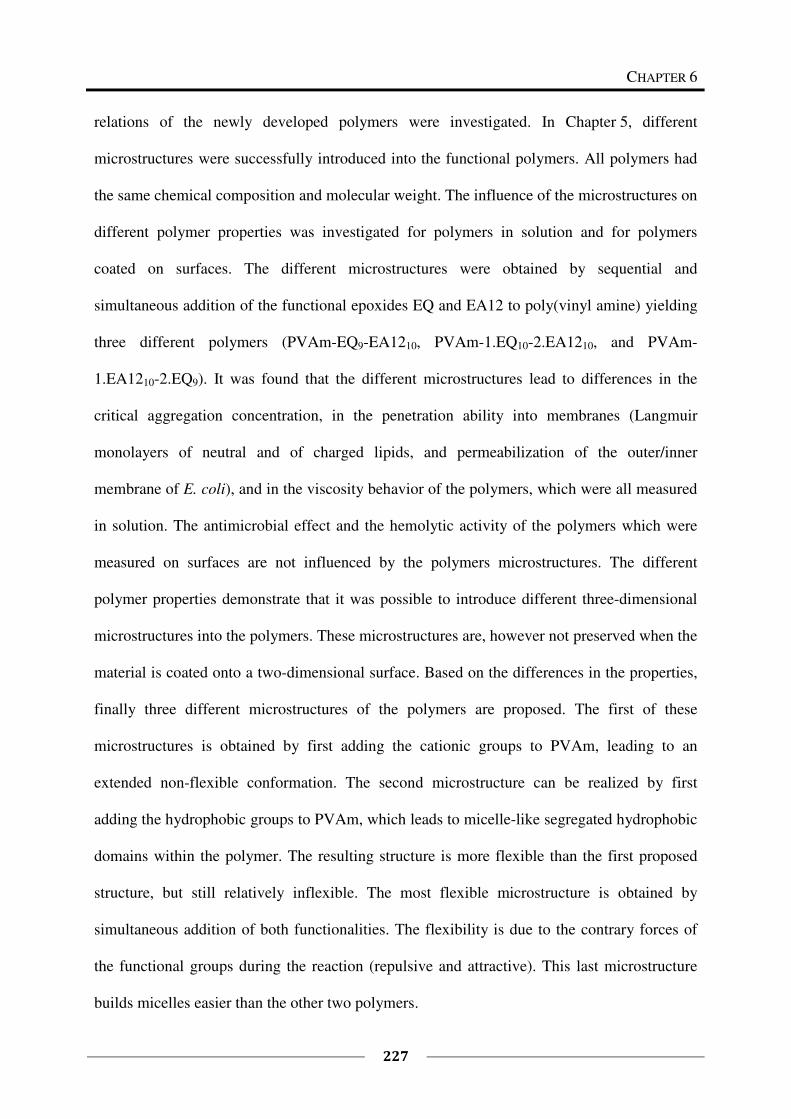
CHAPTER 6
227
relations of the newly developed polymers were investigated. In Chapter 5, different
microstructures were successfully introduced into the functional polymers. All polymers had
the same chemical composition and molecular weight. The influence of the microstructures on
different polymer properties was investigated for polymers in solution and for polymers
coated on surfaces. The different microstructures were obtained by sequential and
simultaneous addition of the functional epoxides EQ and EA12 to poly(vinyl amine) yielding
three different polymers (PVAm-EQ9-EA1210, PVAm-1.EQ10-2.EA1210, and PVAm-
1.EA1210-2.EQ9). It was found that the different microstructures lead to differences in the
critical aggregation concentration, in the penetration ability into membranes (Langmuir
monolayers of neutral and of charged lipids, and permeabilization of the outer/inner
membrane of E. coli), and in the viscosity behavior of the polymers, which were all measured
in solution. The antimicrobial effect and the hemolytic activity of the polymers which were
measured on surfaces are not influenced by the polymers microstructures. The different
polymer properties demonstrate that it was possible to introduce different three-dimensional
microstructures into the polymers. These microstructures are, however not preserved when the
material is coated onto a two-dimensional surface. Based on the differences in the properties,
finally three different microstructures of the polymers are proposed. The first of these
microstructures is obtained by first adding the cationic groups to PVAm, leading to an
extended non-flexible conformation. The second microstructure can be realized by first
adding the hydrophobic groups to PVAm, which leads to micelle-like segregated hydrophobic
domains within the polymer. The resulting structure is more flexible than the first proposed
structure, but still relatively inflexible. The most flexible microstructure is obtained by
simultaneous addition of both functionalities. The flexibility is due to the contrary forces of
the functional groups during the reaction (repulsive and attractive). This last microstructure
builds micelles easier than the other two polymers.
Summary
228
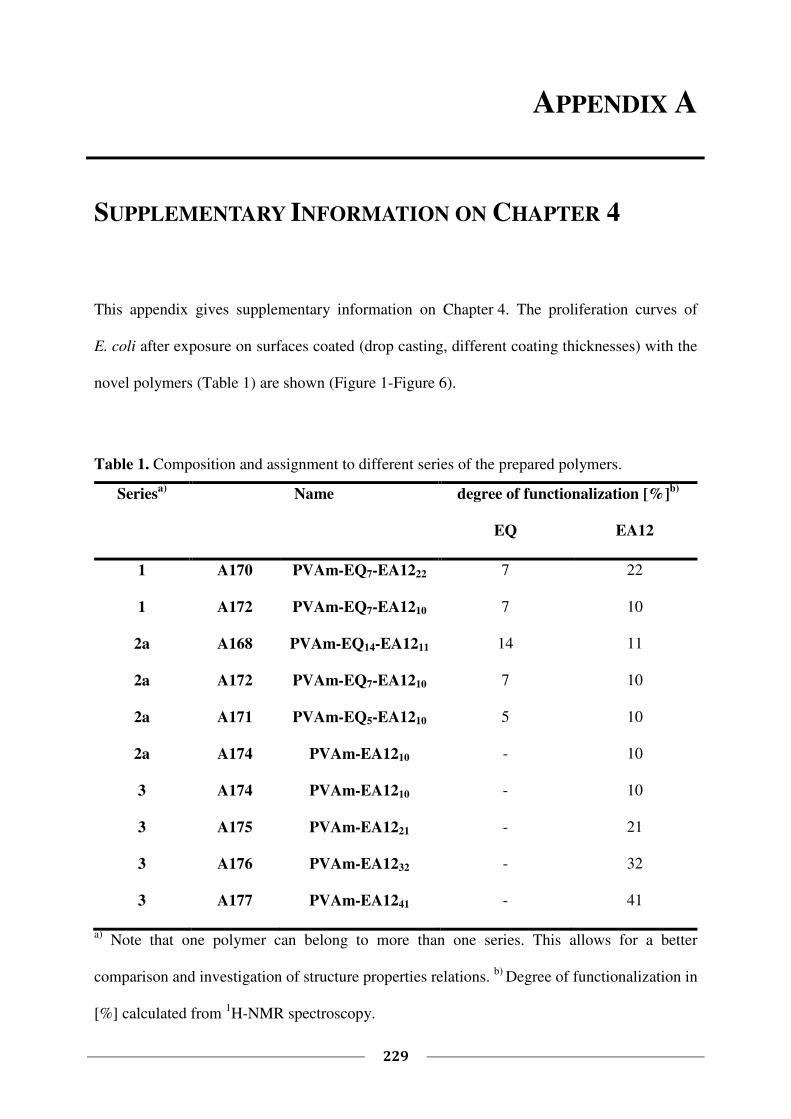
APPENDIX A
229
SUPPLEMENTARY INFORMATION ON CHAPTER 4
This appendix gives supplementary information on Chapter 4. The proliferation curves of
E. coli after exposure on surfaces coated (drop casting, different coating thicknesses) with the
novel polymers (Table 1) are shown (Figure 1-Figure 6).
Table 1. Composition and assignment to different series of the prepared polymers.
Seriesa)
Name degree of functionalization [%]b)
EQ EA12
1 A170 PVAm-EQ7-EA1222 7 22
1 A172 PVAm-EQ7-EA1210 7 10
2a A168 PVAm-EQ14-EA1211 14 11
2a A172 PVAm-EQ7-EA1210 7 10
2a A171 PVAm-EQ5-EA1210 5 10
2a A174 PVAm-EA1210 - 10
3 A174 PVAm-EA1210 - 10
3 A175 PVAm-EA1221 - 21
3 A176 PVAm-EA1232 - 32
3 A177 PVAm-EA1241 - 41
a) Note that one polymer can belong to more than one series. This allows for a better
comparison and investigation of structure properties relations. b)
Degree of functionalization in
[%] calculated from 1H-NMR spectroscopy.
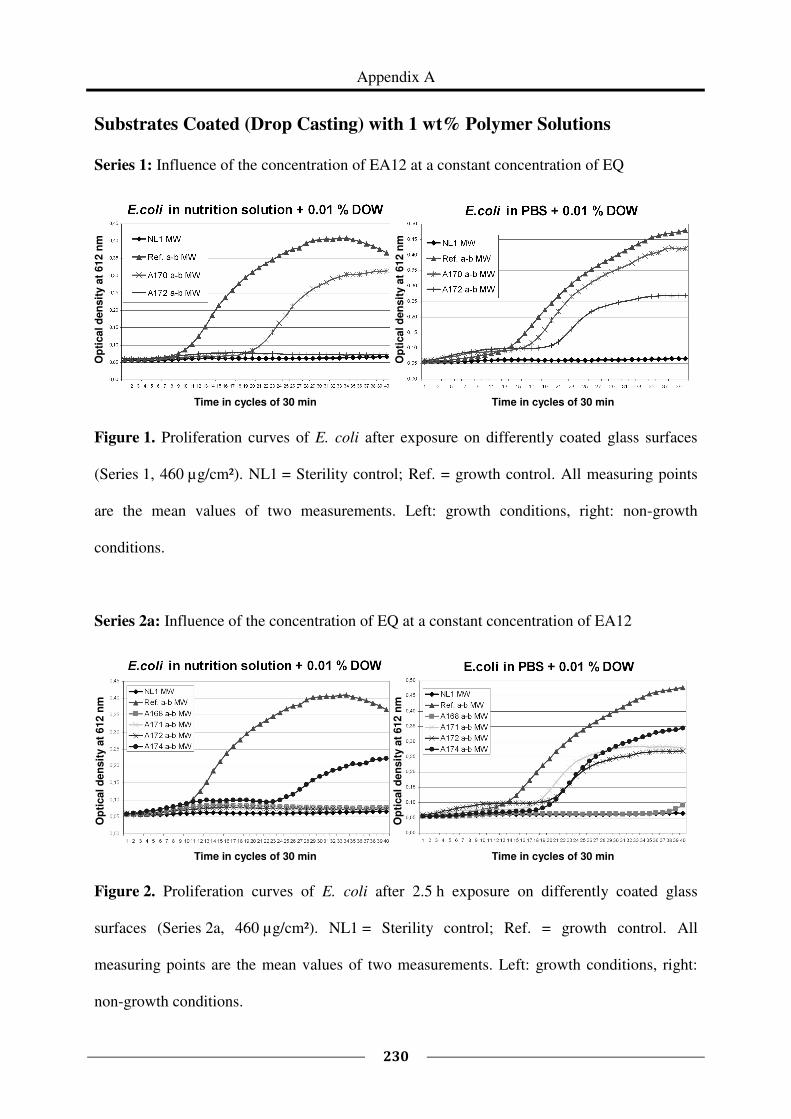
Appendix A
230
Substrates Coated (Drop Casting) with 1 wt% Polymer Solutions
Series 1: Influence of the concentration of EA12 at a constant concentration of EQ
Figure 1. Proliferation curves of E. coli after exposure on differently coated glass surfaces
(Series 1, 460 µg/cm²). NL1 = Sterility control; Ref. = growth control. All measuring points
are the mean values of two measurements. Left: growth conditions, right: non-growth
conditions.
Series 2a: Influence of the concentration of EQ at a constant concentration of EA12
Figure 2. Proliferation curves of E. coli after 2.5 h exposure on differently coated glass
surfaces (Series 2a, 460 µg/cm²). NL1 = Sterility control; Ref. = growth control. All
measuring points are the mean values of two measurements. Left: growth conditions, right:
non-growth conditions.
Time in cycles of 30 min Time in cycles of 30 min
Op
tical d
en
sit
y a
t 612 n
m
Op
tical d
en
sit
y a
t 612 n
m
Op
tical d
en
sit
y a
t 612 n
m
Op
tical d
en
sit
y a
t 612 n
m
Time in cycles of 30 min Time in cycles of 30 min
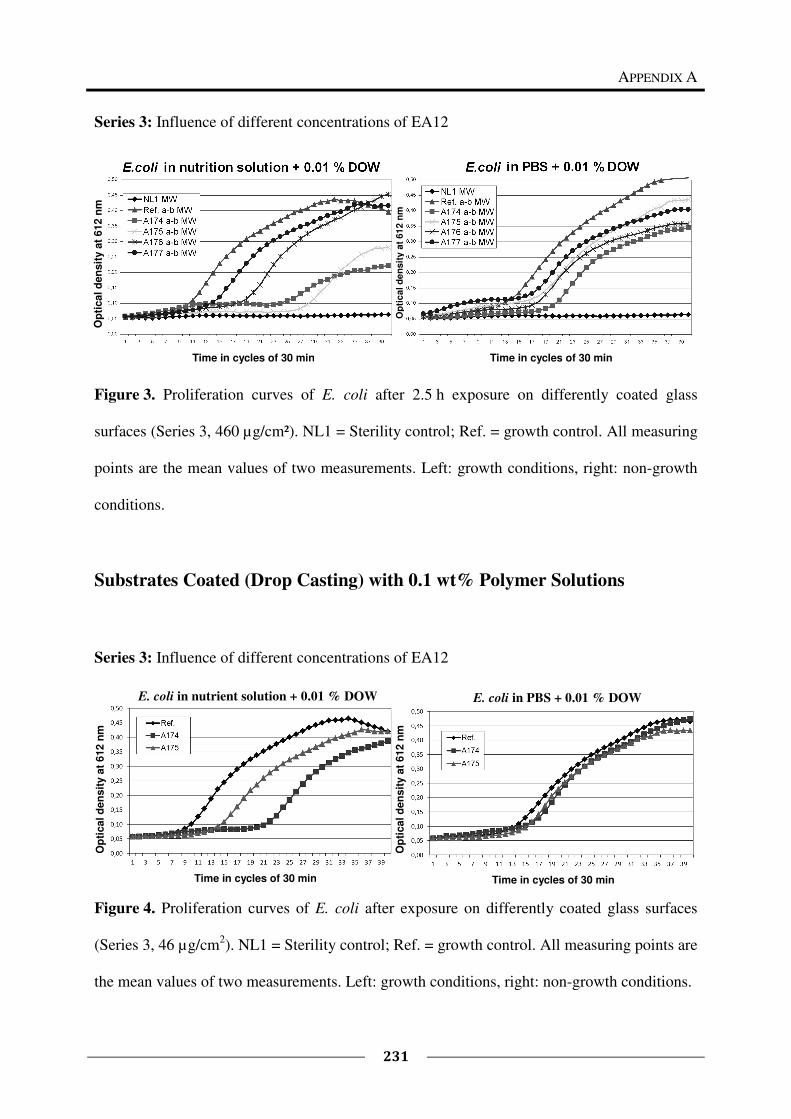
APPENDIX A
231
Series 3: Influence of different concentrations of EA12
Figure 3. Proliferation curves of E. coli after 2.5 h exposure on differently coated glass
surfaces (Series 3, 460 µg/cm²). NL1 = Sterility control; Ref. = growth control. All measuring
points are the mean values of two measurements. Left: growth conditions, right: non-growth
conditions.
Substrates Coated (Drop Casting) with 0.1 wt% Polymer Solutions
Series 3: Influence of different concentrations of EA12
Figure 4. Proliferation curves of E. coli after exposure on differently coated glass surfaces
(Series 3, 46 µg/cm2). NL1 = Sterility control; Ref. = growth control. All measuring points are
the mean values of two measurements. Left: growth conditions, right: non-growth conditions.
E. coli in nutrient solution + 0.01 % DOW E. coli in PBS + 0.01 % DOW
Op
tical d
en
sit
y a
t 612 n
m
Op
tic
al
de
nsit
y a
t 61
2 n
m
Time in cycles of 30 min Time in cycles of 30 min
Op
tical d
en
sit
y a
t 612 n
m
Op
tical d
en
sit
y a
t 612 n
m
Time in cycles of 30 min Time in cycles of 30 min
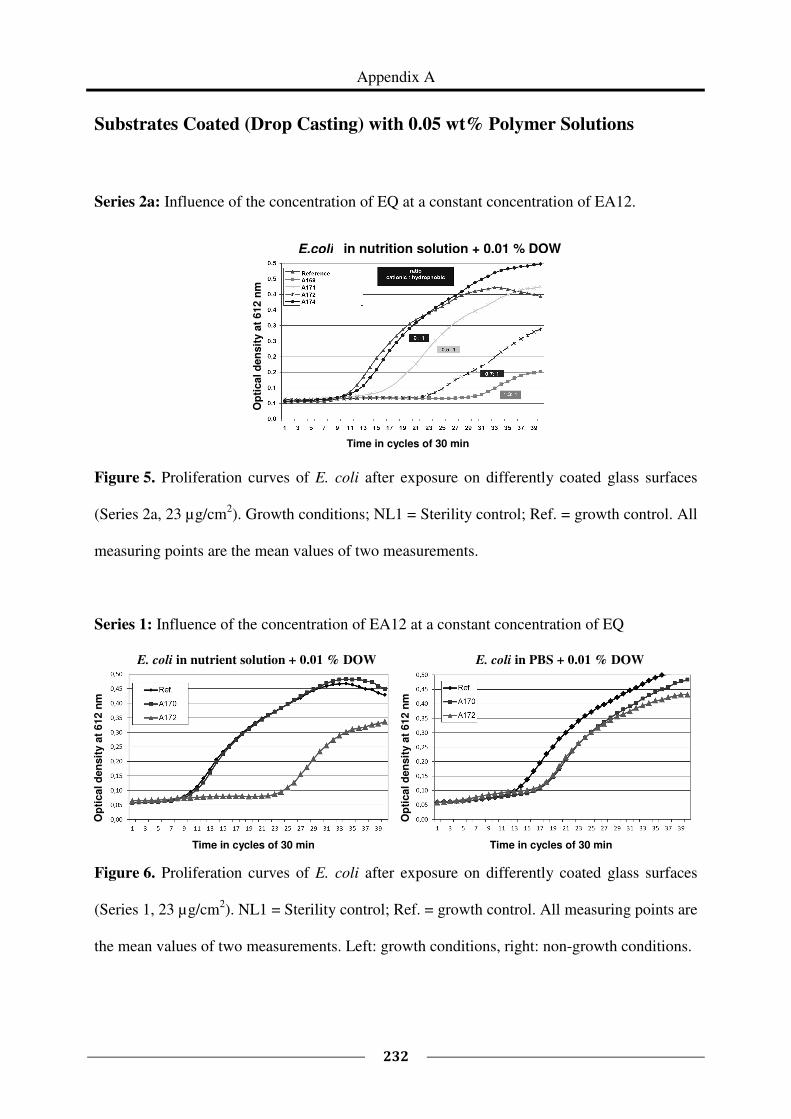
Appendix A
232
Substrates Coated (Drop Casting) with 0.05 wt% Polymer Solutions
Series 2a: Influence of the concentration of EQ at a constant concentration of EA12.
Figure 5. Proliferation curves of E. coli after exposure on differently coated glass surfaces
(Series 2a, 23 µg/cm2). Growth conditions; NL1 = Sterility control; Ref. = growth control. All
measuring points are the mean values of two measurements.
Series 1: Influence of the concentration of EA12 at a constant concentration of EQ
Figure 6. Proliferation curves of E. coli after exposure on differently coated glass surfaces
(Series 1, 23 µg/cm2). NL1 = Sterility control; Ref. = growth control. All measuring points are
the mean values of two measurements. Left: growth conditions, right: non-growth conditions.
E.coli in nutrition solution + 0.01 % DOW
E. coli in nutrient solution + 0.01 % DOW E. coli in PBS + 0.01 % DOW
Op
tical d
en
sit
y a
t 612 n
m
Time in cycles of 30 min
Op
tical d
en
sit
y a
t 612 n
m
Op
tical d
en
sit
y a
t 612 n
m
Time in cycles of 30 min Time in cycles of 30 min
233
LIST OF PUBLICATIONS
A. Plum, H. Keul, E. Heine, M. Möller, “Multifunctional Polyvinylamine: Preparation and
Antimicrobial Properties” (poster), i-PolyMat, Rolduc, Netherlands, 2010.
A. Plum, E. Heine, H. Keul, M. Möller, “Amphiphilic Polymers for Antimicrobial Coatings”
(poster), 8th Hellenic Polymer Society Symposium (H-POL8), Hersonissos, Greece, 2010.
A. Plum, E. Heine, H. Keul, M. Möller, “Antimicrobial Polyvinylamine” (poster and oral
presentation), 4. Aachen-Dresden International Textile Conference, Dresden, Germany, 2010.
A. Plum, E. Heine, H. Keul, M. Möller, “Antimicrobial Polyvinylamine”, Proceedings of the
4th
Aachen-Dresden International Textile Conference, November 25-26, 2010, Dresden, ed.
A. Doerfel, ITB/TU Dresden, Germany (ISSN 1867-6405), Poster P58.
A. Plum, E. Heine, H. Keul, M. Möller, „Preparation of Protein-like Amphipathic Polymers
with Antimicrobial Activity” (poster), European Polymer Congress, Granada, Spain, 2011.
234
CURRICULUM VITAE
Name Angela Schmalen, geb. Plum
Date of birth Mai 03, 1982
Place of birth Aachen, Germany
Citizenship German
08/1992 – 06/2001 Einhard-Gymnasium, Aachen, Germany
10/2001 – 12/2007 Studies in Chemistry (Diploma), RWTH Aachen University,
Germany
10/2003 Intermediate Diploma
08/2005 - 10/2005 Internship under the supervision of Prof. Dr. Mark Lautens:
“MAD/n-Bu4NI – Mediated Ring Expansion of Methylene-
cyclopropyl Esters”, University of Toronto, Canada
07/2007 – 12/2007 Diploma thesis under the supervision of Prof. Dr. Martin Möller:
“Amphiphilic Copolymers via Polymer-Analogous Reaction of
Poly(vinyl amine) with Functional Carbonate Couplers”, ITMC,
RWTH Aachen University, Germany
02/2008 – 08/2012 PhD work under the supervision of Prof. Dr. Martin Möller: “Post
Polymerization Modification of Poly(vinyl amine)s with Functional
Epoxides: Multifunctional, Antimicrobial, Protein-like Polymers”,
ITMC and DWI - Leibniz-Institut für Interaktive Materialien,
RWTH Aachen University, Germany
04/2008 – 09/2013 Postgraduate studies in Business Administration (Diploma),
RWTH Aachen University, Germany
05/2013 – 09/2013 Diploma thesis under the supervision of Prof. Dr. Frank T. Piller:
“The Not-Invented-Here Syndrome in Research and Development:
Examination of the Construct Validity of a Measuring Scale”, TIM,
RWTH Aachen University, Germany
Since 06/2014 Development Engineer at Neenah Gessner GmbH, Bruckmühl,
Germany


