
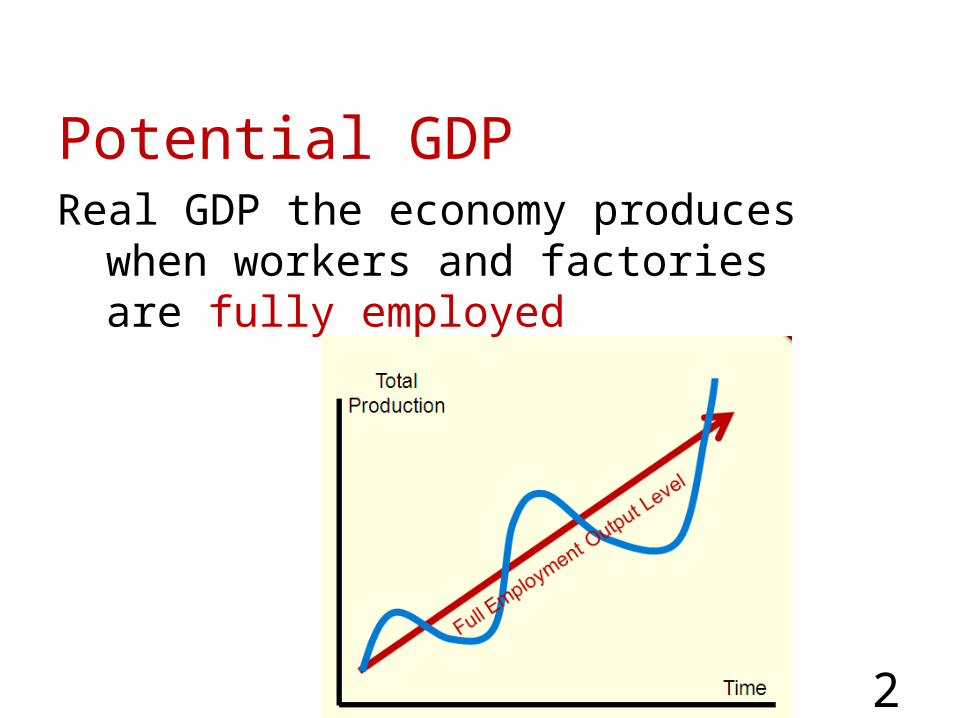
Potential GDP
Time
Total Production
Every
year w
e produce m
ore than th
e previous y
ear
Full Employment: z
ero
unemployment, no excess
capacity
Above Full employment
Below Full employment
At Full employment
Potential GDP
Potential GDP
2
Real GDP the economy produces when workers and factories are fully employed
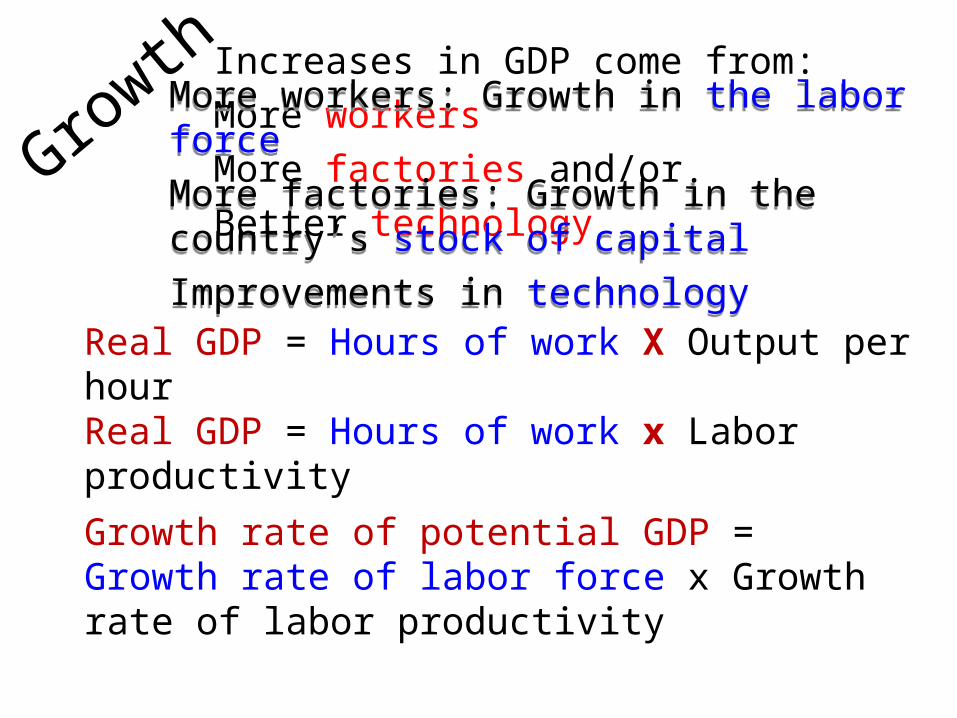
GrowthIncreases in GDP come from:
More workers
More factories and/or
Better technology
More workers: Growth in the labor force
More factories: Growth in the country’s stock of capital
Improvements in technology
More workers: Growth in the labor force
More factories: Growth in the country’s stock of capital
Improvements in technology
Real GDP = Hours of work X Output per hour Real GDP = Hours of work x Labor productivity
Growth rate of potential GDP = Growth rate of labor force x Growth rate of labor productivity
44
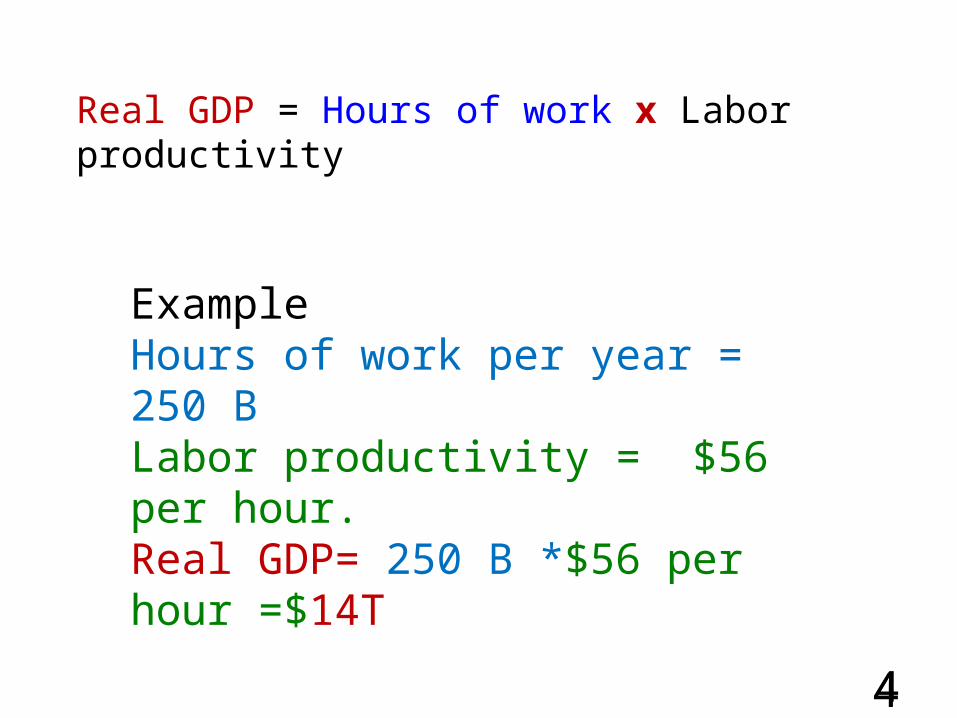
ExampleHours of work per year = 250 BLabor productivity = $56 per hour.Real GDP= 250 B *$56 per hour =$14T
Real GDP = Hours of work x Labor productivity
Unemployment
A measure of wasted resources: Wasted Labor hours and/or wasted capital
04/19/23 (c) 2002 Claudia Garcia-Szekely 5

Measuring Unemployment Since 1940. Unemployment is measured by the
Bureau of Labor Statistics (BLS) part of the Department of Labor.
Data is compiled from monthly surveys (60,000 households) Current Population Survey
Data does not come from unemployment insurance (UI) records… UI is one of many factors used.
04/19/23 (c) 2002 Claudia Garcia-Szekely 6

Employed Have a job: Full time, part time or
temporary work. Worked at least ONE hour or more
for pay or profit during the survey week.
Worked 15 hours or more without pay in a family business.
Temporarily absent from work Illness, vacation, labor dispute, etc.04/19/23 (c) 2002 Claudia Garcia-Szekely 7
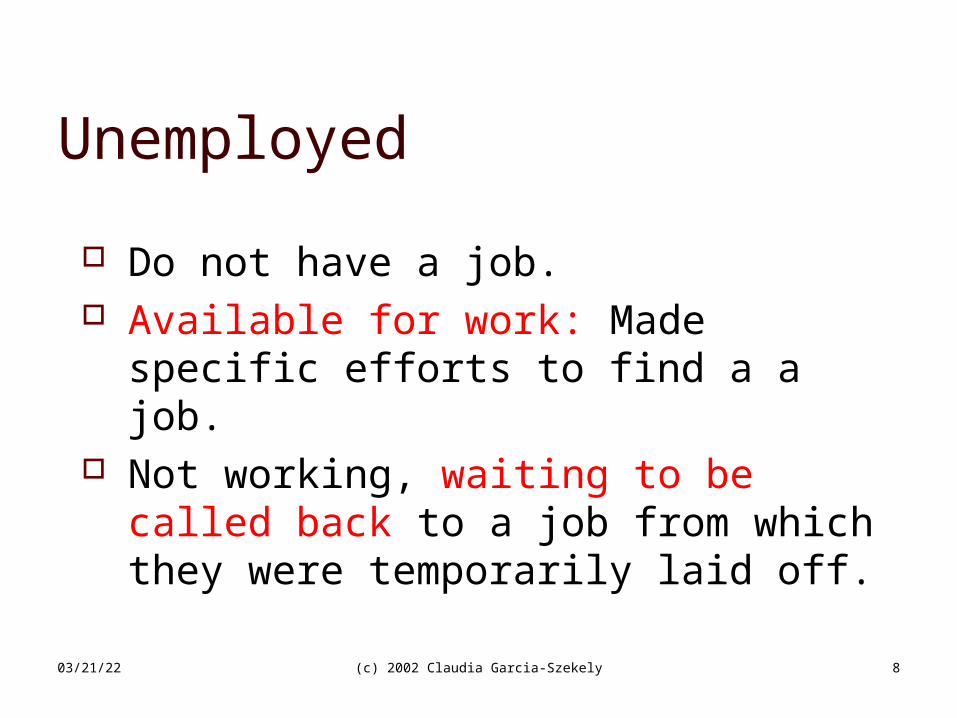
Unemployed
Do not have a job. Available for work: Made specific
efforts to find a a job. Not working, waiting to be called
back to a job from which they were temporarily laid off.
04/19/23 (c) 2002 Claudia Garcia-Szekely 8

Not in the Labor Force Those who have no job and are not
looking for a job. Retired Full time students Home makers. Volunteers
Institutional Population. Mental Institutions Prison Military
04/19/23 (c) 2002 Claudia Garcia-Szekely

04/19/23
>

04/19/23
>
LF = Employed + Unemployed
UnemploymentRate (Ur)
=Unemployed
Labor ForceX 100
=Labor Force
Active PopulationX 100
Labor ForceParticipation Rate
154M
14M9.09%
140M
14M
154M
154M
243.3M
65.7%
SEE PROGRESSIONUnemployment
04/19/23 (c) 2002 Claudia Garcia-Szekely 12

Is Unemployment Measured Correctly?
No. There are three problems with the way we measure unemployment
04/19/23 (c) 2002 Claudia Garcia-Szekely 14
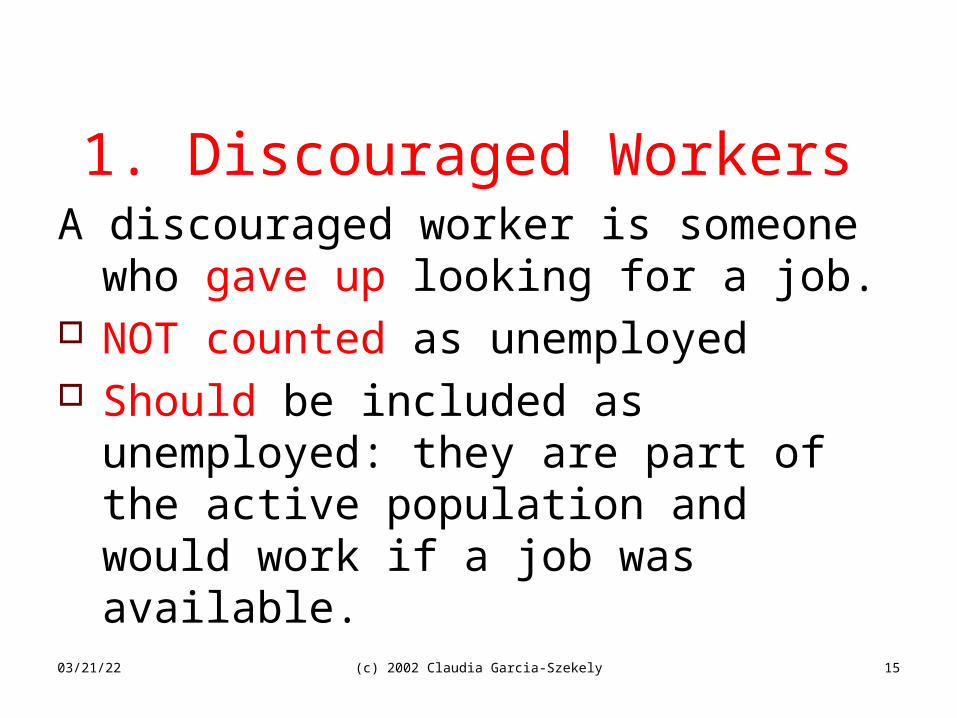
1. Discouraged WorkersA discouraged worker is someone
who gave up looking for a job. NOT counted as unemployed Should be included as
unemployed: they are part of the active population and would work if a job was available.
04/19/23 (c) 2002 Claudia Garcia-Szekely 15
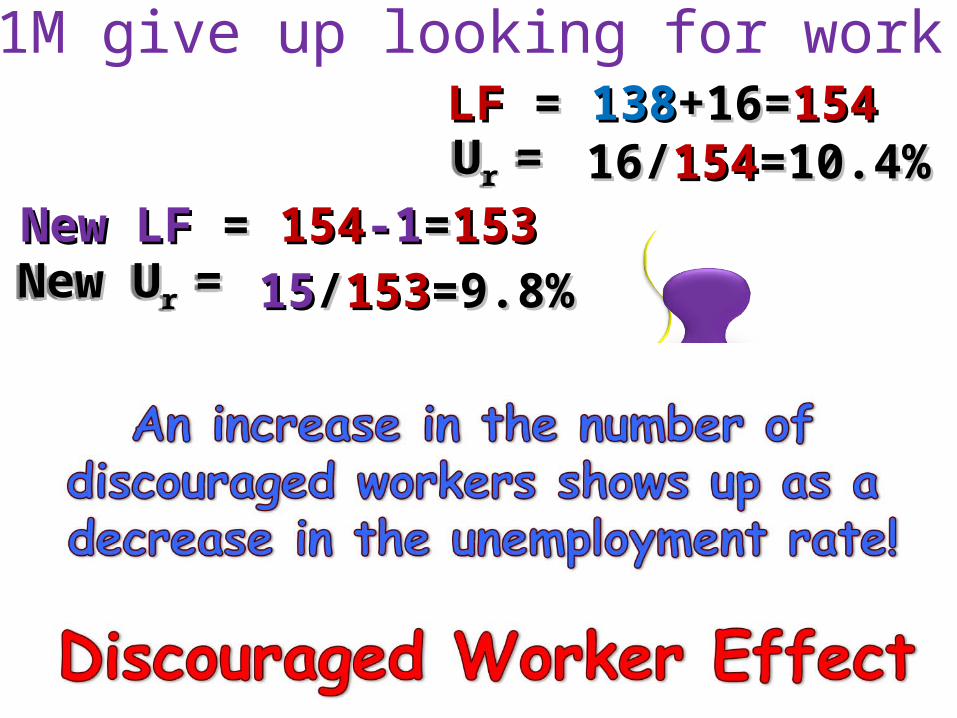
1M give up looking for work
16
138Employed
Unemployed
LFLF = = 138138+16=+16=154154UUr r ==UUr r == 16/16/154154=10.4%=10.4%
New LF New LF = = 154154-1-1==153153New UNew Ur r ==New UNew Ur r ==1515//153153=9.8%=9.8%
Unemployed16-1=15
Discouraged Worker Effect.
The longer the recession lasts, the less accurate the Ur

04/19/23 (c) 2002 Claudia Garcia-Szekely 18
Discouraged WorkersThousands

Is Unemployment Measured Correctly?
No. There are three problems with this statistic:1. The Discouraged Worker Effect
2. The treatment of part time work as full time.
04/19/23 (c) 2002 Claudia Garcia-Szekely 19
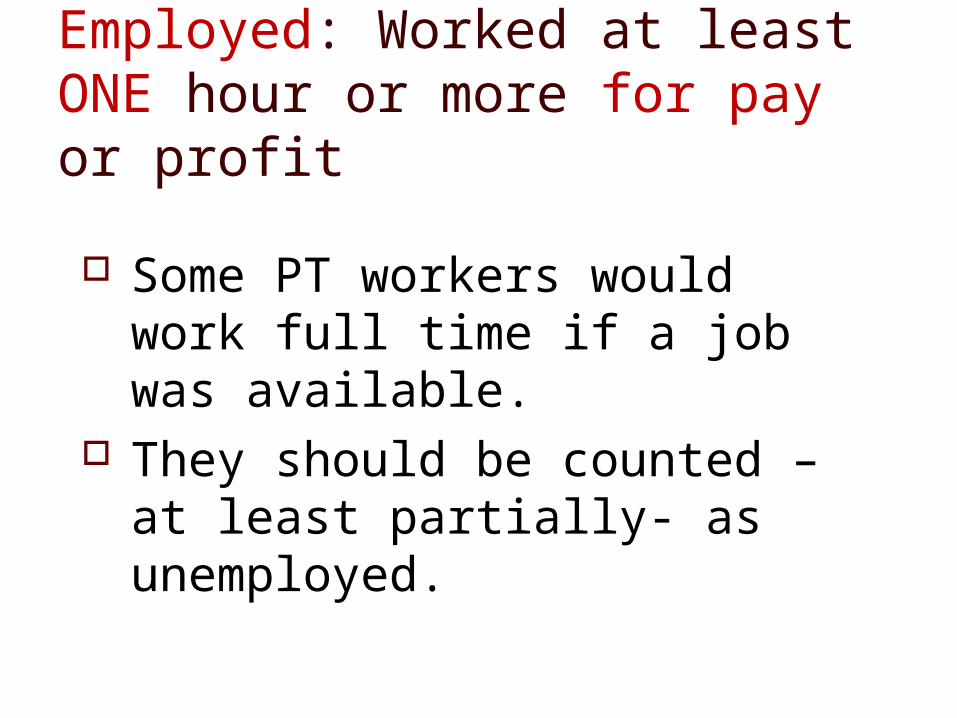
Employed: Worked at least ONE hour or more for pay or profit
Some PT workers would work full time if a job was available.
They should be counted –at least partially- as unemployed.

04/19/23 (c) 2002 Claudia Garcia-Szekely 21
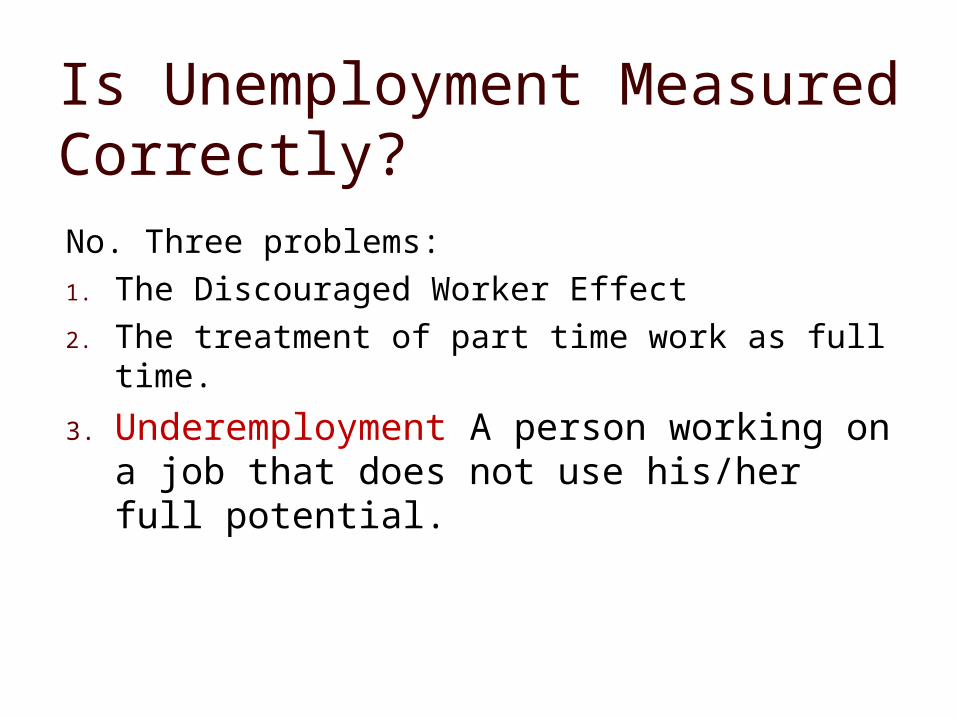
Is Unemployment Measured Correctly?No. Three problems:1. The Discouraged Worker Effect 2. The treatment of part time work as full time.
3. Underemployment A person working on a job that does not use his/her full potential.

Underemployed individuals are counted as employed even though their skills are not.
There are no official statistics on underemployment Difficult to develop objective criteria.
Employed: Worked at least ONE hour or more for pay or profit

The Unemployment Rate:Three Misrepresentations
04/19/23 (c) 2002 Claudia Garcia-Szekely 24
DiscouragedWorkers Not Unemployed
Underestimate trueUnemployment
Part TimeWorkers
Counted as employedInflate Number employedUnderestimate true Unemployment
Under-employedWorkers
Counted as employed
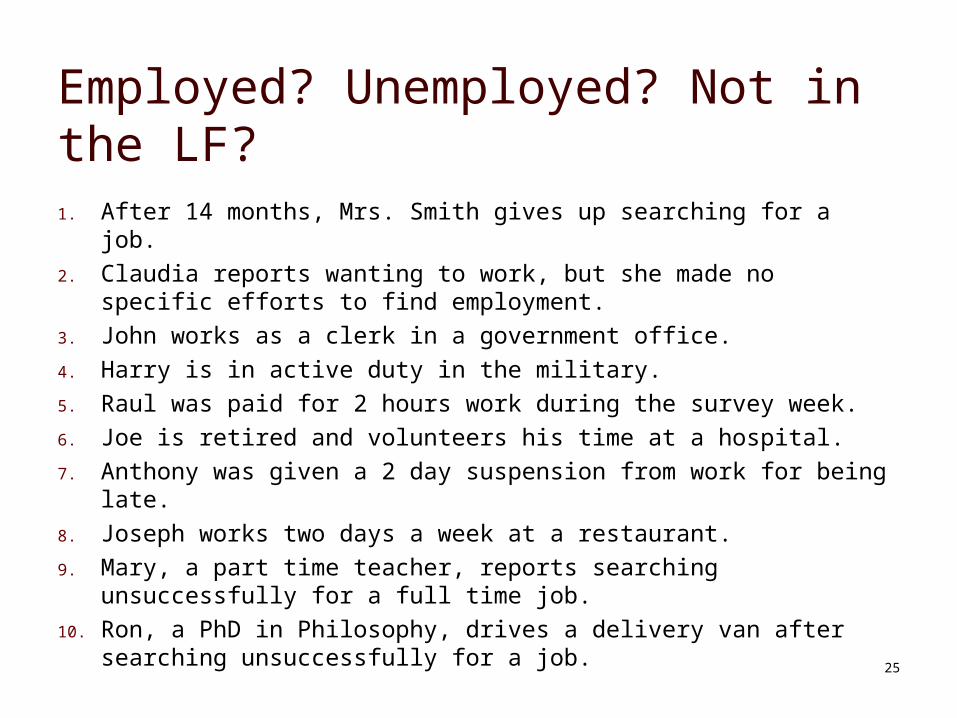
Employed? Unemployed? Not in the LF?1. After 14 months, Mrs. Smith gives up searching for a job.2. Claudia reports wanting to work, but she made no specific
efforts to find employment.3. John works as a clerk in a government office.4. Harry is in active duty in the military.5. Raul was paid for 2 hours work during the survey week.6. Joe is retired and volunteers his time at a hospital.7. Anthony was given a 2 day suspension from work for being
late.8. Joseph works two days a week at a restaurant.9. Mary, a part time teacher, reports searching unsuccessfully
for a full time job.10. Ron, a PhD in Philosophy, drives a delivery van after
searching unsuccessfully for a job. 25

5. Suppose that the active population is 230 million, the labor force participation rate is 66% and the unemployment rate is 5%. If the number of discouraged workers increases by 5 million, what does the unemployment rate become?
5. Active population is 30 million, labor force participation rate 60%, number of discouraged workers 2 million, number of people with full time jobs 13 million, number of people with part time jobs is 2 million. Calculate the unemployment rate.

Potential GDPReal GDP the economy produces when workers and factories are fully employed
27
Output produced when unemployment
is zero

Unemployment is never ZEROUnemployment is never ZERO

Three types of unemployment: Structural: workers who do not
have skills currently in demand…there is no job for them.
Frictional: workers who have the necessary skills but there is a job for them
Cyclical: workers have the necessary skills for the job, but lack of demand prevents firms from hiring them back.
04/19/23 (c) 2002 Claudia Garcia-Szekely 29

Potential GDPReal GDP the economy produces when workers and factories are fully employed
30
Output produced when cyclical unemployment is zero

Unemployed due to lack of
skills1%
Unemployed due to
recession5%
Between Jobs4%
Zero Cyclical
Frictional4%
Cyclical5%
Structural1%
Ur=10%
Recession Ends
Natural
Rate of
Unemployme
nt
5%

Unemployment increases Inequality
04/19/23 (c) 2002 Claudia Garcia-Szekely 32
Worst 2013Teens 27.0 25.1Black or African American 16.8 13.8Hispanic 13.1 9.6Men 10.4 7.1Women 8.4 7.0White 8.9 6.8
“When the economy
catches a cold minorities
and young people get
pneumonia”
Alan Blinder
“When the economy
catches a cold minorities
and young people get
pneumonia”
Alan Blinder

Unemployment Costs: Okun’s Law
1% Unemployment = 2.5% of GDP
33
GDP*0.025 = Goods and Services lost for each 1% extra
unemployment
GDP*0.025 = Goods and Services lost for each 1% extra
unemployment
14,000B *0.025 = 350B lost for each 1% extra
unemployment
14,000B *0.025 = 350B lost for each 1% extra
unemployment
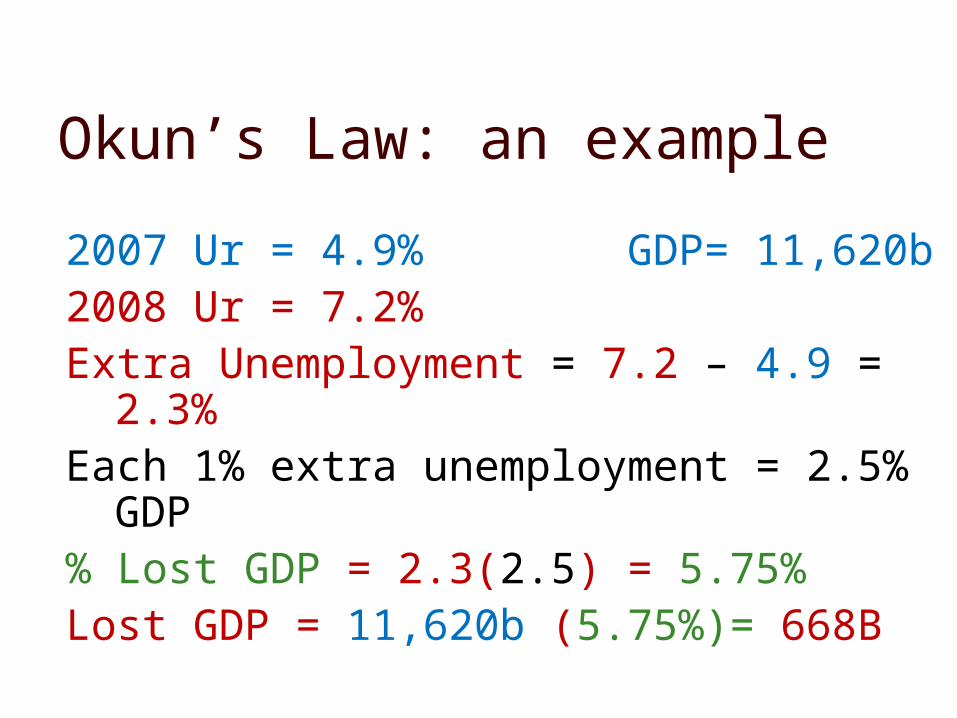
Okun’s Law: an example
2007 Ur = 4.9% GDP= 11,620b 2008 Ur = 7.2%Extra Unemployment = 7.2 – 4.9 = 2.3%Each 1% extra unemployment = 2.5%
GDP% Lost GDP = 2.3(2.5) = 5.75% Lost GDP = 11,620b (5.75%)= 668B

Cyclical? Structural? Frictional?1. Richard loses his job at UPS due to a downturn in general
business conditions.2. Mark loses his job as a parking attendant. His job was replaced by
a new automated system.3. Sarah quits her job as a hostess to look for work that is more fun.4. Andrew quits looking for work because he does not think he can
find a suitable job.5. Nancy lost her job as a real estate agent during the housing
crisis.6. Mathew just graduated from college and does not have a job yet.7. Pedro lost his job as software developer for a weapons
manufacturer. He is looking for a new job.8. John lost his job as a public phone repairman because his skills
are no longer needed.
35
True or False?
04/19/23 (c) 2002 Claudia Garcia-Szekely 36
1. Frictional unemployment is a "necessary" cost of a dynamic economy.
2. Someone unemployed for a long period of time due to technological change would be described as structurally unemployed.
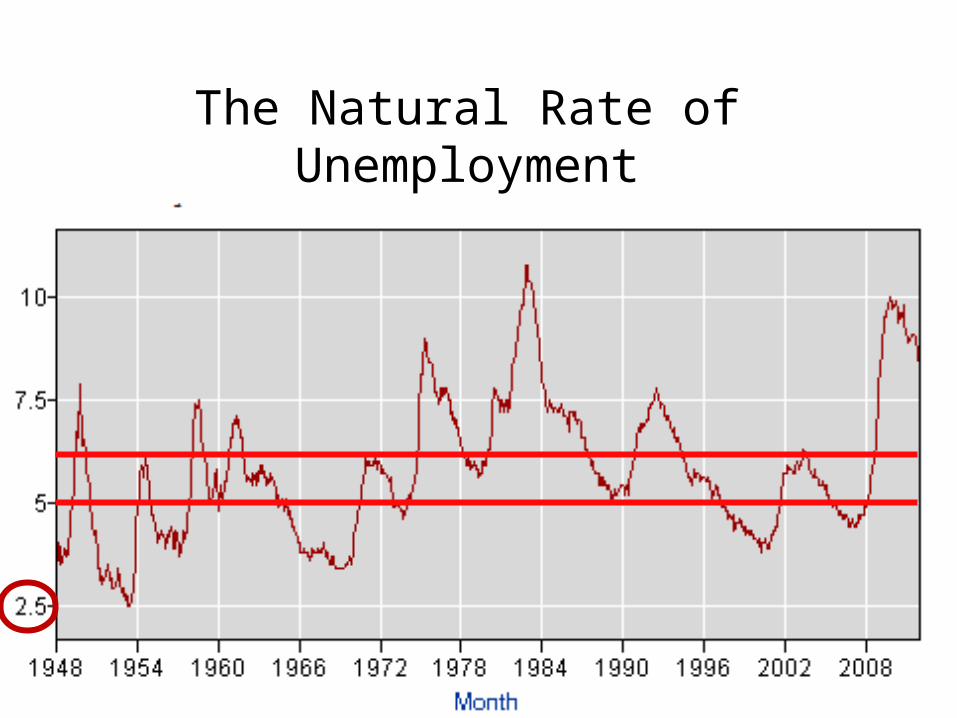
The Natural Rate of Unemployment

04/19/23 (c) 2002 Claudia Garcia-Szekely 38
Less than HS
HS graduates
Some College
Bachelor Degree and higher
11.2%
7.9%
6.7%
3.8%
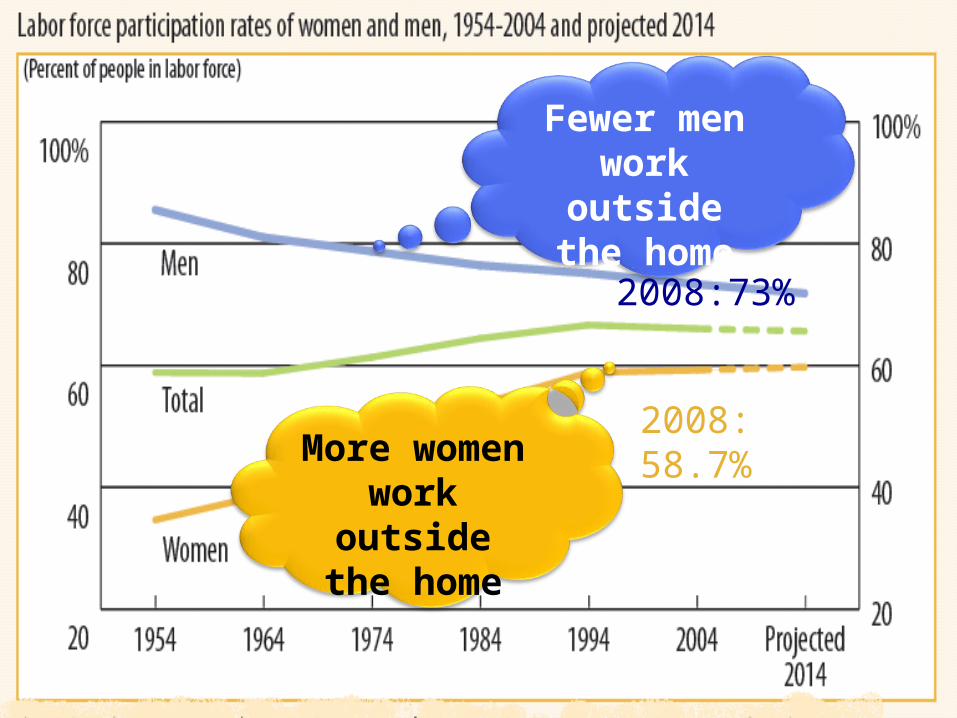
04/19/23 (c) 2002 Claudia Garcia-Szekely 39
More women work
outside the home
Fewer men work
outside the home
2008:73%
2008: 58.7%
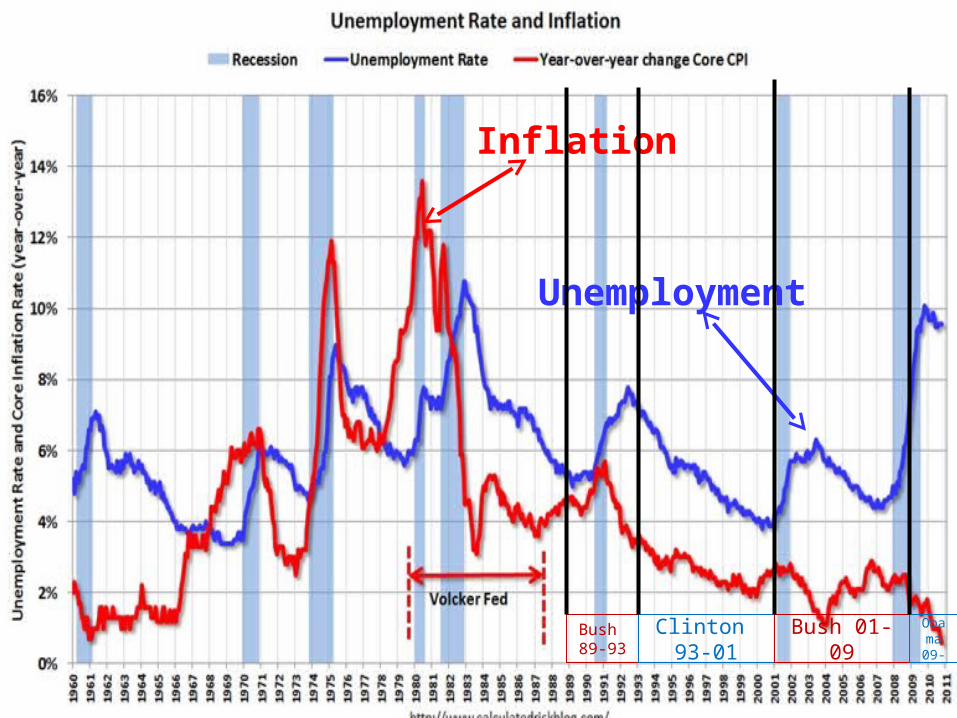
Unemployment
Inflation
Bush 89-93
Clinton 93-01
Bush 01-09
Obama 09-


