
1
Predicted Influence of Plasma Activation on Non-Oxidative Coupling of
Methane on Transition Metal Catalysts
Yannick Engelmann*a, Prateek Mehtab, Erik C. Neytsa, William F. Schneiderb, Annemie
Bogaertsa
*a Corresponding Author, e-mail address: [email protected]
Department of Chemistry, Research Group PLASMANT, PLASMA and NANOLab Centers of Excellence,
Universiteit Antwerpen, Universiteitsplein 1, 2610 Wilrijk-Antwerp, Belgium
a Department of Chemistry, Research Group PLASMANT, PLASMA and NANOLab Centers of Excellence,
Universiteit Antwerpen, Universiteitsplein 1, 2610 Wilrijk-Antwerp, Belgium
b Department of Chemical and Biomolecular Engineering, University of Notre Dame,
Notre Dame, IN, 46556, USA
Keywords:
Plasma catalysis, Microkinetic modelling, Vibrational excitation, Radicals, Catalyst Design
Abstract
The combination of catalysis and non-thermal plasma holds promise for enabling difficult
chemical conversions. The possible synergy between both depends strongly on the nature of
the reactive plasma species and the catalyst material. In this paper, we show how vibrationally
excited species and plasma-generated radicals interact with transition metal catalysts and how
changing the catalyst material can improve the conversion rates and product selectivity. We
developed a microkinetic model to investigate the impact of vibrational excitations and plasma-
generated radicals on the non-oxidative coupling of methane over transition metal surfaces.
We predict a significant increase in ethylene formation for vibrationally excited methane.
Plasma-generated radicals have a stronger impact on the turnover frequencies, with high
selectivity towards ethylene on noble catalysts and mixed selectivity on non-noble catalysts. In
general, we show how the optimal catalyst material depends on the desired products, as well
as the plasma conditions.

2
Introduction
The price of methane is decreasing through technological improvement and recently
discovered natural gas sources1,2. Methane is often produced at remote sites, from where
transportation is difficult. It is therefore desirable to reform methane to more readily
transportable and valuable products,2–5 such as olefins,5,6 which are today primarily produced
by steam cracking of higher hydrocarbons at elevated temperatures (~900°C).
The current routes of methane to olefins include1,3 (1) reforming to synthesis gas
(syngas) and subsequently syngas to methanol and methanol to olefin (MTO), (2) reforming to
syngas and syngas to olefin via Fisher-Tropsch synthesis (FTO), (3) oxidative coupling of
methane (OCM), and (4) non-oxidative coupling of methane (NOCM). MTO and FTO are
indirect and infrastructure-intense processes, and OCM consumes an oxidant and wastes some
methane hydrogen as water. NOCM is a particularly appealing option, as it potentially yields
desired products in one step and avoids the need for an oxidant. Efficient NOCM to olefins is
difficult to achieve thermally because equilibrium conversions become appreciable only above
about 750°C and coking readily occurs at this and higher temperatures. Between 750°C and
1200°C, benzene is an important equilibrium product,7 and dehydroaromatization over Mo-
based catalysts is possible8,9.
NOCM is highly endothermic and energy intensive when driven thermally, and thus
alternative approaches to activating and converting methane to useful products are in great
need. Plasma activation provides one such potential avenue10. Methane is activated in both
thermal and non-thermal plasmas through electron impact processes that could provide
alternative routes to couple methane non-oxidatively3. At temperatures above 3000°C,
acetylene becomes the thermodynamically preferred product of methane decomposition.11 The
Hüels process plays on this thermodynamics by using a thermal plasma to generate the high
temperatures necessary to drive equilibrium towards acetylene and hydrogen. Energy
efficiencies and CH4 conversions can reach 40% and 70%, respectively3. To avoid
recombination of the products, the gases must be rapidly quenched before separation, and the
process requires a regeneration step to remove carbon lay-down from the electrodes.
Non-thermal plasmas (NTPs) operate at much lower bulk temperature and NTP-
processing of methane has the potential benefit that thermodynamically unfavorable reactions
become possible at lower temperatures due to the non-equilibrium nature of the system12–15.
Scapinello, et al.3, compared the best energy efficiencies, CH4 conversions and product

3
selectivities reported in literature, between different plasma sources for NOCM, including
dielectric barrier discharges (DBDs), gliding arc plasmas, corona discharges and microwave
plasmas. DBDs are of particular interest because of their scalability from laboratory to
industrial reactors and their operation at ambient pressures and temperatures16. NOCM in
DBDs however suffers in terms of energy efficiency and CH4 conversion, reaching values of
around 3% and 10%, respectively3. Nozaki, et al., predicted from a numerical model17 that in
a DBD, 36% of the input electrical energy is lost to vibrational excitations and subsequent
vibrational-translational relaxation. Vibrational excitation of methane leading to gas phase
dissociation is slow due to the high energy barrier, while relaxation through gas phase
collisions happens significantly faster18. Several other works have studied NOCM in DBDs
with kinetic models.14,19,20 Each of these works studied the importance of both electron impact
vibrational excitation as well as electron impact dissociation. Vibrational excitations of
methane are found to be relatively unreactive in DBD plasma, and the most important loss
terms for methane are direct electron impact dissociations. These works confirm the general
trend in plasma-assisted NOCM, that for low specific energy input (SEI), the main products
are ethane and propane, while at higher SEI, the ethane is converted to acetylene. At low SEI,
CH3 radicals are generated through electron impact dissociations of methane, which recombine
mostly to ethane. In higher SEI plasmas, ethane is mostly converted to acetylene, because
intermediate ethylene is readily dehydrogenated14. Yang, et al.14, concluded that it is
particularly difficult to produce ethylene. They suggested that to improve ethylene selectivity,
the electron energy should be carefully controlled to avoid ethane and acetylene formation, and
specific neutral-neutral recombination reactions should be enhanced.
A potential approach to improving the performance of plasma-activated methane
conversions is through coupling with a heterogeneous catalyst10,13,21,22. Plasma-assisted
catalysis has been demonstrated for hydrocarbon reforming23, waste gas treatment24, CO2
conversion22,25, NH3 synthesis25,26, and methane conversions22,25. Mehta, et al., reviewed the
impact of plasma activation on catalytic methane dry reforming25. They highlighted the
potential of plasma catalysis to allow chemical conversion to happen at lower temperatures
where thermally no conversion is expected. At higher temperatures, plasma-activated species
undergo thermal relaxation and the potential impact of the plasma on the conversion is
cancelled. This trend was shown by Nozaki, et al.17 and Kim, et al.27,28 in their studies on
methane steam reforming and dry reforming, respectively. Nozaki, et al. examined the
influence of a DBD on the methane steam reforming performance over a Ni/SiO2 catalyst.17

4
They observed the methane conversion curve to shift about 200°C to lower temperature in the
presence of plasma, as well as a positive correlation between plasma discharge power and
methane conversion. Kim, et al.27,28 observed methane dry reforming yields over a Ni/Al2O3
catalyst to exceed that of bulk thermal equilibrium at temperatures of 400 to 600 K. They
attributed the enhancements to methane vibrational excitations and their effect on the
dissociation rate at the catalyst surface.
Only a limited number of studies has been reported for plasma-catalytic NOCM in
gliding discharges and in DBDs29–32. To study the effect of catalyst material on the plasma, Jo,
et al.29, examined the effect of electric conductivity of the catalyst on methane activation in a
DBD. Their models show a lowering of the electric field upon introduction of an alumina-
supported Pt catalyst compared to the electric field in the presence of bare alumina. The
introduction of a conductive metal in the discharge zone results in higher CH3 and lower CH
densities. Consequently, they show higher selectivity to ethane and lower selectivity towards
acetylene compared to the results on bare alumina. Schmidt-Szalowski30, et al., and Mlotek, et
al.31, studied the effects of transition metals in a combination of a gliding arc discharge and a
mobile catalyst bed. They concluded that this setup is an effective way to perform NOCM to
C2-hydrocarbons. Schmidt-Szalowski attributed the changes in selectivity to electrical
properties of the catalyst material and their effect on the discharge. Mlotek postulated that the
change in selectivity in favor of ethane and ethylene was due to two possible reaction pathways:
(i) plasma generation of CH3 and CH2 radicals that can couple readily to ethane and ethylene
and (ii) hydrogenation of produced acetylene to ethane and ethylene in the presence of the
catalyst. Spiess, et al.32, studied the impact of the electrode material in discharge plasmas on
the methane conversion. Based on mass spectrometry and GC/MS data, they suggested plasma-
catalytic reaction pathways for the different products. Their suggested pathways start from
plasma-activated methane dissociating on the catalyst surface, initiating the radical reactions
through creation of CH3* and H*. Subsequent recombination and termination reactions also
happen on the catalyst surface. The highest methane decomposition rates were observed on
noble catalysts. Scapinello, et al.,33 examined the impact of a copper rod along the centerline
of a pulsed discharge reactor on the acetylene hydrogenation. They observed significantly
higher ethylene conversion around 200- 400°C compared to conversion in the presence of a
stainless steel rod or for homogeneous reactions.
All of these works show that it is important to pick the right catalyst material for the
right plasma. However, detailed insight in which reaction mechanisms are at play, how reaction

5
mechanisms are impacted by the different metals and how optimal catalyst materials can be
chosen, is still lacking. An impediment to answering these questions is the lack of models to
relate catalyst composition to performance. In a recent study, Mehta, et al.34 reported a
microkinetic model for ammonia synthesis that attempted to capture the potential influence of
plasma excitation of N2 vibrations on surface-site-normalized reaction rates. Starting from a
conventional, thermal-only microkinetic model for the rate of ammonia synthesis versus a
catalyst characteristic, in this case the binding energy of atomic nitrogen (N*), they augmented
this thermal model with estimates for the extent of non-thermal N2 vibrational excitation, based
on laboratory observation of the apparent N2 vibrational temperature, and an estimate of the
consequences of vibrational excitation on the N2 dissociative sticking coefficient. Ensemble
averaging over vibrational states yielded a predicted plasma-enhanced ammonia synthesis rate.
Model results were consistent with the observed ability of the plasma-catalyst combination to
produce ammonia at conditions that are thermally inaccessible, and they predicted that the
optimal catalytic material (the “peak” in the volcano) is shifted to lesser absolute N* binding
energy. Experimental observations were consistent with this predicted shift. A follow-up
work35 showed the potential to surpass the thermodynamic conversion limit when coupling the
plasma with the right catalyst. The presence of a non-thermally activated reaction channel can
kinetically trap the produced ammonia at higher than thermal equilibrium limits. For catalysts
with lower N* binding energy, the beyond equilibrium effect was observed at lower levels of
N2 excitation.
Methane is similarly known to become vibrationally activated in plasmas. Further,
vibrational excitations are well known to influence the rate of methane dissociation on
transition metal catalysts36. However, to the best of our knowledge, no research has been done
on how these vibrational excitations impact NOCM in the context of plasma-activated
catalysis. Additionally, while the above-mentioned works on plasma-catalytic NOCM
highlight the importance of radical densities in the plasma phase, none of these works provide
direct mechanistic and kinetic insight into the surface catalytic chemistry. For these reasons,
we develop, in this work, microkinetic models for NOCM on transition metal surfaces,
incorporating (i) the influence of vibrational excitations and (ii) the influence of plasma-
generated radicals on methane dissociation rates. We use DFT results available in the Catapp
database37 to parameterize surface reactions rates. We take advantage of observed correlations
between reaction and activation energies to relate results to a single descriptor of surface
reactivity38,39. We incorporate the influence of methane vibrational excitations and plasma-

6
generated radicals on the reaction mechanisms and rates. We solve the model at 500 K and 1
bar, to simulate the reaction conditions in a DBD packed with a transition metal catalyst. It is
our aim to compare the impact of vibrational excitations and of plasma-generated radicals in
plasma-catalytic NOCM with thermal catalytic NOCM. Plasma and catalyst are otherwise
decoupled in order to focus on the chemistry of the aforementioned plasma species. This way,
we provide essential information for understanding the specific concepts in plasma-catalytic
NOCM and plasma catalysis in general. Our results encompass a comparison of methane
conversion rates, product selectivity, catalyst coverage and reaction mechanisms.
Microkinetic Model Construction and Solution
We developed a mean-field microkinetic model34,40 to simulate thermal NOCM, as well as
NOCM with vibrationally excited methane and NOCM with plasma-generated radicals. We
constructed a set of rate equations to compute the reaction kinetics on transition metal catalysts
in contact with methane. These rate equations are differential equations for the time derivative
of the surface coverages: !"#!$= ∑ 𝑐() . 𝑟)) (1)
where qi is the surface coverage of adsorbate i (defined as the total number of adsorbed species
divided by the total number of adsorption sites), cij is the stoichiometric coefficient for the
adsorbate in surface reaction j, and rj is the rate (in coverage.s-1) corresponding to this reaction,
which is defined as:
𝑟) = 𝑘),/ ∏ 𝑎2345,6
2 − 𝑘),8 ∏ 𝑎2345,9
2 (2)
With kj,f and kj,r the forward and reverse reaction rate coefficients, as the activity of species s
(equal to the coverage in case of adsorbates and to the pressure in bar in case of gas phase
species) and csj,f and csj,r the stoichiometric coefficients of the reactants of the forward and the
reverse reactions, respectively. The reaction rate coefficients kj,f and kj,r are calculated with
harmonic transition state theory, using the Eyring-Polanyi equation:
𝑘:;: = <=:>𝑒∆A‡
C 𝑒DEF‡
CG (3)
Here, kB is the Boltzmann constant, h is Planck’s constant and DS‡ and DH‡ are the entropy and
enthalpy barriers to the transition state, respectively.

7
To incorporate the influence of plasma-induced vibrational excitations on CH4
dissociation rates, we assign a vibrational temperature ranging from 500 to 3000 K, distinct
from the bulk temperature, and assume the vibrational states follow a Boltzmann distribution41.
Activation barriers, ΔH‡, are decreased proportional to the excitation energy (Eν) formulated
by the following equations:
(4)
where ‘α’ is a function of the forward activation barrier, Eaf, and the backward activation
barrier, Eab, as defined by the Fridman-Macheret equation42:
𝛼 = IJ6
IJ6KIJL
(5)
We chose to neglect the impact of the ν2,4 bending modes of methane, because no alpha
parameter is known for the excitation of these modes. On the one hand, the efficacy of these
modes is generally lower than the efficacy of the stretch modes36, but the spacing between the
energy levels is also much lower, resulting in higher populations of the higher energy levels.
Juurlink, et al.36, reported high energy efficacies towards methane dissociation for the
vibrational excitation of the ν1 symmetric stretch and the ν3 asymmetric stretches. They noted
that excitation of the ν2,4 bending modes can aid in a better access of the transition state but
that their efficacies are typically lower. In any case, the aim of our work is to study the impact
of vibrational excitations in a qualitative way. Depending on the exact vibrational distribution
function and on how the efficacies change over the different levels of excitation and catalyst
materials, the maximum turnover rates might be shifted to higher/lower temperatures or to
higher/lower binding energies, but the general trends remain unchanged. In the Supporting
Information (Figures S1 and S2), we compare the effect of the bending modes, assuming an
alpha parameter equal to 0.1 and 0.5.

8
We solved the ordinary differential rate equations on the most noble catalyst (Eb = 1
eV) until the surface coverage reached a steady state (¶qi/¶t = 0 for all species i). In subsequent
steps, Eb is decreased in increments of -0.01 eV until Eb = -1 eV. During each iteration, new
reaction barriers and the corresponding reaction rate coefficients are calculated, and the steady
state of the previous step is used as a guess to solve for an algebraic solution. This solution is
inserted back into the rate equations to obtain steady state turnover frequencies (TOFs).
Results and Discussion
1. Reactions and Reaction Parameters
We seek to build the simplest possible microkinetic model for C-C coupling starting from
methane at a transition metal surface. We choose transition metals both because plasma-
promoted NOCM is observed over transition metal catalysts31 and because parameters for
microkinetic models are available from literature tabulations. We assume CH4 as reactant, C2-
hydrocarbon species as products, and adsorption/desorption, (de)hydrogenation and carbon
coupling reactions as summarized in Table 1. Jo, et al.,29 reported that C2-hydrocarbons were
produced with ~70% selectivity, depending on the discharge power, in DBDs packed with
alumina-supported Pt. The given chemistry set is a subset of a large amount of species and
reactions occurring in plasma-catalytic NOCM, but it allows studying the specific role of
plasma-generated species including vibrationally excited CH4 and plasma-generated radicals.
We referred to the CatApp database37 of DFT-computed reaction and activation energies to
parameterize microkinetic models. We built scaling relations for the reactions in Table 1, based
on reaction and activation energies computed using the RPBE functional on the (211) steps of
Ru, Rh, Pt, Cu, Au and Ag. In the Supporting Information, Figures S3, S4 and S5 and S6, S7
and S8, we plotted the reaction and activation energies against the binding energy of CH3 (Eb)
for all the reactions in Table 1 for the (211) steps and the (111) terraces, respectively.
Consistent with literature, we find approximately linear correlations between all steps. The
linear fit parameters, g and x, for the forward reaction energy, Ef, and the activation barrier, Ea,
are listed in Table 1, for each reaction along with the mean absolute error (MAE), following
the equations:
𝐸/ = 𝛾/. 𝐸O +𝜉/ (6)
𝐸R = 𝛾R. 𝐸O +𝜉R (7)

9
𝑀𝐴𝐸 = ∑ |V#WX#|Y#Z
(8)
With xi the literature value of the energy on transition metal ‘i’ and yi the energy
obtained when inserting Eb of metal ‘i’ in the linear fit. In the table, the asterisk (*) symbolizes
an adsorption site on the catalyst and A* is an adsorbate attached to one of these sites. The
MAE is for all reactions similar to MAEs reported in previous work on scaling relations39.
Only the coupling reaction of 2 CH2* to C2H4* has a higher MAE. Because binding energies
on a given metal are taken to be linearly correlated, the underlying scaling relations are
insensitive to the choice of binding energy. While for the thermal case, CH* is the more
important species, it is not for the other cases. CH3* was chosen as it is the product of the first
dehydrogenation of methane.
Table 1: Surface Reaction Steps and Associated Microkinetic Parameters on the (211) steps
Adsorption/desorption gf xf MAE ga xa MAE
H(g) + * ⇌ H* 0.73 -2.49 0.10 0.00 0.00 0.00 H2(g) + 2* ⇌ 2H* 1.46 -0.45 0.20 0.86 0.49 0.15 C(g) + * ⇌ C* 3.05 -5.03 0.27 0.00 0.00 0.00 CH(g) + * ⇌ CH* 2.59 -4.66 0.18 0.00 0.00 0.00 CH2(g) + * ⇌ CH2* 1.82 -3.15 0.19 0.00 0.00 0.00 CH3(g) + * ⇌ CH3* 1.00 -1.52 0.00 0.00 0.00 0.00 CH4(g) + 2* ⇌ CH3* + H* 1.73 0.55 0.10 1.41 1.29 0.13 C2H(g) + * ⇌ C2H* 2.98 -2.75 0.24 0.00 0.00 0.00 C2H2(g) + * ⇌ C2H2* 2.52 -0.10 0.20 1.08 0.46 0.25 C2H3(g) + * ⇌ C2H3* 0.93 -1.46 0.22 0.00 0.00 0.00 C2H4(g) + * ⇌ C2H4* 0.80 0.04 0.17 0.34 0.17 0.06 C2H5(g) + * ⇌ C2H5* 1.30 -1.35 0.12 0.00 0.00 0.00 (De)hydrogenation
C* + H* ⇌ CH* + * -1.19 -0.67 0.20 -0.35 0.99 0.16 CH* + H* ⇌ CH2* + * -1.50 -0.39 0.20 -0.40 0.97 0.29 CH2* + H* ⇌ CH3* + * -1.55 -0.69 0.27 -0.15 0.47 0.08 C2H* + H* ⇌ C2H2* + * -1.19 -0.67 0.20 -0.35 0.99 0.16 C2H2* + H* ⇌ C2H3* + * -2.32 -0.39 0.29 -0.40 0.97 0.29 C2H3* + H* ⇌ C2H4* + * -0.86 -0.84 0.11 -0.15 0.47 0.08 C2H4* + H* ⇌ C2H5* + * -0.24 -0.46 0.12 -0.02 0.74 0.09 C2H5* + H* ⇌ C2H6(g) + 2* -2.03 -0.55 0.05 -0.29 0.67 0.02 Carbon coupling

10
2 CH* ⇌ C2H2* + * -2.66 -0.78 0.32 -0.98 1.28 0.25 2 CH2* ⇌ C2H4* + * -2.83 -1.24 0.52 -0.94 0.65 0.31 2 CH3* ⇌ C2H6(g) + 2* -2.00 -0.87 0.00 -0.44 2.08 0.18
Throughout the paper, plasma-catalyst interactions other than the chemical behavior of specific
plasma species on the catalyst surface are beyond the scope of this work. In reality, introducing
different transition metals in the plasma zone will impact the plasma characteristics, while at
the same time, the plasma will change catalyst surface characteristics, as explained in the
introduction and the references therein.
The entropy of the gas phase species is calculated with the formula:
𝑆(𝑇) = 𝑆°abcd − 𝑆$8RZ2(298𝐾) +𝑆$8RZ2(𝑇) (9)
Where the standard gas phase entropy, S°298K, can be found in the database of the National
Institute of Standards and Technology (https://webbook.nist.gov/chemistry/), and Strans(T) is
the translational part of the entropy at temperature T: 43
𝑆$8RZ2(𝑇) = 𝑅ln l<=:m
(ano<=:)>p
q/a𝑒s/at (10)
The rotational, vibrational and electronic parts are assumed to stay constant in the temperature
range. We note that the entropies of the stable molecules (i.e. H2, CH4, C2H6, C2H4 and C2H2)
are known, but not of all the radicals in the model (at a given temperature). For the sake of
internal consistency, all the entropies were calculated with the formula above. To check the
validity of this approach, we compared the calculated entropies for these stable molecules with
the experimental values from literature, and we found a MAE at 500 K of 14 J mol-1K-1 (Table
S2 in the Supporting Information), which corresponds to a maximum error on the free energy
barriers of 0.07 eV. We assumed that the entropy of the transition state is the entropy of a 2D
gas for the case of radical adsorption/desorption (X(g) + * ⇌ X*) and equal to the surface
entropy in the case of all other reactions43. Entropies of the surface species are varied linearly
from a 0D gas for the strongly binding catalysts up till the entropy of a 2D gas for the weakly
binding catalysts. Indeed, when the species are more strongly bound, they have more difficulty
overcoming diffusion barriers, while less strongly bound species can move around more freely
on the surface, behaving like a 2D gas43. The entropy of a 2D gas is equal to 2/3 of the entropy

11
of a 3D gas, Strans(T). The linear scaling correlates the surface entropy to our independent
descriptor, the binding energy of CH3, so that all rate coefficients can still be calculated as
function of a single parameter.
We solved for steady state reaction rates at 1 bar CH4, 500 K, and zero conversion, as
described in the Microkinetic Model Construction and Solution. The reported rates can be
interpreted as the rates at the front of a PFR or in a CSTR where the residence time is
vanishingly small or the volume is much greater than the amount of catalyst. Because we
assume zero conversion, the system is necessarily away from equilibrium and the rates
correspond to the initial forward rates towards said equilibrium. We find that rates on the
stepped surfaces are several orders of magnitude greater than on the terraces, but otherwise
follow similar trends. We report the stepped surface results here in the main article and include
the results on the metal terraces in the Supporting Information (Figures S9, S10 and S11).
2. Thermal non-oxidative coupling
The left side plots in Figure 1 show the computed steady state TOFs (top) and steady
state coverages (bottom) for thermal catalytic NOCM at 500 K with a gas phase composition
equal to 1 bar of methane at 0% conversion. The TOF is defined as:
𝑇𝑂𝐹(𝑠Wx) = ZyoOz8{/m8{|y3z|o{}z3y}z2ZyoOz8{/2($z2.2z3{Z|
(11)
The results are shown as a function of the binding energy of CH3 (ranging from strongly
binding catalysts on the left to weakly binding catalysts on the right). Species that are produced
are displayed with a full line, while consumed species (in this case methane) are displayed in
a dotted line.
12
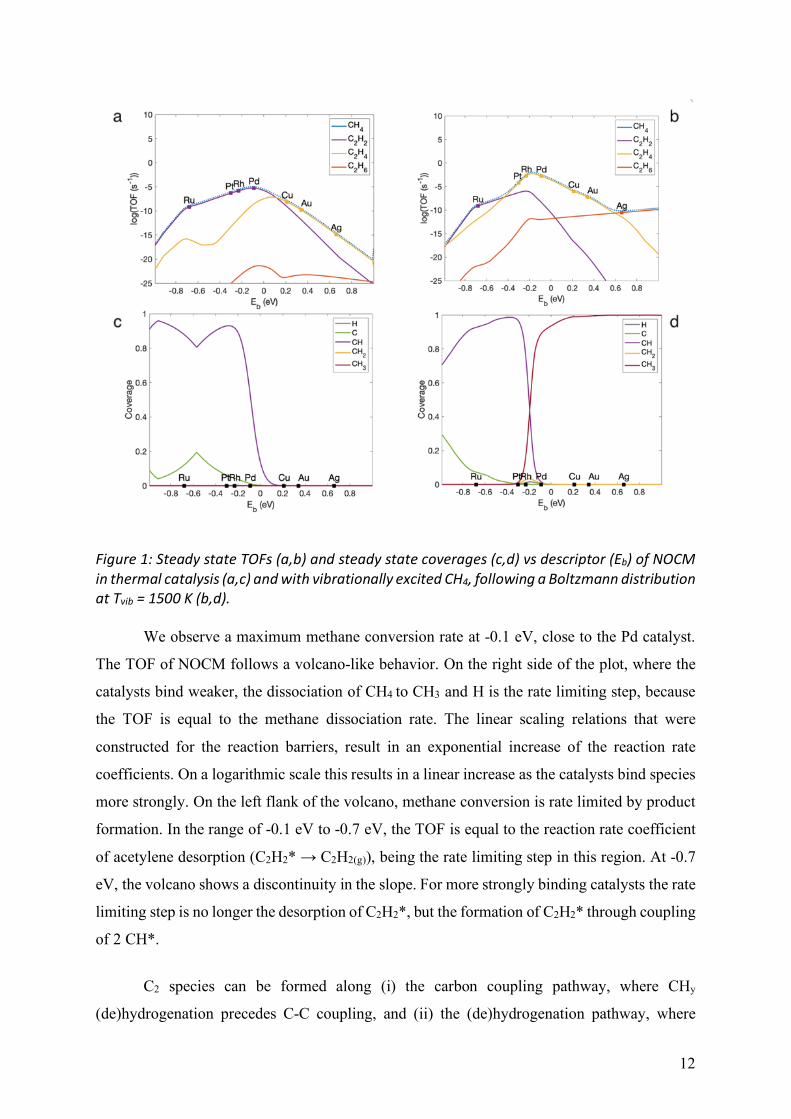
Figure 1: Steady state TOFs (a,b) and steady state coverages (c,d) vs descriptor (Eb) of NOCM in thermal catalysis (a,c) and with vibrationally excited CH4, following a Boltzmann distribution at Tvib = 1500 K (b,d).
We observe a maximum methane conversion rate at -0.1 eV, close to the Pd catalyst.
The TOF of NOCM follows a volcano-like behavior. On the right side of the plot, where the
catalysts bind weaker, the dissociation of CH4 to CH3 and H is the rate limiting step, because
the TOF is equal to the methane dissociation rate. The linear scaling relations that were
constructed for the reaction barriers, result in an exponential increase of the reaction rate
coefficients. On a logarithmic scale this results in a linear increase as the catalysts bind species
more strongly. On the left flank of the volcano, methane conversion is rate limited by product
formation. In the range of -0.1 eV to -0.7 eV, the TOF is equal to the reaction rate coefficient
of acetylene desorption (C2H2* → C2H2(g)), being the rate limiting step in this region. At -0.7
eV, the volcano shows a discontinuity in the slope. For more strongly binding catalysts the rate
limiting step is no longer the desorption of C2H2*, but the formation of C2H2* through coupling
of 2 CH*.
C2 species can be formed along (i) the carbon coupling pathway, where CHy
(de)hydrogenation precedes C-C coupling, and (ii) the (de)hydrogenation pathway, where

13
coupling precedes dehydrogenation of C2Hy species to the final product. For ethylene and
ethane, the combination of these two pathways leads to ‘dual volcanos. In the case of ethylene,
the summit of the highest volcano can be found around 0 eV. This volcano corresponds to the
coupling of CH2* radicals. The second summit occurs at -0.7 eV where the dominant pathway
is C2H2* hydrogenation to C2H4*. Similarly, the dual volcano behavior can also be observed
for ethane. On the more weakly binding catalysts (from 0 eV to 1 eV), a volcano trend occurs
from the coupling of CH3* radicals, while around -0.1 eV a higher volcano occurs for the
hydrogenation of C2H4* to C2H6. The individual rate of each elementary reaction in the model
is reported in the Supporting Information (Figure S12). From these plots can be determined
which are the dominant reactions for gain and loss terms of the species. Volcano behavior of
methane conversion was reported before in methane steam reforming44. To the best of our
knowledge, these are the first reports of volcano plots for NOCM.
On the bottom left plot, we can see that for all catalysts with binding energy greater
than Pd, the active sites remain empty as all the CH3* radicals get dehydrogenated to CH2*,
which couple to form C2H4 before a new CH4 molecule can dissociate. On more strongly
binding catalysts, the most stable adsorbates are CH* (and to some extent C*). The same
discontinuity as mentioned above, arising from a change in rate limiting step, can be observed
in the steady state coverage of CH* as well. Since it becomes more difficult for CH* to couple
to C2H2*, there is a temporary increase of the steady state coverage in the interval from -0.5
eV to -0.9 eV.
The net steady state rates along the different reaction pathways in NOCM are shown in
Figure 2 for rhodium (Eb = -0.24 eV) and silver (Eb = 0.65 eV). The intermediate species C2H5*,
C2H3* and C2H* are left out for the sake of clarity. The width of the flow lines corresponds to
the relative weights, but as the latter can vary up to 10 orders of magnitude, the widths are not
drawn to scale. However, they still show a good overview of the dominant pathways. For the
exact values of the net rates of each reaction, we refer to Figures S12, S13 and S14 in the
Supporting Information. The diagrams confirm that on the more strongly binding catalyst (Rh),
the (blue) dehydrogenation flow lines are more important up to CH*, and push the conversion
towards acetylene, while on the more noble catalyst (Ag), the largest flow ends in ethylene, in
agreement with the volcano plot in Figure 1 (top left plot). Furthermore, CH3 coupling is more
important than the C2H4 hydrogenation pathway for the formation of C2H6 on Ag (red flow
lines), while the opposite holds for Rh. The shift from one dominant pathway to the other

14
translates in the dual volcano behaviour explained above. A small part of C2H4 is
dehydrogenated to C2H2 on Ag (purple flow line between both), while on Rh the direction of
the pathway is inverted and C2H4 is formed from C2H2 hydrogenation (yellow flow line
between both). This result, showing that C2H4 (de)hydrogenation acts as an important
branching mechanism in the catalytic conversion, was also suggested by Indarto, et al.19, for
plasma-based conversion, based on a microkinetic model for NOCM in a DBD (without
catalyst).
Figure 2: Relative weights of reaction pathways in thermal catalytic NOCM, using a flow diagram representation45. Blue flow lines represent dehydrogenation, while red, yellow and purple flow lines represent the formation of ethane, ethylene and acetylene, respectively.
2. Effect of methane vibrational excitation
We next incorporate the influence of CH4 vibrational excitation on rates and selectivities.
Vibrational excitations are expected to be prominent in microwave and gliding arc plasmas,12,15
but they can also be important in dielectric barrier discharges (DBDs)17, depending on the
power distribution over the microdischarge filaments. In addition, vibrational excitation can
also be realized e.g., by lasers36, making it of broader fundamental interest.
The right-hand side of Figure 1 reports turnover frequencies and steady state coverages
obtained from methane vibrational excitation. The vibrationally excited methane follows here

15
a Boltzmann distribution at a vibrational temperature of 1500 K. This temperature was found
to give the highest TOF, as shown in Figure 4 and explained below.
In the bottom right graph, a notable difference can be seen in the steady state coverage
of CH3* on the more noble catalysts. The reactive methane molecules dissociate much faster
than in the thermal case, due to the vibrational excitation. Therefore, these catalysts, which are
not capable of dehydrogenating CH3* to CH2*, are completely covered with CH3* radicals.
Around Pd and Rh, the steady state coverage shifts in favor of CH*.
On the turnover frequency plots, we observe important changes in the selectivity of the
C2-hydrocarbons. The major product formed from vibrationally activated NOCM is ethylene,
for most of the catalysts (Pt, Rh, Pd, Cu and Au), with the exception of Ag, which mainly
produces ethane, and Ru, for which acetylene is predicted to be the major product. From this
perspective, combining vibrational excitations of methane with the appropriate catalyst is a
promising way to favor ethylene production, which is of particular interest for chemical
industry. Increased methane conversion rates are found for those catalysts where CH4
dissociation was rate limiting (Pd, Cu, Au, Ag) and on Pt and Rh, where the rate limiting step
has shifted from CH* coupling to CH2* coupling. On Ag, the rate limiting step is now the
coupling of CH3* to ethane. We can see that the maximum ethane formation has increased and
shifted to the more noble catalysts, while the volcano for ethylene formation finds its maximum
between Rh and Pd, similar to the thermal maximum. We observe a rate of ethylene formation
that is a factor 105 higher around platinum, rhodium and palladium. This increase is however
not as high as for ethane (factor 1012), since the conversion still depends on the ability of the
catalyst to dehydrogenate CH3*. The maximum TOF of acetylene does not change much, but
the entire volcano lies slightly lower because of the lowered coverage of CH* around Pd and
Rh.
As mentioned before, the ethane formation rate is the sum of two rates corresponding
to two different pathways for product formation: one for the carbon coupling reaction (2 CH3*
to C2H6) and one for the two-step hydrogenation reaction (C2H4* and 2H* to C2H6). The top of
the carbon coupling volcano has shifted from 0.4 eV (close to Au) in thermal NOCM to beyond
1 eV. Thus, catalysts that were inactive in thermal NOCM are now capable of reforming
methane because they are no longer limited by low methane dissociation rates. The local
maximum from the C2H4* hydrogenation pathway is still visible around -0.2 eV. On all

16
catalysts, the ethylene conversion is now dominated by the CH2* coupling mechanism and the
local maximum at -0.7 eV from the hydrogenation pathway, observed in thermal NOCM, is
now lower than the local coupling rate of CH2*. The individual rate of each elementary reaction
in the model is reported in the Supporting Information (Figure S13).
Figure 3: Relative weights of reaction pathways in NOCM with vibrationally excited methane, using a flow diagram representation45. Blue flow lines represent dehydrogenation, while red, yellow and purple flow lines represent the formation of ethane, ethylene and acetylene, respectively.
The flow diagrams for NOCM with vibrationally excited methane are shown in Figure
3 for the Rh and Ag catalysts. The main difference between the thermal case and the case of
vibrationally excited methane is the increased ethane TOF on noble catalysts (like Ag) due to
the high amounts of CH3* (see right side plots of Figure 1). On Ag, the ethane TOF is higher
than the TOF of ethylene which is the second main product. The top of the volcano plot can be
found on Rh where the main reaction path is CH4 dissociation to CH3*, CH3* dehydrogenation
to CH2* and subsequent CH2* coupling towards ethylene. The primary pathway for ethane
formation is C2H4* hydrogenation, instead of CH3* coupling, which translates in the ‘dual
volcano’ behaviour described above.

17
Figure 4: log(TOF) as a function of Tvib and Eb (colors are assigned relative to the maximum TOF).
Figure 4 shows the maximum TOFs of methane, ethane, ethylene and acetylene as a
function of the vibrational temperature and the CH3 binding energy. On the methane map, the
summit is located at 1500 K around -0.1 eV catalyst (close to Rh and Pd), where the main
product is ethylene. The volcano plots corresponding to this vibrational temperature are the
ones shown in the right-hand plots of Figure 1. At higher vibrational temperatures, the higher
dissociation rate of methane results in a higher coverage of the catalyst. The lack of free sites
obstructs the further dehydrogenation of CH3 radicals to CH2, thereby inhibiting the formation
of ethylene and acetylene. These trends can also be verified on the ethylene map and even
stronger on the acetylene map, which hardly benefits from vibrational excitations of the
reactant. Figure S15 of the Supporting Information, shows the same plots for the metal (111)
terraces.
3. Effect of reactive plasma species
The vibrational temperature used above was below the threshold for significant gas-phase CH4
dissociations46. However, in practice, radicals are formed in DBD plasma by other processes,

18
such as electron impact dissociation. We therefore now consider the potential effect of ground
state intermediate plasma species (radicals) and methane conversion products, by modifying
the gas phase composition to the calculated pressures, characteristic for an atmospheric DBD
at a temperature of 500 K20. While the exact partial pressures depend on the type of plasma,
the qualitative trends and concepts described below are more generally valid.
The partial pressures of the relevant plasma species considered in the model are shown
in Table 2. We neglect vibrational excitations here to focus on the contrast between plasma-
accelerated surface reactions and plasma-generated species. It is indeed an advantage of
computer modeling to be able to distinguish between separate effects, which is much more
difficult in experiments. The reactions and the treatment of these extra species are outlined in
the first paragraph of the section Results and Discussion. The only difference with the previous
sections, is that other species than methane can now also adsorb on the surface. Subsequent
elementary reactions are identical as before.
Table 2: Calculated partial pressures (bar) in a methane DBD plasma at 500K, adopted from De Bie, et al.20
H H2
1,06 .10-8 4,35 .10-1
C CH CH2 CH3 CH4
4,72 .10-13 1,34 .10-12 4,56 .10-8 2,01 .10-8 4,72 .10-1
C2H C2H2 C2H3 C2H4 C2H5 C2H6
1,04 .10-11 3,75 .10-2 2,02 .10-5 1,05 .10-2 3,03 .10-5 4,42 .10-2
In Figure 5, we show the steady state turnover frequencies and steady state coverages
at 500 K for a gas mixture of methane, ethane, ethylene and acetylene, as well as the
corresponding radicals, based on their partial pressures (number densities) calculated for a
DBD plasma (cf. Table 2 above).

19
On the right-hand side, we can see that the steady state coverages are completely
changed. In the thermal case, CH* (and to some extent C*) covered the surface of catalyst
materials that bind more strongly than Pd. In the present case, where much more reactive
carbon species are present in the gas phase, the more weakly binding catalysts (i.e., Cu, Au and
Ag) are covered with C2H3*, while the intermediate catalysts (including Pt, Rh and Pd) are
covered with C2H5*, C2H3* and CH*, and the strongest catalysts (Ru and stronger) are covered
with CH* and C2H2*. Indeed, the high amount of H and H2 in the gas phase (see Table 2)
hydrogenates the surface species, giving rise to more volatile species at the surface, as
compared to C* and CH* in the case of pure methane (either thermal or with vibrational
excitation; cf. Figure 1). C2H5* and C2H3* are the dominant adsorbates because of their high
densities in the plasma phase. Around Ru, a spike of adsorbed C2H2* can be observed. As
mentioned above for thermal NOCM, in this regime acetylene desorption becomes more
difficult, resulting in a higher coverage of the species. On even stronger catalysts acetylene
breaks up in 2 CH* radicals. The interaction of plasma-generated radicals with the catalyst
causes more saturated (and volatile) species to cover the surface, thus limiting the carbon-
laydown. The model captures the initial formation of carbonaceous species as chemisorbed C*
and CH*, species expected to be precursors to coke. The model does not capture the further
nucleation and growth of coke, which leads both to catalyst deactivation and non-productive
methane consumption. Robust models for the rate of coke formation vs metal are not available.
While carbon deposition is a major practical limitation in thermal NOCM, a potential
advantage of plasma-enhanced methane conversion is the ability to operate at lower
temperatures at which coke production rates are lower.

20
Figure 5: Steady state TOFs (a) and steady state coverages (b) vs descriptor (Eb) in NOCM with reactive plasma species, characteristic for a DBD plasma at 500 K.
From the plot it is clear that TOFs of the C2-hydrocarbons have strongly increased compared
to thermal NOCM, with TOFs in the range of 10-2 around Pt and 103 around Ag. Hence, while
for all catalysts investigated, the catalyst is almost completely covered with carbon species,
this only seems to inhibit the conversion process significantly on catalysts stronger than Rh.
Most of the surface species on the more noble catalysts are C2H5* and C2H3*, which
hydrogenate relatively easily towards ethane and ethylene. Because CH, CH2, C2H and C2H3
are now present in the initial gas mixture (produced in the plasma), strongly binding catalysts
are now no longer a requirement for their formation. On the weakly binding catalysts, C2H*
and C2H3* need H* atoms on the catalyst surface for contributing to the total C2H2 and C2H4
production, but the high densities of H atoms in the plasma phase can provide for these. C2H3
and CH2 have considerably higher densities than C2H and CH (cf. Table 2 above) and,
therefore, ethylene is the dominant product over acetylene for the more noble catalysts (Pd,
Cu, Au, Ag). Furthermore, as the CH2 density is similar to the CH3 density (and likewise for
C2H3 and C2H5), ethylene is also preferred over ethane, due to its lower formation barrier.
Considering the added-value of olefins, our results suggest that the more noble catalysts,
maximizing ethylene TOF and selectivity, are most appropriate for NOCM in plasma with high
densities of reactive radicals.
On the left side of the plot, reaction mechanisms are different, and ethane, ethylene and
acetylene have similar/identical TOFs. Indeed, around Pt and Rh, ethylene is formed through
the hydrogenation of C2H3*. The H atoms necessary for this reaction are provided by the
dehydrogenation of another C2H3* radical, resulting in a net reaction of 2C2H3* radicals into

21
C2H4 and C2H2 and an overlap of the TOFs of ethylene and acetylene in this region. Similarly,
around Ru, C2H3* provides the hydrogen for the hydrogenation of C2H5*, yielding a net
reaction of C2H3* + C2H5* into C2H2 and C2H6. The individual rate of each elementary reaction
in the model is reported in the Supporting Information (Figure S14).
In general, the TOFs are dominated by the reactions of the plasma-produced radicals.
The catalytic dissociation of methane is negligible and the reverse reaction, which converts
plasma-generated CH3 back to methane, is faster on each catalyst material.
Figure 6: Relative weights of reaction pathways in plasma-catalytic NOCM, using a flow diagram representation45. Green flow lines represent hydrogenation, red, yellow and purple flow lines represent the formation of ethane, ethylene and acetylene, respectively, while light blue flow lines represent adsorption from species provided by the plasma. All reactions flow from left to right, with the exception of the green flowlines, which represent rehydrogenation of the surface species.
In Figure 6, we show the reaction pathways and their corresponding weights on Rh and
Ag. The biggest difference with Figures 2 and 3 is the presence of the light blue flow lines that
represent the radicals provided by the plasma. On the noble catalyst (Ag), we can see that the
primary source for ethane production is now C2H5* hydrogenation, as opposed to CH3*

22
coupling in thermal NOCM (see Figure 2) and in NOCM through vibrational excitation of
methane (see Figure 3). Also, C2H3* and CH3* are hydrogenated to ethylene and methane,
respectively. This indeed shows that, for more noble catalysts, high coverages do not stop the
conversion process, as hydrogenation reactions occur easily due to the significant densities of
the H-atoms in the plasma. CH2* coupling barriers are lower than CH3* coupling barriers, and
thus, for ethylene formation this pathway has a higher relative weight than the C2H3*
hydrogenation pathway, in contrast with the analogous reactions for ethane. In general, the blue
flow lines corresponding to dehydrogenation processes (see Figures 2 and 3) are now replaced
by hydrogenation reactions (green flow lines), both on Ag and on Rh. The only exception is
the dehydrogenation of plasma-produced C2H3 on Rh, which is the primary source for
hydrogen for this type of catalysts. The relative thickness of the product lines shows the
selectivity on both catalysts: C2H4 > CH4 > C2H6 > C2H2 on Ag and C2H2 ~ C2H4 > C2H6 >
CH4 on Rh.
4. Future Work
Relative thermal NOCM rates across metals have not been reported, as these materials are not
common NOCM catalysts and the reaction is severely equilibrium limited at the temperatures
considered here. The primary aim of this work is to establish the potential for plasma species
to promote NOCM across a series of metal catalysts. For this comparison, we assume the
plasma species concentrations to be insensitive to the catalyst itself, neglecting e.g. electrical
effects of the catalyst material or the impact of the produced and consumed species on the
plasma composition. Such insight cannot as easily be gathered through experimental means,
because experimental measurements fail to isolate the different aspects of the plasma-catalyst
coupling.
The most common experimental techniques available to clarify reaction pathways in
plasma catalysis are (i) studying the apparent energy barrier to identify the rate-limiting steps,
(ii) isotope experiments to trace back the atomic composition of the products, (iii) X-ray
photoelectron spectroscopy and in-situ operando FTIR to study the coverage of the catalyst
surface. These techniques can give specific kinetic and mechanistic information and it would
be highly interesting to compare our modeling results and insights with such experimental
data, if they become available for NOCM. In addition, our reported model and results allow

23
future work that couples this model to a plasma model, which can calculate actual
conversions, yields and selectivities20.
The sections above discuss the plasma-catalyst interactions from a chemical
perspective, studying the reactions of plasma species on transition metals. The densities of
plasma species are herein assumed unaffected by the presence of the catalyst. For a future more
quantitative study on plasma-catalytic NOCM in DBDs, one has to consider the changes in the
plasma due to the catalyst material. The introduction of a packing in a DBD can cause an
electric field enhancement depending on the dielectric constant of the material29,47,48. This
results in higher electron temperatures and more effective electron impact reactions (i.e.
excitation, dissociation and ionization of methane). Nozaki, et al.,49 calculated how the electric
field impacts the fragmentation pattern of methane for reduced electric fields (E/N) ranging
from 80 to 500 Td. They showed that 60% of the dissociated methane ends in CH3 radicals and
10% in CH radicals at low E/N, while the fractions at high E/N are 25% and 20%, respectively.
The fraction of CH2 radicals remains unchanged at around 20% for all E/N. The discussions in
the sections above demonstrate the importance of the individual densities of each radical
species on the selectivity of the C2-hydrocarbons and it is to be expected that for lower electric
fields, more ethane is formed due to the higher density of CH3 radicals, while higher electric
fields would benefit the production of acetylene due to higher densities of CH radicals.
For low weight percentages of the metal catalyst on the support, the electrical changes
are presumably mostly determined by the support and unaffected by the catalyst material, and
the effect of the support could in principle be incorporated in the same modelling framework.
Higher weight percentages would require studying the effects of the individual metals. As
explained in the introduction, Jo, et al.,29 studied the effects of an electrically conductive Pt
catalyst on the methane reforming inside a DBD. The higher ethane yields and lower acetylene
yields upon introduction of a Pt catalyst compared to bare Al2O3 were explained by a lowering
of the E/N, causing a higher fraction of CH3 and a lower fraction of CH radicals.
Additionally, the presence of a packing material in the discharge zone also causes lower
electron densities due to neutralization at the bead surface47 and could change the discharge
type from filamentary to surface discharges50. It would depend on the plasma and catalyst
nature how these different effects impact the densities of the reactive plasma species.

24
Conclusion
Model results show that both vibrational excitations and plasma-generated radicals can impact
the rates and selectivity of NOCM on transition metal catalysts. The central concepts of the
traditional volcano behavior remain valid when including (plasma-induced) vibrational
excitations, but both vertical shifts (higher rates) and horizontal shifts (other catalyst binding
strength) can be observed. Plasma-generated radicals affect the turnover frequencies in a
different way, with mixed selectivity and a limited increase in TOF on more strongly binding
catalysts and high selectivity towards ethylene and much greater increase in TOF on the more
noble catalysts. Optimal catalyst materials for thermal catalytic conversion, and even for
vibrationally excited methane, act very differently when put in contact with methane plasmas
containing high concentrations of radicals.
The more noble catalysts (e.g., Ag) remain relatively inactive when combined with
plasma that is dominated by vibrational excitation, yielding low TOFs and highest selectivity
towards ethane. Conversely, when many radicals are present in the plasma, these catalysts
benefit maximally from the available radicals and the catalyst efficiently recombines species
towards ethylene. Intermediate catalysts (such as Pt, Rh and Pd) benefit most from
vibrationally excited methane, converting the increased amount of CH3* radicals to ethylene.
In the presence of plasma radicals, the production rate of acetylene increases due to the
dehydrogenation of C2-hydrocarbon radicals. The more strongly binding catalysts (like Ru) are
less impacted by changes in the gas phase species. Product formation rates remain low due to
poisoning of the surface and low desorption rates, and because plasma effects assist non-rate-
limiting steps.
Additionally, depending on the desired product, an optimal vibrational temperature can
be found, for which the TOF is maximal. Lower vibrational temperatures suffer from high
dissociation barriers, while higher vibrational temperatures would poison the catalyst and
inhibit the further dehydrogenation processes. Because ethane production directly depends on
the dissociation rate of methane and does not require further dehydrogenation, it will always
benefit from a higher degree of excitation of the reactant. Ethylene production does require
another dehydrogenation step and the optimal vibrational temperature can be found at 1500 K
for Pt, Rh and Pd. For acetylene this trend is even stronger and excitations do not significantly
improve the production rate, regardless of the catalyst. Limiting the vibrational temperature of
the plasma to the optimal temperature, depending on the desired product, can reduce the
specific energy input and optimize the energy efficiency.

25
The increased ethylene TOF and selectivity (on noble catalysts for high radical density
plasmas and on intermediate catalysts for high vibrational excitation plasmas) is of particular
promise for industrial applications, efficiently converting cheap methane to value-added
ethylene. In general, it is clear that catalyst and plasma greatly depend on one another, and that
the choice of catalyst should not only depend on the desired product, but also on the type of
plasma and its characteristics (i.e., degree of vibrational excitation and reactivity in terms of
radical densities). Choosing the appropriate catalyst can increase the production rate (higher
TOF), reduce coke formation (increased coverage of volatile species), optimize the energy
efficiency (higher TOF for the same degree of vibrational excitation or gas phase composition)
and decide the selectivity of the reaction products.
Conflicts of Interest
The authors declare that they have no known competing financial interests or personal relationships that could
have appeared to influence the work reported in this paper
Acknowledgements We would like to thank Tom Butterworth for his work on methane vibrational distribution functions (VDF) and
for sharing his thoughts and experiences on this matter, specifically regarding the VDF of the degenerate modes
of methane. We also acknowledge financial support from the DOC-PRO3 project and the TOP-BOF project of
the University of Antwerp. This work was carried out in part using the Turing HPC infrastructure at the CalcUA
core facility of the Universiteit Antwerpen, a division of the Flemish Supercomputer Center VSC, funded by the
Hercules Foundation, the Flemish Government (department EWI) and the University of Antwerp. Support for
WFS provided by the National Science Foundation under Cooperative Agreement No. EEC-1647722, an
Engineering Research Center for the Innovative and Strategic Transformation of Alkane Resources (CISTAR).
PM acknowledges support through the Eilers Graduate Fellowship of the University of Notre Dame.
Supporting Information
Extra information and figures on the scaling relations, additional heat maps of the effect of
bending modes and heat maps, steady-state coverages and TOFs for the (111) surfaces
References
(1) Amghizar, I.; Vandewalle, L. A.; Van Geem, K. M.; Marin, G. B. New Trends in Olefin Production.
Engineering 2017, 3 (2), 171–178. DOI: 10.1016/J.ENG.2017.02.006.
(2) Dry, M. E. High Quality Diesel via the Fischer-Tropsch Process - A Review. J. Chem. Technol.
Biotechnol. 2002, 77 (1), 43–50. DOI: 10.1002/jctb.527.

26
(3) Scapinello, M.; Delikonstantis, E.; Stefanidis, G. D. The Panorama of Plasma-Assisted Non-Oxidative
Methane Reforming. Chem. Eng. Process. Process Intensif. 2017, 117 (April), 120–140. DOI:
10.1016/j.cep.2017.03.024.
(4) Horn, R.; Schlögl, R. Methane Activation by Heterogeneous Catalysis. Catal. Letters 2015, 145 (1), 23–
39. DOI: 10.1007/s10562-014-1417-z.
(5) Vora, B. V.; Marker, T. L.; Barger, P. T.; Nilsen, H. R.; Kvisle, S.; Fuglerud, T. Economic Route for
Natural Gas Conversion to Ethylene and Propylene. 1997, 107, 87–98.
(6) Torres Galvis, H. M.; De Jong, K. P. Catalysts for Production of Lower Olefins from Synthesis Gas: A
Review. ACS Catal. 2013, 3 (9), 2130–2149. DOI: 10.1021/cs4003436.
(7) Guéret, C.; Daroux, M.; Billaud, F. Methane Pyrolysis: Thermodynamics. Chem. Eng. Sci. 1997, 52 (5),
815–827. DOI: 10.1016/S0009-2509(96)00444-7.
(8) Ma, S.; Guo, X.; Zhao, L.; Scott, S.; Bao, X. Recent Progress in Methane Dehydroaromatization: From
Laboratory Curiosities to Promising Technology. J. Energy Chem. 2013, 22 (1), 1–20. DOI:
10.1016/S2095-4956(13)60001-7.
(9) Xu, Y.; Lin, L. Recent Advances in Methane Dehydro-Aromatization over Transition Metal Ion-
Modified Zeolite Catalysts under Non-Oxidative Conditions. Appl. Catal. A Gen. 1999, 188 (1–2), 53–
67. DOI: 10.1016/S0926-860X(99)00210-0.
(10) Mehta, P.; Barboun, P.; Go, D. B.; Hicks, J. C.; Schneider, W. F. Catalysis Enabled by Plasma
Activation of Strong Chemical Bonds: A Review. ACS Energy Lett. 2019, 4 (5), 1115–1133. DOI:
10.1021/acsenergylett.9b00263.
(11) Fincke, J. R.; Anderson, R. P.; Hyde, T.; Detering, B. A.; Wright, R.; Bewley, R. L.; Haggard, D. C.;
Swank, W. D. Plasma Thermal Conversion of Methane to Acetylene. Plasma Chem. Plasma Process.
2002, 22 (1), 105–136. DOI: 10.1023/A:1012944615974.
(12) Snoeckx, R.; Bogaerts, A. Plasma Technology-a Novel Solution for CO2 Conversion? Chem. Soc. Rev.
2017, 46 (19), 5805–5863. DOI: 10.1039/c6cs00066e.
(13) Neyts, E. C.; Ostrikov, K. (Ken); Sunkara, M. K.; Bogaerts, A. Plasma Catalysis: Synergistic Effects at
the Nanoscale. Chem. Rev. 2015, 115 (24), 13408–13446. DOI: 10.1021/acs.chemrev.5b00362.
(14) Yang, Y. Direct Non-Oxidative Methane Conversion by Non-Thermal Plasma: Modeling Study. Plasma
Chem. Plasma Process. 2003, 23 (2), 327–346. DOI: 10.1023/A:1022924220062.
(15) Bogaerts, A.; Neyts, E. C. Plasma Technology: An Emerging Technology for Energy Storage. ACS
Energy Lett. 2018, 3 (4), 1013–1027. DOI: 10.1021/acsenergylett.8b00184.
(16) Kogelschatz, U. Dielectric-Barrier Discharges: Their History, Discharge Physics, and Industrial
Applications. Plasma Chem. Plasma Process. 2003, 23 (1), 1–46. DOI: 10.1023/A:1022470901385.
(17) Nozaki, T.; Muto, N.; Kado, S.; Okazaki, K. Dissociation of Vibrationally Excited Methane on Ni
Catalyst: Part 1. Application to Methane Steam Reforming. Catal. Today 2004, 89 (1–2), 57–65. DOI:

27
10.1016/j.cattod.2003.11.040.
(18) Nozaki, T.; Okazaki, K. Non-Thermal Plasma Catalysis of Methane: Principles, Energy Efficiency, and
Applications. Catal. Today 2013, 211, 29–38. DOI: 10.1016/j.cattod.2013.04.002.
(19) Indarto, A.; Coowanitwong, N.; Choi, J. W.; Lee, H.; Song, H. K. Kinetic Modeling of Plasma Methane
Conversion in a Dielectric Barrier Discharge. Fuel Process. Technol. 2008, 89 (2), 214–219. DOI:
10.1016/j.fuproc.2007.09.006.
(20) De Bie, C.; Verheyde, B.; Martens, T.; Van Dijk, J.; Paulussen, S.; Bogaerts, A. Fluid Modeling of the
Conversion of Methane into Higher Hydrocarbons in an Atmospheric Pressure Dielectric Barrier
Discharge. Plasma Process. Polym. 2011, 8 (11), 1033–1058. DOI: 10.1002/ppap.201100027.
(21) Neyts, E. C.; Bogaerts, A. Understanding Plasma Catalysis through Modelling and Simulation—a
Review. J. Phys. D. Appl. Phys. 2014, 47 (22), 224010. DOI: 10.1088/0022-3727/47/22/224010.
(22) Puliyalil, H.; Lašič Jurković, D.; Dasireddy, V. D. B. C.; Likozar, B. A Review of Plasma-Assisted
Catalytic Conversion of Gaseous Carbon Dioxide and Methane into Value-Added Platform Chemicals
and Fuels. RSC Adv. 2018, 8 (48), 27481–27508. DOI: 10.1039/c8ra03146k.
(23) Chen, H. L.; Lee, H. M.; Chen, S. H.; Chao, Y.; Chang, M. B. Review of Plasma Catalysis on
Hydrocarbon Reforming for Hydrogen Production-Interaction, Integration, and Prospects. Appl. Catal.
B Environ. 2008, 85 (1–2), 1–9. DOI: 10.1016/j.apcatb.2008.06.021.
(24) Van Durme, J.; Dewulf, J.; Leys, C.; Van Langenhove, H. Combining Non-Thermal Plasma with
Heterogeneous Catalysis in Waste Gas Treatment: A Review. Appl. Catal. B Environ. 2008, 78 (3–4),
324–333. DOI: 10.1016/j.apcatb.2007.09.035.
(25) Mehta, P.; Barboun, P.; Go, D. B.; Hicks, J. C.; Schneider, W. F. Catalysis Enabled by Plasma
Activation of Strong Chemical Bonds: A Review. ACS Energy Lett. 2019. DOI:
10.1021/acsenergylett.9b00263.
(26) Rouwenhorst, K. H. R.; Kim, H.-H.; Lefferts, L. Vibrationally Excited Activation of N2 in Plasma-
Enhanced Catalytic Ammonia Synthesis: A Kinetic Analysis. ACS Sustain. Chem. Eng. 2019. DOI:
10.1021/acssuschemeng.9b04997.
(27) Kim, J.; Abbott, M. S.; Go, D. B.; Hicks, J. C. Enhancing C-H Bond Activation of Methane via
Temperature-Controlled, Catalyst-Plasma Interactions. ACS Energy Lett. 2016, 1 (1), 94–99. DOI:
10.1021/acsenergylett.6b00051.
(28) Kim, J.; Go, D. B.; Hicks, J. C. Synergistic Effects of Plasma-Catalyst Interactions for CH4 Activation.
Phys. Chem. Chem. Phys. 2017, 19 (20), 13010–13021. DOI: 10.1039/c7cp01322a.
(29) Jo, S.; Kim, T.; Lee, D. H.; Kang, W. S.; Song, Y.-H. Effect of the Electric Conductivity of a Catalyst
on Methane Activation in a Dielectric Barrier Discharge Reactor. Plasma Chem. Plasma Process. 2014,
34 (1), 175–186. DOI: 10.1007/s11090-013-9505-1.
(30) Schmidt-Szałowski, K.; Krawczyk, K.; Młotek, M. Catalytic Effects of Metals on the Conversion of
Methane in Gliding Discharges. Plasma Process. Polym. 2007, 4 (7–8), 728–736. DOI:

28
10.1002/ppap.200700052.
(31) Młotek, M.; Sentek, J.; Krawczyk, K.; Schmidt-Szałowski, K. The Hybrid Plasma-Catalytic Process for
Non-Oxidative Methane Coupling to Ethylene and Ethane. Appl. Catal. A Gen. 2009, 366 (2), 232–241.
DOI: 10.1016/j.apcata.2009.06.043.
(32) Spiess, F. J.; Suib, S. L.; Irie, K.; Hayashi, Y.; Matsumoto, H. Metal Effect and Flow Rate Effect in the
Hydrogen Production from Methane. Catal. Today 2004, 89 (1–2), 35–45. DOI:
10.1016/j.cattod.2003.11.043.
(33) Scapinello, M.; Delikonstantis, E.; Stefanidis, G. D. A Study on the Reaction Mechanism of Non-
Oxidative Methane Coupling in a Nanosecond Pulsed Discharge Reactor Using Isotope Analysis. Chem.
Eng. J. 2019, 360 (August 2018), 64–74. DOI: 10.1016/j.cej.2018.11.161.
(34) Mehta, P.; Barboun, P.; Herrera, F. A.; Kim, J.; Rumbach, P.; Go, D. B.; Hicks, J. C.; Schneider, W. F.
Overcoming Ammonia Synthesis Scaling Relations with Plasma-Enabled Catalysis. Nat. Catal. 2018, 1
(4), 269–275. DOI: 10.1038/s41929-018-0045-1.
(35) Mehta, P.; Barboun, P. M.; Engelmann, Y.; Go, D. B.; Bogaerts, A.; Schneider, W. F.; Hicks, J. C. .
Plasma-Catalytic Ammonia Synthesis Beyond the Equilibrium Limit. DOI:
10.26434/chemrxiv.11768718.v1.
(36) Juurlink, L. B. F.; Killelea, D. R.; Utz, A. L. State-Resolved Probes of Methane Dissociation Dynamics.
Prog. Surf. Sci. 2009, 84 (3–4), 69–134. DOI: 10.1016/j.progsurf.2009.01.001.
(37) Hummelshøj, J. S.; Abild-Pedersen, F.; Studt, F.; Bligaard, T.; Nørskov, J. K. CatApp: A Web
Application for Surface Chemistry and Heterogeneous Catalysis. Angew. Chemie - Int. Ed. 2012, 51 (1),
272–274. DOI: 10.1002/anie.201107947.
(38) Wang, S.; Petzold, V.; Tripkovic, V.; Kleis, J.; Howalt, J. G.; Skúlason, E.; Fernández, E. M.; Hvolbæk,
B.; Jones, G.; Toftelund, A.; Falsig, H.; Björketun, M.; Studt, F.; Abild-Pedersen, F.; Rossmeisl, J.;
Nørskov, J. K.; Bligaard, T. Universal Transition State Scaling Relations for (de)Hydrogenation over
Transition Metals. Phys. Chem. Chem. Phys. 2011, 13 (46), 20760–20765. DOI: 10.1039/c1cp20547a.
(39) Wang, S.; Temel, B.; Shen, J.; Jones, G.; Grabow, L. C.; Studt, F.; Bligaard, T.; Abild-Pedersen, F.;
Christensen, C. H.; Nørskov, J. K. Universal Brønsted-Evans-Polanyi Relations for C-C, C-O, C-N, N-
O, N-N, and O-O Dissociation Reactions. Catal. Letters 2011, 141 (3), 370–373. DOI: 10.1007/s10562-
010-0477-y.
(40) Ma, H.; Schneider, W. F. Structure- and Temperature-Dependence of Pt-Catalyzed Ammonia Oxidation
Rates and Selectivities. ACS Catal. 2019, 9 (3), 2407–2414. DOI: 10.1021/acscatal.8b04251.
(41) Butterworth, T. D.; Amyay, B.; Bekerom, D. v. d.; Steeg, A. v. d.; Minea, T.; Gatti, N.; Ong, Q.;
Richard, C.; van Kruijsdijk, C.; Smits, J. T.; van Bavel, A. P.; Boudon, V.; van Rooij, G. J. Quantifying
Methane Vibrational and Rotational Temperature with Raman Scattering. J. Quant. Spectrosc. Radiat.
Transf. 2019, 236 (July), 106562. DOI: 10.1016/j.jqsrt.2019.07.005.
(42) Fridman, A. Plasma Chemistry; Cambridge University Press, 2008. DOI:

29
10.1017/CBO9780511546075.
(43) Campbell, C. T.; Sprowl, L. H.; Árnadóttir, L. Equilibrium Constants and Rate Constants for
Adsorbates: Two-Dimensional (2D) Ideal Gas, 2D Ideal Lattice Gas, and Ideal Hindered Translator
Models. J. Phys. Chem. C 2016, 120 (19), 10283–10297. DOI: 10.1021/acs.jpcc.6b00975.
(44) Jones, G.; Jakobsen, J. G.; Shim, S. S.; Kleis, J.; Andersson, M. P.; Rossmeisl, J.; Abild-Pedersen, F.;
Bligaard, T.; Helveg, S.; Hinnemann, B.; Rostrup-Nielsen, J. R.; Chorkendorff, I.; Sehested, J.;
Nørskov, J. K. First Principles Calculations and Experimental Insight into Methane Steam Reforming
over Transition Metal Catalysts. J. Catal. 2008, 259 (1), 147–160. DOI: 10.1016/j.jcat.2008.08.003.
(45) Lapton, R. ipysankeywidget https://github.com/ricklupton/ipysankeywidget (accessed Feb 27, 2020).
(46) Berthelot, A.; Bogaerts, A. Modeling of CO 2 Splitting in a Microwave Plasma: How to Improve the
Conversion and Energy Efficiency. J. Phys. Chem. C 2017, 121 (15), 8236–8251. DOI:
10.1021/acs.jpcc.6b12840.
(47) Van Laer, K.; Bogaerts, A. Influence of the Gap Size and Dielectric Constant of the Packing on the
Plasma Discharge in a Packed Bed Dielectric Barrier Discharge Reactor: A Fluid Modeling Study.
Plasma Process. Polym. 2017, 14, 1–11.
(48) Van Laer, K.; Bogaerts, A. How Bead Size and Dielectric Constant Affect the Plasma Behaviour in a
Packed Bed Plasma Reactor: A Modelling Study. Plasma Sources Sci. Technol. 2017, 26 (8). DOI:
10.1088/1361-6595/aa7c59.
(49) Nozaki, T.; Hattori, A.; Okazaki, K. Partial Oxidation of Methane Using a Microscale Non-Equilibrium
Plasma Reactor. Catal. Today 2004, 98 (4), 607–616. DOI: 10.1016/j.cattod.2004.09.053.
(50) Wang, W.; Kim, H.; Laer, K. Van; Bogaerts, A. Streamer Propagation in a Packed Bed Plasma Reactor
for Plasma Catalysis Applications. Chem. Eng. J. 2018, 334 (September 2017), 2467–2479. DOI:
10.1016/j.cej.2017.11.139.

30
For Table of Contents Use Only

S1
Supporting Information: Predicted Influence of Plasma Activation on Non-Oxidative Coupling of
Methane on Transition Metal Catalysts
Yannick Engelmann*a, Prateek Mehtab, Erik C. Neytsa, William F. Schneiderb, Annemie
Bogaertsa
*a Corresponding Author, e-mail address: [email protected]
Department of Chemistry, Research Group PLASMANT, PLASMA and NANOLab Centers of Excellence,
Universiteit Antwerpen, Universiteitsplein 1, 2610 Wilrijk-Antwerp, Belgium
a Department of Chemistry, Research Group PLASMANT, PLASMA and NANOLab Centers of Excellence,
Universiteit Antwerpen, Universiteitsplein 1, 2610 Wilrijk-Antwerp, Belgium
b Department of Chemical and Biomolecular Engineering, University of Notre Dame,
Notre Dame, IN, 46556, USA
Number of pages: 12Number of figures: 15Number of tables: 2
In this supporting information, we provide extra documentation to complement the main
article. In Section 1, we show the heat maps for the impact of bending modes on the TOFs on
the (211) steps, for an alpha parameter equal to 0.5 and 0.1, to be compared with the impact
of stretch modes with a Fridman-Macheret parameter shown in the main article. Section 2
shows the thermodynamic scaling relations for the (211) and (111) metal surfaces and the
comparison between calculated entropies and literature values. In Section 3 we show the
steady state coverages and turnover frequencies (TOFs) calculated for the metal (111)
terraces, analogous to the results on the (211) stepped surfaces shown in the main article.
Section 4 shows the individual net rates of each of the elementary reactions in the 3 models.
Finally, in Section 5, we show the heat maps for the impact of the vibrational temperature on
the TOFs on the metal (111) terraces.

S2
1. Heat maps for the effect of the vibrational temperature of the bending modes on the TOFs on metal (211) steps
Figure S1: log(TOF) as a function of Tvib and Eb on the metal (211) steps for excitation of the bending modes with an alpha parameter equal to 0.5. Colors are assigned relative to the maximum TOF.
Figure S2: log(TOF) as a function of Tvib and Eb on the metal (211) steps for excitation of the bending modes with an alpha parameter equal to 0.1. Colors are assigned relative to the maximum TOF.

S3
2. Scaling relations for reaction energies and reaction barriers on the metal (211) surfaces
Figure S3: Adsorption energies and activation barriers on metal (211) steps, as function of the CH3 binding energy for molecular and radical adsorption. The adsorption of radical species is assumed barrierless.
Figure S4: Reaction energies and activation barriers on metal (211) steps, as function of the CH3 binding energy for hydrogenation of CHy and C2Hy species.

S4
Figure S5: Coupling energies and activation barriers on metal (211) steps, as function of the CH3 binding energy for CH, CH2 and CH3.
Figure S6: Adsorption energies and activation barriers on metal (111) terraces, as function of the CH3 binding energy for molecular and radical adsorption. The adsorption of radical species is assumed barrierless.

S5
Figure S7: Reaction energies and activation barriers on metal (111) terraces, as function of the CH3 binding energy for hydrogenation of CHy and C2Hy species.
Figure S8: Coupling energies and activation barriers on metal (111) terraces, as function of the CH3 binding energy for CH, CH2 and CH3. Activation barriers were derived from BEP relations.1
Table S1: Surface Reaction Steps and Associated Microkinetic Parameters on the (111) terraces
Adsorption/desorption f f MAE a a MAE
H(g) + * ⇌ H* 0.69 -2.61 0.09 0.00 0.00 0.00H2(g) + 2* ⇌ 2H* 1.38 -0.70 0.19 1.06 0.21 0.16C(g) + * ⇌ C* 4.04 -5.96 0.37 0.00 0.00 0.00CH(g) + * ⇌ CH* 3.06 -5.58 0.26 0.00 0.00 0.00CH2(g) + * ⇌ CH2* 2.01 -3.46 0.15 0.00 0.00 0.00CH3(g) + * ⇌ CH3* 1.00 -1.52 0.00 0.00 0.00 0.00CH4(g) + 2* ⇌ CH3* + H* 1.69 0.42 0.09 1.59 1.15 0.16C2H(g) + * ⇌ C2H* 5.08 -4.43 0.49 0.00 0.00 0.00C2H2(g) + * ⇌ C2H2* 3.87 -1.52 0.50 1.60 -0.07 0.30C2H3(g) + * ⇌ C2H3* 3.06 -2.50 0.26 0.09 -0.01 0.03C2H4(g) + * ⇌ C2H4* 2.01 0.06 0.15 1.94 0.09 0.17

S6
C2H5(g) + * ⇌ C2H5* 1.00 -1.25 0.00 0.00 0.00 0.00
(De)hydrogenation
C* + H* ⇌ CH* + * -1.67 -0.53 0.21 -0.48 1.07 0.08CH* + H* ⇌ CH2* + * -1.73 0.35 0.21 -0.05 0.78 0.11CH2* + H* ⇌ CH3* + * -1.70 -0.25 0.24 0.05 0.61 0.07C2H* + H* ⇌ C2H2* + * -1.67 -0.53 0.21 -0.21 0.47 0.00C2H2* + H* ⇌ C2H3* + * -1.73 0.35 0.21 -0.21 0.47 0.00C2H3* + H* ⇌ C2H4* + * -1.73 0.35 0.21 -0.36 0.99 0.00C2H4* + H* ⇌ C2H5* + * -1.70 -0.25 0.24 -0.21 0.47 0.00C2H5* + H* ⇌ C2H6(g) + 2* -1.69 -0.52 0.09 -1.10 0.89 0.00
Carbon coupling
2 CH* ⇌ C2H2* + * -2.01 -0.60 0.15 -1.10 2.29 0.092 CH2* ⇌ C2H4* + * -2.01 -0.60 0.15 -1.01 1.26 0.072 CH3* ⇌ C2H6(g) + 2* -2.00 -0.87 0.00 -0.12 2.00 0.00
In Table S1, we list the scaling relations that we built for the reactions, based on reaction and
activation energies computed using the RPBE functional on the (111) terraces of Pt, Rh, Pd, Ni, Cu, Au
and Ag.2 The linear fit parameters, and , for the forward reaction energy and the activation barrier
are listed, along with the mean absolute error (MAE). For lack of available thermodynamic data, we
assumed the energy of hydrogenation of C2H* to be equal to the hydrogenation of C*, the hydrogenation
of C2H2* and C2H3* to be equal to the hydrogenation of CH*, and the hydrogenation of C2H4* to be
equal to the hydrogenation of CH2*.
Table S2: Comparison between calculated entropies and literature data, S°500K, in Jmol-1K-1
CH4 C2H6 C2H4 C2H2 H2
Calculated 197.4 239.2 230.6 212.2 153.9
NIST 207.0 262.4 246.2 226.6 145.7
In Table S2, we compare the standard entropy at 500 K, calculated with the formula
given in the main article, and the tabulated data in the database of the National Institute of
Standards and Technology (https://webbook.nist.gov/chemistry/). The mean absolute error is
14 J mol-1K-1.

S7
3. Steady state reaction rates and surface coverages
Figure S9: Steady state coverages (a) and volcano plots (b) in thermal catalytic NOCM at 500K and 0% conversion on the metal terraces (111).
Figure S10: Steady state coverages (a) and volcano plots (b) in catalytic NOCM at 500K and 0% conversion on the metal (111) terraces for vibrationally excited methane following a Boltzmann distribution at Tvib = 1500K.

S8
Figure S11: Steady state coverages (a) and volcano plots (b) in catalytic NOCM at 500K and 0% conversion on the metal (111) terraces with reactive plasma species, characteristic for a DBD plasma.On the x-axis, the binding energy ranges from -1 to 2 eV instead of -1 to 1 eV in previous figures, to show the shift to the weaker catalysts.

S9
4. Net rates of the elementary reactions in the model
Figure S12: Reaction rates (s-1) of every reaction in the model for thermal NOCM. If the net rate is positive it is shown in a full line, if the net rate is negative it is shown in a dashed line.

S10
Figure S13: Reaction rates (s-1) of every reaction in the model for NOCM with vibrationally excited methane. If the net rate is positive it is shown in a full line, if the net rate is negative it is shown in a dashed line.

S11
Figure S14: Reaction rates (s-1) of every reaction in the model for NOCM with plasma-generated radicals. If the net rate is positive it is shown in a full line, if the net rate is negative it is shown in a dashed line.

S12
5. Heat map for the effect of the vibrational temperature on the TOFs on metal (111) terraces
Figure S15: log(TOF) as a function of Tvib and Eb on the metal (111) terraces. Colors are assigned relative to the maximum TOF.
References(1) Wang, S.; Temel, B.; Shen, J.; Jones, G.; Grabow, L. C.; Studt, F.; Bligaard, T.; Abild-
Pedersen, F.; Christensen, C. H.; Nørskov, J. K. Catal. Letters 2011, 141 (3), 370.(2) Hummelshøj, J. S.; Abild-Pedersen, F.; Studt, F.; Bligaard, T.; Nørskov, J. K. Angew. Chemie
- Int. Ed. 2012, 51 (1), 272.


