
1
PREDICTORS OF ACADEMIC ACHIEVEMENT, SOCIAL ADJUSTMENT, AND INTENTION TO PERSIST: A BIOECOLOGICAL ANALYSIS OF COLLEGE RETENTION
By
KRISTI L. CORDELL-MCNULTY
A DISSERTATION PRESENTED TO THE GRADUATE SCHOOL OF THE UNIVERSITY OF FLORIDA IN PARTIAL FULFILLMENT
OF THE REQUIREMENTS FOR THE DEGREE OF DOCTOR OF PHILOSOPHY
UNIVERSITY OF FLORIDA
2009

2
© 2009 Kristi L. Cordell-McNulty

3
To Calvin, Hobbes, and Evan

4
ACKNOWLEDGMENTS
Because my research emphasizes social support and this dissertation tested a bioecological
model, I think it would be appropriate to organize my acknowledgments around my college,
peer, and family microsystems. First I would like to start with my college microsystem. None of
what I accomplished over the last four years would have been possible without the help of my
advisor, Dr. Patricia Ashton. She has shown me new ways to think and pushed me to grow
beyond my intellectual limits. I also want to thank Dr. James Algina for all his help with
statistics over the past four years and especially for his help with this dissertation. In addition I
want to thank Dr. Scott Miller and Dr. Julia Graber for all their encouragement over the last four
years. I also wish to thank Elaine Green for her guidance in getting through all the hoop jumping
that is part of grad school and her friendship over the last four years. Also in my college
microsystem, I want to thank all the friends I have made in the program, especially Tesia, Jenni,
and Michelle. Without them, there are times I think I might not have made it through.
In my peer microsystem, I want to thank my three best friends from home, Stacey,
Heather, and Dawn. They have been some of my biggest supporters. They have always been
there when I needed someone to talk to. In addition I want to thank my church family who has
also cheered me on, especially Beth and Randi who have always listened to me whine and
expressed their empathy as graduate students themselves. I also need to thank the countless
number of preschoolers I have come in contact with every Sunday morning. They have kept me
grounded, reminded me of the important things in life, and many times I have been humbled by
the wisdom of a preschooler.
In my family microsystem I have to thank my Mom and Dave, Jackie and Marvin, Pappy
Web and Grammy Cordell, and Grammy Fay and Pappy Bub. These individuals had the most
impact on me while growing up and without any of them, I would not have become the hard

5
working person I am today. I also owe most of my success to the support of my husband, Evan,
who put his dreams on hold to follow me across the country, not once, but twice. Finally I wish
to thank Calvin and Hobbes for their relentless support even though I forced them to adapt to
many new situations over the last few years. They truly loved me unconditionally.

6
TABLE OF CONTENTS page
ACKNOWLEDGMENTS ...............................................................................................................4
LIST OF TABLES ...........................................................................................................................9
LIST OF FIGURES .......................................................................................................................10
ABSTRACT ...................................................................................................................................11
CHAPTER
1 INTRODUCTION ..................................................................................................................13
Statement of the Problem ........................................................................................................13 Theoretical Background of the Study .....................................................................................13 Bronfenbrenner’s Bioecological Model .................................................................................18 Psychological Processes .........................................................................................................20
Identity .............................................................................................................................20 Achievement Goal Theory ..............................................................................................30 Perceived Academic Self-Efficacy ..................................................................................31
The Bioecological Systems.....................................................................................................34 The Family Microsystem .................................................................................................34
Parental involvement ................................................................................................34 Relatedness to parents ..............................................................................................37 Parental autonomy support .......................................................................................39
The Peer Microsystem .....................................................................................................42 The College Microsystem ................................................................................................45
Relatedness to on-campus friends ............................................................................45 Relatedness to instructors .........................................................................................46 Belonging on campus ...............................................................................................48 Extracurricular activities ..........................................................................................51
The Self-System ..............................................................................................................52 Personality ................................................................................................................53 Theory of intelligence ..............................................................................................55 Previous academic achievement ...............................................................................58
The Macrosystem ............................................................................................................59 Gender ......................................................................................................................60 Ethnicity ...................................................................................................................61 Socioeconomic status ...............................................................................................61
The Chronosystem ...........................................................................................................62 Purpose of the Study ...............................................................................................................63 Research Hypotheses ..............................................................................................................64 Theoretical Significance .........................................................................................................65 Practical Significance .............................................................................................................65

7
2 METHOD ...............................................................................................................................69
Participants .............................................................................................................................69 Instruments .............................................................................................................................69
Predictor Variables ..........................................................................................................69 Identity. ....................................................................................................................69 Goal orientation. .......................................................................................................71 Perceived academic self-efficacy. ............................................................................72 Parental involvement. ...............................................................................................73 Parental autonomy support. ......................................................................................74 Relatedness. ..............................................................................................................74 Sense of belonging on campus. ................................................................................75 Theory of intelligence. .............................................................................................75 Personality. ...............................................................................................................76 Socioeconomic status. ..............................................................................................77 Demographic information. .......................................................................................78
Outcome Variables ..........................................................................................................78 Social adjustment. ....................................................................................................78 Academic achievement. ...........................................................................................81 Intention to persist. ...................................................................................................81
Analyses ..................................................................................................................................81
3 RESULTS ...............................................................................................................................83
Descriptive Statistics ..............................................................................................................83 Analysis of the Proposed Model .............................................................................................83 Research Hypotheses ..............................................................................................................85
4 DISCUSSION .........................................................................................................................96
The Bioecological Systems.....................................................................................................96 The Family Microsytem ..................................................................................................96 The Peer Microsystem .....................................................................................................97 The College Microystem .................................................................................................97 The Self-System ..............................................................................................................99 The Macrosytem ............................................................................................................100
Psychological Process Variables ..........................................................................................101 Identity ...........................................................................................................................101 Achievement Goals .......................................................................................................101 Perceived Academic Self-Efficacy ................................................................................102
Outcome Variables ...............................................................................................................102 Limitations of the Study .......................................................................................................103 Implications of the Findings for Future Research ................................................................103 Conclusions...........................................................................................................................104
LIST OF REFERENCES .............................................................................................................106

8
BIOGRAPHICAL SKETCH .......................................................................................................118

9
LIST OF TABLES
Table page 1-1 Proposed relationships in the model ..................................................................................68
3-1 Demographic data ..............................................................................................................89
3-2 Means and standard deviations of variables ......................................................................90
3-3 Correlation matrix ..............................................................................................................91
3-4 Total, direct, and indirect effects in the revised model ......................................................93
3-5 Effects proposed in original model and effects in revised model ......................................95
10
LIST OF FIGURES
Figure page 1-1 Proposed Bioecological Model of College Student Retention ..........................................67

11
Abstract of Dissertation Presented to the Graduate School of the University of Florida in Partial Fulfillment of the Requirements for the Degree of Doctor of Philosophy
PREDICTORS OF ACADEMIC ACHIEVEMENT, SOCIAL ADJUSTMENT, AND
INTENTION TO PERSIST: A BIOECOLOGICAL ANALYSIS OF COLLEGE RETENTION
By
Kristi L. Cordell-McNulty
December 2009 Chair: Patricia Ashton Cochair: Scott Miller Major: Educational Psychology
Persistence of students to graduation from college is a major problem. Most studies of
college retention, however, focus on relatively few variables, and questions remain regarding
important predictors of retention. In this dissertation Bronfenbrenner and Morris’s (1998)
bioecological theory was used to create and test a model of predictors of retention from five
social contexts (the self-system, family, peers, school, and culture) that have been shown to
predict GPA, social adjustment, and intention to persist. The self-system includes personality,
identity, perceived academic self-efficacy, achievement goals, and theory of intelligence. The
family context includes parental involvement, feelings of relatedness to parents, and parents’
support of their children’s autonomy. The peer context includes relatedness to off-campus
friends, and the school context includes relatedness to instructor and, on-campus friends, sense of
belonging to the institution, and participation in extracurricular activities. The cultural context
includes gender and ethnicity.
Participants were 299 students from a southeastern university who completed a survey
online. Structural equation modeling was used to estimate the relationships in the model. Results
indicated that with the exception of off-campus friends in the peer context, significant

12
relationships to at least one of the outcome variables were found for every ecological context. In
the parent context, parents’ support of their children’s autonomy predicted social adjustment. In
the college context, sense of belonging and relatedness to on-campus friends had direct and
indirect relationships to social adjustment, and participation in extracurricular activities had a
direct relationship to social adjustment. In the self-system, entity beliefs had a direct and an
indirect relationship to GPA. Conscientiousness had an indirect relationship to intention to
persist, and high school achievement predicted social adjustment. In the social context, gender
predicted social adjustment with males more likely to be socially adjusted than females.
Ethnicity predicted GPA, with White and Asian students reporting higher GPAs. Of the process
variables, perceived academic self-efficacy had direct and indirect relationships to all three
outcome variables. Performance-avoid goals had negative direct and indirect relationships to
social adjustment and GPA. These findings offer ideas from multiple contexts that could be
useful in increasing college retention, especially if adopted simultaneously.

13
CHAPTER 1 INTRODUCTION
Statement of the Problem
The graduation rate of college students remains a serious national concern. A comparison
of students who entered a 4-year college in 1989 with those entering in 1995 showed that the rate
of completion of the bachelor’s degree within 5 years remained steady at about 53% (National
Center for Education Statistics, 2005b). More recently, only 56.4% of the students entering
college in Fall 2000 had graduated by Summer 2006 (National Center for Higher Education
Management Systems, 2007). These data show little improvement in the bachelor’s degree
graduation rate over the last two decades. In addition, 36.9% of all undergraduates were enrolled
in 2-year institutions in Fall 2005 (National Center for Education Statistics, 2007). Of the
students who entered a 2-year institutions in Fall 2002, only 32.5% graduated by Spring 2006
(National Center for Education Statistics, 2007). Failure of so many students to complete a
college degree in a timely fashion represents a significant economic loss to the nation and a
serious personal loss to students. The purpose of this study was to test a model of college success
and retention based on a bioecological perspective. This new bioecological systems model of
college retention focuses on the different ecological systems that predict college success and the
psychological processes that mediate the relationship between the different systems and college
success. In this chapter I describe the theoretical models and empirical research that provided the
basis for the variables that were included in the model.
Theoretical Background of the Study
The problem of college retention has prompted many research studies in the last 30 years.
Numerous studies have been completed, and several theories have been proposed. Many
variables have been linked with college retention. Tinto’s (1975, 1993) interactionalist theory is

14
one of the most widely researched theories of college retention. Tinto’s model postulates that
college student attrition needs to be examined as a longitudinal process of interactions between
the student and the academic and social realms of college. The first part of the model indicates
that students enter college with various personal characteristics that influence their decisions to
leave school without completing a degree. These personal characteristics include family
background, individual attributes, and pre-college schooling experiences that shape students’
commitment to the educational institution and educational goals. In Tinto’s model, goal
commitment refers to how determined students are to finish college and institutional commitment
refers to their determination to complete their degrees at the college where they are currently
enrolled. According to Tinto, these initial commitments affect the level of students’ integration
into the academic and social realms of the college. Academic integration consists of the
structural dimension, which refers to meeting the explicit standards of the university (i.e., GPA),
and the normative dimension, which refers to students’ identification with the norms of the
academic system. Social integration refers to the fit between the student and the social system of
the university, including interactions with peers and faculty. Tinto proposed that academic and
social integration along with initial institutional and goal commitment impact subsequent
institutional and goal commitment. The greater the amount of subsequent institutional and goal
commitment the more likely the student will persist in college (Tinto, 1975, 1993).
Recently Braxton, Sullivan, and Johnson (1997) presented revisions to Tinto’s (1975,
1993) theory. They argued that research has only partially supported Tinto’s theory, and research
on traditional residential colleges and commuter colleges has provided little empirical support for
Tinto’s theory. Braxton et al. examined further the empirical support for Tinto’s model. They
divided the model into 13 testable propositions. For example, the first proposition is “student

15
entry characteristics affect the level of initial commitment to the institution” (p. 112). Then
Braxton et al. examined peer reviewed studies of Tinto’s model to find empirical support for the
13 propositions. Of these 13 propositions they concluded that, for residential universities, strong
empirical support was evident for five of the propositions, but for commuter colleges strong
empirical support was evident for only two of the propositions. For residential colleges, the five
empirically supported propositions were “initial goal commitment affects the level of social
integration,” “the greater the level of social integration, the greater the level of subsequent
institutional commitment,” “initial institutional commitment affects the subsequent level of
institutional commitment,” “initial goal commitment affects the subsequent level of goal
commitment,” and “subsequent level of institutional commitment affects the level of persistence”
(p. 135). For commuter colleges, the two empirically supported propositions were “student entry
characteristics affect the level of initial commitment to the institution,” and “initial institutional
commitment affects the subsequent level of institutional commitment” (Braxton et al., 1997, p.
135; Braxton, Hirschy, & McClendon, 2004). On the basis of these findings, Braxton and
colleagues created two revised models of Tinto’s theory, one for residential colleges and one for
commuter colleges. In the residential college model, social integration is emphasized because of
the importance of social interaction and community as students are living on campus. At
commuter colleges, academic integration is emphasized because there is less opportunity for
social interaction at commuter colleges where most students are not on campus, other than for
class (Braxton & Hirschy, 2005).
Another prominent model in the college retention literature is Bean and Eaton’s (2000)
psychological model of college retention. Bean and Eaton contended that most college retention
models, including Tinto’s (1975, 1993), have emphasized sociological theories to explain why

16
students leave college. Bean and Eaton, in contrast, argued that leaving college is a behavior and
that behaviors are psychologically motivated; therefore, psychological theories can inform
retention models. Their model consists of eight parts: entry characteristics, environmental
interactions, psychological processes, psychological outcomes, intermediate outcomes, attitudes,
intention, and behavior. Entry characteristics consist of student variables such as past
performance, personality, motivations, skills, and abilities. Entry characteristics influence the
institutional environment, which includes environmental interactions, psychological processes,
psychological outcomes, and intermediate outcomes. Environmental interactions include
bureaucratic, academic, social, and external to the institution interactions. The environmental
interactions are expected to predict psychological processes, which in turn predict the
psychological outcomes. For example, according to the model when students make self-efficacy
judgments and assessments (psychological process), they will exhibit either positive or negative
perceived self-efficacy (psychological outcome). The psychological outcomes predict the
immediate outcomes of academic and social integration and academic performance. These
immediate outcomes then predict attitudes such as institutional fit and institutional commitment.
Attitudes predict intention, which in the retention model, is the intention to persist. Subsequently
intention predicts behavior, that is, persistence.
Neuville et al. (2007) compared Tinto’s (1975, 1993) model and a psychological process
model. Specifically they compared three structural equation models: a version of Tinto’s model,
an expectancy-value model, and a combined model of Tinto’s theory and expectancy-value. All
three models had the same outcome variables, academic performance and intention to persist,
and all three models had the same input variables: mother’s education, student’s high school
GPA during the last year of high school, and certainty of study choice; that is the students’

17
estimate of their certainty of their major and if they would continue in the same major if they did
not succeed academically. In addition, the Tinto model included academic and social integration
variables and institutional commitment and academic engagement; the expectancy-value model
included expectancy perceptions at time 1and time 2, value perceptions, and academic
engagement, and the integrative model included the variables from both models. Participants
were 2,637 first-year students at a university in Belgium. The researchers collected data during
the first weeks of the semester in September (Time 1) and again in November (Time 2). Results
indicated that the expectancy-value model was a significantly better fit than the other two
models. Within the expectancy-value model, certainty of study choice (β = .37, p < .001) was the
largest predictor of persistence followed by expectancy perceptions at Time 2 (β = .20, p < .001)
and value perceptions (β = .19, p < .001). High school grade (β = .21, p < .001) and expectancy
perceptions at Time 2 (β = .21, p < .001) were the strongest predictors of performance followed
by academic engagement (β = .10, p < .001), intention to persist (β = .09, p < .001), and mother’s
education (β = .08, p < .001). This study highlights the importance of motivational constructs in
predicting college success and retention and is one of the first studies to compare structural
models of motivational theory and Tinto’s theory. However, this study examined relatively few
variables and because of this limitation, their results may be spurious. I examined a more
comprehensive set of predictor variables of college retention.
In summary, the purpose of this dissertation was to identify variables that predict college
success and retention. Many studies have been conducted on this topic from a variety of
perspectives, each one focusing on relatively few variables. Several researchers have proposed
models to explain the relationships among these variables. Tinto's (1975, 1993) model has been
used widely for this purpose. More recently, noticing the lack of psychological processes in

18
Tinto's model, Bean and Eaton (2000) developed a model of college retention that focuses on
psychological processes and how these processes impact retention. In an effort to provide further
clarification of the variables related to college success and retention, the purpose of this study is
to use Bronfenbrenner's (1979, Bronfenbrenner & Morris, 1998) bioecological systems model as
a basis for a structural model that incorporates the models of Tinto and Bean and Eaton. This
new bioecological systems model of college retention focuses on the different ecological systems
that predict college students’ performance and persistence and the psychological processes that
mediate the relationship between the different systems and college success.
Bronfenbrenner’s Bioecological Model
Typically, only a few variables such as personality, previous academic achievement, and
socioeconomic status are included in studies of college retention and success, and consequently,
it is unclear whether findings are spurious because one or more critical variables have been left
out of the model. In this study I examined a more comprehensive set of variables that may be
predictive of college retention or success using Bronfenbrenner’s (1979; Bronfenbrenner &
Morris, 1998) bioecological model as a framework for identifying the most relevant variables to
include in the study.
Bronfenbrenner and Morris’s (1998) bioecological model focuses on the four components
of person, process, context, and time (PPCT) and the relationships among them. The person
component includes the unique characteristics of the individual. The context component includes
the environment in which development is occurring. The process component comprises the
interaction occurring between person and context components, and the time component includes
the time encompassed in the study. In this study I examined variables for each component of
Bronfenbrenner and Morris’s model.

19
In addition to the four components of person, process, context, and time, Bronfenbrenner
(1979; Bronfenbrenner & Morris, 1998) described spheres of environmental influences in his
theory: the microsystem, mesosystem, exosystem, macrosystem, and chronosystem. In this study
I have integrated the person, process, context, and time variables into the microsystem,
macrosystem, and chronosystems. The microsystem includes activities, roles, and relationships
that tend to occur on an everyday, face-to-face basis. The macrosystem includes overall patterns
of the society and culture. The chronosystem represents the relationship of time to the other
systems. In their later work, Bronfenbrenner and Morris also emphasized examining people’s
characteristics and how they influence the environment, which they referred to as the self-
system.
The focus of Bronfenbrenner and Morris’s (1998) bioecological theory on the multiple
contexts that influence development may offer a useful framework for identifying multiple
sources of influence on the retention of college student. In this study I examined the family
microsystem, through the process variables of parental involvement, parental autonomy support,
and parental relatedness; the peer microsystem through the process variable of off-campus friend
relatedness; the college microsystem was represented in the process variables of instructor
relatedness, on-campus friend relatedness, and sense of belonging on campus and the person
variable of extracurricular activities; the self-system was assessed through the person variables of
personality, and previous academic achievement, and the process variable of theory of
intelligence; the macrosystem was assessed through the context variables of gender, ethnicity,
and socioeconomic status, and the chronosystem, was assessed through the time variable of age.
In addition, I examined the psychological process variables of identity, academic self-efficacy,
and goal orientation as potential mediators between the systems and the outcome variables.

20
In my bioecological model of college retention (see Figure 1-1) the microsystems of
family, peers, college, and the self-system comprise the academic and social realms that Tinto
(1975, 1993) emphasized in his model. Following the microsystems in my model are the
psychological processes. These processes include identity, perceived academic self-efficacy, and
goal orientations. These variables were chosen because they were hypothesized as psychological
processes in Bean and Eaton’s (2000) model and because the literature supports the relationship
between these variables and college success. Next in the model are the two immediate outcomes
of the psychological process variables: academic achievement and social adjustment followed by
intention to persist. In the sections that follow, I focus on each of the psychological process
variables because they offer explanatory mechanisms that account for the relationships between
the bioecological systems and the outcome variables. Then I discuss each of Bronfenbrenner and
Morris’s bioecological systems.
Psychological Processes
Identity
According to Arnett (2006), most identity exploration occurs between the ages of 18 and
25 during the period he referred to as emerging adulthood, not during adolescence as popularly
believed. Arnett argued that in our society most identity exploration does not take place in
adolescence because children are still living under the supervision of their parents. During
emerging adulthood, however, most children leave home for the first time, often going to
college, and this relative independence typically allows for easier identity exploration.
Successful exploration is associated with positive life outcomes (Berzonsky & Kuk, 2000;
Luyckx, Goossens, Soenens, Beyers, & Vansteenkiste, 2005). For example, identity is positively
related to adjustment and negatively related to depressive symptoms and substance abuse in
college students (Luyckx, Goossens, Soenens, & Beyers, 2006, Luyckx, Soenens, Goossens, &

21
Vansteenkiste, 2007). Students who experience success in college and ultimately graduate are
likely to have a well established identity (Robinson, 2003).
Erikson (1968) conceived of identity as the crisis that characterizes the fifth stage of his
psychosocial stages of development: the identity versus role confusion stage. He defined identity
as
the awareness . . . that there is a self-sameness and continuity to the ego’s synthesizing methods, the style of one’s individuality, and that this style coincides with the sameness and continuity of one’s meaning for significant others in the immediate community. (p. 50)
In the identity versus role confusion stage, Erikson proposed that adolescents must seek out their
own ideological and occupational goals and through this exploration can either successfully
achieve an identity or experience a state of role confusion where they are unsure of their goals.
Elaborating on Erikson’s (1968) stage theory, Marcia (1993a) conceived of identity
formation along two dimensions, exploration and commitment. Exploration is the cognitive and
behavioral departure from a fixed occupational or ideological position to investigate other
possibilities, and commitment is the dedication to the new position or direction (Marcia, 1993b).
From his conception of identity formation along two dimensions, Marcia (1993a) described four
identity statuses: identity achievement, foreclosure, identity diffusion, and moratorium. Identity
achievement occurs when people make their own decisions about occupational and ideological
goals and are committed to pursuing their goals. People in the identity achievement status are
considered high on the exploration dimension because they have examined different alternatives
in coming to their decisions and because they have made a decision they are also considered high
on commitment. The foreclosure status is achieved when people have committed to occupational
and ideological goals without exploration. These goals are set by others, usually the parents,
instead of the individual. People in the foreclosure status are considered low on exploration
because they never engaged in their own search but high on the commitment dimension because

22
they have made a decision about their identity. Identity diffusion occurs when people have no
real ideological or occupational direction. People in identity diffusion are low on both
exploration and commitment because they have not engaged in an ideological or occupational
search and they have not made a commitment to any goals. Finally, people in the moratorium
status are experiencing an identity crisis. They are high on the exploration dimension because
they are currently searching for their own goals, but they are low on commitment because they
have not made a decision yet (Marcia, 1980, 1993b).
Recently Luyckx, Goossens, et al. (2006) used confirmatory factor analysis to test a four-
dimension model of identity formation. Participants were 565 freshmen from a large university
in Belgium. The researchers used the Utrecht-Groningen Identity Development Scale (U-GIDS;
Meeus & Dekovic, 1995) to assess Identification with Commitment and Exploration in Depth in
the ideological and interpersonal domains, and the Ego Identity Process Questionnaire (EIPQ;
Balistreri, Busch-Rossnagel, & Geisinger, 1995) to assess Commitment Making and Exploration
in Breadth in the ideological and interpersonal domains. The four dimensions are Commitment
Making, Identification with Commitment, Exploration in Depth, and Exploration in Breadth.
Commitment Making refers to whether people have made an actual identity commitment; in
contrast, Identification with Commitment refers to the extent people feel certain and confident
about their commitment. Exploration in Breadth refers to the extent which people have explored
different identity alternatives, and Exploration in Depth refers to the extent that people have
explored their current commitment in detail. Luyckx, Goossens, et al. found that the four-
dimension model of identity was a better fit to the data than the two- and three-dimension
models. They assessed academic and social adjustment using a shortened version of the Student
Adaptation to College Questionnaire (SACQ; Baker & Siryk, 1984), and they used the shortened

23
version of the Center for Epidemiologic Studies Depression Scale (CESD; Radloff, 1977) to
measure depressive symptoms. The results indicated that Commitment Making (r = .19, p <
.001) and Identification with Commitment (r = .38, p < .001) were positively related to social
adjustment. Commitment Making (r = .33, .p < .001) and Identification with Commitment (r =
.42, p < .001) were also related to academic adjustment. Commitment Making (r = -.25, p <
.001) and Identification with Commitment (r = -.34, p < .001) were negatively related to
depressive symptoms. Commitment Making was negatively related to substance use (r = -.12, p
< .001). Exploration in Depth was positively related to academic adjustment (r = .31, p < .001)
and negatively related to substance use (r = -.12, p < .01). Exploration in Breadth was positively
related to depressive symptoms (r = .20, p < .001) and substance use (r = .16, p < .001).
Exploration in Breadth could signal an identity crisis, which could explain the relationship with
depressive symptoms and substance use. In sum, Luyckx, Goossens, et al. indicated that the
identity dimensions of Commitment Making and Commitment with Identification have positive
relationships with social and academic adjustment and negative relationships with depression
and substance abuse. Of particular importance, their study expanded upon Marcia’s (1993a)
original conception of identity by separating identity into four dimensions, instead of the two
dimensions Marcia originally proposed. Having four dimensions instead of two allows for a
more thorough examination of identity development. However, it is unclear whether the results
of the Luyckx, Goossens, et al. study conducted with freshmen at a university in Belgium will
generalize to a predominantly female, upper-division, middle-class sample of American
university students.
In another study to refine the four-dimension conception of identity, Luyckx et al. (2005)
conducted a cluster analysis of the responses of 565 freshmen in educational psychology classes

24
in a university in Belgium to two identity measures: The U-GIDS (Meeus & Dekovic, 1995) was
used to assess Identification with Commitment and Exploration in Depth in the domains of
education and friendship, and the EIPQ (Balistreri et al., 1995) was used to assess Commitment
Making and Exploration in Breadth in the ideological and interpersonal domains. Academic and
social adjustment were assessed using a shortened version of the SACQ (Baker & Siryk, 1984).
The shortened version of the CESD (Radloff, 1977) was used to measure depressive symptoms.
The Rosenberg Self-Esteem Scale (RSES; Rosenberg, 1965) was used to measure self-esteem
and substance use was measured by asking participants if they had used drugs or drank too much
in the last 6 months. Using the four dimensions of identity, Exploration in Breadth, Exploration
in Depth, Commitment Making, and Identification with Commitment, Luyckx et al. concluded
that the data fit best into five clusters instead of the four Marcia (1993a) conceived. However,
four of these clusters were consistent with Marcia’s definition of the four identity statuses and
had similar relationships with criterion variables. Participants in the Achievement Cluster were
high in Exploration in Breadth and Commitment Making, which is consistent with Marcia’s
definition of Achievement. They were also high in Exploration in Depth and Identification with
Commitment. Participants in the Foreclosure Cluster were low in Exploration in Breadth and
high in Commitment Making, which is consistent with Marcia’s definition of Foreclosure. They
were also moderately high in both Identification with Commitment and Exploration in Depth.
Participants in Moratorium Cluster were high in Exploration in Breadth and low in Commitment
Making, which is consistent with Marcia’s definition of Moratorium. They were also low in
Identification with Commitment and moderately high in Exploration in Depth. Luyckx et al.
found that two types of clusters for Diffusion, which they identified as the Diffused Diffusion
Cluster and the Carefree Diffusion Cluster. Participants in the Diffused Diffusion Cluster were

25
low in Commitment Making and moderate in Exploration in Breadth. They were also low in
Identification with Commitment and Exploration in Depth. Students in the Carefree Diffusion
Cluster were moderate in Commitment Making and low in Exploration in Breadth. They were
also low in Exploration in Depth and low to moderate in Identification with Commitment.
Luyckx et al. found that for social adjustment, students in the Achievement (M = 3.83),
Foreclosure (M = 3.70), and Carefree Diffusion clusters (M = 3.62) scored high, whereas
students in the Moratorium (M = 3.59) and Diffused Diffusion clusters (M = 3.31) scored low on
social adjustment. For academic adjustment, students in the Achievement (M = 3.57) and
Foreclosure clusters (M = 3.45) scored high, whereas students in the Diffused Diffusion cluster
(M = 2.75) scored low. For depressive symptoms students in the Moratorium (M = 1.95) and
Diffused Diffusion clusters (M = 2.13) scored high. For self-esteem students in the Moratorium
(M = 2.89) and Diffused Diffusion clusters (M = 2.71) scored lowest. Students in the Moratorium
cluster also reported the most substance use (M = 2.01), whereas students in the Foreclosure
Cluster had the lowest amount of substance use (M = 1.69). All these means were significantly
different from each other. These findings suggest that experiencing the Moratorium or Diffused
Diffusion identity status may have a negative impact on college students. Like the Luyckx,
Goosens, et al. study (2006), it is unclear whether these results from a sample of first-year
predominantly female (85%) middle-class Cuscasian students at a university in Belgium are
generalizable to a predominantly female, middle-class sample of predominantly upper-division
American university students.
In a study of identity and academic outcomes, Berzonsky and Kuk (2000) examined how
identity status relates to the transition to college. Participants were 363 freshmen from a
medium-sized university in New York. The researchers measured identity status with the

26
Objective Measure of Ego Identity Status (OM-EIS; Adams, Shea, & Fitch, 1979) and used the
Student Developmental Task and Lifestyle Inventory (SDTLI; Winston & Miller, 1987) to assess
the extent to which students were prepared to adapt to college by measuring students’ academic
autonomy, mature interpersonal relationships, and educational purpose. Berzonsky and Kuk
found that students who were in the Achievement and Moratorium statuses were better prepared
to act autonomously in college without needing excessive reassurance from others. This finding
was replicated by Boyd, Hunt, Kandell, and Lucas (2003) with 2,818 first-year students at a large
east coast university who completed the Identity Styles Inventory (ISI; Berzonsky, 1992) and the
University New Student Census (UNSC). The UNSC asked students about their academic
expectations and retention. Boyd et al. determined that first-year college students with an
informative identity style (Achievement or Moratorium) were more likely to be prepared for
college. In particular, these students perceived themselves as prepared for college and were open
to learning new skills that might help them succeed in college. Thus, the positive relationship
between Moratorium and college adjustment in the Berzonsky and Kuk study and the Boyd et al.
study conflict with the Luyckx et al. (2005) finding that students in Moratorium experienced low
academic and social adjustment, raising the question of whether Moratorium is a positive
predictor of persistence and success in college. To explore this question further Luyckx et al.
(2008) created a new identity measure in an attempt to clarify the difference between positive
and negative exploration in the Moratorium stage. Specifically they proposed another dimension
of exploration called Ruminative Exploration as a potential explanation of the mixed findings in
the literature. They described Ruminative Exploration as occurring when people become stuck in
the exploration process mulling over different alternatives and having trouble making
commitments To study this new dimension Luyckx et al. created a new measure, the Dimensions

27
of Identity Development Scale (DIDS) to assess five identity dimensions, Commitment Making,
Identification with Commitment, Exploration in Breadth, Exploration in Depth, and Ruminative
Exploration. The researchers administered the DIDS to a sample of 263 freshmen at a university
in Belgium. The sample was 72.6% female with a mean age of 19.4. Confirmatory factor
analyses revealed that the five-factor model of identity was a significantly better fit than a four-
factor model of identity (df = 265, Satorra-Bentler scaled chi-square = 658.93, RMSEA = .07,
CFI = .94). A cluster analysis was conducted to capture the interactions of the identity statuses.
Six clusters emerged, including Achievement, Diffused Diffusion, Carefree Diffusion,
Ruminative Moratorium, Foreclosure, and Undifferentiated. The Achievement cluster scored
high on Commitment Making and Identification with Commitment, moderately high on
Exploration in Breadth and Exploration in Depth, and low on Ruminative Exploration. The
Diffused Diffusion cluster scored low on Commitment Making and Identification with
Commitment, intermediate on Exploration in Breadth and Exploration in Depth, and high on
Ruminative Exploration. The Carefree Diffusion cluster scored low on Commitment Making,
Identification with Commitment, Exploration in Breadth, and Exploration in Depth, and
intermediate on Ruminative Exploration. The Ruminative Exploration cluster scored low on
Commitment Making and Identification with Commitment, and high on Exploration in Breadth,
Exploration in Depth, and Ruminative Exploration. The Foreclosure cluster scored high on
Commitment Making and Identification with Commitment, and low on Exploration in Breadth,
Exploration in Depth, and Ruminative Exploration. The Undifferentiated cluster scored
intermediate on all dimensions except Exploration in Breadth, which was moderately high. Self-
esteem, depressive symptoms, anxiety symptoms, self-reflection, and self-rumination were also
assessed in this study. Self-esteem was assessed using the RSES (Rosenberg, 1965). Depressive

28
symptoms were assessed using 12 items of the CES-D (Radloff, 1977). Anxiety symptoms were
assessed using the revised Symptom Checklist (SCL-90-R; Arrindell & Ellema, 1986). Self-
reflection and self-rumination were assessed using the Rumination-Reflection Questionnaire
(RRQ; Trapnell & Campbell, 1999). For self-esteem, the Achievement (M = 3.30) and
Foreclosure clusters (M = 3.34) scored the highest and the Diffused Diffusion (M = 2.67) and
Ruminative Moratorium clusters (M = 2.52) scored the lowest. For depression symptoms, the
Achievement (M = 1.78), Foreclosure (M = 1.57), and Carefree Diffusion clusters (M = 1.81)
scored the lowest and the Diffused Diffusion (M = 2.35) and Ruminative Moratorium clusters (M
= 2.38) scored the highest. For anxiety symptoms, the Achievement (M = 2.02), Foreclosure (M
= 1.82), and Carefree Diffusion clusters (M = 1.69) scored the lowest and the Diffused Diffusion
(M =2.52) and Ruminative Moratorium clusters (M = 2.50) scored the highest. For self-
reflection, the Achievement (M = 3.81) and Ruminative Moratorium clusters (M = 3.69) scored
the highest and the Carefree Diffusion cluster (M = 3.26) scored the lowest. For self-rumination,
the Ruminative Moratorium (M = 4.02) and Diffused Diffusion clusters (M = 3.76) scored the
highest and the Achievement (M = 3.37), Carefree Diffusion (M = 3.30), and Foreclosure
clusters (M = 3.01) scored the lowest. All these means were significantly different from each
other. From these data, Luyckx et al. concluded that commitment is what separates successful
from unsuccessful identity development because the Achievement and Foreclosure clusters both
scored high on both dimensions of identity and they were the most adaptive clusters. Therefore
in my study I only examined the commitment dimensions and their relationships to academic
achievement and social adjustment.
Robinson (2003) examined whether identity mediated the relationship between academic
integration and both short- and long-term persistence in college in a sample of 212 undergraduate

29
students. Robinson defined academic integration as the students’ perception of their academic
performance and intellectual development, and social integration as the quality of students’
relationships with both their peers and faculty and used the Institutional Integration Scale
(Pascarella & Terenzini, 1980) to measure academic and social integration. Robinson measured
identity with the identity subscale of the Ego Development Scale (Ochse & Plug, 1986), and
short-term persistence by the Persistence at the Institution (PAI) and long-term persistence by the
Persistence in Higher Education (PHE) subscales of the Undergraduate Persistence Intention
Measure (UPI; Robinson, 1996). The results indicated that identity did mediate the relationship
between academic integration and short-term persistence. Identity was the only variable that
predicted long-term persistence in college (β = .31, p = .05). Academic integration did not
predict long-term persistence in college, suggesting that identity may become more important for
academic success as students progress through college. African American students were
overrepresented in this sample (35%) because some of the students were recruited from a Black
studies course, and these results may not generalize to all college populations. This study
indicates that identity does predict college success and persistence, though its exact role remains
unclear because Robinson did not measure identity with the more discriminating dimensions of
Commitment Making and Identification with Commitment.
I examined if identity, as measured by Commitment Making and Identification with
Commitment, predicts academic achievement, social adjustment, and intention to persist in
college students. Studies have linked identity, in particular Commitment Making and
Identification with Commitment, to academic adjustment (Luyckx et al., 2005; Luyckx,
Goossens, et al., 2006), and to social adjustment (Luyckx et al., 2005; Luyckx, Goossens, et al.,
2006). One study has also linked identity with persistence (Robinson, 2003). Because previous

30
research has established a link between identity and adjustment, I hypothesized that identity is
positively related to social and academic achievement in my model. On the basis of Robinson’s
study, I also hypothesized that identity predicts persistence in college students.
Achievement Goal Theory
Achievement goal theory is comprised of two main types of goals: mastery goals, also
referred to as learning goals, and performance goals. Mastery goals focus on learning the task for
self-improvement, meeting a challenge, or gaining new understanding and insight. Performance
goals focus on demonstrating ability or competence, especially relative to others, such as
receiving the highest grade or being the best in the class. Performance goals are often divided
into two types, approach and avoidance. Performance-approach goals focus on demonstrating
competence and outperforming others. Performance-avoid goals focus on trying to avoid looking
incompetent (Schunk, Pintrich, & Meece, 2008). Dweck (1999) has reported positive effects of
mastery goals on learning in experimental studies, and Schunk et al. described studies that have
shown relationships between students’ mastery goals and their self-reports of use of self-
regulatory learning strategies in education from elementary school through college.
At the college level, Hsieh, Sullivan, and Guerra (2007) examined the relationship of goal
orientation and perceived self-efficacy to GPA. Participants were 112 undergraduates from a
large university in the southwest that serves predominantly Hispanic students. Forty-six percent
of the sample was Hispanic, and 41% was Caucasian. Goal orientation was measured using the
Achievement Goal Orientation Inventory (Elliot & Church, 1997). Performance-avoid and
mastery goals were the strongest predictors of GPA. Performance-avoid goals were negatively
related to GPA (r = -.35, p < .01) and mastery goals were positively related to GPA (r = .40, p <
.01); however, performance-approach goals were not related to GPA. This study suggests that
mastery goals may be important to academic success in college. Students with mastery goals

31
were more likely to succeed academically; however, further research is needed. As the study was
correlational, the direction of the relationship is unclear, and Hsieh et al. did not control for prior
ability. To explore further the relationship between mastery goals on the basis of the results of
Hsieh et al., in my model I hypothesized that mastery goals predict academic achievement and
performance-avoid goals are negatively related to academic achievement.
Although I found no study that has examined the relationship of achievement goals to
college persistence or social adjustment, Bean and Eaton (2000) hypothesized in their model that
the psychological processes affect both academic and social integration. On this basis, I
hypothesized that mastery goals predict social adjustment and performance-avoid goals predict
social adjustment.
Perceived Academic Self-Efficacy
Perceived self-efficacy is defined as the extent to which one feels confident to perform a
task (Bandura, 1997; Gaskill & Woolfolk Hoy, 2002). Perceived academic self-efficacy is the
belief in one’s ability to successfully perform academic tasks. Many studies have shown that
students with strong academic self-efficacy beliefs display higher levels of motivation and skills
and earn higher grades than students with weaker levels of perceived academic self-efficacy
(Schunk et al., 2008). Experimental research has shown that raising perceptions of self-efficacy
increases students’ perseverance and achievement (Bandura, 1997). In their meta-analysis of the
relationship of self-efficacy beliefs to academic outcomes, Multon, Brown, and Lent (1991)
found that students’ perceived self-efficacy was related to their academic performance at all
educational levels, but the relationship was strongest for college students (r = .35).
In a study examining predictors of college performance, Elias and MacDonald (2007)
examined the effects of prior achievement and perceived academic self-efficacy on college
achievement in 202 undergraduates, using the Academic Self-Efficacy Scale (ASES; Elias &

32
Loomis, 2000). Results indicated that both academic self-efficacy and high school GPA
predicted college GPA, but their regression analysis showed that perceived academic self-
efficacy accounted for a greater proportion of variance in college GPA than did high school
GPA. In a meta-analysis of 109 studies examining psychosocial and study skill factors and their
relationship to college outcomes, Robbins, Lauver, Le, Davis, Langley, and Carlstrom (2004)
found that perceived academic self-efficacy predicted retention (true score correlation = .36) and
GPA (true score correlation = .50). In another study of 364 college students, Bembenutty (2007)
found that perceived academic self-efficacy was significantly correlated with course grades for
Caucasian males (r = .62), Caucasian females (r = .62), minority males (r = .51) and minority
females (r = .75). Perceived academic self-efficacy was measured using the academic self-
efficacy subscale of the Motivated Strategies for Learning Questionnaire (MSLQ; Pintrich,
Smith, Garcia, & McKeachie, 1991). In sum, these three studies all indicate that perceived
academic self-efficacy predicts GPA.
Perceived self-efficacy has also been linked to social outcomes in college. DeWitz and
Walsh (2002) examined the relationship between college satisfaction and perceived self-efficacy
in 312 undergraduates from a large Midwestern university using the College Self-Efficacy
Inventory (CSEI; Solberg, O’Brien, Villareal, Kennel, & Davis, 1993). The CSEI measures
perceived self-efficacy in various areas of college life including courses and roommates. College
satisfaction was measured using the College Student Satisfaction Questionnaire, Form D (CSSQ;
Betz, Betz, & Menne, 1989). One of the subscales of the CSSQ is social life, which measures the
perception of one’s social network and whether there are opportunities to interact socially.
Results indicated that perceived college self-efficacy was related to overall college satisfaction (β
= .48). An ANOVA comparing high- and low self-efficacy groups indicated a significant

33
difference in overall college satisfaction between the low- and high- self-efficacy groups (F =
43.91, p < .0001). A MANOVA was conducted comparing the high and low self-efficacy groups
on the five subscales. For the social life subscale, there was a significant difference between the
high and low groups, indicating that students with higher perceived self-efficacy for college had
higher social life satisfaction (F = 30.41, p < .0001). A possible interpretation of this finding is
that students with high perceived academic self-efficacy are likely to be more successful in
academics and therefore less stressed, so they were more likely to enjoy their social life than
students’ with low perceived self-efficacy. However, it is also possible that students’ with higher
life satisfaction may have higher perceived self-efficacy due to their positive feelings about their
social life.
In relation to other types of motivation, perceived self-efficacy has been linked to goal
orientations. At the college level, Hsieh et al. (2007) examined the relationship of goal
orientation and self-efficacy on GPA. Participants were 112 undergraduates from a large
university in the southwest that predominantly serves Hispanic students. Forty-six percent of the
sample was Hispanic and 41% was Caucasian. Goal orientation was measured using the
Achievement Goal Orientation Inventory (Elliot & Church, 1997). Perceived academic self-
efficacy was measured using items from the Patterns of Adaptive Learning Survey (PALS;
Midgley, Maehr, & Urdan, 1993). The results showed that students with higher perceived self-
efficacy reported significantly more mastery goals than students with lower perceived self-
efficacy (F = 13.16, p < .001). There was no significant difference in the number of
performance-approach and performance-avoid goals for students for students with high and low
perceived academic self-efficacy.

34
In sum, perceived academic self-efficacy has been linked with academic achievement
(Bembenutty, 2007; Elias & MacDonald, 2007; Multon et al., 1991; Robbins et al., 2004),
retention (Robbins et al., 2004), and social adjustment (DeWitz & Walsh, 2002), and mastery
goals (Hsieh et al., 2007). On the basis of those findings, I hypothesized in my model that
perceived academic self-efficacy predicts mastery goals, academic achievement, social
adjustment, and intention to persist.
The Bioecological Systems
The Family Microsystem
Within the family microsystem, the process variables of parental involvement, parental
autonomy support, and parental relatedness were examined. The research evidence indicates that
each of these variables has been linked to one or more of the outcome variables of academic
achievement, social adjustment, and intention to persist. In the following sections, each variable
is reviewed separately, and any research that connects the family microsystem variables to any of
the psychological processes variables is also discussed.
Parental involvement
Grolnick (2003) defined parental involvement as “the provision of resources by the parent for
the child” (p. 16). Many studies have shown the relationship of parental involvement to students’
school success in elementary and secondary schools (see Hoover-Dempsey & Sandler, 1995, for
a review of this literature). It is likely that parents can and do play a role in whether their children
persist to graduate from college. Recent research on parental involvement during the college
years suggests that it may reduce the rate of attrition among college students. Researchers have
reported relationships between parental involvement in college and their students’ educational
aspirations (McCarron & Inkelas, 2006), college choice (Bers, 2005), self-regulation (Hofer,
Kennedy, & Hurd, 2006), academic and emotional adjustment (Duchesne, Ratelle, Larose, &

35
Guay, 2007), achievement, autonomy, competence, and relatedness (Ratelle, Larose, Guay, &
Senécal, 2005), and perceived self-efficacy (Cordell-McNulty & Ashton, 2006).
In a study of parental involvement at the college level, Ratelle, Larose, Guay, and Senécal
(2005) investigated a mediational model in which college students’ perceptions of parental
involvement predicted persistence in a science curriculum by fostering the self-processes of
autonomy, competence, and relatedness. Participants were recruited during their last year of high
school in Quebec, Canada. The data were analyzed for the 262 participants who had completed
all measures. Parental involvement was measured by assessing students’ perceptions of their
parents’ involvement in their vocational decision-making process using a scale adapted from
Barnes and Olson (1992). The researchers measured science achievement by the students’ self-
reports of their high school science grades and persistence in a science program by checking to
see if students were still enrolled in a science program during their third year of college. The
results showed that students’ perceptions of their parents’ involvement were positively
associated with science achievement (r = .14, p < .05), but perceived parental involvement was
not a predictor of persistence in the science program. Students’ perceptions of parental
involvement were positively associated with their autonomy (r = .34, p < .001), competence (r =
.24, p < .001), and relatedness (r = .28, p < .001). Analysis of the authors’ mediation model
showed that students’ perceptions of parental involvement predicted their feelings of relatedness
(β = .31, p < .05) and autonomy in the science program (β = .22, p < .05). On the basis of these
findings, the authors proposed that perceived parental involvement predicts student self-
processes but not persistence, which was an outcome of the self-processes. This study shows that
perceived parental involvement was related to science achievement; however a major weakness
of this study is that the authors analyzed students’ grades in high school, not in college. I

36
investigated whether parental involvement predicts college achievement. Another weakness of
this study is that a large percentage (71%) of the sample of college students lived at home with
their parents. It is possible that parental involvement had a significant relationship to students’
science achievement because many of these participants lived with their parents. It is unclear
whether the findings generalize to college samples where most of the students do not live with
their parents. I examined a sample of university undergraduates with only a small percentage
who live at home with their parents.
In regard to perceived academic self-efficacy, in a study of 346 students at a state
university in the Northeast, Cordell-McNulty and Ashton (2006) found a positive relationship
between parental involvement in college and perceived academic self-efficacy using the self-
efficacy subscale of the Motivated Strategies for Learning Questionnaire (MSLQ; Pintrich et al.,
1991). Perceptions of parental involvement was measured by questions from the student survey
of the High School and Family Partnership (Epstein, Connors, & Salinas, 1993) that were
adapted to measure aspects of college students’ perceptions of parental involvement. Students
who knew their parents had expectations for them (t = 3.41, p = .001) and received praise from
their parents (t = 3.39, p = .001) were more likely to have higher perceived academic self-
efficacy. Byars-Winston and Fouad (2008) examined the relationship between students’
perceptions of their parents’ involvement and students’ perceived self-efficacy in math and
science using the Math/Science Self-Efficacy Scale (Smith & Fouad, 1999) and the Parental
Involvement Scale (Ferry, Fouad, & Smith, 2000), which measured students’ perceptions of
parental encouragement and expectations for math, science, and career choices. Participants were
227 undergraduates from two Midwestern universities. Results indicated that students’

37
perceptions of their parents’ involvement directly predicted perceived mathematics and science
self-efficacy (β = .13).
On the basis of these studies showing that parental involvement is related to perceived
academic self-efficacy in college students (Byars-Winston & Fouad, 2008; Cordell-McNulty &
Ashton, 2006) and academic achievement (Ratelle et al., 2005), I hypothesized in my model that
parental involvement predicts perceived academic self-efficacy and academic achievement.
Relatedness to parents
Relatedness refers to the human need to feel connected to others and involves loving and
caring for others and being loved and cared for by others and is one of the three basic
psychological needs according to self-determination theory (Deci & Ryan, 2000). Relatedness is
sometimes called belongingness and, more recently in the counseling literature, mattering to
others. Baumeister and Leary (1995) described the belongingness hypothesis as human beings
having a pervasive drive to form and maintain at least a minimum quality of lasting, positive, and
significant interpersonal relationships.
Research has shown that a lack of relatedness, belongingness, or mattering to others
predicts negative psychological outcomes. Baumeister and Leary (1995) reviewed a wide range
of research showing that being rejected, ignored, or excluded, that is experiencing a lack of
relatedness, is associated with strong negative feelings such as depression and anxiety. The
absence of mattering, a counseling term for relatedness (Dixon Rayle, 2006), has also been
linked to higher levels of depression and academic stress (Dixon Rayle & Chung, 2007).
Cutrona, Cole, Colangelo, Assouline, and Russell (1994) examined whether parental
social support predicted GPA for undergraduates. They conducted three studies. In the first study
participants were 418 undergraduates at a Midwestern university. Parental social support was
measured using the Social Provisions Scale Parent Version (SPS-P; Cutrona, 1989; Cutrona &

38
Russell, 1987). Causal modeling showed that parental social support predicted college GPA (β =
.19, p < .01). In the second study participants were 378 undergraduates from a Midwestern
university. For this study the entire Social Provisions Scale (SPS-SS) was administered to assess
social support from parents, friends, and romantic partners. Once again, parental social support
predicted GPA (β = .14, p < .05), but social support from friends and romantic partners did not.
These studies are unique in that they measure perceptions of parental support during college and
GPA during college. On the basis of these findings, I examined whether relatedness to parents
predicts academic achievement in college students.
In relation to identity formation, Luyckx, Goossens, et al. (2006) analyzed students’
perceptions of supportive parenting and identity with 565 freshmen at a University in Belgium.
The authors assessed supportive parenting by assessing emotional separation from parents using
a shortened version of the Psychological Separation Inventory (PSI; Hoffman, 1984). The sample
consisted of Belgian college students who were predominantly Caucasian and over 85% female.
They reported that among college students emotional separation from their parents was
negatively related to Commitment Making (β = -.17, p < .01) and Exploration in Depth (β = -.19,
p < .001), indicating that college students who experienced relatedness to parents were more like
to make an identity commitment and seek out information about that commitment. As mentioned
earlier, the major concern about this study is whether the results generalize to U.S. students. The
results from Luyckx, Goossens, et al. indicate a relationship between parental relatedness and
identity formation, in particular that parental relatedness is positively related to Commitment
Making.
In relation to goal theory, Moller, Elliot, and Friedman (2008) examined the relationship
between achievement goals and parental closeness. Two studies were conducted, one examining
39
parental closeness after an exam and prior to receiving feedback, and one after receiving
feedback. Participants in the first study were 182 undergraduates. The researchers measured
achievement goals using the Achievement Goal Questionnaire (Pekrun, Elliot, & Maier, 2006)
and perceived closeness to parents with a measure created by McGregor and Elliot (2005). This
measure consisted of two questions, “Right now, how close do you feel to your mother/father?”
Results indicated that mastery-approach goals were positive predictors of perceived closeness to
parents after taking the exam (β = .19, p < .01). Participants in the second study were 227
undergraduates. The only difference in Study 2 was that perceptions of closeness to parents was
measured again after students received a grade for the exam. Results indicated that students with
mastery-approach goals reported feeling closer to their parents after receiving feedback (β = .10,
p < .05). For students with performance-avoid goals, feelings of closeness to their parents
depended on performance outcomes. However, the direction of causality of this relationship
cannot be determined from this study. I hypothesized that parental relatedness predicts students’
tendency to form mastery goals because if students feel close to their parents they are less
worried about impressing them and are more likely to focus on learning for understanding.
In summary, research has linked relatedness to parents with Commitment Making
(Luyckx, Goossens, et al., 2006), mastery goals (Moller et al., 2008), and academic achievement
(Cutrona et al., 1994). On the basis of these studies, I hypothesized in my model that relatedness
to parents predicts Commitment Making, mastery goals, and academic achievement.
Parental autonomy support
Need for autonomy, defined as the desire to have agreement between one’s actions and
experiences and one’s sense of self, is one of the three basic psychological needs postulated in
self-determination theory (SDT) (Deci & Ryan, 2000). Research has shown that children whose
parents provide autonomy support, that is, who support their children’s need for autonomy, tend

40
to be more self-regulated and have higher academic achievement than children whose parents
provide less support of their autonomy (Grolnick, 2003). Ratelle et al. (2005) examined the
relationship between parental autonomy support and their college students’ persistence in a
science program. The researchers measured parental autonomy support by assessing students’
perceptions of their parents’ autonomy support in relation to their decision to pursue science
studies in college. Items were adapted from Paulson, Marchant, and Rothlisberg (1994) and
Robinson et al. (1995). A sample item is “my parents allowed me to have my own point of view
regarding my choice of program.” Ratelle et al. found that parental autonomy support was
positively associated with students’ science achievement (r = .20, p < .01) and that parental
autonomy support predicted persistence in the college science program 2 years later (β = .20, p <
.05). A weakness of this study is that the researchers only assessed science achievement in high
school, not in college. I will examine parental autonomy support during college to see if it
predicts college achievement.
In a more recent examination of the conceptualization of parental autonomy support,
Soenens et al. (2007) completed two studies and found that parental autonomy support,
conceptualized as promotion of volitional functioning, predicted psychological adjustment in
college students. Participants in the first study were 390 first-year students at a Belgian
university. Parental autonomy support was measured using items from the Autonomy Support
scale of the Perceptions of Parents Scale (POPS; Grolnick, Ryan, & Deci, 1991) and one item
from Silk, Morris, Kanaya, and Steinberg (2003). Psychosocial functioning was assessed by
examining three constructs: depression, self-esteem, and social well-being. Depression was
measured using the CES-D (Radloff, 1977). Self-esteem was measured using the RSES
(Rosenberg, 1965), and social well-being was measured using the Social Well-Being scale from

41
the Louvain Well-Being Scale (Marcoen, Van Cotthem, Billiet, & Beyers, 2002). The results of
this study indicated that parental autonomy support predicted psychosocial functioning (β = .05,
p < .05). In their second study the researchers studied 495 undergraduates from a Belgian
university using the same measures except that they measured social well-being using the Social
Adjustment subscale of the SACQ (Baker & Siryk, 1984). This study confirmed the results from
the first study. Parental autonomy support predicted psychosocial functioning (β = .34, p < .001).
However, most Belgian college students live at home; therefore, these students have frequent
contact with their parents. It is unclear whether these results will generalize to college students in
the U.S. who do not live at home. In contrast, I examined whether the relationship of parental
autonomy support to college achievement, social adjustment, and intention to persist is evident in
a sample of students who typically do not live at home.
In relation to identity, Luyckx, Goossens, et al. (2006) analyzed identity and supportive
parenting with 565 freshmen at a university in Belgium by measuring parental responsiveness,
autonomy support, and psychological control. Parental responsiveness items were from the Child
Report on Parent Behavior for Older Children and Adolescents (CRPBI -30; Schludermann &
Schludermann, 1988). Psychological control items were from the Parental Psychological Control
Scale—Youth Self-Report (PCS—YSR; Barber, 1996). Autonomy support items were from the
Perceptions of Parents Scales (POPS; Grolnick et al., 1991). The researchers found a positive
relationship between a supportive parent-child relationship and Commitment Making (β = .16, p
< .01) and Identification with Commitment (β = .21, p < .001). In another study Luyckx,
Soenens, Vansteenkiste, et al. (2007) examined the relationship of parental psychological control
to identity formation in college students. Parental psychological control is generally considered
to be the opposite of parental autonomy support and an inhibitor of autonomy in adolescents. The
42
researchers conducted a longitudinal study with 565 Belgian undergraduates using the Utrecht-
Groningen Identity Development Scale (U-GIDS; Meeus & Dekovic, 1995) to measure
Identification with Commitment and Exploration in Depth and the Ego Identity Process
Questionnaire (EIPQ; Balistreri et al., 1995) to measure Commitment Making and Exploration in
Breadth. Parental psychological control was measured using the Psychological Control Scale—
Youth Self-Report (Barber, 1996). Students were assessed on these measures five times, with 6
months between each data collection. Luyckx, Soenens, Vansteenkiste, et al. found that parental
psychological control was associated with less Commitment Making (β = -.10, p < .05) and less
Identification with Commitment (β = -.12, p < .05), suggesting that parental autonomy support
should be associated with more Commitment Making and Identification with Commitment.
However, the results of Luyckx, Goossens, et al. and Luyckx, Soenens, Vansteenkiste, et al. may
not be generalize to other populations. The participants in these studies were all Caucasian
Belgian university students. I examined whether these results generalize to a sample of U.S.
college students.
In summary, research has linked parental autonomy support with Commitment Making
and Identification with Commitment (Luyckx, Goossens, et al., 2006; Luyckx, Soenens,
Vansteenkiste, et al., 2007), academic achievement (Ratelle et al., 2005), social adjustment
(Soenens et al., 2007), and persistence (Ratelle et al., 2005). In my model, I hypothesized that
parental autonomy support is positively related to Commitment Making, Identification with
Commitment, academic achievement, social adjustment, and intention to persist.
The Peer Microsystem
Peers play an important role in the lives of adults during emerging adulthood (Arnett,
2000, 2006). Because of the potential role of peers in this period, I examined the peer
microsystem. The peer microsystem consists of the process variable of off-campus friend

43
relatedness. The research evidence indicates that peer relatedness has been linked to identity
development and social adjustment.
Peer relationships tend to become more important as students age through adolescence
and emerging adulthood, and it is likely that peer relationships play an important role in the lives
of most college students. In her study of college outcomes, Fischer (2007) used data from the
National Longitudinal Survey of Freshmen. Equal numbers of White, Black, Hispanic, and Asian
students were sampled from each college resulting in a total of 3,924 participants. Outcome
variables for this study were college GPA and whether students left their initial college by the
end of their junior year. Fischer found that, for minority students, greater involvement in formal
social activities as measured by extracurricular activities and volunteering was related to higher
grades (β = .08, p < .05 for Asian students, β = .17, p < .001 for Hispanic students, and β = .11, p
< .01 for Black students), but for Black and White students, having more ties off campus,
measured by the number of visits home and how many friends the student frequently contacted
off campus, was negatively related to their grades (β = -.15, p < .05 for Black students and β = -
.14, p < .10 for White students). For all ethnic groups, a strong relationship between relatedness
to peers and college retention was found. However, the direction of the relationship differed for
on-campus and off-campus friends. As scores for informal ties on-campus increased, measured
by the number of close on-campus friends, hours spent partying per week, and hours spent with
friends per week, the likelihood that students would leave college decreased (β = -.89, p < .05 for
White students, β = -1.65, p < .001 for Asian students, β = -1.56, p < .01 for Hispanic students,
and β = -1.20, p < .01 for Black students). Off-campus ties however, were related to a greater
probability of leaving college for Black (β = 1.26, p < .05) and White students (β = 1.43, p <
.05). These findings suggest that for college students the relationship of peer relatedness to

44
academic achievement and persistence may differ for on-campus and off-campus friends, so I
examined relatedness to both off-campus and on-campus friends.
In a study of the importance of friends, Buote et al. (2007) examined the relationship
between friendship and adjustment during the first year of college in 702 first-year students from
six different Canadian universities. The SACQ (Baker & Siryk, 1984) was used to measure
adjustment, and the McGill Friendship Questionnaire Friend’s Functions (MFQ-FF, short form;
Mendelson & Aboud, 1999) was used to measure friendship. The MFQ-FF measures six
functions of friendship in reference to a particular friend: stimulating companionship, help,
intimacy, reliable alliance, self-validation, and emotional security. Buote et al. found that overall
friendship quality predicted all forms of university adjustment, academic (t= 4.32, p < .001),
social (t= 15.53, p < .001), and institutional attachment (t= 10.95, p < .001). In a study examining
social support and adjustment of 115 first-year undergraduates at a midsized Canadian
university, Friedlander, Reid, Shupak, and Cribbie (2007) examined the relationship between
social support from friends and adjustment to college. Data were collected during their first and
second semesters. Social support from friends was assessed using the Multidimensional Scale of
Perceived Social Support (MSPSS; Zimet, Dahlem, Zimet, & Farley, 1988). Adjustment was
measured using the SACQ (Barker & Siryk, 1989). From the fall to spring semester, increased
social support from friends predicted improved overall adjustment (β = .19, p < .05), social
adjustment (β = .20, p < .05), and personal-emotional adjustment (β = .19, p < .05). The results
of these two studies (Buote et al., 2007; Friedlander et al., 2007) illustrate the positive
relationship between friends and adjustment, but neither study examined if relatedness to peers is
related to academic achievement or intention to persist.

45
In summary, research has linked relatedness to off-campus friends with social adjustment
(Buote et al., 2007; Friedlander et al., 2007). On the basis of these studies, I hypothesized that
relatedness to off-campus friends predicts social adjustment in my model.
The College Microsystem
The college environment is likely to play an important role in the success of college
students. The college microsystem is a part of social integration in Tinto’s (1975) model. The
college microsystem includes the process variables of relatedness to instructor, relatedness to on-
campus friends, and belonging on campus, and the person variable of extracurricular activities.
The research evidence indicates that each of these variables has been linked to one or more of the
outcome variables of academic achievement, social adjustment, and intention to persist. Each
variable is reviewed separately, and research that connects the college microsystem variables to
any of the psychological processes variables is also discussed.
Relatedness to on-campus friends
As mentioned earlier in the section on peer relatedness, college students tend to interact
with on-campus and off-campus peers. In particular, Fischer (2007) in her study of data from the
National Longitudinal Survey of Freshmen obtained results suggesting that on- and off-campus
friendships with peers may differ in their relationships to students’ grades and retention. For
Black and White students, having more ties off-campus was negatively related to their grades
and retention, and, for all ethnic groups, having more informal ties on campus was related to
retention. Because of the different relationships between relatedness to on- and off-campus
friends and the outcome variables of academic achievement, social adjustment, and intention to
persist in college, I examined relationships with relatedness to on-campus friend separately from
relatedness to off-campus friends to see if differences exist in my analysis. Because informal on-
campus ties have been related to persistence (Fischer, 2007), in my model I hypothesized that

46
relatedness to on-campus friends predicts intention to persist. I also predicted that on-campus
relatedness to friends is related to social adjustment because of the research mentioned earlier in
the section on off-campus friends linking friends to social adjustment (Buote et al., 2007;
Friedlander et al., 2007). I also hypothesized that relatedness to on-campus friends predicts social
adjustment and intention to persist.
Relatedness to instructors
Teacher-student relationships have always been an important research topic in elementary
and secondary education. Instructor-student relationships have not been as thoroughly researched
at the college level. Some researchers have examined students’ relatedness to their instructor and
found positive relationships. Larose, Tarabulsy, and Cyrenne (2005) examined relatedness as a
moderating factor in mentoring relationships and student adjustment for 40 first-year college
students. Participants were 40 students from a private college who were identified as at-risk on
the basis of low grades in high school. The mean age of the participants was 18.6 years, and 72%
were female. All participants received 10 hours of mentoring from an instructor. Before
beginning the mentoring program participants’ social adjustment was assessed with the SACQ
(Baker & Siryk, 1984) to measure adjustment. After completing the 10-hour mentoring program,
participants completed an adapted version of the Inventory of Parent and Peer Attachment
(IPPA; Armsden & Greenberg, 1987), a measure of their perceived relatedness to their mentor.
Five months after completing the mentoring program, the SACQ was re-administered to
participants. The results showed that students with high relatedness with their mentors had better
social adjustment and institutional attachment compared to students with low relatedness and
students who did not go through the mentoring program. Those students who had low relatedness
were less well-adjusted to college and received lower grades. The researchers found that students
with high relatedness reported better social adjustment and institutional attachment. Students

47
with low relatedness reported worse academic and emotional adjustment. Larose et al.
highlighted the potential positive effects of students’ relatedness to their instructor; however,
they assessed relatedness to mentors, not relatedness to instructors. All of the mentors were
instructors, but this study examined the mentoring relationship in particular. I examined
relatedness to instructor instead of relatedness to mentors.
In her study comparing college outcomes by ethnic group, Fischer (2007) assessed formal
academic ties with professors by asking students how often they asked questions in class and
after class, asked questions when information was unclear, visited professors in their office to
ask questions, and visited professors in their office to talk. Results indicated that more
connections with professors were related to higher GPA for all ethnic groups (β = .07, p < .001
for White students, β = .06, p < .01 for Asian students, β = .09, p < .001 for Hispanic students,
and β = .04, p < .10 for Black students). These relationships though modest suggest that positive
relationships with instructors contribute to students’ GPA. One study has linked relatedness to
instructor to perceived academic self-efficacy. In a study of 172 community college students,
Cordell-McNulty and Ashton (2008) assessed students’ sense of relatedness to their instructors
with four items from a scale developed by Furrer and Skinner (2003) and perceived academic
self-efficacy using the MSLQ (Pintrich et al., 1991). Confirmatory factor analysis showed that
relatedness to instructor loaded on two factors identified as Instructor Acceptance and Ignored by
Instructor. Perceived academic self-efficacy also loaded on two factors identified as Perceived
Self-Efficacy Outcome and Perceived Self-Efficacy Mastery. Perceived Self-Efficacy Mastery
consisted of five items measuring students’ belief that they can master the course content.
Perceived Self-Efficacy Outcome consisted of three items measuring students’ belief in their
ability to achieve a successful outcome in the course. Results showed that Instructor Acceptance

48
predicted both Perceived Self-Efficacy Outcome (F = 5.00, p < .05) and Perceived Self-Efficacy
Mastery (F = 5.16, p < .05). Though the researchers measured perceived self-efficacy and not
achievement, academic self-efficacy has been linked with academic outcomes (Bembenutty,
2007; Multon et al., 1991).
Research has linked relatedness to instructor with academic achievement (Fischer, 2007;
Larose et al., 2005), social adjustment (Larose et al., 2005), and perceived academic self-efficacy
(Cordell-McNulty & Ashton, 2008). In my model, I hypothesized positive relationships between
relatedness to instructor and academic achievement, social adjustment, and perceived academic
self-efficacy.
Belonging on campus
Sense of belonging refers to the feeling that one is valued as a part of the environment
(Hagerty, Lynch-Saucer, Patusky, Bouwsema, & Collier, 1992). Belonging on campus is feeling
a part of the campus environment. Many college retention studies include sense of belonging, but
it is often combined with other factors including institutional fit and commitment (Hausmann,
Schofield, & Woods, 2007). Hurtado and Carter (1997) and Hausmann et al. argued that a sense
of belonging on campus needs to be examined in research as a separate construct from active
involvement in the community. Hurtado and Carter and Hausmann et al. also suggested that
belonging to campus might be an important contributor to minority adolescents’ persistence and
achievements in college in particular.
In a study of the contribution of campus climate to adjustment, Mounts (2004) examined
sense of belonging on campus and college adjustment in a sample of 319 college freshmen.
Sense of belonging was measured using the sense of belonging subscale of the Perceived
Cohesion Scale (PCS; Bollen & Hoyle, 1990). Anxiety and depression were measured using the
Beck Anxiety Inventory (BAI; Beck, Epstein, Brown, & Steer, 1988) and the Beck Depression

49
Inventory (BDI; Beck, Ward, Mendelson, Mock, & Erbaugh, 1961). For White adolescents a
higher sense of belonging on campus was related to lower levels of anxiety (β = -.14, p < .05),
and for African American adolescents a higher sense of belonging on campus was related to
lower levels of depression (β = -.41, p < .001), indicating that sense of belonging is related to
adjustment, but the relationships may differ for different ethnic groups. Because sense of
belonging was negatively related to anxiety and depression, it is likely that sense of belonging is
positively related to social adjustment in college students. In a study of 324 students at a small
liberal arts college Ostrove and Long (2007) also found a link between sense of belonging and
social adjustment. Sense of belonging was measured using 1-item from the SACQ (Baker &
Siryk, 1999), “I feel that I fit in well as part of the college environment,” and another item the
authors created, “Overall, to what extent do you feel you belong at [college name].” Cronbach’s
alpha was .85 for this 2-item measure. Social adjustment was measured using the social
adjustment subscale of the SACQ, minus the one item used to assess sense of belonging. Results
indicated that sense of belonging was significantly related to social adjustment (β = .58, p <
.001). These studies emphasize the relationship of sense of belonging to social adjustment.
Hausmann et al. (2007) examined sense of belonging and intention to persist in 365 first-
year college students from a large mid-Atlantic university. Sense of belonging was measured
using the sense of belonging subscale of the PCS (Bollen & Hoyle, 1990). Persistence was
measured by asking students whether they intended to complete their degree at their institution.
Results showed that sense of belonging predicted intention to persist at the beginning of the year
(parameter estimate = .30, p < .001); however, sense of belonging declined significantly over the
year. The authors argued that as students progress through the school year the practicality of
getting a college degree may become more important than sense of belonging in determining

50
intention to persist. Even though Hausmann et al. found that sense of belonging decreased as
students progressed through their first year of college, I hypothesized that sense of belonging
predicts college student persistence.
In relation to perceived self-efficacy, Freeman, Anderman, and Jensen (2007) examined
sense of belonging in 238 college freshmen at a university in the southeast, using the perceived
self-efficacy subscale of the MSLQ (Pintrich et al., 1991). To measure sense of class belonging,
an adapted version of the Psychological Sense of School Membership (PSSM; Goodenow, 1993)
was used. Results indicated that students’ sense of class belonging was strongly associated with
perceived academic self-efficacy adjustment (β = .58, p < .001). In my model I hypothesized that
sense of belonging predicts perceived academic self-efficacy.
Recently, Rodgers and Summers (2008) proposed a revision to Bean and Eaton’s (2000)
model for examining the retention of African American students at predominantly White
institutions. In particular, they proposed that attitudes precede rather than follow the
psychological processes, so sense of belonging directly affects all the psychological process
variables: self-efficacy, goal orientations, attributions, and intrinsic motivation. Because of this
theoretical relationship proposed in the Rodgers and Summers model, I hypothesized that sense
of belonging is positively related to Commitment Making, Identification with Commitment,
mastery goals, and perceived academic self-efficacy and is negatively related to performance-
avoid goals. Research has also linked sense of belonging with adjustment (Mounts, 2004;
Ostrove & Long, 2007), intention to persist (Hausmann et al., 2007), and perceived academic
self-efficacy (Freeman et al., 2007). Consistent with these studies, in my model I hypothesized
that sense of belonging predicts perceived academic self-efficacy, social adjustment, and
intention to persist.

51
Extracurricular activities
Involvement in extracurricular activities may also be an important predictor of college
attrition. Numerous researchers have reported that student involvement in extracurricular
activities is positively related to educational aspirations, bachelor’s degree attainment, and
graduate school attendance (Moore, Lovell, McGann, & Wyrick, 1998). In a study of 172
community college students, Cordell-McNulty and Ashton (2008) found that participation in
extracurricular activities predicted GPA (F = 4.64, p < .03). In a longitudinal study of 695
participants from middle school through age 20, Mahoney, Cairns, and Farmer (2003) found that
consistent participation in extracurricular activities was positively associated with educational
status at age 20, suggesting that the more students are academically and socially involved, the
more they are likely to graduate. Participation in extracurricular activities may be especially
important during students’ first year of college when relationships and affiliations are forming
(Tinto, 2005). In her study of college outcomes, Fischer (2007) used data from the National
Longitudinal Survey of Freshmen. Equal numbers of White, Black, Hispanic, and Asian students
were sampled from each college resulting in a total of 3,924 participants. Outcome variables for
this study were college GPA and whether students left their initial college by the end of their
junior year. Fischer found that for minority students, greater involvement in formal social
activities as measured by extracurricular activities and volunteering, was weakly related to
higher grades (β = .08, p < .05 for Asian students, β = .17, p < .001 for Hispanic students, and β
= .11, p < .01 for Black students). However, greater involvement in extracurricular activities was
strongly negatively related to leaving college for minority students (β = -1.89, p < .05 for Asian
students, β = -1.80, p < .001 for Hispanic students, and β = -1.87, p < .05 for Black students).
These studies show a weak positive relationship between participation in extracurricular
activities and GPA but a strong positive relationship with persistence.

52
Bohnert, Aikins, and Edidin (2007) examined the relationship between extracurricular
activities and social adaptation during the transition to college in 85 adolescents who completed
measures during the summer before their first year in college (Time 1) and towards the end of
their first year in college (Time 2). Extracurricular activities were measured by the number of
activities students participated in (breadth) and the number of hours each week students spent on
extracurricular activities (intensity). Friendship quality was assessed using the Friendship
Quality Questionnaire (FQQ; Parker & Asher, 1993). Loneliness and social dissatisfaction were
assessed using the Loneliness and Social Dissatisfaction Questionnaire (Asher & Wheeler,
1985). The researchers found that the number of hours a student participated in extracurricular
activities each week (intensity) was significantly correlated with friendship quality (r = .27, p <
.05) and loneliness (r = -.27, p < .05). The number of activities a student participated in each
week (breadth) was negatively correlated with loneliness (r = -.23, p < .05).
In summary, previous research demonstrates relationships between participation in
extracurricular activities and academic achievement (Cordell-McNulty & Ashton, 2008; Fischer,
2007), social adaptation (Bohnert et al., 2007), and intention to persist (Fischer, 2007; Moore et
al., 1998). On the basis of these studies, in my model I hypothesized that involvement in
extracurricular activities predict academic achievement, social adjustment, and intention to
persist.
The Self-System
Research suggests that several student characteristics are related to success during
college. Because of the importance of the person in college success, I examined the self-system.
The self-system in this study consists of the person variables of personality and academic ability,
and the process variable of theory of intelligence. The research evidence indicates that each of
these variables has been linked to one or more of the outcome variables of academic
53
achievement, social adjustment, and intention to persist. Each variable is reviewed separately,
and research that connects these self-system variables to any of the psychological processes
variables is also discussed.
Personality
Personality, in particular the five-factor model of personality, has often been linked with
academic outcomes (Nguyen, Allen, & Fraccastoro, 2005; Wolfe & Johnson, 1995). The five-
factor model is one of the most popular conceptions of personality traits. The model is composed
of Extraversion, Agreeableness, Conscientiousness, Neuroticism, and Openness. Extraversion
refers to being assertive, active, enthusiastic, and energetic. Agreeableness refers to being
cooperative, generous, appreciative, and trustful. Conscientiousness refers to being responsible,
orderly, organized, and reliable. Neuroticism refers to being anxious, tense, and unstable and
Openness refers to being imaginative, artistic curious, and insightful (John & Srivastava, 1999;
McCrae & John, 1992). Of these five personality factors, conscientiousness has been consistently
shown to predict academic achievement. Nguyen et al. investigated the relationship between the
five-factor model and college GPA. Participants were 360 undergraduate and graduate students
at a Southern university. Personality was measured using the Big 5 Personality Inventory
developed by Goldberg (1999). They found that conscientiousness was a stronger predictor of
overall GPA than the other four personality traits (t = 2.916, p < .01). In a similar study, Wolfe
and Johnson examined personality and college outcome in 201 undergraduate students at a state
university in New York. Personality was measured using the Big Five Inventory (John, Donahue,
& Kentle, 1991). Wolfe and Johnson found that conscientiousness was the second strongest
predictor of college GPA (β = .31), after average grade earned in high school (β = .43). Because
of this research linking conscientiousness as a strong predictor of academic achievement, I
examined the relationship of conscientiousness to GPA in my study.

54
Numerous studies linking personality and identity have been conducted. For example,
Luyckx et al. (2005) examined personality and identity with 565 freshmen in educational
psychology classes in a university in Belgium, using the Utrecht-Groningen Identity
Development Scale (U-GIDS; Meeus & Dekovic, 1995) to assess Identification with
Commitment and Exploration in Depth and the Ego Identity Process Questionnaire (EIPQ;
Balistreri et al., 1995) to assess Commitment Making and Exploration in Breadth.
Conscientiousness and openness were assessed using the Dutch version of the NEO-FFI
(Hoekstra et al., 1996). In relationship to the five identity categories Luyckx et al. found that
college students in the Achievement category were high on conscientiousness (M = 3.58) and
openness (M = 3.60). Students in the Foreclosure category were high on conscientiousness (M =
3.53), but low on openness (M = 3.35). Students in Moratorium were low on conscientiousness
(M = 3.37), but high on openness (M = 3.60). Students in both the Diffused Diffusion and
Carefree Diffusion categories scored low on both conscientiousness (M = 3.13, 3.27) and
openness (M = 3.48, 3.37). All these means were significantly different from other means. These
results are consistent with what is expected in each identity status. In a study examining the
relationship between identity status and personality, Clancy and Dollinger (1993) examined all
five personality traits in 198 undergraduates at a large Midwestern university. Identity was
measured using the Extended Objective Measure of Ego Identity Status (EOM-EIS; Adams,
Bennion, & Huh, 1989), and personality was measured using the NEO Personality Inventory
(NEO-PI; Costa & McCrae, 1992). They found a significant positive relationship between
conscientiousness and Identity Achievement (r = .30, p < .001), and significant negative
relationships between conscientiousness and Moratorium (r = -.22, p < .001) and Diffusion (r = -
.38, p < .001). These results are consistent with the findings of Luyckx et al.

55
In another study of personality and identity, Luyckx, Soenens, and Goossens (2006)
examined the relationship between personality and identity in 351 college women at a university
in Belgium. The U-GIDS (Meeus & Dekovic, 1995) was used to assess Identification with
Commitment, and the EIPQ (Balistreri et al., 1995) was used to assess Commitment Making and
Exploration in Breadth. Personality was assessed using the Dutch version of the NEO-FFI
(Hoekstra et al., 1996). The researchers found that Commitment Making and Identification with
Commitment were negatively related to neuroticism and positively related to extraversion,
agreeableness, and conscientiousness. Using structural equation modeling they reported that
conscientiousness at Time 1 positively predicted Commitment Making at Time 3 (β = .09, p <
.05) and positively predicted Identification with Commitment at Time 5 (β = .12, p < .05). The
major weakness of this study is that all participants were female, so these results cannot be
generalized to male college populations. These studies all indicate a strong relationship between
identity and personality and in particular a relationship between conscientiousness and Identity
Achievement.
In previous research conscientiousness has been associated with academic achievement
(Nguyen et al., 2005; Wolfe & Johnson, 1995), identity achievement (Clancy & Dollinger, 1993;
Luyckx et al., 2005), and Commitment Making and Identification with Commitment (Luyckx et
al., 2006). In my model I hypothesized that conscientiousness is positively associated with
academic achievement, Commitment Making, and Identification with Commitment.
Theory of intelligence
Implicit theories of intelligence refer to the way people understand their own intelligence.
Dweck (1999) proposed two types of implicit theories of intelligence: entity and incremental.
Entity theorists believe that their intelligence is fixed and cannot be changed. In contrast,
incremental theorists believe that intelligence is malleable and can be increased. Entity theorists
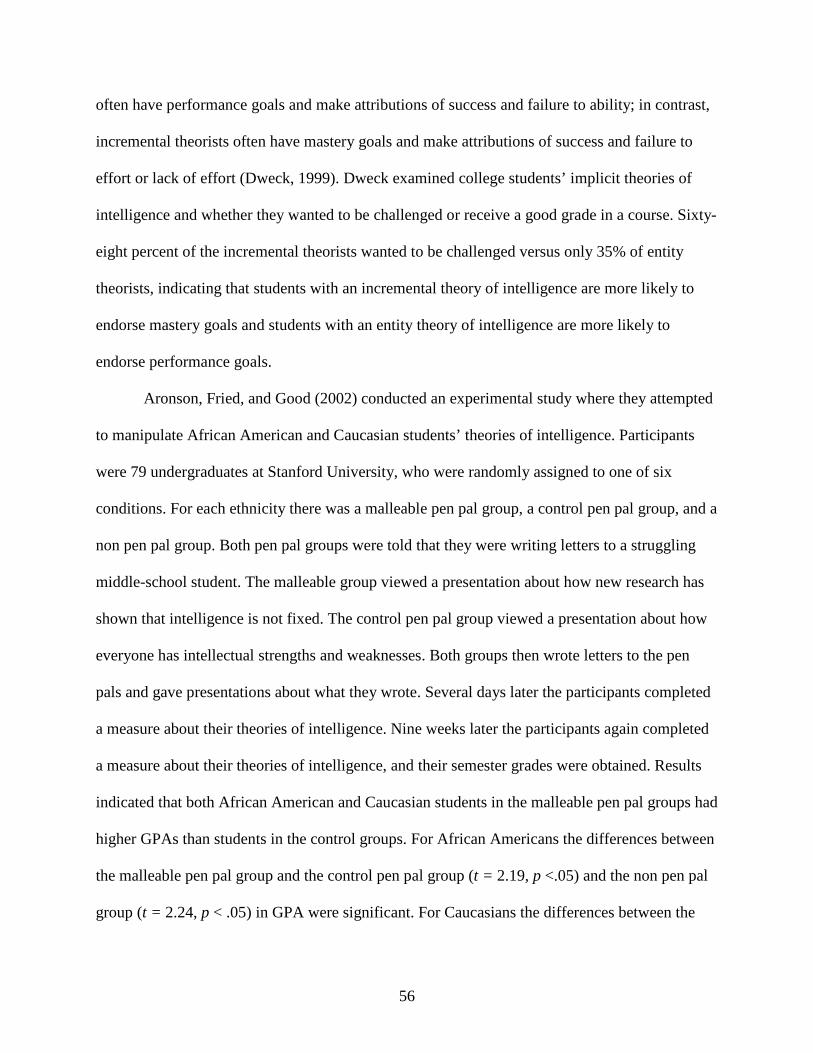
56
often have performance goals and make attributions of success and failure to ability; in contrast,
incremental theorists often have mastery goals and make attributions of success and failure to
effort or lack of effort (Dweck, 1999). Dweck examined college students’ implicit theories of
intelligence and whether they wanted to be challenged or receive a good grade in a course. Sixty-
eight percent of the incremental theorists wanted to be challenged versus only 35% of entity
theorists, indicating that students with an incremental theory of intelligence are more likely to
endorse mastery goals and students with an entity theory of intelligence are more likely to
endorse performance goals.
Aronson, Fried, and Good (2002) conducted an experimental study where they attempted
to manipulate African American and Caucasian students’ theories of intelligence. Participants
were 79 undergraduates at Stanford University, who were randomly assigned to one of six
conditions. For each ethnicity there was a malleable pen pal group, a control pen pal group, and a
non pen pal group. Both pen pal groups were told that they were writing letters to a struggling
middle-school student. The malleable group viewed a presentation about how new research has
shown that intelligence is not fixed. The control pen pal group viewed a presentation about how
everyone has intellectual strengths and weaknesses. Both groups then wrote letters to the pen
pals and gave presentations about what they wrote. Several days later the participants completed
a measure about their theories of intelligence. Nine weeks later the participants again completed
a measure about their theories of intelligence, and their semester grades were obtained. Results
indicated that both African American and Caucasian students in the malleable pen pal groups had
higher GPAs than students in the control groups. For African Americans the differences between
the malleable pen pal group and the control pen pal group (t = 2.19, p <.05) and the non pen pal
group (t = 2.24, p < .05) in GPA were significant. For Caucasians the differences between the

57
malleable pen pal group and the control pen pal group (t = 1.76, p < .09) and the non pen pal
group (t = 1.82, p < .08) in GPA were marginally significant. However, the researchers did not
measure persistence, so we do not know if incremental beliefs would eventually impact
persistence.
However, Zuckerman, Gagne, and Nafshi (2001) examined the relationship between
students’ implicit beliefs about their major and students’ persistence in their choice of a major.
Participants were 186 undergraduates at the University of Rochester. Entity beliefs were
measured with a scale the authors created. A sample item is “one’s interests are what they are;
they cannot be changed to fit a particular major.” There was a significant entity by perceived
competence interaction (F = 6.83, p < .01), which indicated that students with entity beliefs who
believed they were not doing well in their major were more likely to choose a new major than
were incremental theorists who were also not doing well in the major. However, the researchers
measured persistence in the major, not persistence in college.
Robins and Pals (2002) examined the implicit self-theories of college students in the
academic domain with data from the Longitudinal Study of Self and Personality Development.
Participants were 363 undergraduate students at the University of California at Berkeley. Data
were collected throughout the 4 years of college. Implicit self-theories were measured with five
items adapted from Erdley and Dweck (1993). Performance and learning goal orientations were
assessed with items the authors created. Cronbach’s alphas for the performance and learning goal
orientation scales were .84 and .78 respectively. Affective response to academic achievement
was measured using the Positive and Negative Affect Scale (PANAS; Watson, Clark, &
Tellegen, 1998). Results indicated that entity theorists were more likely to endorse performance
goals and experience negative affect about their academic performance. In contrast, incremental

58
theorists were more likely to endorse learning goals and experience positive affect about their
academic performance. Path analysis was also used to test the overall implicit self-theories
model. The final model the authors tested was significant and had a good fit to the data. In the
model, entity orientation had a direct effect (r = .30, p < .05) on performance goals and a direct
negative effect on learning goals (r = -.26, p < .05).
In summary, entity beliefs about intelligence have been found to be negatively related to
GPA (Aronson et al., 2002), persistence (Zuckerman et al., 2001), and mastery goals and
positively related to performance goals (Robins & Pals, 2002). Consistent with those
relationships I hypothesized in my model a negative relationship between entity beliefs and
mastery goals, GPA, and intention to persist. I also hypothesized a positive relationship between
entity beliefs and performance-avoid goals.
Previous academic achievement
Previous academic achievement (SAT scores and high school GPA) is often used as a
predictor of college retention (Robbins et al., 2004). In their meta-analysis of 109 studies of
college outcomes, Robbins et al. found that high school GPA, SAT, and ACT scores predicted
retention and GPA in a study of college students. Robbins, Allen, Casillas, Peterson, and Le
(2006) conducted a large-scale study of college outcomes in 14,464 students from 48 2- and 4-
year colleges in the U.S. The researchers found that the ACT composite score and high school
GPA predicted retention and college GPA in 2- and 4-year institutions (for retention, odds ratio
= 1.24, p < .03 for ACT scores at 2-year institutions, odds ratio = 1.28, p < .001 for ACT scores
at 4-year institutions, odds ratio = 1.24, p < .001 for high school GPA at 2-year institutions, and
odds ratio = 1.25, p < .001 for high school GPA at 4-year institutions, and for college GPA, β =
.18, p < .001 for ACT scores at 2-year institutions, β = .30, p < .001 for ACT score at 4-year
institutions, β = .24, p < .001 for high school GPA at 2-year institutions, and β = .28, p < .001 for

59
high school GPA at 4-year institutions) at 2- and 4- year institutions. In a study examining
predictors of college performance, Elias and MacDonald (2007) examined the relationship of
prior achievement on college achievement in 202 undergraduates. Results indicated that high
school GPA predicted college GPA (β = .38, p < .001). In a comparison of college outcomes for
different ethnic groups, Fischer (2007) used data from the National Longitudinal Survey of
Freshmen. Equal numbers of White, Black, Hispanic, and Asian students were sampled from
each college resulting in a total of 3,924 participants. Results showed that, for all students, high
school GPA significantly predicted college GPA. In another study, Mattson (2007) also found
that high school GPA was significantly related to academic success in 591 students who were
identified as being at risk at a highly selective, private research university in the Southwest.
Students were identified as high risk if they had a low high school GPA or low standardized test
scores. Results indicated that high school GPA was significantly correlated with first-semester
college GPA (r = .18, p <. 01) and first-year college GPA (r = .20, p < .01). In summary, the
studies show that high school GPA predicts college GPA.
In sum previous academic achievement has been linked with academic achievement in
college (Elias & MacDonald, 2007; Fischer, 2007; Mattson, 2007; Robbins et al., 2004; Robbins
et al., 2006) and college retention (Robbins et al., 2004; Robbins et al., 2006). On the basis of
these studies I hypothesized that previous academic achievement in high school predicts college
GPA in my model.
The Macrosystem
In 2002-2003, women earned over 57% of all bachelor’s degrees, and Caucasian students
earned 70% of all bachelor’s degrees (National Center for Education Statistics, 2005a). Many
researchers have noted that gender, ethnicity, and SES are often predictors of college success

60
(Astin, 1997; Fischer, 2007). In this study I examined the context variables of gender, ethnicity,
and socioeconomic status within the macrosystem.
Gender
Gender, when included as a predictor variable, is significantly related to college success.
Astin (1997) pointed out that gender is one of the factors that colleges can use to predict the
retention rate of their students. Robbins et al. (2006) in a study of 14,464 students from 48 2- and
4-year colleges in the U.S. found that gender predicted college GPA (β = -.12, p < .001 for 4-
year institutions and β = -.07, p < .07 for 2-year institutions), with females having higher GPAs
than males. In a study of 172 community college students, Cordell-McNulty and Ashton (2008)
also found that gender predicted GPA (F = 3.83, p < .05) with females having higher self-
reported GPAs than male students. Examining predictors of success in students at-risk at a highly
selective, private research university in the Southwest, Mattson (2007) found that gender was
significantly related to academic success in 591 students with a low high school GPA or low
standardized test scores. Results indicated that gender was significantly correlated with first-
semester college GPA (r = .16, p < .01) and first-year college GPA (r = .19, p < .01), indicating
that females had higher college GPAs than males. Using data from the National Longitudinal
Survey of Freshmen, Fischer (2007) sampled equal numbers of White, Black, Hispanic, and
Asian students from each college resulting in a total of 3,924 participants. Outcome variables for
this study were college GPA and whether students left their initial college by the end of their
junior year. For all students, being male was negatively related to cumulative college GPA. This
relationship was significant for White (β = -.07, p < .01), Hispanic (β = -.11, p < .05), and Black
males (β = -.10, p < .001). All these studies show that being female predicts higher GPA. One
recent study linked college success with males. Gupta, Harris, Carrier, and Cohen (2006)
examined predictors of success of 451 undergraduates in an upper-level mathematics course at a

61
public university in the Northeast. Results indicated that gender was a significant predictor of
final course grade with male students receiving higher grades. This result suggests that in some
courses or perhaps majors, male students may outperform female students, but female students
are more likely to have higher cumulative college GPAs than male students.
Several studies have indicated that females have higher cumulative GPAs in college than
males (Cordell-McNulty & Ashton, 2008; Fischer, 2007; Mattson, 2007; Robbins et al., 2006).
On the basis of these studies I controlled for gender in my model.
Ethnicity
In her examination of college outcomes by ethnicity in 3,924 students from four ethnic
groups, Fischer (2007) argued that when examining college outcomes and adjustment, ethnicity
cannot be ignored because minority students experience college differently. Astin (1997) argued
that ethnicity is one of the factors that can be used to help colleges predict the expected retention
rate of their students. In a study of college outcomes, Robbins et al. (2006) examined 14,464
students from 48 2- and 4-year colleges in the U.S. and found that ethnicity predicted college
GPA at both 2- (p < .001) and 4- year institutions (p < .001). In a study of social support and
perceived academic self-efficacy in 172 community college students, Cordell-McNulty and
Ashton (2008) found that ethnicity was a significant predictor of GPA (F = 8.40, p < .0001), with
White students and students who identified themselves as other, having higher GPAs than Black
and Hispanic students. On the basis of these studies linking ethnicity to academic achievement in
college (Cordell-McNulty & Ashton, 2008; Robbins et al., 2006), I controlled for ethnicity in my
model.
Socioeconomic status
SES is often included as a predictor of college outcomes. In their meta-analysis of 109
studies examining psychosocial and study-skill factors and their relationship to college

62
outcomes, Robbins et al. (2004) found that SES positively predicted retention and college GPA.
In their study of college outcomes, Robbins et al. (2006) examined 14,464 students from 48 2-
and 4-year colleges in the U.S. and found that SES predicted retention (odds ratio = 1.12, p <
.001) and college GPA (β = -.80, p < .001) at 4-year institutions with students with higher SES
having higher GPAs and persistence. Of note, SES was not a significant predictor of GPA or
persistence at 2-year colleges. A possible reason for this finding is that there was less variation in
SES at 2-year colleges than in the 4-year sample. Fischer (2007) used data from the National
Longitudinal Survey of Freshmen to examine differences in college outcomes by ethnicity. Equal
numbers of White, Black, Hispanic, and Asian students were sampled from each college
resulting in a total of 3,924 participants. Results indicated having a family income of more than
$75,000 a year significantly predicted college GPA for White (β = .06, p < .05) and Hispanic
students (β = .09, p < .05). Overall higher SES levels tend to predict GPA and persistence;
however, this relationship may differ by type of institution. In particular, Robbins et al. (2006)
did not find a significant relationship between SES and GPA or retention for college students at
2-year institutions. In light of the studies indicating a relationship between SES and academic
achievement in college (Fischer, 2007; Robbins et al, 2004; Robbins et al., 2006) and college
retention (Robbins et al., 2004; Robbins et al., 2006), I planned to control for SES in my model.
The Chronosystem
Age is often a predictor of college success. Because of the importance of age, this study
will examine the chronosystem time variable of age. It is reasonable to assume that as students
age and progress through college they will become more independent. Studies have shown that
older students tend to receive higher course grades (Gupta et al., 2006) and higher GRE scores
(Awad, 2007). Gupta et al. examined predictors of success in 451 undergraduates in an upper-
level mathematics course at a public university in the Northeast. Results indicated that age was a

63
significant predictor of final course grade with older students receiving higher grades. Awad
(2007) examined 313 African American students from a historically Black college in the
Northeast to identify variables that predict GPA and GRE scores. Students completed the GRE
verbal subtest. Results showed that the only significant predictor of GRE scores was age (β =
.18, p < .05), with older students having higher scores. On the basis of these studies showing a
relationship between age and academic achievement (Awad, 2007; Gupta et al., 2006), I
excluded all students over the age of 26.
Purpose of the Study
The purpose of this study was to test a model of college success and retention based on a
bioecological perspective (Bronfenbrenner & Morris, 1998). This new bioecological systems
model of college retention focuses on the ecological systems (family, peer, college, and the self-
system) that predict college success and the psychological processes (identity, perceived
academic self-efficacy, and achievement goals) that mediate the relationship between the
ecological systems and college success. See Figure 1 for an illustration of the conceptual model.
The hypotheses I proposed to test based on my review of the literature are represented in
Table 1-1. Specifically, parental autonomy support, instructor relatedness, on-campus friend
relatedness, sense of belonging, extracurricular activities, and entity beliefs have a direct
relationship to intention to persist. Parental involvement, instructor relatedness, and sense of
belonging directly affect academic self-efficacy which in turn, directly affects intention to
persist. Parental autonomy support, parental relatedness, sense of belonging, and
conscientiousness directly affect commitment making which also directly affects intention to
persist. Parental autonomy support, sense of belonging, and conscientiousness directly affect
identification with commitment which directly affects intention to persist. Parental involvement,
parental autonomy support, instructor relatedness, extracurricular activities, entity beliefs, and
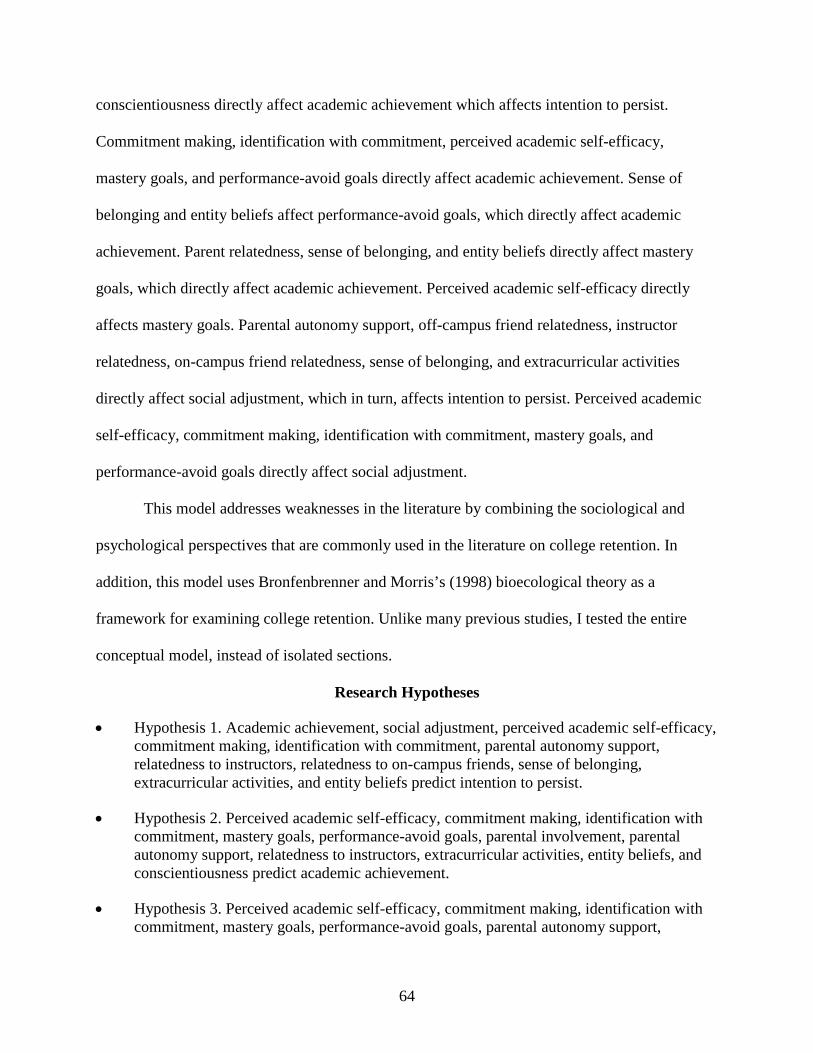
64
conscientiousness directly affect academic achievement which affects intention to persist.
Commitment making, identification with commitment, perceived academic self-efficacy,
mastery goals, and performance-avoid goals directly affect academic achievement. Sense of
belonging and entity beliefs affect performance-avoid goals, which directly affect academic
achievement. Parent relatedness, sense of belonging, and entity beliefs directly affect mastery
goals, which directly affect academic achievement. Perceived academic self-efficacy directly
affects mastery goals. Parental autonomy support, off-campus friend relatedness, instructor
relatedness, on-campus friend relatedness, sense of belonging, and extracurricular activities
directly affect social adjustment, which in turn, affects intention to persist. Perceived academic
self-efficacy, commitment making, identification with commitment, mastery goals, and
performance-avoid goals directly affect social adjustment.
This model addresses weaknesses in the literature by combining the sociological and
psychological perspectives that are commonly used in the literature on college retention. In
addition, this model uses Bronfenbrenner and Morris’s (1998) bioecological theory as a
framework for examining college retention. Unlike many previous studies, I tested the entire
conceptual model, instead of isolated sections.
Research Hypotheses
• Hypothesis 1. Academic achievement, social adjustment, perceived academic self-efficacy, commitment making, identification with commitment, parental autonomy support, relatedness to instructors, relatedness to on-campus friends, sense of belonging, extracurricular activities, and entity beliefs predict intention to persist.
• Hypothesis 2. Perceived academic self-efficacy, commitment making, identification with commitment, mastery goals, performance-avoid goals, parental involvement, parental autonomy support, relatedness to instructors, extracurricular activities, entity beliefs, and conscientiousness predict academic achievement.
• Hypothesis 3. Perceived academic self-efficacy, commitment making, identification with commitment, mastery goals, performance-avoid goals, parental autonomy support,

65
relatedness to off-campus friends, relatedness to instructors, relatedness to on-campus friends, extracurricular activities, and sense of belonging predict social adjustment.
• Hypothesis 4. Perceived academic self-efficacy, relatedness to parents, sense of belonging, and entity beliefs predict mastery goals.
• Hypothesis 5. Perceived academic self-efficacy, sense of belonging, and entity beliefs predict performance-avoid goals.
• Hypothesis 6. Parental involvement, relatedness to instructors, and sense of belonging predict perceived academic self-efficacy.
• Hypothesis 7. Parental autonomy support, relatedness to parents, sense of belonging, and conscientiousness predict commitment making.
• Hypothesis 8. Parental autonomy support, sense of belonging, and conscientiousness predict identification with commitment.
Theoretical Significance
Researchers have proposed several models of college retention (Bean & Eaton, 2000;
Tinto, 1975, 1993), but they have not conducted adequate tests of these models. Most studies of
college retention focus on relatively few variables and lack a theoretical focus that integrates the
variables into a coherent framework. My dissertation is the first study to use Bronfenbrenner and
Morris’s (1998) bioecological theory as a theoretical framework for creating and testing a
conceptual model of student retention in college. This model includes variables from five social
contexts (person, family, peers, school, and culture) that have been shown to predict GPA and
persistence to graduation. The theoretical significance of this dissertation is that it will advance
the study of college retention by providing a cohesive structure for the identification and testing
of relationships among the variables that are likely to contribute to students’ retention in college.
Practical Significance
The failure of a significant proportion of students who enter college to complete their
programs is a serious problem. Estimates suggest that almost 50% of students do not complete
their college programs within 5 years (National Center for Higher Education Management

66
Systems, 2007). The practical significance of my dissertation is that it might provide researchers
and higher education administrators with information on variables that might increase college
students’ timely completion of their degrees. The value of the bioecological perspective is that it
suggests variables from several social contexts—the person, the home, the school, the culture,
and peers—that might improve students’ persistence to graduation. Programs that combine
influences from each of these social contexts might be more effective than programs that focus
on only one context, typically the school. By examining a more comprehensive set of predictor
variables, I may be able to identify variables from these different contexts that contribute to
retention of students to graduation. I hope that my study will offer insights for the design of
experimental studies that show that innovative programs that combine factors from multiple
social contexts are more effective in increasing college students’ retention than programs that
focus on a single social context.

67
Figure 1-1 Proposed Bioecological Model of College Student Retention

68
Table 1-1 Proposed relationships in the model
Commitment
Making
Identification with
Commitment Mastery Goals
Performance-Avoid Goals
Perceived Academic
Self-Efficacy GPA Social
Adjustment
Intention to
Persist Parental Involvement * * Parental Relatedness * * Parental Autonomy Support * * * * *
Off-Campus Friend Relatedness * Instructor Relatedness * * * On-Campus Friend Relatedness * *
Sense of Belonging * * * * * * * Extracurricular Activities * * * Conscientiousness * * * Entity Beliefs * * * * Commitment Making * * * Identification with Commitment * * *
Mastery Goals * * Performance-Avoid Goals * * Perceived Academic Self-Efficacy * * * * GPA * Social Adjustment *

69
CHAPTER 2 METHOD
The purpose of this study was to test a new model of college retention that focused on the
relationships among the family, peer, and college microsystems, the self-system, the
psychological processes of identity, goal orientations, and perceived academic self-efficacy, and
the outcome variables, academic achievement, social adjustment, and intention to persist.
Participants
Participants were 299 college students from a large southeastern university. At the
university, students were recruited from educational psychology classes and received course
credit for their participation. All participants completed the survey online.
Instruments
Predictor Variables
Identity
Identity was measured using the Commitment Making and Identification with
Commitment subscales of the Dimensions of Identity Development Scale (DIDS; Luyckx et al.,
2008). This 25-item instrument measures the five identity dimensions, Commitment Making,
Identification with Commitment, Exploration in Breadth, Exploration in Depth, and Ruminative
Exploration. Participants responded the items using a 5-point Likert scale ranging from 0
(strongly disagree) to 4 (strongly agree). Sample items for Commitment Making include “Know
what I want to do with my future,” and “Made a choice concerning some of my plans for the
future.” Sample items for Identification with Commitment include “Future plans give me self-
confidence,” and “Sense that the direction I want to take in life will really suit me.” In the
Luyckx et al. (2008) study a sample of 263 Caucasian freshmen college students from a
university in Belgium completed the 25-item measure. This sample was 72.6% female, and the

70
mean age was 19.14 years. Cronbach’s alphas were .86 for Commitment Making, .86 for
Identification with Commitment, .81 for Exploration in Breadth, .79 for Exploration in Depth,
and .86 for Ruminative Exploration. Luyckx et al. (2008) conducted a confirmatory factor
analysis to determine if the data would fit a five-factor model consistent with the proposed
dimensions. The data did fit the five-factor model with a Satorra-Bentler scaled chi-square of
658.93, RMSEA = .07, and CFI = .94.
Luyckx et al. (2008) conducted a cluster analysis of the identity statuses. Six clusters
emerged: Achievement, Diffused Diffusion, Carefree Diffusion, Ruminative Moratorium,
Foreclosure, and Undifferentiated. The Achievement cluster scored high on Commitment
Making and Identification with Commitment, moderately high on Exploration in Breadth and
Exploration in Depth, and low on Ruminative Exploration. The Diffused Diffusion cluster scored
low on Commitment Making and Identification with Commitment, intermediate on Exploration
in Breadth and Exploration in Depth, and high on Ruminative Exploration. The Carefree
Diffusion cluster scored low on Commitment Making, Identification with Commitment,
Exploration in Breadth, and Exploration in Depth, and intermediate on Ruminative Exploration.
The Ruminative Exploration cluster scored low on Commitment Making and Identification with
Commitment, and high on Exploration in Breadth, Exploration in Depth, and Ruminative
Exploration. The Foreclosure cluster scored high on Commitment Making and Identification
with Commitment, and low on Exploration in Breadth, Exploration in Depth, and Ruminative
Exploration. The Undifferentiated cluster scored intermediate on all dimensions except
Exploration in Breadth, which was moderately high.
As evidence of construct validity, participants’ scores on the DIDS clusters were related
to their scores on measures of self-esteem, depressive symptoms, anxiety symptoms, self-
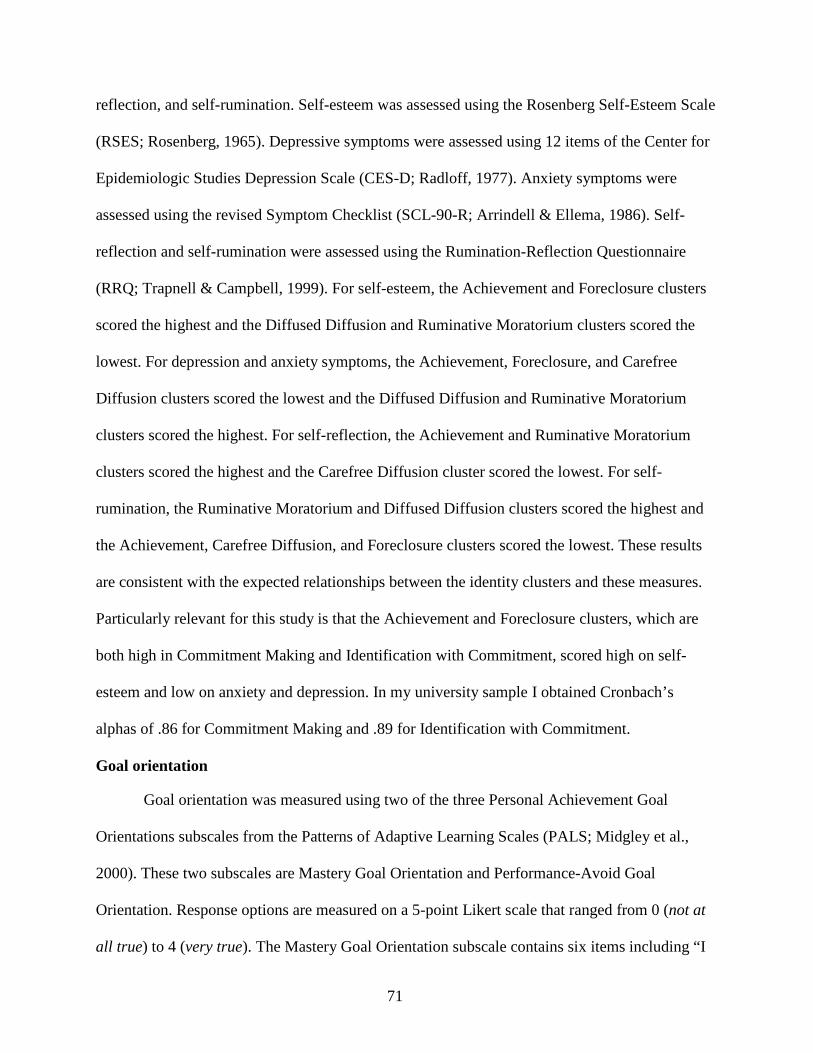
71
reflection, and self-rumination. Self-esteem was assessed using the Rosenberg Self-Esteem Scale
(RSES; Rosenberg, 1965). Depressive symptoms were assessed using 12 items of the Center for
Epidemiologic Studies Depression Scale (CES-D; Radloff, 1977). Anxiety symptoms were
assessed using the revised Symptom Checklist (SCL-90-R; Arrindell & Ellema, 1986). Self-
reflection and self-rumination were assessed using the Rumination-Reflection Questionnaire
(RRQ; Trapnell & Campbell, 1999). For self-esteem, the Achievement and Foreclosure clusters
scored the highest and the Diffused Diffusion and Ruminative Moratorium clusters scored the
lowest. For depression and anxiety symptoms, the Achievement, Foreclosure, and Carefree
Diffusion clusters scored the lowest and the Diffused Diffusion and Ruminative Moratorium
clusters scored the highest. For self-reflection, the Achievement and Ruminative Moratorium
clusters scored the highest and the Carefree Diffusion cluster scored the lowest. For self-
rumination, the Ruminative Moratorium and Diffused Diffusion clusters scored the highest and
the Achievement, Carefree Diffusion, and Foreclosure clusters scored the lowest. These results
are consistent with the expected relationships between the identity clusters and these measures.
Particularly relevant for this study is that the Achievement and Foreclosure clusters, which are
both high in Commitment Making and Identification with Commitment, scored high on self-
esteem and low on anxiety and depression. In my university sample I obtained Cronbach’s
alphas of .86 for Commitment Making and .89 for Identification with Commitment.
Goal orientation
Goal orientation was measured using two of the three Personal Achievement Goal
Orientations subscales from the Patterns of Adaptive Learning Scales (PALS; Midgley et al.,
2000). These two subscales are Mastery Goal Orientation and Performance-Avoid Goal
Orientation. Response options are measured on a 5-point Likert scale that ranged from 0 (not at
all true) to 4 (very true). The Mastery Goal Orientation subscale contains six items including “I

72
like class work that I'll learn from even if I make a lot of mistakes” and “an important reason
why I do my class work is because I like to learn new things.” The Performance-Avoid Goal
Orientation subscale consists of six items including “it's very important to me that I don't look
stupid in my class” and “an important reason I do my class work is so that I don’t embarrass
myself.”
Ross, Shannon, Salisbury-Glennon, and Guarino (2002) examined the reliability and
validity of the scores of a college sample on the PALS. Participants were 184 undergraduate
students in education classes at a southeastern university. The sample was 74% female with a
mean age of 22. Cronbach’s alphas for students’ scores on Mastery Goal Orientation, and
Performance-Avoid Goal Orientation were .78 and .84. A confirmatory factor analysis revealed
that the items did load on a three-factor model as hypothesized. For my university sample I
obtained Cronbach’s alphas of .85 for Mastery Goal Orientation and .89 for Performance-Avoid
Goal Orientation.
Perceived academic self-efficacy
Eight questions from the Self-Efficacy for Learning and Performance subscale of the
Motivated Strategies for Learning Questionnaire (MSLQ; Pintrich et al., 1991) were used to
measure perceived academic self-efficacy in a specific classroom. For this study, this subscale
was modified to reflect perceived academic self-efficacy for all college courses. This subscale
measures expectancy for success and perceived self-efficacy. Responses options for the subscale
range from 0 (not at all true of me) to 7 (very true of me). Sample items include “I believe I will
receive excellent grades in my courses,” and “I’m certain I can master the skills being taught in
my classes.” With a sample of 380 Midwestern college and community college students, Pintrich
et al. obtained a Cronbach alpha of .93. With regard to predictive validity, the students’ scores on
the scale were significantly correlated with final course grades (r = .41). Pintrich et al. also

73
conducted a confirmatory factor analysis and found that all eight items loaded on a factor they
named Self-Efficacy for Learning and Performance. Recently, Cordell-McNulty and Ashton
(2006) obtained a Cronbach alpha of .92 for the scores of 364 students on this scale at a college
in the Northeast, and Cordell-McNulty and Ashton (2008) obtained a Cronbach alpha of .94 for
the scores of 172 students at a community college in the Southeast. In this study I obtained a
Cronbach’s alpha of .93 for the university sample.
Parental involvement
Parental involvement was measured by the Academic Support subscale of the Parental
Support for College measure (Mounts, 2004). This 40-item scale measures three types of
parental support: academic, financial, and social support. Items response options on a 4-point
Likert scale range from 0 (strongly disagree) to 3 (strongly agree). The Academic Support
subscale consists of 12 items. Sample items for academic support include “My parents/guardian
asked me about my class work (homework, exams, grades, and classes),” and “My
parents/guardian gave encouragement when classes were tough.” Mounts reported internal
consistency data for two diverse samples of college freshmen. The first sample consisted of 183
students, 52% male, 56% White, 23% African-American, 13% Asian, 6% Latino, and 2%
Multiracial. The second sample was composed of 400 students, 62% female, 58% White, 22%
African-American, 7% Latino, 6% Asian, 5% Multiracial, and 2% other. For students’ scores on
the Academic Support subscale, a Cronbach alpha of .84 was obtained in the first sample, and a
Cronbach alpha of .79 was obtained in the second sample.
As evidence of convergent validity for the Academic Support subscale, Mounts (2008)
reported significant positive correlations of .47 between academic support and maternal
acceptance and of .27 between academic support and parental acceptance. Parental acceptance
was measured using the Child’s Report of Parenting Behavior Inventory (CRPBI). As evidence

74
of discriminant validity for the Academic Support subscale, Mounts reported negative
correlations of -.18 with the Beck Depression Inventory (BDI), and -.08 with the Beck Anxiety
Inventory (BAI). These results provide evidence of the convergent and discriminant validity of
the participants’ scores on the academic support subscale because it was positively correlated
with parental and maternal acceptance and negatively correlated with depression and anxiety.
For the university sample in this study I obtained a Cronbach alpha of .83.
Parental autonomy support
Parental autonomy support was measured by the Parental Autonomy Support Scale
(Duchesne et al., 2007; Ratelle et al., 2005). This measure is designed to assess college students’
perceptions of their parents supporting their autonomy in their decision to pursue college studies.
This 8-item scale was adapted from Paulson et al. (1994) and Robinson et al. (1995). Item
response options are scored on a 5-point Likert scale ranging from 0 (totally disagree) to 4
(totally agree). Sample items include “my parents gave me a lot of freedom with respect to my
choice of college program,” and “my parents let me express myself during the decision process
of choosing a college program.” For the scores of 262 Canadian college students, Ratelle et al.
obtained a Cronbach alpha of .88. For the scores of 498 Canadian college students (279 females,
and 219 males) Duchesne et al. obtained a Cronbach alpha of .87. I obtained a Cronbach alpha of
.89 for the university sample in this study.
Relatedness
Students’ sense of relatedness to their parents, off-campus friends, instructors, and on-
campus friends was measured by 16 items from a scale developed by Furrer and Skinner (2003).
These items measured relatedness to four social partners: parents, instructors, classmates, and
friends. The stem for each item is “When I’m with . . . .” The four items for each stem are “I feel
accepted,” “I feel like someone special,” “I feel ignored,” and “I feel unimportant.” Response

75
options ranged from 0 (strongly disagree) to 6 (strongly agree). Cordell-McNulty and Ashton
(2008) used this measure in a sample of 146 community college students and obtained a
Cronbach alpha of .82 for participants’ scores. Cronbach alphas for the scores on the subscales
were .88 for relatedness to parent, .82 for relatedness to instructors, .81 for relatedness to friends,
and .84 for relatedness to classmates. For the university sample in this study I obtained Cronbach
alphas of .88 for relatedness to parent, .86 for relatedness to instructor, .88 for relatedness to on-
campus friends, and .87 for relatedness to off-campus friends.
Sense of belonging on campus
Students’ sense of belonging on campus was measured by the Sense of Belonging subscale of
the Perceived Cohesion Scale (PCS; Bollen & Hoyle, 1990). The three items of this measure are
“I see myself as a part of the campus community,” “I feel a sense of belonging to the campus
community,” and “I feel that I am a member of the campus community.” Response options on
this subscale range on an 11-point Likert scale from 0 (strongly disagree) to 10 (strongly agree).
Bollen and Hoyle conducted a factor analysis of the responses of 102 undergraduates at a private
liberal arts college and found that all three items loaded on one latent variable they identified as
Sense of Belonging. In a study of 272 Latino undergraduates, Hurtado and Carter (1997)
obtained a Cronbach alpha of .94 for the participants’ scores on the 11 items, and a factor
analysis indicated that all three items loaded on the Sense of Belonging factor. Mounts (2004)
administered the sense of belonging subscale to 319 freshmen students and obtained a Cronbach
alpha of .89 for African American students and a Cronbach alpha of .91 for White students. I
obtained a Cronbach alpha of .96 for the university sample in this study.
Theory of intelligence
Participants’ theory of intelligence was measured using the Theory of Intelligence Scale
(Dweck, Chiu, & Hong, 1995). This 3-item instrument measures implicit beliefs about

76
intelligence with response options on a 6-point Likert scale ranging from 0 (strongly agree) to 5
(strongly disagree). The items are “you have a certain amount of intelligence, and you can’t
really do much to change it,” “your intelligence is something about you that you can’t change
very much,” and “you can learn new things, but you can’t really change your basic intelligence.”
Participants’ scores are averaged with a higher score indicating an incremental belief. Dweck et
al. (1995) reported internal reliabilities ranging from .94 to .98 across six studies for the Theory
of Intelligence Scale. They also reported a 2-week test-retest reliability coefficient of .80. Factor
analyses were conducted for five different data sets, and the three items loaded consistently on
one factor. For the university sample in this study I obtained a Cronbach alpha of .93.
Personality
Personality was measured by the Conscientiousness subscale of the Big Five Inventory
(BFI; John et al., 1991). The BFI is a 54-item instrument that measures the five personality
dimensions, extraversion, openness, conscientiousness, agreeableness, and neuroticism. Items are
rated on a 5-point Likert scale from 0 (disagree strongly) to 4 (agree strongly). There are nine
items for the Conscientiousness subscale. Sample items for Conscientiousness include “does a
thorough job” and “perseveres until the task is finished.” John and Srivastava (1999) surveyed a
sample of 462 undergraduates at the University of California, Berkeley, and obtained a
Cronbach’s alpha of .82 for students’ scores on the Conscientiousness subscale.
Providing support for convergent validity for the Conscientiousness subscale, John and
Srivastava (1999) compared the BFI and two other personality measures, the Trait Descriptive
Adjectives (TDA; Goldberg, 1992) and the NEO Five Factor Inventory (NEO-FFI; Costa &
McCrae, 1992). The uncorrected pairwise convergent validity estimate for students’ scores on
the Conscientiousness subscale of the BFI and the Conscientiousness subscale of the TDA was
.81, and for scores on the Conscientiousness subscale of the BFI and the Conscientiousness

77
subscale of the NEO-FFI, .79. The corrected pairwise convergent validity estimate for scores on
the Conscientiousness subscale of the BFI and the Conscientiousness subscale of the TDA was
.94, and for the Conscientiousness subscale of the BFI and the Conscientiousness subscale of the
NEO-FFI, .96. John and Srivastava (1999) also conducted a confirmatory factor analysis to test
the convergent and discriminant of the BFI, the TDA, and the NEO-FFI. The CFA estimated the
latent factors of the Big Five personality characteristics. The standardized validity coefficient
obtained from the CFA for the Conscientiousness subscale of the BFI was .92. I obtained a
Cronbach alpha of .82 for the university sample in this study.
Socioeconomic status
Socioeconomic status was determined using the Four Factor Index of Social Status (FFISS;
Hollingshead, 1975). The FFISS is a multidimensional measure that takes into consideration the
person’s education, occupation, gender, and marital status to determine socioeconomic status.
The FFISS consists of the sum of the two weighted factor scores, the education factor and the
occupation factor. Education scores range from 1 (less than seventh grade completed) to 7
(graduate professional training completed). Occupation scores range from 1 (e.g., farm laborers,
low-level service workers) to 9 (e.g., higher executives, proprietors of large businesses, major
professionals). The FFISS is calculated by multiplying the occupation scale score by 5 and the
education scale score by 3 and adding these scores together. If a person is married then the scores
for each spouse are averaged together (Hollingshead, 1975).
As evidence of validity, Hollingshead (1975) reported a correlation of .93 between the
occupation group scores of the FFISS and the National Opinion Research Center’s occupational
prestige scores. Hollingshead showed that the number of school years completed was positively
correlated with occupation score on the FFISS for males (r = .84, p < .001) and females (r = .85,
p < .001) using data from the 1970 census. In addition median earned income was positively

78
correlated with occupation scores on the FFISS for males (r = .78, p < .001) and females (r = .67,
p < .001) using data from the 1970 census (Hollingshead, 1975).
Gottfried (1985) compared scores on the FFISS to the Revised Duncan (TSEI2)
Socioeconomic Index and the Seigel 1965 NORC Prestige Scale using data from parents of 130
infants recruited from birth announcements. Gottfried reported a correlation of .79 between the
FFISS and the Revised Duncan Socioeconomic Index and a correlation of .73 (p < .001) between
the FFISS and the Seigel Prestige Scale.
Demographic information
For this study, students’ gender, ethnicity, age, and extracurricular activities were
obtained from their self-reports. Students were also asked to report SAT or ACT scores, and high
school GPA and to give permission for validation of those scores from the registrar.
Outcome Variables
Social adjustment
Social adjustment was measured by the social adjustment subscale of the Student
Adaptation to College Questionnaire (SACQ; Baker & Siryk, 1989). The SACQ is designed to
assess student adjustment to college. The social adjustment subscale measures students’ success
in coping with the interpersonal-societal demands in the college experience. This 20-item
subscale is measured on a 9-point Likert scale ranging from 0 (applies very closely to me) to 8
(doesn’t apply to me at all). The social adjustment subscale can be divided into four clusters:
general, other people, nostalgia, and social environment. The general cluster measures the extent
and success of social functioning in general. The other people cluster measures involvement and
relationships with people on campus. The nostalgia cluster measures dealing with being away
from home and the social environment cluster measures satisfaction with the social environment
(Baker & Siryk, 1989).

79
The SACQ Manual reports 14 studies at two colleges where the SACQ was administered
to first- and second-semester freshmen. Alpha coefficients for students’ scores on the social
adjustment subscale ranged from .83 to .91. The manual also includes 11 other university data
sets. The alpha coefficients for students’ scores on the social adjustment subscale range from .73
to .91. For criterion-related validity, a social activities checklist that included items about campus
involvement, attendance of campus events, and use of recreational facilities was used. There was
a significant relationship between the social activities checklist and the social adjustment
subscale, but not any of the other subscales (Baker & Siryk, 1989). Wick and Shilkret (1986)
reported a significant relationship between the amount of extracurricular activity and the social
adjustment subscale (r = .47, p < .01). Savino, Reuter-Krohn, and Costar (1986) found
significant negative correlations between the number of visits the student made home and the
social adjustment subscale. The significant correlations between social adjustment and
participation in social and extracurricular activities and the number of visits the student made
home provide evidence of the criterion-related validity of participants’ scores on the SACQ..
With regard to construct validity, Caro (1985) reported significant negative correlations
between the social adjustment subscale and emotional reliance on other persons (r = -.23, p <
.01), lack of social self-confidence (r = -.43, p < .01), Social Avoidance and Distress Scale (r = -
.52, p < .01), and the Revised UCLA Loneliness Scale (r = -.66, p < .01). Harris (1988) also
reported a significant negative correlation between the Revised UCLA Loneliness Scale and the
social adjustment subscale (r = -.79, p < .01). Saracoglu (1987) reported significant positive
correlations between the social adjustment subscale and the Self-Esteem Inventory (r = .63, p <
.01), the Self-Efficacy Scale (r = .37, p < .05), and social self-efficacy (r = .58, p < .01).

80
Flescher (1986) found a significant positive correlation between the social adjustment
subscale and the full Mental Health Inventory (r = .45, p < .01), the positive affect subscale (r =
.40, p < .01), and the psychological well-being subscale (r = .30, p < .05). There were also
significant negative correlations between social adjustment and the anxiety subscale (r = -.38, p
< .05), the depression subscale (r = -.36, p < .05), and the psychological distress subscale (r = -
.50, p < .01) The significant positive correlations between positive mental health constructs and
negative correlations between negative mental health constructs provide evidence of the
construct validity of the participants’ scores on the social adjustment subscale.
In another example of the construct validity of the social adjustment subscale, Caro
(1985) reported a significant positive correlation between social adjustment and perceived social
support from friends (r = .36, p < .01). Hogan (1986) also reported a significant positive
correlation (r = .31, p < .01). Savino et al. (1986) found significant positive correlations between
social adjustment and social support (total scale) during Semester 1 (r = .30, p < .01) and
Semester 2 (r = .40, p < .01). The significant correlations between social support measures and
social adjustment support the construct validity of participants’ scores on the social adjustment
subscale.
Baker and Siryk (1989) also reported correlations between the SACQ subscales and
attrition after 1 year at Clark University. For six of the eight data sets there was a significant
negative correlation between the social adjustment subscale and first-year attrition, suggesting
the importance of social adjustment to college retention. Overall the psychometric data on the
social adjustment subscale of the SACQ support its use in the study of college retention. For the
university sample in this study I obtained a Cronbach alpha of .90.

81
Academic achievement
Students were asked to report their overall GPA and were also asked for their permission to
obtain their GPA from the registrar. Only 120 students gave permission to have their GPAs
obtained from the registrar. Because this number was insufficient to test the proposed model,
students’ self-reports of their GPA were used as the measure of academic achievement. In a
meta-analysis of self-reported grades, class ranks, and test scores, From a meta-analysis of 12
studies of the validity of self-reported GPA in 12,089 college students, Kuncel, Credé, and
Thomas (2005) found that the accuracy of self-reported GPAs was sufficiently high (r = .90) to
warrant use in educational research.
Intention to persist
Intention to persist was measured using a single item adapted from Hausmann et al.
(2007), “How confident are you that you will complete your intended degree at your current
institution?” Students responded on a 7-point Likert scale ranging from 1 (not at all confident) to
7 (very confident). Cabrera, Nora, and Castaneda (1993) tested a structural equation model of
college retention with 2,459 freshmen at a large southern university where persistence was
measured by students re-enrolling the next fall and found that intention to persist had the
strongest direct effect on actual persistence (.49).
Analyses
I used structural equation modeling to estimate the relationships in my model. The model
contained eight endogenous variables, perceived academic self-efficacy, mastery goals,
performance-avoid goals, commitment making, identification with commitment, academic
achievement, social adjustment, and intention to persist. The model contained 10 exogenous
variables, parental involvement, parent relatedness, parental autonomy support, off-campus

82
friend relatedness, instructor relatedness, on-campus friend relatedness, sense of belonging,
extracurricular activities, conscientiousness, and entity beliefs.

83
CHAPTER 3 RESULTS
The purpose of this study was to test a new model of college retention that focused on the
relationships among the family, peer, and college microsystems, the self-system, the
psychological processes of identity, goal orientations, and perceived academic self-efficacy, and
the outcome variables, academic achievement, social adjustment, and intention to persist. In this
chapter the demographic characteristics of the sample, descriptive statistics, analysis of the
hypothesized model, revisions to the model, and the results of testing the research hypotheses are
described.
Descriptive Statistics
The university sample consisted of 299 participants. The sample was predominantly
female (81%) and Caucasian (66%). Demographic data are presented in Table 3-1. The age range
for this sample was 18-45. For data analysis I only included participants up to 26 years of age
because 26 is considered the last year of emerging adulthood according to Arnett (2000, 2006).
The mean SES score on the FFISS was 31.61, indicating a predominantly middle-class sample.
Means and standard deviations for all the variables are reported in Table 3-2. The mean self-
reported college GPA was 3.33. The correlation matrix is presented in Table 3-3.
Analysis of the Proposed Model
The hypothesized model was estimated using MPlus. Because the sample was
predominantly female, the data were weighted by gender according to the national college
enrollment by gender in 2005. In the fall of 2005, 43% of all enrolled students were male and
57% were female (National Center for Education Statistics, 2008). Gender was weighted .43 for
males and .57 for females. To control for causes that were left out of the model, high school
GPA, gender, and ethnicity were included as predictors for every endogenous variable. SAT

84
scores were not used as a control variable in the test of the original or the revised model because
scores ranged from 830 to 2140, indicating that some students were reporting more than the total
of their verbal and quantitative scores. Consequently, it was impossible to determine which
scores students were reporting. Instead of the SAT, high-school GPA was used as the control for
prior ability. Preliminary analyses of the SES data and student comments about the measure
suggested that students may not have reported accurate information on which to base their SES,
so SES was dropped from further analyses. Because there were too few participants to include
each ethnicity separately in the analyses, students were split into two groups as follows: (a)
Caucasian and Asian students, and (b) African American, Hispanic, Native American, and
students who classified themselves as other. The goodness of fit test result was χ 2 (36) = 159.22,
p = .00, indicating that the model did not fit the data. Other goodness of fit indices included the
comparative fit index (CFI) = .38, the Tucker-Lewis index (TLI) = -.08, and the root mean
square error of approximation (RMSEA) = .21. All of these indices indicated poor fit.
An analysis of the modification indices showed that some of the relationships could be
improved. The largest modification index was between Commitment Making and Identification
with Commitment (68.04). I allowed these errors to correlate. I ran the analysis again and the
model still had poor fit, χ 2 (34) = 91.73, p = .00, CFI = .71, TLI = .46, RMSEA = .09. The
largest modification index was 34.27 between perceived self-efficacy and Identification with
Commitment. I added a path from Identification with Commitment to perceived self-efficacy, but
the model still had poor fit, χ 2 (34) = 58.68, p = .005, CFI = .88, TLI = .77, RMSEA = .06. The
largest modification index was 11.05 between perceived self-efficacy and conscientiousness so I
added a path from conscientiousness to perceived self-efficacy. This time the model fit was
better, but still not very good. The goodness of fit test result was χ 2 (33) = 47.34, p = .05, CFI =

85
.92, TLI = .86, RMSEA = .04. The largest modification index was 4.93 between perceived self-
efficacy and performance-avoid goals, so I added a path from self-efficacy to performance-avoid
goals. The model was run again and the goodness of fit indices were χ 2
Research Hypotheses
(33) = 44.07, p = .09,
CFI = .95, TLI = .89, RMSEA = .04, indicating a good fit. See Table 3-4 for a list of the total,
direct, and indirect effects in the revised model.
The following research hypotheses were tested, with high-school GPA, gender, and
ethnicity controlled. These variables are not mentioned in the statement of each hypothesis.
However, when the effects of those variables were significant, they are included in the
description of the effects for the hypothesis.
Hypothesis 1 was, academic achievement, social adjustment, perceived academic self-
efficacy, commitment making, identification with commitment, parental autonomy support,
instructor relatedness, on-campus friend relatedness, sense of belonging, extracurricular
activities, and entity beliefs predict intention to persist. The only significant direct path to
intention to persist was from perceived self-efficacy (β = .29, p = .000). However,
conscientiousness has an indirect relationship to intention to persist through perceived self-
efficacy (γ = .08, p = .001) and through identification with commitment and perceived self-
efficacy (γ = .02, p = .005). A significant indirect effect to sense of belonging was mediated
through identification with commitment and self-efficacy (γ = .01, p = .01), and a significant
indirect effect of identification with commitment on intentions to persist was mediated through
self-efficacy (β = .05, p = .000).
Hypothesis 2 was perceived academic self-efficacy, commitment making, identification
with commitment, mastery goals, performance-avoid goals, parental involvement, parental
autonomy support, instructor relatedness, extracurricular activities, entity beliefs, and

86
conscientiousness predict academic achievement. Results indicated significant direct paths to
academic achievement from entity beliefs (γ = .14, p = .04), performance-avoid goals (β = -.20,
p = .0005), self-efficacy (β = .17, p = .005), and ethnicity group (γ = .37, p = .002). In addition
significant indirect effects of entity beliefs on achievement were mediated through performance-
avoid goals (γ = -.04, p = .02) and from self-efficacy that were mediated through performance-
avoid goals (β = .03, p = .02). Four significant indirect effects on academic achievement were
also found: from conscientiousness mediated through perceived self-efficacy (γ = .05, p = .02),
from conscientiousness mediated through identification with commitment and perceived self-
efficacy (γ = .009, p = .02), from conscientiousness mediated through perceived self-efficacy
and performance-avoid goals (γ = .008, p = .04), and from conscientiousness mediated through
identification with commitment, perceived self-efficacy, and performance-avoid goals (γ = .002,
p = .04). In addition there were two significant indirect effects on academic achievement from
identification with commitment. One was mediated through perceived self-efficacy (β = .03, p =
.008) and the other was mediated through perceived self-efficacy and performance-avoid goals
(β = .005, p = .02).
Hypothesis 3 was perceived academic self-efficacy, commitment making, identification
with commitment, mastery goals, performance-avoid goals, parental autonomy support, off-
campus friend relatedness, instructor relatedness, on-campus friend relatedness, extracurricular
activities, and sense of belonging predict social adjustment. There were several significant direct
paths to social adjustment including from parental autonomy support (γ = .23, p = .005), on-
campus friend relatedness (γ = .14, p = .01), sense of belonging (γ = .34, p = .001),
extracurricular activities (γ = .21, p = .001), performance-avoid goals (β = -.17, p = .0005), and
self-efficacy (β = .13, p = .003). There were also significant paths from gender (γ = .11, p = .03)

87
and high school GPA (γ = .14, p = .02). Academic self-efficacy also had a significant indirect
effect on social adjustment that was mediated through performance-avoid goals (β = .02, p =
.02). In addition, there were two significant indirect effect of identification with commitment.
One was mediated through perceived self-efficacy (β = .02, p = .006) and the other was mediated
through perceived self-efficacy and performance-avoid goals (β = .004, p = .02).
Hypothesis 4 was perceived academic self-efficacy, parent relatedness, sense of
belonging, and entity beliefs predict mastery goals. There were significant paths from entity
beliefs (γ = -.17, p = .006) and perceived self-efficacy (β = .15, p = .0005). There was also a
significant path from gender (γ = .16, p = .004). In addition there was an indirect effect of sense
of belonging that was mediated through identification with commitment and perceived academic
self-efficacy (γ = .006, p = .013).
Hypothesis 5 was perceived academic self-efficacy, sense of belonging, and entity beliefs
predict performance-avoid goals. There were significant paths from entity beliefs (γ = .18, p =
.006) and perceived self-efficacy (β = -.14, p = .007). There was also a significant direct effect
from gender (γ = -.13, p = .03). In addition, there was a significant indirect effect from sense of
belonging that was mediated through identification with commitment and perceived academic
self-efficacy (γ = -.006, p = .027).
Hypothesis 6 was parental involvement, instructor relatedness, and sense of belonging
predict perceived academic self-efficacy. There were significant paths from instructor
relatedness (γ = .14, p = .05), conscientiousness (γ = .29, p = .000), and identification with
commitment (β = .19, p = .000). There was also a significant path from ethnicity group (γ = .11,
p = .05). In addition a significant indirect effect of sense of belonging was found that was
mediated through identification with commitment (γ = .04, p = .004). There was also an indirect

88
effect of conscientiousness that was mediated through identification with commitment (γ = .06, p
= .0005).
Hypothesis 7 was parental autonomy support, parent relatedness, sense of belonging, and
conscientiousness predict commitment making. Significant paths were from parental autonomy
support (γ = .15, p = .02), sense of belonging (γ = .14, p = .04) and conscientiousness (γ = .29, p
= .000).
Hypothesis 8 was parental autonomy support, sense of belonging, and conscientiousness
predict identification with commitment. Significant paths were from sense of belonging (γ = .23,
p = .001) and conscientiousness (γ = .31, p = .000).

89
Table 3-1 Demographic data Measure % N Gender Male 19% 58 Female 81% 240 Ethnicity Caucasian 66% 196 African American 16% 49 Hispanic 9% 27 Asian 3% 9 Native American 0.3% 1 Other 5% 16 Class Freshmen 19% 58 Sophomore 17% 52 Junior 31% 93 Senior 28% 84 Other 4% 12

90
Table 3-2 Means and standard deviations of variables Variable N M SD Min Max Commitment making 298 2.93 0.74 0.00 4.00 Identification with commitment 297 2.86 0.77 0.00 4.00 Academic self-efficacy 296 4.66 0.91 0.25 6.00 Mastery goals 297 2.52 0.71 0.33 4.00 Performance-Avoid goals 293 1.80 0.94 0.00 4.00 Parental involvement 289 1.59 0.56 0.00 2.75 Parental relatedness 296 5.34 0.98 1.00 6.00 Instructor relatedness 299 3.58 1.24 0.25 6.00 On-Campus friend relatedness 298 4.63 1.14 0.75 6.00 Off-Campus friend relatedness 297 5.18 1.02 0.50 6.00 Parental autonomy support 294 3.40 0.74 0.00 4.00 Sense of belonging 297 1.96 0.74 0.00 3.00 Conscientiousness 295 25.29 5.94 10.00 36.00 Entity beliefs 296 2.13 1.29 0.00 5.00 Extracurricular activities 285 2.10 1.83 0.00 10.00 Social adjustment 298 5.60 1.34 1.06 8.00 College GPA 251 3.33 0.45 1.58 4.00 Intention to persist 297 5.51 0.94 0.00 6.00 High school GPA 276 3.99 0.64 1.65 6.70 SAT total score 192 1223.86 174.26 830.00 2140.00 ACT total score 144 25.66 3.89 14.00 38.00 SES 249 31.61 7.70 11.00 55.00 Age 298 20.87 2.97 18.00 45.00

91
Table 3-3 Correlation matrix CM IC MG P-AG SE PI PR PA OFR IR OCR SB
CM 1.00 IC ****.79 1.00 MG ***.24 ***.26 1.00 P-AG -.12 -.09 -.09 1.00 SE *.17 ***.23 ****.33 *-.17 1.00 PI -.02 .04 .05 .10 -.06 1.00 PR .03 .09 .09 -.02 -.01 ***.44 1.00 PA **.21 *.17 *.18 *-.18 .04 -.07 ***.26 1.00 OFR **.21 ****.29 **.21 -.03 .08 *.18 ***.27 .12 1.00 IR -.01 .07 **.21 .04 **.23 **.24 .13 .00 **.22 1.00 OCR .01 .14 .13 -.07 .12 ***.24 ****.30 .05 ****.44 ***.24 1.00 SB .13 **.22 .13 -.03 .06 *.15 **.21 .12 .09 .13 ****.29 1.00 EX .04 .06 .01 -.00 .01 .04 .06 -.06 -.05 -.08 .04 ****.32 CO **.23 ****.31 ***.26 -.20 ****.29 .07 *.18 **.20 **.20 **.20 **.19 **.23 EN -.12 -.03 **-.20 **.21 *-.14 -.00 -.00 -.11 -.11 -.00 .04 .05 HSGPA .03 .06 *-.15 .11 -.02 .10 .01 -.04 -.04 -.07 .08 .02 Gender .05 .03 **.21 -.11 .08 -.05 -.05 .03 .00 *.15 .03 -.12 Group -.01 -.05 -.01 .06 .08 .06 .03 .12 **.22 *.16 .09 -.10 SA *.14 *.17 *.15 **-.23 *.18 .12 ***.25 ****.29 **.22 .12 ****.35 ****.53 GPA .10 .14 -.04 *-.17 **.21 .02 .06 .07 .10 .07 -.01 .11 INPS .04 -.01 .13 .01 ****.27 .08 *.16 -.04 -.05 .03 -.03 .00
Note. CM = commitment making; IC = identification with commitment; MG = mastery goals; P-AG = performance-avoid goals; SE = academic self-efficacy; PI = parental involvement; PR = parent relatedness; PA = parental autonomy support; OFR = off-campus friend relatedness; IR = instructor relatedness; OCR = on-campus friend relatedness; SB = sense of belonging; EX = extracurricular activities; CO = conscientiousness; EN = entity beliefs; HSGPA = high school GPA; Group = ethnicity group; SA = social adjustment; INPS = intention to persist. *p < .05. **p < .01. ***p < .001. ****p < .0001.

92
Table 3-3 Continued EX CO EN HSGPA Gender Group SA GPA INPS EX 1.00 CO *.15 1.00 EN .01 -.13 1.00 HSGPA .09 .05 *.14 1.00 Gender *-.14 ***-.24 -.04 *-.16 1.00 Group -.10 -.06 .06 .00 -.01 1.00 SA ****.33 ***.27 -.05 .10 .03 -.02 1.00 GPA *.15 *.14 .11 .09 -.06 ****.31 *.18 1.00 INPS .04 .07 -.08 -.01 .05 -.11 *.14 *.14 1.00
Note. EX = extracurricular activities; CO = conscientiousness; EN = entity beliefs; HSGPA = high school GPA; Group = ethnicity group; SA = social adjustment; INPS = intention to persist. *p < .05. **p < .01. ***p < .001. ****p < .0001.

93
Table 3-4 Total, direct, and indirect effects in the revised model Variable Effect CM IC MG P-AG SE SA GPA INPS Group Total -.02 -.08 -.10 .01 .10 .04 ****.32 -.09 Direct -.02 -.08 -.11 .02 *.11 .07 ***.37 -.09 Indirect -- -- .01 -.01 -.01 -.03 -.05 .00 Gender Total .07 .07 **.17 *-.14 .04 **.13 .03 .02 Direct .07 .07 **.16 *-.13 .03 *.11 .01 -.01 Indirect -- -- .01 -.01 .01 .02 .02 .03 HSGPA Total .05 .04 -.02 .00 .04 **.13 .08 .03 Direct .05 .04 -.03 .01 .03 *.14 .09 .01 Indirect -- -- .01 -.01 .01 -.01 -.01 .02 PI Total -- -- -.01 .01 -.04 -.01 -.05 -.02 Direct -- -- -- -- -.04 -- -.04 -- Indirect -- -- -.01 .01 -- -.01 -.01 -.02 PR Total -.09 -- .02 -- -- .07 .10 .13 Direct -.09 -- .02 -- -- -- -- -- Indirect -- -- -- -- -- .07 .10 .13 PA Total *.15 .09 -- -- .02 **.17 -.04 -.09 Direct *.15 .09 -- -- -- **.23 .03 -.04 Indirect -- -- -- -- .02 -.06 -.07 -.05 OFR Total -- -- -- -- -- -- .01 Direct -- -- -- -- -- .10 -- -- Indirect -- -- -- -- -- -- .01 IR Total -- -- .02 -.02 *.14 .02 .02 .05 Direct -- -- -- -- *.14 .00 -.01 -- Indirect -- -- .02 -.02 -- .02 .03 .05 OCR Total -- -- -- -- -- **.14 -- -.15 Direct -- -- -- -- -- **.14 -- -.17 Indirect -- -- -- -- -- -- -- .02 SB Total *.14 ***.23 .07 -.01 -.01 ****.39 .10 -.03 Direct *.14 ***.23 .07 -.01 -.05 ***.34 -- -.19 Indirect -- -- -.00 .00 ***.04 .05 .10 .16
Note. CM = commitment making; IC = identification with commitment; MG = mastery goals; P-AG = performance-avoid goals; SE = academic self-efficacy; PI = parental involvement; PR = parent relatedness; PA = parental autonomy support; OFR = off-campus friend relatedness; IR = instructor relatedness; OCR = on-campus friend relatedness; SB = sense of belonging; EX = extracurricular activities; CO = conscientiousness; EN = entity beliefs; HSGPA = high school GPA; Group = ethnicity group; SA = social adjustment; INPS = intention to persist. *p < .05. **p < .01. ***p < .001. ****p < .0001.

94
Table 3-4 Continued Variable Effect CM IC MG P-AG SE SA GPA INPS EX Total -- -- -- -- -- ***.21 .13 .01 Direct -- -- -- -- -- ***.21 .13 -.03 Indirect -- -- -- -- -- -- -- .04 CO Total ****.29 ****.31 **.05 *-.05 ****.35 .05 *.15 *.14 Direct ****.29 ****.31 -- -- ****.29 -- .05 -- Indirect -- -- **.05 *-.05 ***.06 .05 .10 *.14 EN Total -- -- **-.17 **.18 -- -.02 .12 .00 Direct -- -- **-.17 **.18 -- -- *.14 -.01 Indirect -- -- -- -- -- -.02 -.02 .01 CM Total -- -- -- -- -- -.82 -1.1 -1.16 Direct -- -- -- -- -- -.82 -1.1 -1.16 Indirect -- -- -- -- -- -- -- -- IC Total -- -- **.03 **-.03 ****.19 .80 1.18 1.45 Direct -- -- -- -- ****.19 .77 1.15 1.16 Indirect -- -- **.03 **-.03 -- **.03 **.03 .29 MG Total -- -- -- -- -- -.05 -.08 -- Direct -- -- -- -- -- -.05 -.08 -- Indirect -- -- -- -- -- -- -- -- AG Total -- -- -- -- -- ***-.17 ***-.20 -- Direct -- -- -- -- -- ***-.17 ***-.20 -- Indirect -- -- -- -- -- -- -- -- SE Total -- -- ***.15 **-.14 -- ***.15 **.19 ****.33 Direct -- -- ***.15 **-.14 -- **.13 **.17 ****.29 Indirect -- -- -- -- -- .02 .02 .04 SA Total -- -- -- -- -- -- -- .14 Direct -- -- -- -- -- -- -- .14 Indirect -- -- -- -- -- -- -- -- GPA Total -- -- -- -- -- -- -- .10 Direct -- -- -- -- -- -- -- .10 Indirect -- -- -- -- -- -- -- --
Note. CM = commitment making; IC = identification with commitment; MG = mastery goals; AG = performance-avoid goals; SE = academic self-efficacy; PI = parental involvement; PR = parent relatedness; PA = parental autonomy support; OFR = off-campus friend relatedness; IR = instructor relatedness; OCR = on-campus friend relatedness; SB = sense of belonging; EX = extracurricular activities; CO = conscientiousness; EN = entity beliefs; HSGPA = high school GPA; Group = ethnicity group; SA = social adjustment; INPS = intention to persist. *p < .05. **p < .01. ***p < .001. ****p < .0001.

95
Table 3-5 Effects proposed in original model and effects in revised model Variable CM IC MG AG SE GPA SA INPS PI - - PR - - PA * - - * - OFR - IR * - - OCR * - SB * * - - - * - EX - * - CO * * + - EN * * * - CM - - - IC + - - - MG - - AG * * SE * + * * * GPA - SA -
Note: CM = commitment making; IC = identification with commitment; MG = mastery goals; AG = performance-avoid goals; SE = academic self-efficacy; PI = parental involvement; PR = parent relatedness; PA = parental autonomy support; OFR = off-campus friend relatedness; IR = instructor relatedness; OCR = on-campus friend relatedness; SB = sense of belonging; EX = extracurricular activities; CO = conscientiousness; EN = entity beliefs; HSGPA = high school GPA; Group = ethnicity group; SA = social adjustment; INPS = intentions to persist. * = hypothesized relationship that was significant in revised model. - = hypothesized relationship that was not significant in revised model. + = significant relationship that was not proposed in the original model.

96
CHAPTER 4
DISCUSSION
The purpose of this study was to test a model of college success and retention based on a
bioecological perspective (Bronfenbrenner & Morris, 1998). This new bioecological systems
model of college retention focused on the ecological systems of family, peer, college, and the
self that predict college success and the psychological processes (identity, perceived academic
self-efficacy, and achievement goals) that mediate the relationship between the ecological
systems and college success. This model addressed weaknesses in the research literature by
combining the sociological and psychological perspectives that are commonly used in the college
retention literature. A preliminary analysis indicated a poor fit of the model to the data. On the
basis of the modification indices, I added three paths and one correlated error. In the next section
I summarize the results for each of the microsystems. Finally, I identify weaknesses in the study
and discuss directions for future research and implications for theory and practice.
The Bioecological Systems
The Family Microsytem
Within the family microsytem I hypothesized that parental involvement predicts perceived
academic self-efficacy and GPA; relatedness to parents predicts commitment making and
mastery goals, and parental autonomy support predicts commitment making, identification with
commitment, GPA, social adjustment, and intention to persist. However, only the hypothesized
effects of parental autonomy support on commitment making (γ = .15, p = .02) and social
adjustment (γ = .23, p = .005) were confirmed. That finding that parental autonomy support is
related to social adjustment supports the findings of Soenens et al. (2007). In addition, the
finding that parental autonomy support is related to commitment making supports the findings of
Luyckx, Goossens, et al. (2006), and Luyckx, Soenens, Vansteenkiste, et al. (2007). However,

97
parental autonomy support does not predict identification with commitment, as found in Luyckx,
Goossens, et al. and Luyckx, Soenens, Vansteenkiste, et al. The participants in these two studies
were Belgian college students, most of whom lived at home. Parental autonomy support might be
more important to identity when students live with their parents as most of the students in my
university sample do not live at home (87%). In sum, only the parental variable of autonomy
support is related to other variables in the model, specifically identity and social adjustment,
even if college students do not live at home.
The Peer Microsystem
I hypothesized that relatedness to off-campus friends predicts social adjustment. However,
results indicate that relatedness to off-campus friends is not related to social adjustment. In
contrast, relatedness to on-campus friends is a significant predictor of social adjustment,
suggesting that on-campus friends may matter to social adjustment, but off-campus friends may
not.
The College Microystem
I hypothesized that the college microsystem variable of relatedness to instructors predicts
perceived academic self-efficacy, GPA, and social adjustment; on-campus relatedness to friends
predicts social adjustment and intention to persist; sense of belonging predicts commitment
making, identification with commitment, mastery goals, performance-avoid goals, perceived
academic self-efficacy, social adjustment, and intention to persist, and extracurricular activities
predict GPA, social adjustment, and intention to persist. Results indicate that relatedness to
instructors is only significantly related to perceived academic self-efficacy (γ = .14, p = .05).
This result with university students is consistent with Cordell-McNulty and Ashton’s (2008)
result with community college students, suggesting that instructors may play a role in increasing
the motivation of college students.

98
As noted in the previous section, relatedness to friends predicts social adjustment (γ = .14,
p = .01) as expected. This result supports the findings of Buote et al. (2007) and Friedlander et
al. (2007) that friends play a role in the social adjustment of college students.
Of all the variables in the college microsystem, sense of belonging has the largest number
of significant relationships to other variables in the model. Sense of belonging is a significant
predictor of commitment making (γ = .14, p = .04), identification with commitment (γ = .23, p =
.001), and social adjustment (γ = .34, p = .001). That sense of belonging is directly related to the
psychological process variables of commitment making and identification with commitment
lends support to Rodgers and Summers’s (2008) model, in which sense of belonging is
hypothesized to predict psychological process variables. In addition, sense of belonging is
indirectly related to the psychological process variables, mastery goals (γ = .006, p = .013),
performance-avoid goals (γ = -.006, p = .027), and academic self-efficacy (γ = .04, p = .004).
through identification with commitment. The finding that sense of belonging is directly related to
social adjustment is consistent with the findings of Mounts (2004) and Ostrove and Long (2007).
Sense of belonging is also related to intention to persist through identification with commitment
and perceived academic self-efficacy (γ = .01, p = .01).
The number of students’ extracurricular activities are positively associated with social
adjustment (γ = .21, p = .001). This result is consistent with findings of Bohnert et al. (2007)
who found a negative relationship between the number of hours a week students engaged in
extracurricular activities and loneliness and a positive relationship between the number of hours
students spent in extracurricular activities and the quality of their friendships. However,
participation in extracurricular activities is not related to GPA or intention to persist in contrast
to findings of Fischer (2007) and Cordell-McNulty and Ashton (2008) who reported significant

99
relationships between participation in extracurricular activities and GPA. It is notable that those
two studies focused on students in the first 2 years of college, whereas most of the students in
this study (59%) were in their last 2 years of college. Perhaps involvement in extracurricular
activities in the later years of college is less important to achievement than it is in the first 2
years.
The Self-System
I hypothesized that (a) the self-system variable of conscientiousness predicts commitment
making, identification with commitment, perceived self-efficacy, and GPA; (b) the self-system
variable of entity beliefs predicts mastery and performance-avoid goals, and academic
achievement, and (c) the self-system variable of academic achievement predicts academic
achievement and intention to persist. Conscientiousness is directly related to the psychological
process variables of commitment making (γ = .29, p = .000), identification with commitment (γ
= .31, p = .000), and perceived academic self-efficacy (γ = .29, p = .000). The significant
relationship between conscientiousness and commitment making and identification with
commitment supports the findings of Luyckx, Soenens, and Goossens (2006). The finding that
conscientiousness predicts perceived academic self-efficacy was not hypothesized in the original
model but was added based on the modification indices. In addition, conscientiousness is
indirectly related to GPA through four psychological process variables: perceived academic self-
efficacy (γ = .05, p = .02), identification with commitment and perceived academic self-efficacy
(γ = .009, p = .02), perceived academic self-efficacy and performance-avoid goals (γ = .008, p =
.04), and identification with commitment, perceived academic self-efficacy, and performance-
avoid goals (γ = .002, p = .04). These indirect relationships suggest paths through which
conscientiousness affects GPA, and they lend support to the results of Nguyen et al. (2005) and
Wolfe and Johnson (1995), who also found that conscientiousness is related to GPA.

100
Consistent with my hypotheses and the findings of Robins and Pals (2002), entity beliefs
are positively related to performance-avoid goals (γ = .18, p = .006) and negatively related to
mastery goals (γ = -.17, p = .006); however, contrary to expectation and the theoretical literature
and previous research, entity beliefs (e.g., Aronson, 200) are positively related to GPA (γ = .14, p
= .04). In this study, the correlation between entity beliefs and high-school GPA is
nonsignificant, suggesting that this relationship may not be a reliable finding. Entity beliefs are
also indirectly related to GPA through performance-avoid goals (γ = -.04, p = .02). This indirect
relationship of entity beliefs with GPA is in the hypothesized direction.
Previous achievement, as measured by high school GPA, is directly related to social
adjustment (γ = .14, p = .02). However, high school GPA was not related to college GPA, as has
been typically found in previous research (e.g., Elias & MacDonald, 2007; Fischer, 2007;
Mattson, 2007; Robbins et al., 2004; Robbins et al., 2006). This finding could be related to the
restriction in range in high school and college GPAs in this university sample.
The Macrosytem
Gender is significantly negatively related to performance-avoid goals, (γ = -.13, p = .03),
and positively related to mastery goals (γ = .16, p = .004), and social adjustment (γ = .11, p =
.03), with males less likely to have performance-avoid goals and more likely to have mastery
goals, and to be socially adjusted.
Ethnicity predicts perceived academic self-efficacy (γ = .11, p = .05) and GPA (γ = .37, p
= .002). Students classified as Caucasian and Asian report higher perceived academic self-
efficacy and GPAs compared to students in other ethnic groups. The finding that ethnicity is
related to college GPA is consistent with the results of Cordell-McNulty and Ashton (2008) and
Robbins et al. (2006).

101
Psychological Process Variables
Identity
I hypothesized that commitment making and identification with commitment predict
academic achievement, social adjustment, and intention to persist in college students; however
none of these relationships are significant. Identification with commitment is significantly related
to perceived academic self-efficacy (β = .19, p = .000), a path added to the original model based
on the modification indices, and significantly related to social adjustment through perceived
academic self-efficacy (β = .02, p = .006) and through perceived academic self-efficacy and
performance-avoid goals (β = .004, p = .02). Like its relationship to social adjustment,
identification with commitment has two significant relationships with GPA mediated through
perceived academic self-efficacy (β = .03, p = .008) and through perceived academic self-
efficacy and performance-avoid goals (β = .005, p = .02). For intention to persist, there is only
one significant indirect relationship which is mediated through perceived academic self-efficacy
(β = .05, p = .000). These results show that identification with commitment is related to all three
of the outcome variables, but these relationships are completely mediated by academic self-
efficacy and performance-avoid goals.
Achievement Goals
I hypothesized that mastery and performance-avoid goals predict academic achievement
and social adjustment. However, results indicate only performance-avoid goals are related to
academic achievement (β = -.20, p = .0005) and social adjustment (β = -.17, p = .0005). The
finding that performance-avoid goals are negatively related to academic achievement replicates
the findings of Hsieh et al. (2007). The finding that performance-avoid goals predict social
adjustment supports the negative relationship hypothesized in the Bean and Eaton (2000) model.
It is noteworthy that mastery goals are not positively related to social adjustment or GPA. The

102
research on the relationship between mastery goals and achievement is mixed, and most studies
reporting positive relationships between mastery goals and achievement have not included a
control for prior ability.
Perceived Academic Self-Efficacy
I hypothesized that perceived academic self-efficacy predicts mastery goals, performance
avoid goals, academic achievement, social adjustment, and intention to persist. Results supported
these hypotheses: Perceived academic self-efficacy is related to mastery goals (β = .15, p =
.0005), academic achievement (β = .17, p = .005), social adjustment (β = .13, p = .003), and
intention to persist (β = .29, p = .000). In addition, perceived academic self-efficacy is negatively
related to performance-avoid goals (β = -.14, p = .007). This relationship was not included in the
original model but was added on the basis of the modification indices. The finding that perceived
academic self-efficacy predicts academic achievement supports the results of Bembenutty
(2007), Elias and MacDonald (2007), Multon et al. (1991), and Robbins et al. (2004). The
finding that perceived academic self-efficacy predicts intention to persist lends support to the
findings of Robbins et al. In addition, the finding that perceived academic self-efficacy predicts
social adjustment is consistent with research by DeWitz and Walsh (2002). That perceived
academic self-efficacy predicts mastery goals is consistent with the finding of Hsieh et al.
(2007). However, unlike this study, Hsieh et al. did not find a significant relationship between
perceived academic self-efficacy and performance-avoid goals.
Outcome Variables
I hypothesized that social adjustment and academic achievement predict intention to
persist; however, neither variable predicts intention to persist. This result may be due to a ceiling
effect in the measure of intent to persist (M = 5.51 on a 6.00 scale).

103
Limitations of the Study
This study has several limitations that should be addressed in future studies: First, I did not
measure actual persistence, only intention to persist. Although other researchers have found that
intention to persist predicts persistence (e.g., Cabrera et al., 1993), measuring actual persistence
would increase the ecological validity of the study. Second, GPAs, SAT, and ACT scores were
based on students’ self-reports. Although obtaining official GPAs and test scores to ensure their
accuracy is desirable, many students refuse to give researchers permission to obtain their official
test scores from the registrar. Strategies to overcome students’ reluctance need to be explored.
Third, because the relationships obtained in this study are correlational, conclusions regarding
the direction of causality are speculative and require validation through experimental research.
Implications of the Findings for Future Research
Of particular note, perceived academic self-efficacy is the only variable in the model with
a direct relationship to the three outcome variables: intention to persist, social adjustment, and
GPA. In addition academic self-efficacy mediated many of the indirect effects in the model as
well. These results are consistent with Bandura’s (1997) conception of perceived self-efficacy
and its importance for academic success. Bandura identified four sources of perceived self-
efficacy: (a) mastery experience, (b) vicarious experiences, (c) verbal persuasion, and (d)
physiological and affective states. Future research designed to increase students’ retention in
college should investigate strategies based on those four sources. In terms of predicting
outcomes, performance-avoid goals is the second most influential variable, predicting students’
social adjustment and GPA. This finding suggests a need to develop strategies to help students
develop more positive achievement goals. It was surprising that mastery goals, commitment
making, and identification with commitment are not significant predictors of any of the outcome
variables. However, identification with commitment is indirectly related to all three of the

104
outcome variables. In sum, perceived academic self-efficacy and performance-avoid goals are
the strongest predictors of the three college outcomes: intent to persist, GPA, and social
adjustment.
Conclusions
The new bioecological model of college retention tested in this study provides researchers
and higher education administrators with a structured way of identifying strategies from multiple
sources with diverse relationships to students’ GPA, social adjustment, and intention to persist
that could be adopted simultaneously to improve the likelihood of increasing college retention.
For example, with one exception (off-campus friends in the peer microsystem) significant
relationships to at least one of the outcome variables were found in every microsystem of the
students’ lives. Of the parental variables examined in this study, parental autonomy support has a
direct relationship with social adjustment. Research focusing on helping parents understand the
benefits of providing autonomy support during freshman orientation or through parent
newsletters may be helpful in increasing retention. With regard to the college microsystem,
several approaches to increasing retention are suggested from this study. Students’ relatedness to
instructors has a direct relationship to students’ perceived academic efficacy. Administrators
could investigate whether providing instructors with strategies to help students feel accepted in
their classrooms increases students’ social adjustment, GPA, and intention to persist through its
relationship with perceived academic self-efficacy. Participation in extracurricular activities has
a significant relationship to social adjustment. Research is warranted to determine whether
activities encouraging students to participate in extracurricular activities increases retention.
Sense of belonging to the institution has the strongest direct relationship of all the variables in
the study to social adjustment. Strategies to increase identity with the university should be tested
as a potentially important way to influence students’ social adjustment. In the self-system,

105
conscientiousness has the largest number of indirect relationships to GPA and intention to persist
of any variable in the study. Strategies to increase students’ conscientiousness may have effects
on multiple psychological processes related to achievement and intent to persist, including
mastery goals, performance-avoid goals, and perceived academic self-efficacy.
The results of this study emphasize the importance of the relationships between
psychological process variables (in particular, perceived academic self-efficacy and
performance-avoid goals) and the outcome variables of social adjustment, GPA, and intention to
persist. These results suggest that researchers and higher education administrators might focus on
developing interventions to increase academic self-efficacy and decrease performance-avoid
goals as a means of increasing students’ retention. One way to increase perceived self-efficacy
that is suggested in the model tested in this study is to increase students’ feelings of relatedness
to their instructors. One way to decrease performance-avoid goals suggested by the model is to
decrease entity beliefs and help students foster a more incremental view of intelligence. It is my
hope that these findings will help advance research on the problems of college retention and
ultimately lead to increasing the graduation rate of college students.

106
LIST OF REFERENCES
Adams, G. R., Bennion, L., & Huh, K. (1989). Objective Measure of Ego Identity status: A reference manual. Logan: Utah State University.
Adams, G. R., Shea, J., & Fitch, S. A. (1979). Toward the development of an objective assessment of ego-identity status. Journal of Youth and Adolescence, 8, 223-237.
Alford, S. M. (2000). A qualitative study of the college social adjustment of Black students from lower socioeconomic communities. Journal of Multicultural Counseling and Development, 28, 2-15.
Armsden, G. C., & Greenberg, M. T. (1987). The Inventory of Parent and Peer Attachment: Individual differences and their relationship to psychological well-being in adolescence. Journal of Youth and Adolescence, 16, 427-453.
Arnett, J. J. (2000). Emerging adulthood: A theory of development from the late teens through the twenties. American Psychologist, 55, 469-480.
Arnett, J. J. (2006). Emerging adulthood: Understanding the new way of coming of age. In J. J. Arnett & J. L. Tanner (Eds.), Emerging adults in America: Coming of age in the 21st century (pp. 3-19). Washington, DC: American Psychological Association.
Aronson, J., Fried, C. B., & Good, C. (2002). Reducing the effects of stereotype threat on African American college students by shaping theories of intelligence. Journal of Experimental Social Psychology, 38, 113-125.
Arrindell, W. A., & Ellema, J. H. M. (1986). Klachtenlijst (SCL-90) [Complaint List SCL-90.]. Lisse. The Netherlands: Swets & Zeitlinger.
Asher, S. R., & Wheeler, V. A. (1985). Children’s loneliness: A comparison of rejected and neglected peer status. Journal of Consulting and Clinical Psychology, 53, 500-505.
Astin, A. W. (1997). How ‘good’ is your institution’s retention rate? Research in Higher Education, 38, 647-658.
Awad, G. H. (2007). The role of racial identity, academic self-concept, and self-esteem in the prediction of academic outcomes for African American students. Journal of Black Psychology, 33, 188-207.
Baker, R. W., & Siryk, B. (1984). Measuring adjustment to college. Journal of Counseling Psychology, 31, 179-189.
Baker, R. W., & Siryk, B. (1999,1989). Manual of the SACQ. Los Angeles: Western Psychological Services.
Balistreri, E., Busch-Rossnagel, N. A., & Geisinger, K. F. (1995). Development and preliminary validation of the Ego Identity Process Questionnaire. Journal of Adolescence, 18, 179-192.

107
Bandura, A. (1997). Self-efficacy: The exercise of control. New York: Freeman.
Barber, B. K. (1996). Parental psychological control: Revisiting a neglected construct. Child Development, 67, 3296-3319.
Barnes, H., & Olson, D. H. (1992). Parent-adolescent communication. In H. I. McCubbin, H. Barnes, A. Larsen, M. Muxen, & M Wilson (Eds.), Family inventories (2nd ed., pp. 29-44). Saint Paul, MN: Family Social Science.
Baumeister, R. F., & Leary, M. R. (1995). The need to belong: Desire for interpersonal attachments as a fundamental human motivation. Psychological Bulletin, 117, 497-529.
Bean, J. P., & Eaton, S. B. (2000). A psychological model of college student retention. In J. M. Braxton (Ed.), Reworking the student departure puzzle (pp. 48-61). Nashville, TN: Vanderbilt University Press.
Beck, A. T., Epstein, N., Brown, G., & Steer, R. A. (1988). An inventory for measuring clinical anxiety: Psychometric properties. Journal of Counseling and Clinical Psychology, 56, 893-897.
Beck, A. T., Ward, C. H., Mendelson, M., Mock, J., & Erbaugh, J. (1961). An inventory for measuring depression. Archives of General Psychiatry, 5, 561-571.
Bembenutty, H. (2007). Self-regulation of learning and academic delay of gratification: Gender and ethnic differences among college students. Journal of Advanced Academics, 18, 586-616.
Bers, T. (2005). Parents of traditionally aged community college students: Communications and choice. Research in Higher Education, 46, 413-436.
Berzonsky, M. D. (1992). Identity style and coping strategies. Journal of Personality, 60, 771-787.
Berzonsky, M. D., & Kuk, L. S. (2000). Identity status, identity processing style, and the transition to university. Journal of Adolescent Research, 15, 81-98.
Betz, E. L., Betz, N. E., & Menne, J. W. (1989). Manual for the College Student Satisfaction Questionnaire. Unpublished manual. Columbus, OH: Ohio State University.
Bohnert, A. M., Aikins, J. W., & Edidin, J. (2007). The role of organized activities in facilitating social adaptation across the transition to college. Journal of Adolescent Research, 22, 189-208.
Bollen, K. A., & Hoyle, R. H. (1990). Perceived cohesion: A conceptual and empirical examination. Social Forces, 69, 479-504.

108
Boyd, V. S., Hunt, P. F., Kandell, J. J., & Lucas, M. S. (2003). Relationship between identity processing style and academic success in undergraduate students. Journal of College Student Development, 44, 155-167.
Braxton, J. M., & Hirschy, A. S. (2005). Theoretical developments in the study of college student departure. In A. Seidman (Ed.), College student retention: Formula for student success (pp. 61-87). Westport, CT: Praeger.
Braxton, J. M., & Hirschy, A. S., & McLendon, S. A. (2004). Understanding and reducing college student departure. No. 3 ASHE-ERIC Higher Education Research Report Series. San Francisco: Jossey-Bass.
Braxton, J. M., Sullivan, A. V. S., & Johnson, R. M., Jr. (1997). Appraising Tinto’s theory of college student departure. In J. C. Smart (Ed.), Higher education: Handbook of theory and research, Vol. 12 (pp. 107-164). New York: Agathon Press.
Bronfenbrenner, U. (1979). The ecology of human development: Experiments by nature and design. Cambridge, MA: Harvard University Press.
Bronfenbrenner. U., & Morris, P. A. (1998). The ecology of developmental processes. In W. Damon (Series Ed.) & R. M. Lerner (Vol. Ed.), Handbook of child psychology: Vol. 1 (5th ed., pp. 993-1028). New York: Wiley.
Buote, V. M., Pancer, S. M., Pratt, M. W., Adams, G., Birnie-Lefcovitch, S., Polivy, J., & Wintre, M. G. (2007). The importance of friends: Friendship and adjustment among 1st-year university students. Journal of Adolescent Research, 22, 665-689.
Byars-Winston, A. M., & Fouad, N. A. (2008). Math and science social cognitive variables in college students: Contributions of contextual factors in predicting goals. Journal of Career Assessment, 16, 425-440.
Cabrera, A. F., Nora, A., & Castaneda, M. B. (1993). College persistence: Structural equations modeling test of an integrated model of student retention. Journal of Higher Education, 64, 123-139.
Caro, J. E. (1985). An empirical investigation of attachment in adulthood and its relationship to adjustment in college. Unpublished doctoral dissertation, Syracuse University, Syracuse, NY.
Clancy, S. M., & Dollinger, S. J. (1993). Identity, self, and personality: Identity status and the five-factor model of personality. Journal of Research on Adolescence, 3, 227-245.
Cordell-McNulty, K., & Ashton, P. (2006, August). College students’ perceptions of parental involvement and their academic self-efficacy. Poster presented at the meeting of the American Psychological Association, New Orleans, LA.

109
Cordell-McNulty, K., & Ashton, P. (2008, March). Relationship of perceived social support to self-efficacy and achievement in community college students. Paper presented at the meeting of the American Educational Research Association, New York.
Costa, P. T., & McCrae, R. R. (1992). Revised NEO Personality Inventory (NEO-PI-R) and NEO Five Factor Inventory (NEO-FFI) professional manual. Odessa, FL: Psychological Assessment Resources.
Cutrona, C. E. (1989). Ratings of social support by adolescents and adult informants: Degree of correspondence and prediction of depressive symptoms. Journal of Personality and Social Psychology, 57, 723-730.
Cutrona, C. E., Cole, V., Colangelo, N., Assouline, S. G., & Russell, D. W. (1994). Perceived parental social support and academic achievement: An attachment theory perspective. Journal of Personality and Social Psychology, 66, 369-378.
Cutrona, C. E., & Russell, D. (1987). The provisions of social relationships and adaptation to stress. In W. H. Jones & D. Perlman (Eds.), Advances in personal relationships (Vol. 1, pp. 37-68). Greenwich, CT: JAI Press.
Deci, E. L., & Ryan, R. M. (2000). The “what” and “why” of goal pursuits: Human needs and the self-determination of behavior. Psychological Inquiry, 11(4), 227-268.
DeWitz, S. J., & Walsh, W. B. (2002). Self-efficacy and college student satisfaction. Journal of Career Assessment, 10, 315-326.
Dixon Rayle, A. (2006). Mattering to others: Implications for the counseling relationship. Journal of Counseling and Development, 84, 483-487.
Dixon Rayle, A., & Chung, K. (2007). Revisiting college students’ mattering: Social support, academic stress, and the mattering experience. Journal for College Student Retention: Research, Theory, Practice, 9, 21-37.
Duchesne, S., Ratelle, C. F., Larose, S., & Guay, F. (2007). Adjustment trajectories in college science programs: Perceptions of qualities of parents’ and college teachers’ relationships. Journal of Counseling Psychology, 54, 62-71.
Dweck, C. S. (1999). Self-theories: Their role in motivation, personality, and development. Philadelphia: Taylor & Francis.
Dweck, C. S., Chiu, C., & Hong, Y. (1995). Implicit theories and their role in judgments and reactions: A world from two perspectives. Psychological Inquiry, 6, 267-285.
Elias, S. M., & Loomis, R. J. (2000). Using an academic self-efficacy scale to address university major persistence. Journal of College Student Development, 41, 450-454.

110
Elias, S. M., & MacDonald, S. (2007). Using past performance, proxy efficacy, and academic self-efficacy to predict college performance. Journal of Applied Social Psychology, 37, 2518-2531.
Elliot, A. J., & Church, M. (1997). A hierarchical model of approach and avoidance achievement motivation. Journal of Personality and Social Psychology, 72, 218-232.
Epstein, J. L., Connors, L. J., & Clark Salinas, K. (1993). High school and family partnerships: Questionnaires for teachers, parents, and students. Baltimore, MD: Center on School, Family, and Community Partnerships.
Erdley, C. A., & Dweck, C. S. (1993). Children’s implicit personality theories as predictors of their social judgments. Child Development, 64, 863-878.
Erikson, E. H. (1968). Identity youth and crisis. New York: W.W. Norton.
Ferry, T. R., Fouad, N. A., & Smith, P. L. (2000). The role of family context in a social cognitive model for career-related choice behavior: A math and science perspective. Journal of Vocational Behavior, 57, 348-364.
Fischer, M. J. (2007). Settling into campus life: Differences by race/ethnicity in college involvement and outcomes. Journal of Higher Education, 78, 125-161.
Flescher, M. (1986). Unpublished data from Skidmore College, Saratoga Springs, NY.
Freeman, T. M., Anderman, L. H., & Jensen, J. M. (2007). Sense of belonging in college freshmen at the classroom and campus levels. Journal of Experimental Education, 75, 203-220.
Friedlander, L. J., Reid, G. J., Shupak, N., & Cribbie, R. (2007). Social support, self-esteem, and stress as predictors of adjustment to university among first-year undergraduates. Journal of College Student Development, 48, 259-274.
Furrer, C., & Skinner, E. (2003). Sense of relatedness as a factor in children’s academic engagement and performance. Journal of Educational Psychology, 95(1), 148-162.
Gaskill, P. J., & Woolfolk Hoy, A. (2002). Self-efficacy and self-regulated learning: the dynamic duo in school performance. In J. Aronson (Ed.), Improving academic achievement: Impact of psychological factors on education (pp. 185-208). San Diego: Academic Press.
Goldberg, L. R. (1992). The development of markers for the Big-Five factor structure. Psychological Assessment, 4, 26-42.
Goldberg, L. R. (1999). A broad-bandwidth, public domain, personality inventory measuring the lower-level facets of several five-factor models. In I. Mervielde, I. Deary, F. De Fruyt, & F. Ostendorf (Eds.), Personality psychology in Europe, Vol. 7 (pp. 7-28). Tillburg, The Netherlands: Tillburg University Press.

111
Goodenow, C. (1993). The psychological sense of school membership among adolescents: Scale development and educational correlates. Psychology in the Schools, 30, 79-90.
Gottfried, A. W. (1985). Measures of socioeconomic status in child development research: Data and recommendations. Merrill-Palmer Quarterly, 31, 85-97.
Grolnick, W. S. (2003). The psychology of parental control. Mahwah, NJ: Erlbaum.
Grolnick, W. S., Ryan, R. M., & Deci, E. (1991). Inner resources for school achievement: Motivational mediators of children’s perceptions of their parents. Journal of Educational Psychology, 83, 508-517.
Gupta, S., Harris, D. E., Carrier, N. M., & Caron, P. (2006). Predictors of student success in entry-level undergraduate mathematics courses. College Student Journal, 40, 97-108.
Hagerty, B. M. K., Lynch-Sauer, J., Patusky, K., Bouwsema, M., & Collier, P. (1992). Sense of belonging: A vital mental health concept. Archives of Psychiatric Nursing, 6, 172-177.
Harris, B. C. (1988). How the structure and function of social networks relate to loneliness and college adaptation. Unpublished master’s thesis, George Washington University, Washington, DC.
Hausmann, L. R. M., Schofield, J. W., & Woods, R. L. (2007). Sense of belonging as a predictor of intentions to persist among African Americans and White first-year college students. Research in Higher Education, 48, 803-839.
Hoekstra, H. A., Ormel, J., & de Fruyt, F. (1996). NEO Persoonlijkheids Vragenlijsten: NEO-PI-R, NEO-FFI. Handleiding. Lisse, The Netherlands: Swets & Zeitlinger.
Hofer, B. K., Kennedy, E., & Hurd, K. (August, 2006). From “other regulation” to “self regulation”: Parental contact and influence during the transition to college. Paper presented at the meeting of the American Psychological Association, New Orleans.
Hoffman, J. A. (1984). Psychological separation of late adolescents from their parents. Journal of Counseling Psychology, 31, 170-178.
Hogan, M. P. (1986). Unpublished data from University of Maryland, College Park.
Hollingshead, A.B. (1975). Four factor index of social status. Unpublished manuscript, Yale University, Department of Sociology, New Haven, CT.
Hoover-Dempsey, K. V., & Sandler, H. M. (1995). Parental involvement in children’s education: Why does it make a difference? Teachers College Record, 97, 311-331.
Hsieh, P., Sullivan, J. R., & Guerra, N. S. (2007). A closer look at college students: Self-efficacy and goal orientation. Journal of Advanced Academics, 18(3), 454-476.

112
Hurtado, S., & Carter, D. (1997). Effects of college transition and perceptions of the campus racial climate on Latino college students’ sense of belonging. Sociology of Education, 70, 324-345.
John, O. P., Donahue, E. M., & Kentle, R. L. (1991). The Big Five Inventory—Versions 4a and 54. Berkeley, CA: University of California, Berkeley, Institute of Personality and Social Research.
John, O. P., & Srivastava, S. (1999). The big five trait taxonomy: History, measurement, and theoretical perspectives. In L. A. Pervin & O. P. John (Eds.), The handbook of personality (2nd ed., pp. 102-138). New York: Guilford Press.
Kuncel, N. R., Credé, M., & Thomas, L. L. (2005). The validity of self-reported grade point averages, class ranks, and test scores: A meta-analysis and review of the literature. Review of Educational Research, 75, 63-82.
Larose, S., Tarabulsy, G., & Cyrenne, D. (2005). Perceived autonomy and relatedness as moderating the impact of teacher-student mentoring relationships on student academic adjustment. Journal of Primary Prevention, 26, 111-128.
Luyckx, K., Goossens, L., Soenens, B., Beyers, W., & Vansteenkiste, M. (2005). Identity statuses based on four rather than two identity dimensions: Extending and refining Marcia’s paradigm. Journal of Youth and Adolescence, 34, 605-618.
Luyckx, K., Goossens, L., Soenens, B., & Beyers, W. (2006). Unpacking commitment and exploration: Preliminary validation of an integrative model of late adolescent identity formation. Journal of Adolescence, 29, 361-378.
Luyckx, K., Schwartz, S. J., Berzonsky, M. D., Soenens, B., Vansteenkiste, M., Smits, I., & Goosens, L. (2008). Capturing ruminative exploration: Extending the four-dimensional model of identity formation in late adolescence. Journal of Research in Personality, 42, 58-82.
Luyckx, K., Soenens, B., & Goossens, L. (2006). The personality-identity interplay in emerging adult women: Convergent findings from complementary analyses. European Journal of Personality, 20, 195-215.
Luyckx, K., Soenens, B., Goossens, L., & Vansteenkiste, M. (2007). Parenting, identity formation, and college adjustment: A mediation model with longitudinal data. Identity, 7, 309-330.
Luyckx, K., Soenens, B., Vansteenkiste, M., Goossens, L., & Berzonsky, M. D. (2007). Parental psychological control and dimensions of identity formation in emerging adulthood. Journal of Family Psychology, 21, 546-550.
Mahoney, J. L., Cairns, B. D., & Farmer, T. W. (2003). Promoting interpersonal competence and educational success through extracurricular activity participation. Journal of Educational Psychology, 95, 409-418.

113
Marcia, J. E. (1980). Identity in adolescence. In J. Adelson (Ed.), Handbook of adolescent psychology (pp. 159-187). New York: Wiley.
Marcia, J. E. (1993a). The ego identity status approach to ego identity. In J. E. Marcia, A. S. Waterman, D. R. Matteson, S. L. Archer, & J. L. Orlofsky (Eds.), Ego identity: A handbook for psychosocial research (pp. 3-21). New York: Springer-Verlag.
Marcia, J. E. (1993b). Prologue. In J. Kroger (Ed.), Discussions of ego identity (pp. xiii-xv). Hillsdale, NJ: Erlbaum.
Marcoen, A., Van Cotthem, K., Billiet, K., & Beyers, W. (2002). Dimensies van subjectief welbevinden bij ouderen [Dimensions of subjective well-being in elderly people]. Tijdschrift voor Gerontologie en Geriatrie, 33, 156–165.
Mattson, C. E. (2007). Beyond admission: Understanding pre-college variables and the success of at-risk students. Journal of College Admission, 196, 8-13.
McCarron, G. P., & Inkelas, K. K. (2006). The gap between educational aspirations and attainment for first-generation college students and the role of parental involvement. Journal of College Student Development, 47, 534-549.
McCrae, R. R., & John, O. P. (1992). An introduction to the five-factor model and its applications. Journal of Personality, 60, 175-215.
McGregor, H., & Elliot, A. J. (2005). The shame of failure: Examining the link between fear of failure and shame. Personality and Social Psychology Bulletin, 31, 218-231.
Meeus, W., & Dekovic, M. (1995). Identity development, parental and peer support in adolescence: Results of a national Dutch survey. Adolescence, 30, 931-944.
Mendelson, M. J., & Aboud, F. E. (1999). Measuring friendship quality in late adolescents and young adults: McGill Friendship Questionnaires. Canadian Journal of Behavioural Science, 31, 130-132.
Midgley, C., Maehr, M. L., Hruda, L. Z., Anderman, E., Anderman, L., & Freeman, K. E., et al. (2000). Manual for the Patterns of Adaptive Leaning Scales. Ann Arbor, MI: University of Michigan.
Midgley, C., Maehr, M. L., & Urdan, T. C. (1993). Patterns of Adaptive Learning Survey (PALS). Ann Arbor, MI: University of Michigan.
Moller, A. C., Elliot, A. J., & Friedman, R. (2008). When competence and love are at stake: Achievement goals and perceived closeness to parents in an achievement context. Journal of Research in Personality, 42, 1386-1391.
Moore, J., Lovell, C. D., McGann, T., & Wyrick, J. (1998).Why involvement matters: A review of research on student involvement in the collegiate setting. College Student Affairs Journal, 17(2), 4-17.

114
Mounts, N. S. (2004). Contributions of parenting and campus climate to freshmen adjustment in a multiethnic sample. Journal of Adolescent Research, 19, 468-491.
Mounts, N. S. (2007) [Reliability and validity data for Parental Support for College measure]. Unpublished raw data.
Multon, K. D., Brown, S. D., & Lent, R. W. (1991). Relation of self-efficacy beliefs to academic outcomes: A meta-analytic investigation. Journal of Counseling Psychology, 38, 30-38.
National Center for Education Statistics. (2005a). Postsecondary institutions in the United States: Fall 2003 and degrees and other awards conferred: 2002-03. Retrieved July 15, 2008, from http://nces.ed.gov/fastfacts/display.asp?id=72
National Center for Education Statistics. (2005b). Student effort and progress: Postsecondary persistence and progress. Retrieved December 1, 2005, from http://nces.ed.gov/programs/coe/2004/section3/indicator19.asp
National Center for Education Statistics. (2007). Enrollment in postsecondary institutions, Fall 2005; graduation rates, 1999 and 2002 cohorts; and financial statistics fiscal year 2005. Retrieved February 3, 2009, from http://nces.ed.gov/pubs2007/2007154.pdf
National Center for Education Statistics. (2008). Digest of education statistics, 2007. Retrieved June 11, 2009, from http://nces.ed.gov/fastfacts/display.asp?id=98
National Center for Higher Education Management Systems. (2007). Graduation rates: Six-year graduation rates of bachelor's students 2006. Retrieved March 24, 2008, from http://www.higheredinfo.org/dbrowser/index.php?level=nation&mode=map&state=0&submeasure=27
Neuville, S., Frenay, M., Schmitz, J., Boudrenghien, G., Noel, B., & Wertz, V. (2007). Tinto’s theoretical perspective and expectancy-value paradigm: A confrontation to explain freshmen’s academic achievement. Psychologica Belgica, 47, 31-50.
Nguyen, N. T., Allen, L. C., & Fraccastoro, K. (2005). Personality predicts academic performance: Exploring the moderating role of gender. Journal of Higher Education Policy and Management, 27, 105-116.
Ochse, R., & Plug, C. (1986). Cross-cultural investigation of the validity of Erikson’s theory of personality development. Journal of Personality and Social Psychology, 50, 1240-1252.
Ostrove, J. M., & Long, S. M. (2007). Social class and belonging: Implications for college adjustment. Review of Higher Education, 30, 363-389.
Parker, J. G., & Asher, S. R. (1993). Friendship and friendship quality in middle childhood: Links with peer group acceptance and feelings of loneliness and social dissatisfaction. Developmental Psychology, 29, 611-621.

115
Pascarella, E. T., & Terenzini, P. T., (1980). Predicting persistence and voluntary dropout decisions from a theoretical model. Journal of Higher Education, 61, 60-75.
Paulson, S. E., Marchant, G. J., & Rothlisberg, B. A. (1994, October). Constructs underlying students’ perceptions of parents, teachers, and schools. Paper presented at the Midwestern Educational Research Association, Chicago, IL.
Pekrun, R., Elliot, A. J., & Maier, M. A. (2006). Achievement goals and discrete achievement emotions. Journal of Educational Psychology, 98, 583-597.
Pintrich, P. R., Smith, D. A. F., Garcia, T., & McKeachie, W. J. (1991). A manual for the use of the Motivated Strategies for Learning Questionnaire (MSLQ). Ann Arbor, MI: National Center for Research to Improve Postsecondary Teaching and Learning.
Radloff, L. S. (1977). The Center for Epidemiologic Studies-Depression Scale: A self-report depression scale for research in the general population. Journal of Applied Psychological Measurement, 1, 385-401.
Ratelle, C. F., Larose, S., Guay, F., & Senécal, C. (2005). Perceptions of parental involvement and support as predictors of college students’ persistence in a science curriculum. Journal of Family Psychology, 19(2), 286-293.
Robbins, S. B., Allen, J., Casillas, A., Peterson, C. H., & Le, H. (2006). Unraveling the differential effects of motivational and skills, social, and self-management measures from traditional predictors of college outcomes. Journal of Educational Psychology, 98, 598-616.
Robbins, S. B., Lauver, K., Le, H., Davis, D., Langley, R., & Carlstrom, A. (2004). Do psychosocial and study skill factors predict college outcomes? A meta-analysis. Psychological Bulletin, 130, 261-288.
Robins, R. W., & Pals, J. L. (2002). Implicit self-theories in the academic domain: Implications for goal orientation, attributions, affect, and self-esteem change. Self and Identity, 1, 313-336.
Robinson, C. C., Mandleco, B. L., Frost Olsen, S., Bancroft-Andrews, C., McNeilly, M. K., & Nelson, L. (1995, March). Authoritative, authoritarian, and permissive parenting practices: Psychometric support for a new measure. Paper presented at the meeting of the Society for Research in Child Development, Indianapolis, IN.
Robinson, T. N., III. (1996). A revision of the institutional integration model: A redefinition of “persistence” and the introduction of developmental variables. Unpublished doctoral dissertation, The Ohio State University, Columbus.
Robinson, T. N., III. (2003). Identity as a mediator of institutional integration variables in the prediction of undergraduate persistence intentions. Journal of Adolescent Research, 18, 3-24.

116
Rodgers, K. A., & Summers, J. J. (2008). African American students at predominantly white institutions: A motivational and self-systems approach to understanding retention. Educational Psychology Review, 20, 171-190.
Rosenberg, M. (1965). Society and adolescent self-image. Princeton, NJ: Princeton University Press.
Ross, M. E., Shannon, D. M., Salisbury-Glennon, J. D., & Guarino, A. (2002). The Patterns of Adaptive Learning Survey: A comparison across grade levels. Educational and Psychological Measurement, 62, 483-497.
Saracoglu, B. N. (1987). Adjustment of learning disabled students to university as related to self-esteem and self-efficacy. Unpublished master’s thesis, York University, North York, Ontario, Canada.
Savino. F., Reuter-Krohn, K., & Costar, D. (1986). Unpublished data from the University of Wisconsin, Madison.
Schludermann, E. H., & Schludermann, S. M. (1988). Children’s Report on Parent Behavior (CRPBI-108, CRPBI-30) for older children and adolescents (Technical Report). Winnipeg, Canada: Dept of Psychology, University of Manitoba.
Schunk, D. H., Pintrich, P. R., & Meece, J. L. (2008). Motivation in education: Theory, research, and applications. Upper Saddle River, NJ: Pearson Prentice Hall.
Silk, J. S., Morris, A. S., Kanaya, T., & Steinberg, L. (2003). Psychological control and autonomy granting: Opposite ends of a continuum or distinct constructs? Journal of Research on Adolescence, 13, 113-128.
Smith, P. L., & Fouad, N. A. (1999). Subject-matter specificity of self-efficacy, outcome expectancies, interests, and goals: Implications for the social-cognitive model. Journal of Counseling Psychology, 46, 461-471.
Soenens, B., Vansteenkiste, M., Lens, W., Luyckx, K., Goossens, L., Beyers, W., & Ryan, R. M. (2007). Conceptualizing parental autonomy support: Adolescent perceptions of promotion of independence versus promotion of volitional functioning. Developmental Psychology, 43, 633-646.
Solberg, V. S., O’Brien, K., Villareal, P., Kennel, R., & Davis, B. (1993). Self-efficacy and Hispanic college students: Validation of the College Self-Efficacy Instrument. Hispanic Journal of Behavioral Sciences, 15, 80-95.
Tinto, V. (1975). Dropout from higher education: A theoretical synthesis of recent research. Review of Educational Research, 45, 89-125.
Tinto, V. (1993). Leaving college: Rethinking the causes and cures of student attrition (2nd ed). Chicago: University of Chicago Press.
117
Tinto, V. (2005). Moving from theory into action. In A Seidman (Ed.), College student retention: Formula for student success (pp. 317-333). Westport, CN: Greenwood eBooks. Retrieved July 31, 2006 from http://ebooks.greenwood.com.lp.hscl.ufl.edu/reader.jsp?x=C8193&p=334&bc=EC8193
Trapnell, P. D., & Campbell, J. D. (1999). Private self-consciousness and the Five-Factor model of personality: Distinguishing rumination from reflection. Journal of Personality and Social Psychology, 76, 284–304.
Watson, D., Clark, L. A., & Tellegen, A. (1988). Development and validation of brief measures of positive and negative affect: The PANAS scales. Journal of Personality and Social Psychology, 54, 1063-1070.
Wick, S., & Shilkret, R. (1986). Unpublished data from Mount Holyoke College, South Hadley, MA.
Winston, R. B., Jr., & Miller, T. K. (1987). Student Development Task and Lifestyle Inventory manual. Athens, GA: Student Development Associates.
Wolfe, R. N., & Johnson, S. D. (1995). Personality as a predictor of college performance. Educational and Psychological Measurement, 55, 177-185.
Zimet, G. D., Dahlem, N. W., Zimet, S. G., & Farley, G. K. (1988). The Multidimensional Scale of Perceived Social Support. Journal of Personality Assessment, 52, 30-41.
Zuckerman, M., Gagne, M., & Nafshi, I. (2001). Pursuing academic interests: The role of implicit theories. Journal of Applied Social Psychology, 31, 2621-2631.

118
BIOGRAPHICAL SKETCH
Kristi Cordell-McNulty was born and raised in south central Pennsylvania, just north of the
Mason-Dixon line. She attended Shippensburg University and received a bachelor’s degree in
computer science. After completing an internship and deciding computer science was not the
right career path, she received her master’s degree in psychology from Shippensburg University.
Kristi was then awarded a Fellowship to study for the Ph.D. in the University of Florida’s
educational and developmental psychology co-major Ph.D. program. After receiving her Ph.D.,
Kristi assumed the position of Assistant Professor at Angelo State University in San Angelo, TX.


