PRELIMINARY DESIGN REVIEW (PDR)Charger Rocket Works
University of Alabama in Huntsville
NASA Student Launch 2013-14
Kenneth LeBlanc (Project Lead)Brian Roy (Safety Officer)Chris Spalding (Design Lead)Chad O’Brien (Analysis Lead)Wesley Cobb (Payload Lead)

PrometheusFlight Overview
Event Value Units
Max Speed 1960 ft/s
Time To Apogee 24.9 s
Apogee 14800 ft
Time at Main Deploy 176 s
Main Chute Deployment Altitude
1000 ft
Ground Impact Speed
7.0 ft/s
Nose Cone Impact Energy
0.83 ft-lbf
Body Impact Energy 15.9 ft-lbf

Project Schedule

Outreach• Under Construction• Modular in Nature• Adaptable for different ages and lengths• Supporting activity
• Water Rockets• Drag Experiment
• Packet format for easyintegration into existingevents
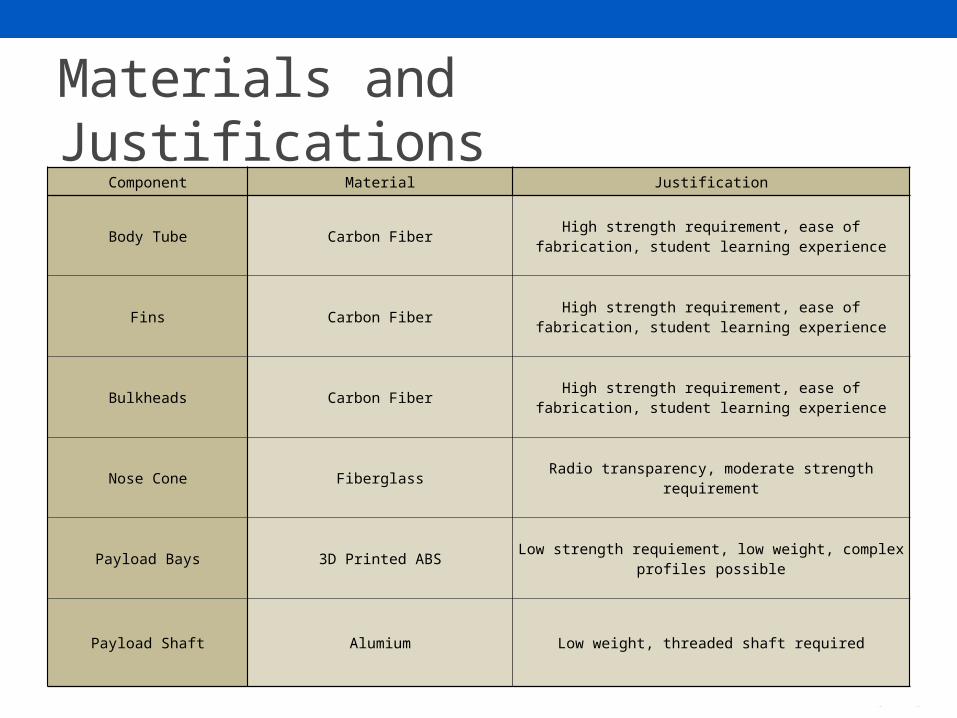
Materials and JustificationsComponent Material Justification
Body Tube Carbon Fiber High strength requirement, ease of fabrication, student learning experience
Fins Carbon Fiber High strength requirement, ease of fabrication, student learning experience
Bulkheads Carbon Fiber High strength requirement, ease of fabrication, student learning experience
Nose Cone Fiberglass Radio transparency, moderate strength requirement
Payload Bays 3D Printed ABS Low strength requiement, low weight, complex profiles possible
Payload Shaft Alumium Low weight, threaded shaft required

Vehicle Component Discussion
• Body Tube• 4.5” inside diameter• Wrapped carbon fiber tube
• Carbon cloth wrapped over mandrel• High strength, ease of fabrication

Vehicle Component Discussion
• Payload Shaft• 3/8” Aluminum Thread
• Threaded into motor case end cap• Passes thrust/ recovery forces into bulkhead, payloads, etc• Retains body tube segments

Vehicle Component Discussion
• Fins• Carbon fiber
• Nanolaunch profile• Two piece design allowing large flange fabrication
Vehicle Component Discussion
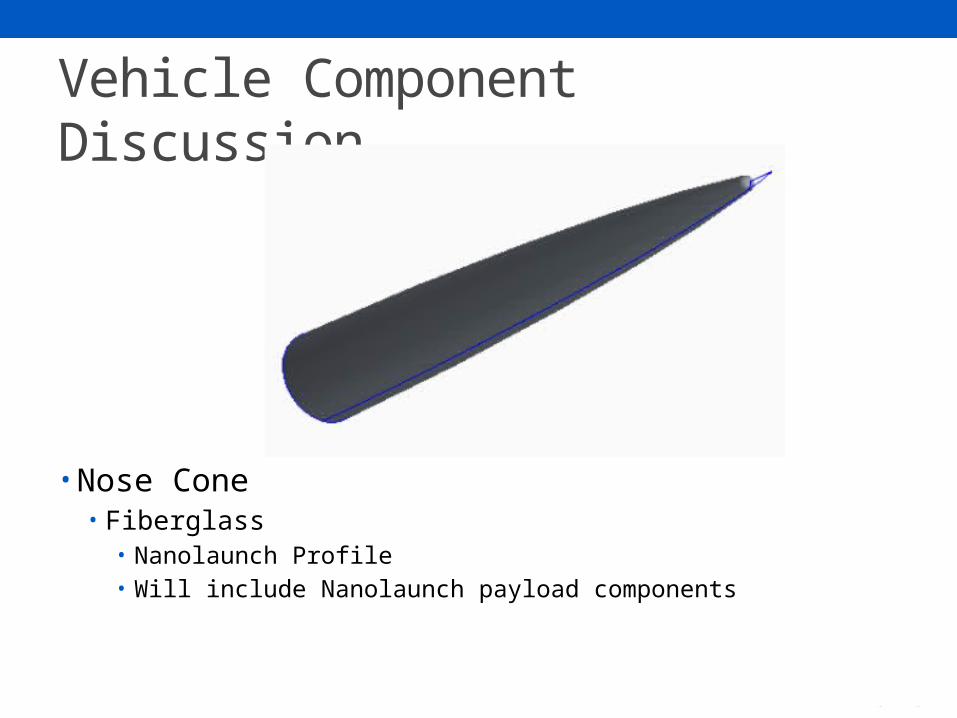
• Nose Cone• Fiberglass
• Nanolaunch Profile• Will include Nanolaunch payload components
Next Steps• Hardware
• Materials and Structures Testing• Design Refinement• Subscale and Prototype Fabrication
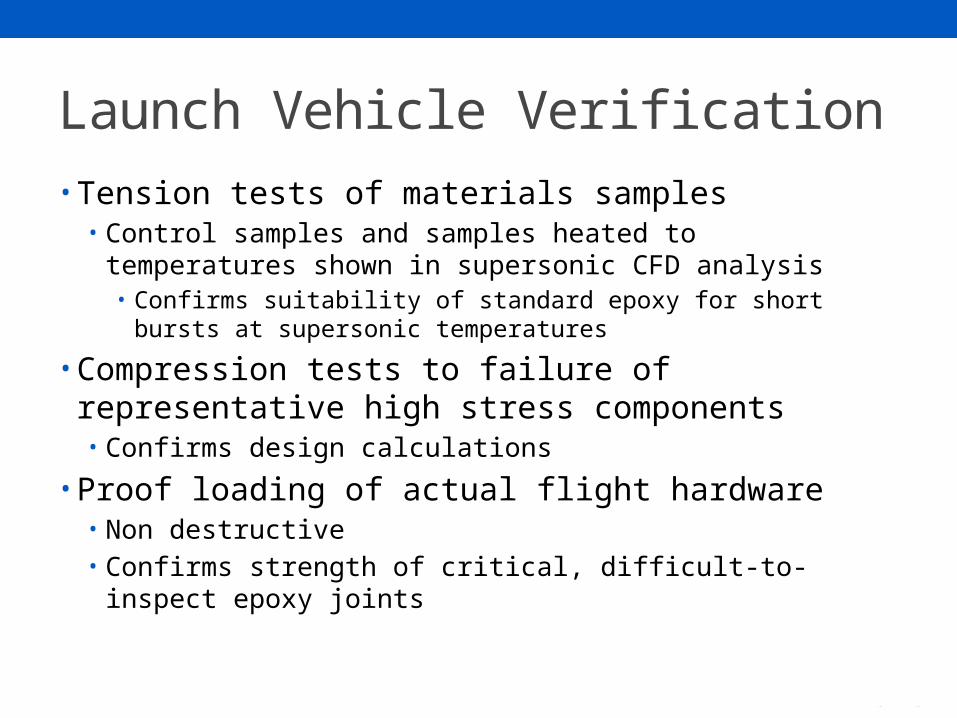
Launch Vehicle Verification• Tension tests of materials samples
• Control samples and samples heated to temperatures shown in supersonic CFD analysis• Confirms suitability of standard epoxy for short bursts at supersonic
temperatures
• Compression tests to failure of representative high stress components• Confirms design calculations
• Proof loading of actual flight hardware• Non destructive• Confirms strength of critical, difficult-to-inspect epoxy joints
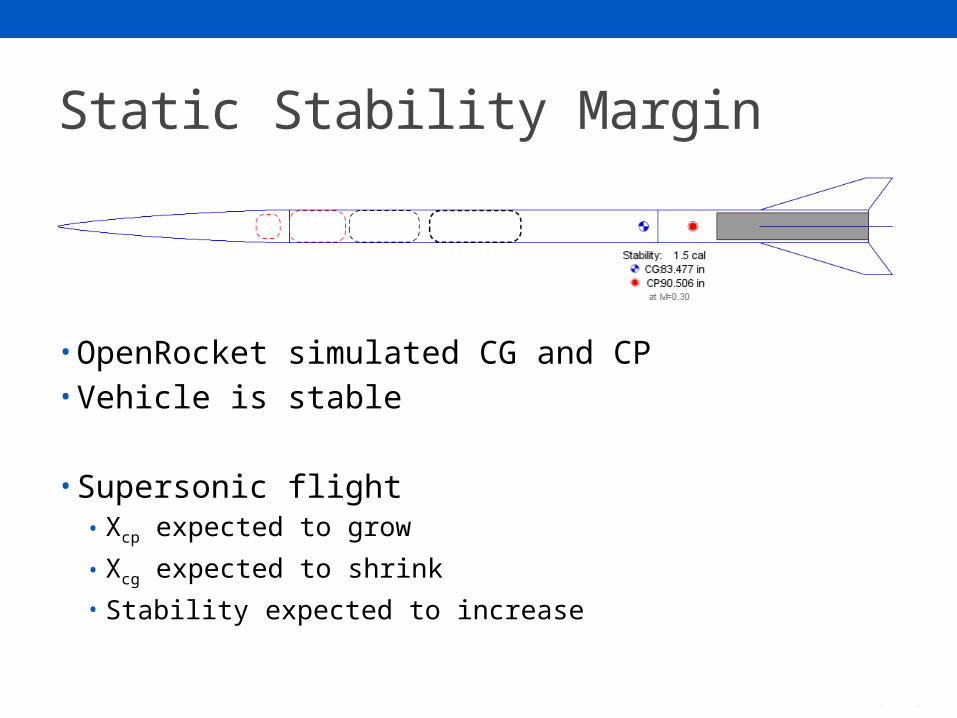
Static Stability Margin
• OpenRocket simulated CG and CP• Vehicle is stable
• Supersonic flight• Xcp expected to grow
• Xcg expected to shrink
• Stability expected to increase

Baseline Motor Selection• Cessaroni Technology Incorporated
- 7312 M4770-P• 3 Grain• High Impulse (7,312 N-s)• Low Burn Time (1.53 seconds)• Thrust to Weight Ratio (36.5)
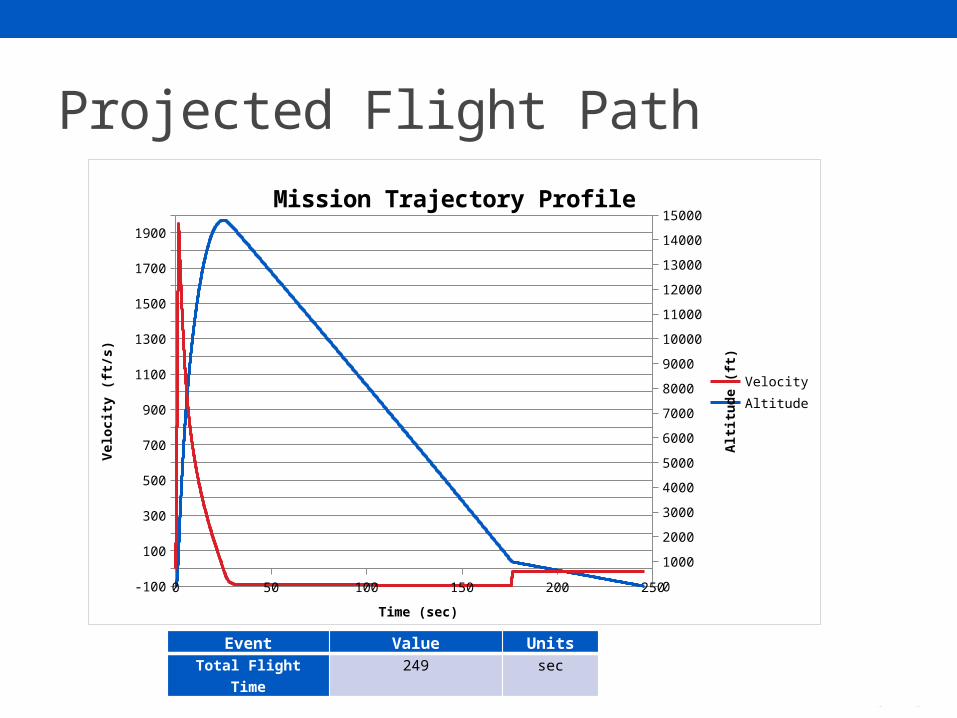
Projected Flight Path
0 50 100 150 200 250-1000
100200300400500600700800900
10001100120013001400150016001700180019002000
0
1000
2000
3000
4000
5000
6000
7000
8000
9000
10000
11000
12000
13000
14000
15000Mission Trajectory Profile
Velocity
Altitude
Time (sec)
Vel
oci
ty (
ft/s
)
Alt
itu
de
(ft)
Event Value UnitsTotal Flight Time 249 sec
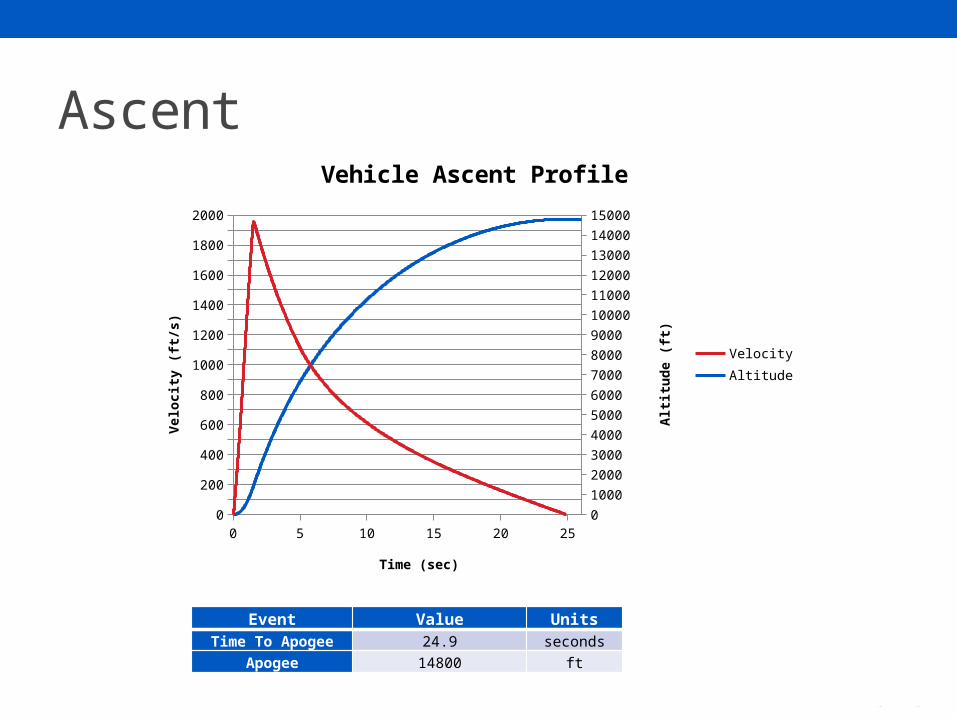
Ascent
0 5 10 15 20 250
100200300400500600700800900
10001100120013001400150016001700180019002000
0
1000
2000
3000
4000
5000
6000
7000
8000
9000
10000
11000
12000
13000
14000
15000
Vehicle Ascent Profile
Velocity
Altitude
Time (sec)
Vel
oci
ty (
ft/s
)
Alt
itu
de
(ft)
Event Value UnitsTime To Apogee 24.9 seconds
Apogee 14800 ft
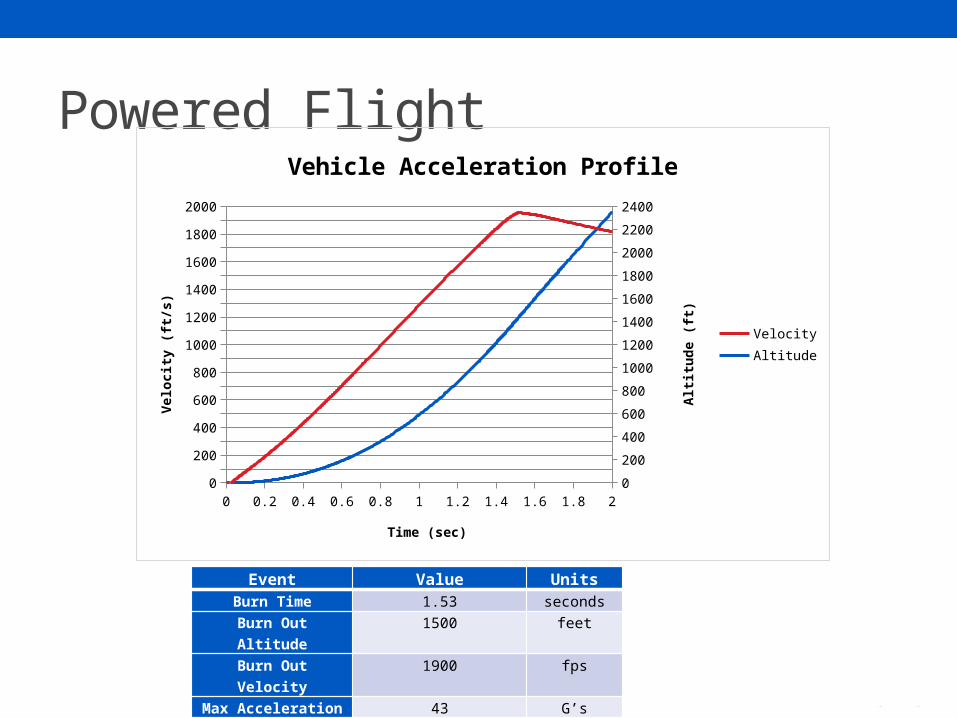
Powered Flight
Event Value UnitsBurn Time 1.53 seconds
Burn Out Altitude 1500 feetBurn Out Velocity 1900 fps
Max Acceleration 43 G’s
0 0.2 0.4 0.6 0.8 1 1.2 1.4 1.6 1.8 20
200
400
600
800
1000
1200
1400
1600
1800
2000
0
200
400
600
800
1000
1200
1400
1600
1800
2000
2200
2400
Vehicle Acceleration Profile
Velocity
Altitude
Time (sec)
Vel
oci
ty (
ft/s
)
Alt
itu
de
(ft)
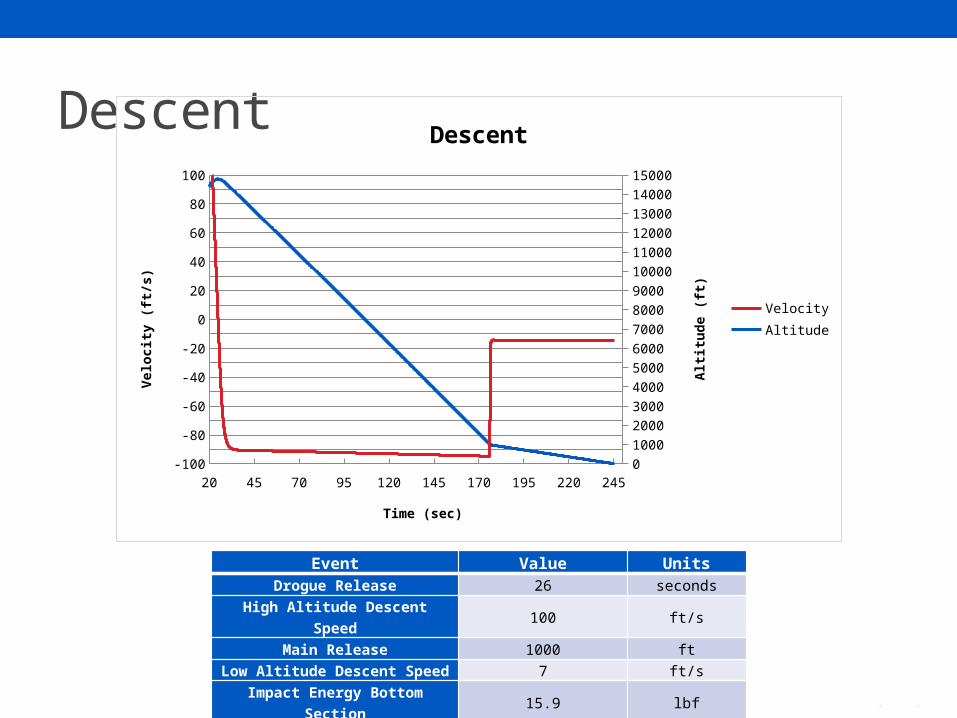
Descent
Event Value UnitsDrogue Release 26 seconds
High Altitude Descent Speed 100 ft/sMain Release 1000 ft
Low Altitude Descent Speed 7 ft/sImpact Energy Bottom Section 15.9 lbf
Impact Energy Nose Cone 0.83 lbf
20 45 70 95 120 145 170 195 220 245-100
-80
-60
-40
-20
0
20
40
60
80
100
0
1000
2000
3000
4000
5000
6000
7000
8000
9000
10000
11000
12000
13000
14000
15000
Descent
Velocity
Altitude
Time (sec)
Vel
oci
ty (
ft/s
)
Alt
itu
de
(ft)

Mass Variance Analysis
27.5 28 28.5 29 29.5 30 30.5 3114500145501460014650147001475014800148501490014950
Altitude Variance with Launch Mass
Mass (lb)
Alt
itu
de
(ft
)
• Monte Carlo Method
• 150 Test Cases
27.5 28 28.5 29 29.5 30 30.5 311.55
1.6
1.65
1.7
1.75
1.8
1.85
1.9
Speed Variance with Launch Mass
Mass (kg)
Mac
h
27.5 28 28.5 29 29.5 30 30.5 3140
41
42
43
44
45
46
47
48
49
Acceleration Variance with Mass
Mass (lb)
Acc
eler
atio
n (
G's
)

Next Steps• Analysis
• CFD-ACE+ Fluid Dynamics Models• Post Flight Analysis• Generate a 6-axis Flight Trajectory Model using Commercial
Software

Payload SystemsDielectrophoresis Effects of Supersonic Flight on Paints/Coatings
Landing Hazard Detection SystemNanolauch 1200 Experiment

Baseline Payload Design• Segmented modular design• Customizable • Able to be arranged for CG• Can be inserted and removed in one piece• Consolidated• Easy Maintenance• Designed to account for high G-forces
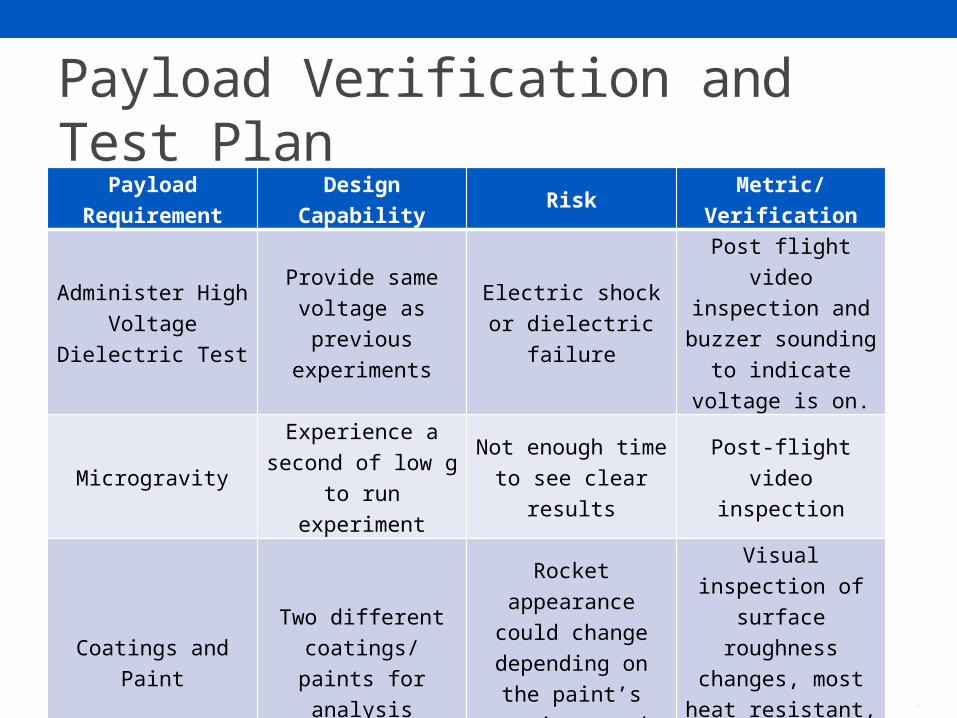
Payload Verification and Test PlanPayload Requirement Design Capability Risk Metric/Verification
Administer High Voltage Dielectric Test
Provide same voltage as previous
experiments
Electric shock or dielectric failure
Post flight video inspection and buzzer sounding to indicate
voltage is on.
MicrogravityExperience a second
of low g to run experiment
Not enough time to see clear results
Post-flight video inspection
Coatings and PaintTwo different
coatings/ paints for analysis
Rocket appearance could change
depending on the paint’s reaction to the
heat.
Visual inspection of surface roughness
changes, most heat resistant, and
durability of coating
Preflight Post flight surface analysis
Optical microscope analysis of the surface before and after flight
Deterioration of initial paint/coating due to
high heat
Pre-flight vs Post-flight inspection/analysis
comparison at microscopic level

Payload Verification and Test PlanPayload Requirement Design Capability Risk Metric/Verification
Hazard detection camera
Hang a camera below the rocket on descent
Camera tangles up with the shock cord or
parachute, and/or blocks the camera view
Camera deploys safely and analyzes the
landing zone
Live Data FeedRecording data if the ground below is clear
of hazards
Camera results could be inconclusive due to
swaying motion of parachute
Ground station receives live conclusive
evidence of landing hazards
Recoverable and Reusable
Capable of being launched again on the
same day without repairs or
modifications
All or some of the systems/subsystems
destroyed due to recovery failure
All payload components
recovered, and in working condition
Next Steps• Avionics and Payload
• Payload Sled Fabrication and Strength Test• Component Calibration and Testing• LHDS Development• Nanolaunch Program Code

QUESTION&
ANSWER


