
Preparatory Studies for Eco-design Requirements of Energy-using Products
Lot 24: Professional Dishwashers, Washing Machines and Dryers
Tender No. TREN/D3/91-2007
Final Report, Part: Washing Machines and Dryers
Task 5: Definition of Base Case
May 2011
Öko-Institut e.V. Institute for Applied Ecology, Germany Kathrin Graulich Markus Blepp Eva Brommer Carl-Otto Gensch Ina Rüdenauer BIO Intelligence Service, France Shailendra Mudgal Raul Cervantes Thibault Faninger Lorcan Lyons
Öko-Institut e.V. Freiburg Head Office P.O. Box 17 71 79017 Freiburg, Germany Street Address Merzhauser Str. 173 79100 Freiburg, Germany Tel. +49 (0) 761 – 4 52 95-0 Fax +49 (0) 761 – 4 52 95-88 Darmstadt Office Rheinstr. 95 64295 Darmstadt, Germany Tel. +49 (0) 6151 – 81 91-0 Fax +49 (0) 6151 – 81 91-33 Berlin Office Schicklerstr. 10 10179 Berlin, Germany Tel. +49 (0) 30 – 40 50 85-0 Fax +49 (0) 30 – 40 50 85-388

For reasons of better readability, two Task 5 reports were prepared.
The report at hand covers professional washing machines and dryers.
The Task 5 report on professional dishwashers is published separately.

Preparatory Study EuP Lot 24 Part: Professional Washing Machines and Dryers
Final Report Task 5: Definition of Base Case
Part: Professional Washing Machines and Dryers
Table of Contents – Task 5: Definition of Base Case
List of tables V
List of figures VIII
1 Introduction 9 1.1 Objective of Task 5 9
2 Product-specific inputs 10 2.1 Definition of base cases 11 2.2 Inputs in the production phase 13 2.3 Inputs in the distribution phase 17 2.4 Inputs in the use phase 18 2.4.1 Energy consumption 22 2.4.2 Water consumption 24 2.4.3 Detergent and laundry aid consumption 24 2.4.4 Travelling distance for maintenance and repair over the product life 24 2.5 Inputs in the end-of-life phase 25 2.6 Economic inputs 26
3 Base case environmental impact assessment 30 3.1 Base case WM1: Semi-professional washer extractor 31 3.2 Base case WM2: Professional washer extractor <15 kg 35 3.3 Base case WM3: Professional washer extractor, 15-40 kg 38 3.4 Base case WM4: Professional washer extractor, >40 kg 41 3.5 Base case WM5: Professional washer dryer 44 3.6 Base case WM6: Professional barrier washer 47 3.7 Base case WM7: Washing tunnel machine 50 3.8 Base case D1: Semi-professional dryer, condenser 53 3.9 Base case D2: Semi-professional dryer, air-vented 56 3.10 Base case D3: Professional cabinet dryer 59 3.11 Base case D4: Professional tumble dryer, <15 kg 62 3.12 Base case D5: Professional tumble dryer, 15-40 kg 65 3.13 Base case D6: Professional tumble dryer, >40 kg 68 3.14 Base case D7: Pass-through (transfer) tumble dryer 71 3.15 Influence of energy sources for water / air heating: Comparison
of electricity and alternative energy 74
III
Final Report
Task 5: Definition of Base Case Preparatory Study EuP Lot 24
Part: Professional Washing Machines and Dryers
3.16 Summary by kg of laundry processed 85 3.17 Conclusions 88
4 Base case life cycle costs 89
5 EU totals 92 5.1 Market data 92 5.2 Life cycle environmental impacts 93 5.3 Life cycle costs 98
6 EU-27 total system impact 101
7 Conclusions 102
8 Annex 103 8.1 Detailed bills of materials of the base cases 103 8.2 Additional questionnaire to stakeholders 110
IV

Preparatory Study EuP Lot 24 Part: Professional Washing Machines and Dryers
Final Report Task 5: Definition of Base Case
List of tables
Table 1 Description of the professional washing machines BCs 11
Table 2 Description of the professional laundry dryers BCs 12
Table 3 Composition of the seven professional washing machine BCs, by category of materials 14
Table 4 Composition of the 7 professional dryers BCs, by category of materials 14
Table 5 Life cycle impact assessment of missing individual components (part 1), for 1 kg 16
Table 6 Life cycle impact assessment of missing individual components (part 2), for 1 kg 17
Table 7 Volume of packaged product for washing machines base cases 17
Table 8 Volume of packaged product for dryers base cases 18
Table 9 Heating options used for water heating in new professional washing machines 19
Table 10 Heating options used for air heating in new professional dryers 19
Table 11 Modelling of the water heating for washing machines BCs 20
Table 12 Modelling of the air heating for dryers BCs 20
Table 13 Energy use split between mechanical and heating parts for washing machines 21
Table 14 Energy use split between mechanical and heating parts for dryers5 21
Table 15 Example of energy split calculation considering base case WM1 22
Table 16 Total annual energy consumption and proportion of electricity and alternative energy consumption for all professional washing machine base cases 23
Table 17 Total annual energy consumption and proportion of electricity and alternative energy consumption for all professional dryer base cases 23
Table 18 Water consumption per year for all professional washing machine base cases 24
Table 19 Detergent consumption per year for all professional washing machine base cases 24
Table 20 Travelled distance for maintenance and repair during the lifetime for all professional washing machine base cases 25
Table 21 Travelled distance for maintenance and repair during the lifetime for all professional dryer base cases 25
Table 22 Professional washing machines and dryers lifetimes (years) 26
V

Final Report
Task 5: Definition of Base Case Preparatory Study EuP Lot 24
Part: Professional Washing Machines and Dryers
Table 23 EcoReport economic inputs of the professional washing machine base cases 28
Table 24 EcoReport economic inputs of the professional dryer base cases 28
Table 25 Energy, water and consumables rates, by professional washing machine base case 29
Table 26 Energy rates, by professional dryer base case 29
Table 27 Overall improvement ratios for all professional laundry appliance base cases 30
Table 28 Life Cycle Impact (per unit) of base case 1 – WM1 Semi-professional washer extractor 33
Table 29 Life Cycle Impact (per unit) of base case 2 – WM2 Professional washer extractor <15 kg 36
Table 30 Life Cycle Impact (per unit) of base case 3 – WM 3 Professional washer extractor, 15-40 kg 39
Table 31 Life Cycle Impact (per unit) of base case WM4 – Professional washer extractor, >40 kg 42
Table 32 Life Cycle Impact (per unit) of base case WM5 – Professional washer extractor, >40 kg 45
Table 33 Life Cycle Impact (per unit) of base case WM6 – Professional barrier washer 48
Table 34 Life Cycle Impact (per unit) of base case WM7 – Washing tunnel machines 51
Table 35 Life Cycle Impact (per unit) of base case D1 – Semi-professional dryer, condenser 54
Table 36 Life Cycle Impact (per unit) of base case D2 – Semi-professional dryer, air-vented 57
Table 37 Life Cycle Impact (per unit) of base case D3 – Professional cabinet dryer 60
Table 38 Life Cycle Impact (per unit) of base case D4 – Professional tumble dryer, <15 kg 63
Table 39 Life Cycle Impact (per unit) of base case D5 – Professional tumble dryer, 15-40 kg 66
Table 40 Life Cycle Impact (per unit) of base case D6 – Professional tumble dryer, >40 kg 69
Table 41 Life Cycle Impact (per unit) of base case D7 – Pass-through (transfer) tumble dryer 72
Table 42 Life Cycle Impact (per unit) of base case WM1 – Semi-professional washer extractor using only electricity as heating source 75
VI

Preparatory Study EuP Lot 24 Part: Professional Washing Machines and Dryers
Final Report Task 5: Definition of Base Case
Table 43 Life Cycle Impact (per unit) of base case WM1 – Semi-professional washer extractor using only alternative energy source for water heating (and electricity for mechanic parts) 76
Table 44 Life Cycle Impact (per unit) of base case D4 – Professional air tumble dryer, <15 kg using only electricity as energy source 77
Table 45 Life Cycle Impact (per unit) of base case D4 – Professional air tumble dryer, <15 kg using only alternative energy source for water heating (and electricity for mechanic parts) 78
Table 46 Comparison of environmental indicators between WM1 units using only electricity and units using only alternative energy source for water heating9 83
Table 47 Comparison of environmental indicators between D4 units using only electricity and units using only alternative energy source for water heating9 83
Table 48 Comparison of economic indicators between WM1 units using only electricity for water heating and units using only alternative energy source for water heating9 84
Table 49 Comparison of economic indicators between D4 units using only electricity and units using only alternative energy source for water heating9 84
Table 50 Impact of professional washing machines per kilogram of laundry 86
Table 51 Impact of professional dryers per kilogram of laundry 87
Table 52 EcoReport outcomes of the LCC calculations of the professional washing machine base cases 89
Table 53 EcoReport outcomes of the LCC calculations of the professional laundry dryer base cases 89
Table 54 Expenditure cost proportion for professional washing machines 91
Table 55 Expenditure cost proportion for professional dryers 91
Table 56 Market and technical data for professional washing machines base cases in 2009 92
Table 57 Market and technical data for professional dryers base cases in 2009 92
Table 58 Environmental impacts of the EU-27 stock in 2009 for professional washing machines BC 93
Table 59 Environmental impacts of the EU-27 stock in 2009 for professional dryers BC 93
Table 60 Total Annual Consumer expenditure for professional washing machines in EU-27 in 2009 99
Table 61 Total Annual Consumer expenditure for professional dryers in EU-27 in 2009 99
VII

Final Report
Task 5: Definition of Base Case Preparatory Study EuP Lot 24
Part: Professional Washing Machines and Dryers
VIII
List of figures
Figure 1 Simplified material flow diagram for LCA 9
Figure 2 Distribution of environmental impacts of BC WM1 per life cycle phase 34
Figure 3 Distribution of environmental impacts of BC WM2 per life cycle phase 37
Figure 4 Distribution of environmental impacts of BC WM3 per life cycle phase 40
Figure 5 Distribution of environmental impacts of BC WM4 per life cycle phase 43
Figure 6 Distribution of environmental impacts of BC WM5 per life cycle phase 46
Figure 7 Distribution of environmental impacts of BC WM6 per life cycle phase 49
Figure 8 Distribution of environmental impacts of BC WM7 per life cycle phase 52
Figure 9 Distribution of environmental impacts of BC D1 per life cycle phase 55
Figure 10 Distribution of environmental impacts of BC D2 per life cycle phase 58
Figure 11 Distribution of environmental impacts of BC D3 per life cycle phase 61
Figure 12 Distribution of environmental impacts of BC D4 per life cycle phase 64
Figure 13 Distribution of environmental impacts of BC D5 per life cycle phase 67
Figure 14 Distribution of environmental impacts of BC D6 per life cycle phase 70
Figure 15 Distribution of environmental impacts of BC D7 per life cycle phase 73
Figure 16 Distribution of environmental impacts of WM1 using only electricity for water heating, per life cycle phase 79
Figure 17 Distribution of environmental impacts of WM1 using only alternative energy source for water heating, per life cycle phase 80
Figure 18 Distribution of environmental impacts of D4 using only electricity for water heating, per life cycle phase 81
Figure 19 Distribution of environmental impacts of D4 using only alternative energy source for water heating, per life cycle phase 82
Figure 20 Breakdown of professional washing machines base cases’ LCC 90
Figure 21 Breakdown of professional laundry dryer base cases’ LCC 91
Figure 22 Professional washing machine base cases’ share of the environmental impacts of the 2009 stock 95
Figure 23 Professional dryer base cases’ share of the environmental impacts of the 2009 stock 96
Figure 24 Energy/electricity consumption of the 2009 stock, per washing machine base case 97
Figure 25 Energy/electricity consumption of the 2009 stock, by dryer base case 98
Figure 26 Base cases’ share of the total consumer expenditure for professional washing machines in 2009 100
Figure 27 Base cases’ share of the total consumer expenditure for professional dryers in 2009 100

Preparatory Study EuP Lot 24 Part: Professional Washing Machines and Dryers
Final Report Task 5: Definition of Base Case
1 Introduction
1.1 Objective of Task 5
In the eco-design methodology, one or two average product(s) or a representative product
category are defined as the “base cases” (BCs) for the whole of the EU. Most of the
environmental and Life Cycle Cost analyses will be built on these BCs throughout the rest of
the study. The base case is a conscious abstraction of reality, but a necessary one for
practical reasons (budget, time). Having said that, the question of whether this abstraction
leads to inadmissible conclusions for certain market segments will be addressed in the
impact and sensitivity analyses.
In principle, the aim of a BC assessment is to quantify the environmental impacts of a service
or product throughout its life. This includes the phases from the extraction of the materials
contained within its components to the disposal of these materials at the end-of-life. The
method used to develop these impacts is the Life Cycle Assessment (LCA).
First, all incoming and outgoing flows of materials and energy are detailed for each phase of
the life cycle (manufacturing and design, transport, use, end-of-life). Figure 1 shows an
example of how materials and energy flows are summarised for a simplified LCA.
Figure 1 Simplified material flow diagram for LCA
These material and energy flows are then aggregated over the lifetime of the product to
compute total environmental impacts. These environmental impacts can be expressed in
many different ways, but are expressed in this study with 17 environmental indicators that
9

Final Report
Task 5: Definition of Base Case Preparatory Study EuP Lot 24
Part: Professional Washing Machines and Dryers
were predefined for all Eco-design studies. These indicators will be described in more detail
later in the report. As the results are presented through several indicators of environmental
impact, LCA is a multi-criteria approach.
The benefit of the LCA approach is that one can understand all the resources consumed, as
well as all the environmental side effects caused by a product. The drawback of this
approach is that each product on a market has a different life cycle and it can be difficult to
determine the net environmental impact of an entire market or of a range of product groups.
To help overcome this problem, BCs are created to represent a theoretical approximation of
the ‘average’ products on the EU market and use these to extrapolate the environmental
impacts of the entire market of professional washing machines and dryers.
While this study has been completed as comprehensively and accurately as possible, it relies
on data that have been extrapolated from the literature and stakeholder inputs. The
performance of real appliances can vary substantially from the data provided in this report.
This is understood and mitigated as much as possible while manipulating and calculating the
data during the analysis, however rough approximations are ultimately unavoidable. When
assumptions are made, it is also important to assess and check their influence on the final
results. Thus, some parameters might have negligible impacts on the overall results so that
assumptions can be easily accepted. If that is not the case, the sensitivity analysis in Task 8
will ensure the consistency of the results by studying the influence of the most important
parameters. The results of the study are valuable as they represent the best indication to
date of the environmental impacts of professional laundry appliances in the EU.
The description of the BCs is the synthesis of the results of Tasks 1 to 4. Most of the
environmental and Life Cycle Cost (LCC) analyses are built on these BCs throughout the rest
of the study and it serves as the point of reference for Task 6 (technical analysis of Best
Available Technology), Task 7 (improvement potential), and Task 8 (policy, impact and
sensitivity analysis).
2 Product-specific inputs
This section describes the technical analysis of typical professional laundry appliances which
exist on the EU market. This data will cover the production phase, the distribution phase, the
use phase and the end-of-life phase. Bill of materials (BOM) and resource consumption
during product life are some of the important parameters to be looked at.1 These parameters
will be used as the general input for the base case environmental impact assessment, in
Section 3.
1 Necessary input into EuP EcoReport.
10

Preparatory Study EuP Lot 24 Part: Professional Washing Machines and Dryers
Final Report Task 5: Definition of Base Case
2.1 Definition of base cases
The objective of this subsection is to define and describe the BCs, based on the previous
tasks and the information gathered from the stakeholders and the literature review. The BCs
are “a conscious abstraction of reality” and have to cover the wide variety of existing
professional laundry machines in order to be representative of the EU market as much as
possible. Thus, BCs are not necessarily representative of real products. When two products
have a similar BOM, technology and efficiency, they may be represented by a single BC. The
number of BCs is optimised to be small enough to enable a simplified analysis of the market,
but large enough to deal with the technological spectrum of professional washing machines
and dryers.
Although the MEEuP methodology foresees one or two BCs to cover the entire EU market
for the products considered in each preparatory study, this study uses 14 BCs for the laundry
appliances. Such a high number of BCs is necessary to adequately cover the broad range of
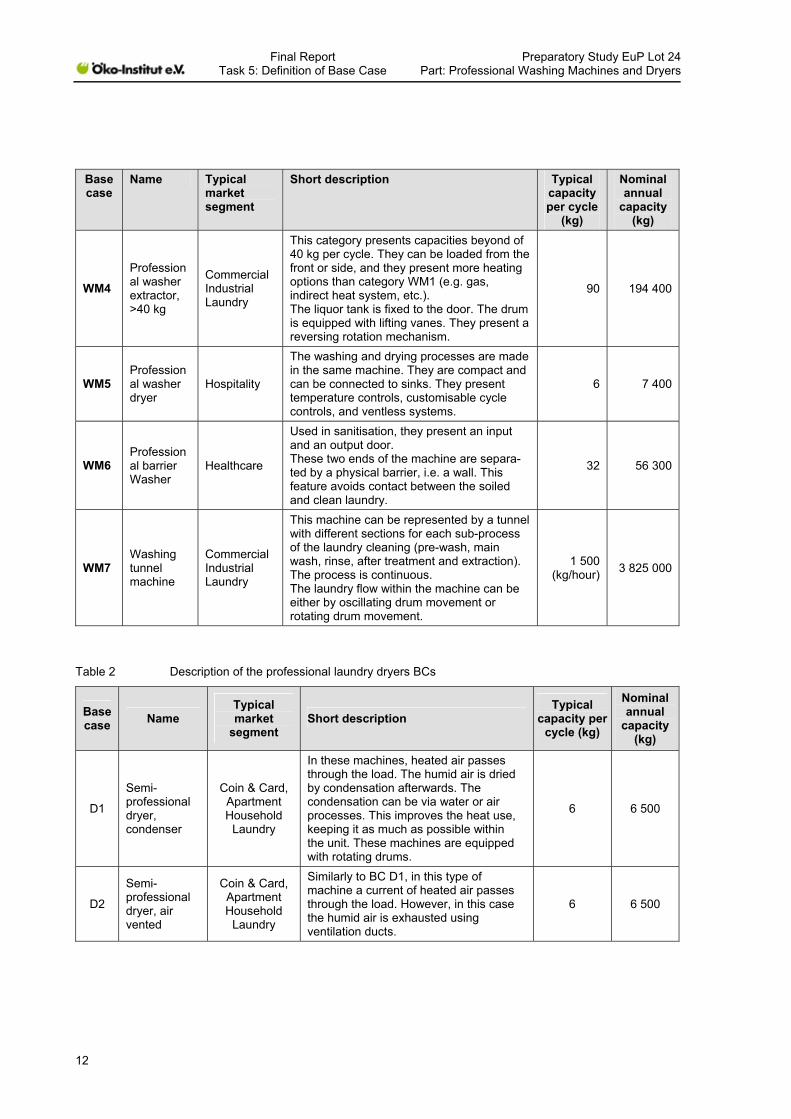
technical specifications and functionalities of professional laundry machines. Table 1 and
Table 2 give an overview of the 14 BCs, which are products that have already been
presented in the previous tasks.
Table 1 Description of the professional washing machines BCs
Base case
Name Typical market segment
Short description Typical capacity per cycle
(kg)
Nominal annual
capacity (kg)
WM1
Semi-professional washer extractor
Coin & Card, Apartment Household Laundry
These machines have a maximum loading capacity of 7 kg per cycle. They might be used by professional and non-professional users. They can be front-, side- or top-loaded. The cleaning mechanism is determined by the drum rotation movement.
6 7 000
WM2
Professional washer extractor, <15 kg
Coin & Card, Apartment Household Laundry
This category presents a maximum capacity of 15 kg per cycle. They can be loaded from the front or side, and they present more heating options than category WM1 (e.g. gas, indirect heat system, etc.). The liquor tank is fixed to the door. The drum will be equipped with lifting vanes. They present reversing rotation mechanism.
10 14 400
WM3
Professional washer extractor, 15–40 kg
Hospitality
This category presents capacity of 15 to 40 kg per cycle. They can be loaded from the front or side, and they present more heating options than category WM1 (e.g. gas, indirect heat system, etc.). The liquor tank is fixed to the door. The drum is equipped with lifting vanes. They present reversing rotation mechanism.
24 42 200
11
Final Report
Task 5: Definition of Base Case Preparatory Study EuP Lot 24
Part: Professional Washing Machines and Dryers
Base case
Name Typical market segment
Typical Nominal Short description capacity annual per cycle capacity
(kg) (kg)
WM4
Professional washer extractor, >40 kg
Commercial Industrial Laundry
This category presents capacities beyond of 40 kg per cycle. They can be loaded from the front or side, and they present more heating options than category WM1 (e.g. gas, indirect heat system, etc.). The liquor tank is fixed to the door. The drum is equipped with lifting vanes. They present a reversing rotation mechanism.
90 194 400
WM5 Professional washer dryer
Hospitality
The washing and drying processes are made in the same machine. They are compact and can be connected to sinks. They present temperature controls, customisable cycle controls, and ventless systems.
6 7 400
WM6 Professional barrier Washer
Healthcare
Used in sanitisation, they present an input and an output door. These two ends of the machine are separa-ted by a physical barrier, i.e. a wall. This feature avoids contact between the soiled and clean laundry.
32 56 300
WM7 Washing tunnel machine
Commercial Industrial Laundry
This machine can be represented by a tunnel with different sections for each sub-process of the laundry cleaning (pre-wash, main wash, rinse, after treatment and extraction). The process is continuous. The laundry flow within the machine can be either by oscillating drum movement or rotating drum movement.
1 500 (kg/hour)
3 825 000
Table 2 Description of the professional laundry dryers BCs
Base case
Name Typical market
segment Short description
Typical capacity per
cycle (kg)
Nominal annual
capacity (kg)
D1
Semi-professional dryer, condenser
Coin & Card, Apartment Household
Laundry
In these machines, heated air passes through the load. The humid air is dried by condensation afterwards. The condensation can be via water or air processes. This improves the heat use, keeping it as much as possible within the unit. These machines are equipped with rotating drums.
6 6 500
D2
Semi- professional dryer, air vented
Coin & Card, Apartment Household
Laundry
Similarly to BC D1, in this type of machine a current of heated air passes through the load. However, in this case the humid air is exhausted using ventilation ducts.
6 6 500
12

Preparatory Study EuP Lot 24 Part: Professional Washing Machines and Dryers
Final Report Task 5: Definition of Base Case
Base case
Name Typical market
segment
Nominal Typical
annual Short description capacity per
capacity cycle (kg)
(kg)
D3 Professional cabinet dryer
Coin & Card, Apartment Household
Laundry
This machine uses hangers to hold the clothing during the drying process. This is useful not only for delicate clothes, but for loads that need to be dried without being previously washed.
8 6 300
D4 Professional tumble dryer, <15 kg
Coin & Card, Apartment Household
Laundry
Similar to BC D1 and BC D2, in this type of machine a current of heated air passes through the load. In this case the humid air is exhausted using ventilation ducts and the electrical heating source is replaced by gas burners or heat exchangers. The capacity of this category is less than 15 kg.
10 14 400
D5 Professional tumble dryer, 15–40 kg
Hospitality
Similar to BC D1 and BC D2, in this type of machine a current of heated air passes through the load. In this case the humid air is exhausted using ventilation ducts and the electrical heating source is replaced by gas burners or heat exchangers. The capacity of this category is between 15 anD40 kg.
23 40 500
D6 Professional tumble dryer, >40 kg
Commercial Industrial Laundry
Similar to BC D1 and BC D2, in this type of machine a current of heated air passes through the load. In this case the humid air is exhausted using ventilation ducts and the electrical heating source is replaced by gas burners or heat exchangers. The capacity of this category is greater than 40 kg.
70 168 000
D7 Pass-through (transfer) tumble dryer
Commercial Industrial Laundry
These dryers have the loading and unloading on opposite ends, and capacities ranging from 40 to 240 kg. They can be electric-, steam-, gas- or heat-exchanger equipped. They have controllers for the temperature and heat recovery, among other features.
400 (kg/hour)
1 020 000
2.2 Inputs in the production phase
Production phase data related to typical EU professional washing machines and dryers
consists of the OMs and the sheetmetal scrap generated during production. The BOM for
each category was already presented in Task 4. In Table 3 and Table 4, the BOM is
presented according to the different categories of materials (e.g. bulk plastics, ferrous
materials)2 and packaging material is included.
2 The full composition can be found in Annex.
13

Final Report
Task 5: Definition of Base Case Preparatory Study EuP Lot 24
Part: Professional Washing Machines and Dryers
Table 3 Composition of the seven professional washing machine BCs, by category of materials
Base case
Unit 1
Bulk Plastics
2 Tech.
Plastics
3 Ferro
4 Non-ferro
5 Coating
6 Electronics
7 Misc.
Total
g 12 977 544 32 362 5 398 0 165 25 143 76 589 WM1
% 16.9% 0.7% 42.3% 7.0% 0.0% 0.2% 32.8% 100.0%
g 8 650 1 050 176 820 18 030 0 4 300 20 100 228 950 WM2
% 3.8% 0.5% 77.2% 7.9% 0.0% 1.9% 8.8% 100.0%
g 24 400 3 600 472 400 79 900 0 18 200 56 400 654 900 WM3
% 3.7% 0.5% 72.1% 12.2% 0.0% 2.8% 8.6% 100.0%
g 94 200 13 800 1 794 000 303 600 0 69 000 232 900 2 507 500 WM4
% 3.8% 0.6% 71.5% 12.1% 0.0% 2.8% 9.3% 100.0%
g 9 904 0 332 340 30 560 0 10 696 23 500 407 000 WM5
% 2.4% 0.0% 81.7% 7.5% 0.0% 2.6% 5.8% 100.0%
g 73 100 20 100 742 500 100 400 0 60 200 78 000 1 074 300 WM6
% 6.8% 1.9% 69.1% 9.3% 0.0% 5.6% 7.3% 100.0%
g 360 000 0 11 400 000 0 0 120 000 0 11 880 000 WM7
% 3.0% 0.0% 96.0% 0.0% 0.0% 1.0% 0.0% 100.0%
Table 4 Composition of the 7 professional dryers BCs, by category of materials
Base case
Unit 1
Bulk Plastics
2 Tech.
Plastics
3 Ferro
4 Non-ferro
5 Coating
6 Electronics
7 Misc.
Total
g 13 534 1 000 40 500 3 500 0 1 900 6 566 67 000 D1
% 20.2% 1.5% 60.4% 5.2% 0.0% 2.8% 9.8% 100.0%
g 11 965 1 000 39 100 3 500 0 1 800 4 635 62 000 D2
% 19.3% 1.6% 63.1% 5.6% 0.0% 2.9% 7.5% 100.0%
g 4 555 0 120 350 14 500 0 3 045 29 550 37 150 D3
% 12.3% 0.0% 69.9% 8.4% 0.0% 8.2% 79.5% 100.0%
g 6 250 0 131 580 9 180 0 4 600 15 890 26 740 D4
% 23.4% 0.0% 78.6% 5.5% 0.0% 17.2% 59.4% 100.0%
g 13 900 0 299 300 20 850 0 10 400 30 350 54 650 D5
% 25.4% 0.0% 79.9% 5.6% 0.0% 19.0% 55.5% 100.0%
g 26 100 0 640 700 44 700 0 22 350 0 48 450 D6
% 53.9% 0.0% 86.0% 6.0% 0.0% 46.1% 0.0% 100.0%
g 9 975 0 2 849 850 66 50 0 3 325 0 2 869 800D7
% 0.3% 0.0% 99.3% 0.2% 0.0% 0.1% 0.0% 100.0%
All professional washing machines base cases, except WM1, have at least 70% of ferrous
materials in their BOMs. For the case of professional laundry dryers, this ferrous material
14

Preparatory Study EuP Lot 24 Part: Professional Washing Machines and Dryers
Final Report Task 5: Definition of Base Case
share is at least 60%. It is expected that the impacts of the production and manufacturing
phases will be mainly due to this category of materials.
Because the EcoReport was initially designed as a simple and generic tool for eco-design
preparatory studies, its database does not include some materials found in professional
laundry machines. These are:
polybutylene terephthalate (PBT);
ethylene propylene diene monomer (EPDM) rubber;
polyoxymethylene (POM);
PE foil;
glass;
chromium;
wood.
When possible, the materials not presented in the database have been re-allocated to the
most similar materials available in the tool:
EPDM rubber was considered as low density polyethylene (LDPE);
PE foil as LDPE;
other plastics as HDPE;
glass as glass for lamps;
POM as high density polyethylene (HDPE); and
wood as cardboard.
These equivalent materials were determined based on the composition of the initial materials
(“closest” material available in EcoReport): for instance, EPDM is usually made of around
60% of LDPE. The choices were also supported by preliminary environmental analysis (see
Table 5, all results were obtained using the method CML 2 baseline 2000 V2.04). EPDM and
LDPE on one hand have very close environmental impacts for most of the indicators. POM
was not found in any life cycle inventory and could thus not be compared to HDPE.
Cardboard has impacts around twice as more important as wood impacts but this
approximation is considered acceptable as soon as packaging is not identified as a major
contributor to any type of environmental impact in the base cases analysis.
15

Final Report
Task 5: Definition of Base Case Preparatory Study EuP Lot 24
Part: Professional Washing Machines and Dryers
Table 5 Life cycle impact assessment of missing individual components (part 1), for 1 kg3
Impact category Unit EPDM rubber LDPE Wood Cardboard
Abiotic depletion kg Sb eq 4.33E-02 4.16E-02 3.37E-03 5.71E-03
Acidification kg SO2 eq 2.91E-02 2.74E-02 3.43E-03 7.29E-03
Eutrophication kg PO43- eq 1.32E-03 1.02E-03 2.71E-04 6.77E-04
Global warming (GWP100)
kg CO2 eq 3.24E+00 3.07E+00 -2.41E+00 -1.05E+00
Ozone layer depletion (ODP)
kg CFC-11 eq 7.94E-06 8.32E-06 2.88E-07 6.79E-07
Photochemical oxidation
kg C2H4 1.07E-02 3.92E-03 2.71E-04 3.53E-04
No equivalent materials were found for chromium and PBT so only the ‘category’ cell (e.g.
bulk plastics, ferrous material) and the weight were completed for these materials.
Consequently, the specific impacts due to the nature of the material are not taken into
account for these two categories but their weight is nonetheless included in the
environmental analysis. This assumption is considered as acceptable since these materials
are only found in BC WM1 and the share of these material categories in the total weight of
the washing machine is very low (2% altogether).
A preliminary environmental analysis supports this assumption, by showing that these two
materials have impacts in the same order of magnitude as (or smaller than) stainless steel
(which represents around 25% of the mass of BC WM1), which justifies the fact that these
materials are neglected based on the low mass allocated to them (see Table 6, all results
were obtained using the method CML 2 baseline 2000 V2.04). Only for the ozone layer
depletion indicator, the two materials have much higher impacts than stainless steel but this
indicator is not taken into account in EcoReport. PBT was not found in any life cycle
inventory so that it was assumed that the impacts of PBT were similar to the ones of PET, to
compare with the stainless steel.
3 All materials from ETH-ESU 96 database.
16

Preparatory Study EuP Lot 24 Part: Professional Washing Machines and Dryers
Final Report Task 5: Definition of Base Case
Table 6 Life cycle impact assessment of missing individual components (part 2), for 1 kg4
Impact category Unit Stainless steel PET Chromium
Abiotic depletion kg Sb eq 2.35E-02 3.46E-02 1.92E-01
Acidification kg SO2 eq 1.68E-01 9.77E-03 1.02E-01
Eutrophication kg PO4 eq 1.22E-03 3.00E-03 7.83E-03
Global warming (GWP100) kg CO2 eq 3.68E+00 2.73E+00 2.65E+01
Ozone layer depletion (ODP) kg CFC-11 eq 5.26E-09 1.21E-07 1.85E-06
Photochemical oxidation kg C2H4 7.22E-03 6.23E-04 5.54E-03
Regarding the sheetmetal scrap percentage generated during the production phase, a rate of
5% has been assumed, based on manufacturers’ feedback and information contained in the
preparatory study on washing machines and dishwashers (Lot 14).
2.3 Inputs in the distribution phase
Input data related to the distribution phase of the product to be used in the MEEuP
EcoReport calculations are based on the volume of the packaged product. These volumes
are exposed in Table 7 and Table 8 below.
Table 7 Volume of packaged product for washing machines base cases
Base case Volume of packaged product (in m3)
WM1 Semi-professional washer extractor 0.95
WM2 Professional washer extractor, <15 kg 1.04
WM3 Professional washer extractor, 15-40 kg 2.22
WM4 Professional washer extractor, >40 kg 6.15
WM5 Professional washer dryer 2.02
WM6 Professional barrier washer 5.04
WM7 Washing tunnel machine 16.58
Shown values correspond to average of values as presented in Task 4
4 All materials from EcoInvent 2.0 database.
17

Final Report
Task 5: Definition of Base Case Preparatory Study EuP Lot 24
Part: Professional Washing Machines and Dryers
Table 8 Volume of packaged product for dryers base cases
Base case Volume of packaged product (in m3)
D1 Semi-professional dryer, condenser 0.53
D2 Semi-professional dryer, air-vented 0.53
D3 Professional cabinet dryer 1.76
D4 Professional tumble dryer, <15 kg 1.52
D5 Professional tumble dryer, 15-40 kg 2.58
D6 Professional tumble dryer, >40 kg 5.75
D7 Pass-trough (transfer) tumble dryer 13.00
Shown values correspond to average of values as presented in Task 4
Two other pieces of information are required in this section. These parameters will be
common for all base cases:
Is it an ICT or Consumer Electronics product <15 kg: No
Is it an installed appliance: Yes
2.4 Inputs in the use phase
Task 3 has shown that products have different resource consumption and functional
performance whether ideal user behaviour or real-life user behaviour is considered. No
standard is commonly applied in Europe to measure the energy, water, and detergent
consumption of professional laundry machines (cf. Task 1 report). The analysis of the
environmental impacts of the use phase is based on the real-life consumption of energy,
water and detergent in each category. In addition to the ideal use, the data includes the
additional consumption through partial workload, maloperation (e.g. deviation from the use of
the standard programs) and the standby consumption in low-power modes (see Task 4).
As presented in Task 3, there can be different energy sources to heat the water or the air for
a same product category. Washing machines can use electricity, internal gas heating,
internal steam heating or can be supplied (partly or fully) with warm water, in which case the
heating happens outside the machine (different energy options also available). In the case of
dryers, the possible options are electricity, internal gas heating or internal steam heating. The
shares of the different heating options in machines sold today are presented per BC in Table
9 and Table 10.
18

Preparatory Study EuP Lot 24 Part: Professional Washing Machines and Dryers
Final Report Task 5: Definition of Base Case
Table 9 Heating options used for water heating in new professional washing machines
Washing machine category
Internal heating,
Electricity (%)
Internal heating,
Natural gas (%)
Internal heating, Steam
(or thermo oil) (%)
External heating
(warm water input),
any source (gas, fuel, etc.)
(%)
WM1: Semi-professional washer extractor
60 0 <5 35
WM2: Professional washer extractor, <15 kg
55 <2 8 35
WM3: Professional washer extractor, 15-40 kg
40 15 25 20
WM4: Professional washer extractor, >40 kg
15 18 60 7
WM5: Professional washer dryer
100 0 0 0
WM6: Professional barrier washer
25 10 45 20
WM7: Washing tunnel machine
0 5 95 0
Table 10 Heating options used for air heating in new professional dryers
Dryer category Internal heating,
Electricity (%)
Internal heating, Natural gas
(%)
Internal heating, Steam
(or thermo oil) (%)
D1: Semi-professional dryer, condenser 100 0 0
D2: Semi-professional dryer, air vented 65 35 0
D3: Professional Cabinet dryer 100 0 0
D4: Professional tumble dryer, <15 kg 45 50 5
D5: Professional tumble dryer, 15-40 kg 30 45 25
D6: Professional tumble dryer, >40 kg 10 50 40
D7: Pass-trough (transfer) tumble dryer 0 65 35
The EcoReport Tool enables energy consumption to be split between electricity and heat
input. However, a single energy source (gas, oil, wood pellets, etc.) has to be selected for the
heat input, along with single process efficiency. Consequently, for simplicity reasons, the
options internal heating with gas, internal heating with steam and external heating will be
modelled together in the case of washing machines, by a gas heating process (atmospheric)
with an efficiency of 90% (Lower Heating Value). This was determined as an average EU
situation with the support of experts of Lot 24, part: dishwasher, in the case of warm water
supply (the external boiler used to heat externally the water is estimated to be an
19

Final Report
Task 5: Definition of Base Case Preparatory Study EuP Lot 24
Part: Professional Washing Machines and Dryers
atmospheric gas boiler). As customers from professional dishwashers and laundry
appliances belong to similar market segments (e.g. hotels and catering sector), the same
assumption will be used for the washing machines and dryers. The internal gas heating may
be a bit more efficient than the internal steam heating (which necessitates firstly the external
heating of the steam) or the warm water supply options, as these options are subject to
additional energy losses during the transport of the warm water or the steam through pipes.
However, the efficiency difference between these three options is estimated much less
important than the difference between their “average” model efficiency (90%, gas atmos-
pheric) and the efficiency of electric heating. For dryers, the same reasoning applies and
internal gas and internal steam heating will be modelled together.
Table 11 and Table 12 summarise the way the energy split (to heat the water or the air) will
be modelled in the analysis and are directly obtained from Table 9 and Table 10. The heat
input with a gas atmospheric process of 90% is now called “Alternative heating” while the
internal electric heating remains “electricity”.
Table 11 Modelling of the water heating for washing machines BCs
Washing machine category Electricity
(in % of the final energy required)
Alternative heating, ‘heat input‘
(in % of the final energy required)
WM1: Semi-professional washer extractor 60 40
WM2: Professional washer extractor, <15 kg 55 45
WM3: Professional washer extractor, 15–40 kg 40 60
WM4: Professional washer extractor, >40 kg 15 85
WM5: Professional washer dryer 100 0
WM6: Professional barrier washer 25 75
WM7: Washing tunnel machine 0 100
Table 12 Modelling of the air heating for dryers BCs
Dryer category Electricity
(in % of the final energy required)
Alternative heating, ‘heat input’
(in % of the final energy required)
D1: Semi-professional dryer, condenser 100 0
D2: Semi-professional dryer, air vented 65 35
D3: Professional cabinet dryer 100 0
D4: Professional tumble dryer, <15 kg 45 55
D5: Professional tumble dryer, 15-40 kg 30 70
D6: Professional tumble dryer, >40 kg 10 90
D7: Pass-through (transfer) tumble dryer 0 100
20

Preparatory Study EuP Lot 24 Part: Professional Washing Machines and Dryers
Final Report Task 5: Definition of Base Case
In washing machines and dryers, energy is not only required to heat the water or the air but
also for electronics and the mechanical parts and actions of the appliances (motors, pumps,
etc.). Therefore, only the share needed for the water/air heating (i.e. not the total energy
consumption) will be split according to the above tables. The remaining share of energy
needed for the functioning of the mechanical parts is always brought in the form of electricity.
The distribution of the energy between the mechanical parts share and the water/air heating
share is presented per BC in Table 13 and Table 14.
Table 13 Energy use split between mechanical and heating parts for washing machines5
Base case
Percentage of energy for motor and electronic
devices etc. (always electricity)
Percentage of energy for water heating
WM1 Semi-professional washing machine and washer extractor
13.5% 86.5%
WM2 Professional washer extractor, <15 kg 13.5% 86.5%
WM3 Professional washer extractor, 15-40 kg 13.5% 86.5%
WM4 Professional washer extractor, >40 kg 12.5% 87.5%
WM5 Professional washer dryer 20.0% 80.0%
WM6 Professional barrier washer 12.5% 87.5%
WM7 Washing tunnel machines 5.0% 95.0%
Table 14 Energy use split between mechanical and heating parts for dryers5
Base case
Percentage of energy for motor and electronic
devices etc. (always electricity)
Percentage of energy for air heating
D1 Semi-professional dryer, condenser 5.0% 95.0%
D2 Semi-professional dryer, air-vented 5.0% 95.0%
D3 Professional cabinet dryer 5.0% 95.0%
D4 Professional tumble dryer, <15 kg 8.0% 92.0%
D5 Professional tumble dryer, 15-40 kg 8.0% 92.0%
D6 Professional tumble dryer, >40 kg 15.0% 85.0%
D7 Pass-trough (transfer) tumble dryer 11.0% 89.0%
All improvement options considered later (see Task 6) will be applicable for implementation
on the BCs, whatever the heating option considered (electric or alternative) that is why it is
5 Source: From manufacturers’ responses to questionnaire.
21

Final Report
Task 5: Definition of Base Case Preparatory Study EuP Lot 24
Part: Professional Washing Machines and Dryers
acceptable to perform the environmental and economic analysis based on these weighted
BCs.
Table 15 presents the methodology used to establish the energy consumption split per
machine. The example corresponds to the category WM1. According to stakeholders, 60% of
the market runs exclusively on electricity, while 40% of the market uses “alternative heating”
for water heating. Thus, 871 kWh of final energy are consumed under the form electricity
(with associated environmental impacts and costs), while 461 kWh of final energy are
brought under the form of ‘heat’, which is modelled to be produced by a gas boiler
(atmospheric, efficiency 90% LHV): (gas) costs and environmental impacts associated with
this process are different than for electricity but are accounted for in the analysis.
Table 15 Example of energy split calculation considering base case WM1
Total energy consumption
(kWh)
Market distribution
water heating
Energy use split
% of energy use
Electrical energy
consumption
Alternative energy
consumption
Mechanic 13.5% 108 - 60% Electric heating Water heating 86.5% 691 -
Mechanic 13.5% 72 - 1 332 40%
Alternative heating Water heating 86.5% - 461
Total (kWh) 871 461
2.4.1 Energy consumption
The energy consumption during the use phase is expected to be one of the major
contributors to the environmental impacts of a professional washing machine or dryer. The
annual energy (under electricity or heat input) consumption is required as an input in
EcoReport, as well as the product lifetime which was evaluated in the market analysis (see
Task 2). These inputs will also be used to calculate the LCC of the BCs.
Based on the energy consumption per kg of laundry processed as presented in Task 4, the
total annual energy required per BC is shown in Table 16 and Table 17. Furthermore, the
tables illustrate the proportion of electricity and alternative energy consumption for each of
the BCs, according to the modelling approach previously presented.
22

Preparatory Study EuP Lot 24 Part: Professional Washing Machines and Dryers
Final Report Task 5: Definition of Base Case
Table 16 Total annual energy consumption and proportion of electricity and alternative energy consump-tion for all professional washing machine base cases
Base case
Total annual energy
consumption (kWh per year)
Proportion of electricity
consumption (kWh per year)
Proportion of alternative energy
consumption (kWh per year)
WM1 Semi-professional washing machine and washer extractor
1 332 871 461
WM2 Professional washer extractor, <15 kg
3 026 1 979 1 047
WM3 Professional washer extractor, 15-40 kg
10 973 5 278 5 695
WM4 Professional washer extractor, >40 kg
81 648 29 597 52 051
WM5 Professional washer dryer 7 400 7 400 -
WM6 Professional barrier washer 26 461 9 096 17 365
WM7 Washing tunnel machines 1 606 500 80 325 1 526 175
Table 17 Total annual energy consumption and proportion of electricity and alternative energy consump-tion for all professional dryer base cases
Base case Total annual energy
consumption (kWh per year)
Proportion of electricity
consumption (kWh per year)
Proportion of alternative energy
consumption (kWh per year)
D1 Semi-professional dryer, condenser
4 877 4 877 -
D2 Semi-professional dryer, air-vented
4 552 3 038 1 514
D3 Professional cabinet dryer 5 924 5 924 -
D4 Professional tumble dryer, <15 kg
9 936 4 908 5 028
D5 Professional tumble dryer, 15-40 kg
32 805 11 679 21 126
D6 Professional tumble dryer, >40 kg
171 360 40 270 131 090
D7 Pass-trough (transfer) tumble dryer
979 200 107 712 871 488
23

Final Report
Task 5: Definition of Base Case Preparatory Study EuP Lot 24
Part: Professional Washing Machines and Dryers
2.4.2 Water consumption
Table 18 presents the annual water consumption of the 7 washing machine base cases.
Table 18 Water consumption per year for all professional washing machine base cases
Base case Water consumption (in m3 per year)
WM1 Semi-professional washer extractor 85
WM2 Professional washer extractor, <15 kg 233
WM3 Professional washer extractor, 15-40 kg 741
WM4 Professional washer extractor, >40 kg 3 266
WM5 Professional washer dryer 100
WM6 Professional barrier washer 1 081
WM7 Washing tunnel machines 27 540
2.4.3 Detergent and laundry aid consumption
Table 19 presents the annual detergent consumption including laundry aid of the 7
professional washing machine base cases.
Table 19 Detergent consumption per year for all professional washing machine base cases
Base case Detergent consumption (in kg per year)
WM1 Semi-professional washer extractor 161
WM2 Professional washer extractor, <15 kg 330
WM3 Professional washer extractor, 15-40 kg 798
WM4 Professional washer extractor, >40 kg 4 199
WM5 Professional washer dryer 140
WM6 Professional barrier washer 1 216
WM7 Washing tunnel machines 41 310
2.4.4 Travelling distance for maintenance and repair over the product life
For all base cases, the number of kilometres travelled for maintenance and repair for one
machine was estimated to be 100 km for category WM2 and D4 over the product lifetime.
This value was then extrapolated in proportion to the price for the other categories. The
values are presented in Table 20 and Table 21. The transportation of the garments by the
user (for instance, a customer driving to a launderette) is not taken into account in the
analysis.
24

Preparatory Study EuP Lot 24 Part: Professional Washing Machines and Dryers
Final Report Task 5: Definition of Base Case
Table 20 Travelled distance for maintenance and repair during the lifetime for all professional washing machine base cases
Category Price (€) Distance (km)
WM1 Semi-professional washer extractor 2 670 53
WM2 Professional washer extractor, <15 kg 5 000 100
WM3 Professional washer extractor, 15-40 kg 15 250 305
WM4 Professional washer extractor, >40 kg 58 750 1 175
WM5 Professional washer dryer 8 000 160
WM6 Professional barrier washer 38 250 765
WM7 Washing tunnel machines 390 000 7 800
Table 21 Travelled distance for maintenance and repair during the lifetime for all professional dryer base cases
Category Price (€) Distance (km)
D1 Semi-professional dryer, condenser 1 970 49
D2 Semi-professional dryer, air-vented 1 680 42
D3 Professional cabinet dryer 3 500 88
D4 Professional tumble dryer, <15 kg 4 000 100
D5 Professional tumble dryer, 15-40 kg 7 125 178
D6 Professional tumble dryer, >40 kg 21 500 538
D7 Pass-through (transfer) tumble dryer 62 500 1 563
2.5 Inputs in the end-of-life phase
There is no evidence of hazardous materials that could be released into the environment
during the end-of-life phase, e.g. refrigerant or mercury, in these machines. According to
stakeholder feedback, the use of silver ions due to their antimicrobial properties is not
applied anymore. Due to warnings from the German Bundesinstitut für Risikobewertung BfR
(Federal Institute for Risk Assessment)6, especially for nano silver, the market seems to be
giving up this option. Possible harmful aspects, bacterial resistance and the lack of
comprehensive data to allow conclusive risk assessments are the main reasons for the
warnings expressed regarding the use of silver ions (for further details see Task 4).
Heat pumps for heat recovery are considered as improvement options. The refrigerants
contained in these equipments will be taken into account in Tasks 6 and 7 only.
It is assumed that an important share of the professional laundry machines’ materials are
recycled and reused. We assumed that during the end-of-life phase:
6 www.bfr.bund.de
25

Final Report
Task 5: Definition of Base Case Preparatory Study EuP Lot 24
Part: Professional Washing Machines and Dryers
5% by weight of the products are not recovered (i.e. go to landfill)
95% by weight recovery rate; the materials follow one of the following options:
‒ Metals are recycled;
‒ Paper, cardboard, and plastics are incinerated (thermal recycling with possible
benefits of energy recovery) or mechanically recycled. Plastics may also be
directly reused;
‒ Other types of waste (concrete, bitumen) go to landfill. Hazardous waste consists
only of electronic components, which are considered easy to disassemble and are
in limited quantity (around 1% of the total weight).
Regarding the plastic fraction, the following end-of-life management options were estimated
for all base cases, based on stakeholders’ feedback:
Re-use, closed loop recycling: 1%
Material (or mechanical) recycling: 29%
Thermal recycling: 70%.
2.6 Economic inputs
Economic data used for the calculation of the LCCs were elaborated in Task 2 (product
lifetime and product prices, electricity rates, water and consumables rates) and completed
thanks to a complementary questionnaire. The product prices were estimated with the data
aggregation used for the definition of the base cases and based on stakeholders’ comments.
In Table 22, the inputs of lifetime from Task 2 and Task 3 are presented for all base cases.
Table 22 Professional washing machines and dryers lifetimes (years)
Category Cycles
per lifetime Cycles
per year Lifetime
(in years)
WM1 Semi-professional washing machine and washer extractor 15 000. 1 800 8
WM2 Professional washer extractor, <15 kg 30 000. 2 400 12
WM3 Professional washer extractor, 15-40 kg 30 000. 2 200 14
WM4 Professional washer extractor, >40 kg 40 000. 2 700 15
WM5 Professional washer dryer 20 000. 1 760 11
WM6 Professional barrier washer 30 000. 2 200 14
WM7 Washing tunnel machines 40 000* 3 000 13
D1 Semi-professional dryer, condenser 15 000. 1 800 8
D2 Semi-professional dryer, air-vented 15 000. 1 800 8
D3 Professional cabinet dryer 20 000. 1 760 15
D4 Professional tumble dryer, <15 kg 30 000. 2 400 13
26

Preparatory Study EuP Lot 24 Part: Professional Washing Machines and Dryers
Final Report Task 5: Definition of Base Case
27
Category Cycles
per lifetime Cycles
per year Lifetime
(in years)
D5 Professional tumble dryer, 15-40 kg 30 000. 2 200 14
D6 Professional tumble dryer, >40 kg 40 000. 3 000 13
D7 Pass-through (transfer) tumble dryer 40 000* 3 000 13
* hours
Table 23 and Table 24 present the sales and stock figures and product prices for the 14 base
cases. The installation cost of the laundry appliance is taken into account as a percentage of
the product price: 9% for categories WM7 and D7, and 4% for all the other categories. The
maintenance costs, as expressed in Task 2, are:
3% of the purchase price of the product over the whole lifetime for categories WM1-2-
3-5 and D1-2-3-4-5;
25% of the purchase price over the whole lifetime for categories WM4-6-7;
18% of the purchase price over the whole lifetime for categories D6-7.
The disposal costs were considered to be zero, as the machines are never landfilled but
processed by recyclers.

Final Report
Task 5: Definition of Base Case Preparatory Study EuP Lot 24
Part: Professional Washing Machines and Dryers
Table 23 EcoReport economic inputs of the professional washing machine base cases
Base case Sales
(mln units) Stock
(mln units) Product price
(€) Installation (€)
Maintenance costs (€)
WM1 Semi-professional washer extractor 0.02500 0.193138 2 670 107 80
WM2 Professional washer extractor, <15 kg 0.04550 0.557279 5 000 200 150
WM3 Professional washer extractor, 15-40 kg 0.00620 0.081378 15 250 610 458
WM4 Professional washer extractor, >40 kg 0.00020 0.002799 58 750 2 350 14 688
WM5 Professional washer dryer 0.00020 0.002093 8 000 320 240
WM6 Professional barrier washer 0.00085 0.010470 38 250 1 530 9 563
WM7 Washing tunnel machines 0.00025 0.003062 390 000 35 100 97 500
Table 24 EcoReport economic inputs of the professional dryer base cases
Base case Sales
(mln units) Stock
(mln units) Product price
(€) Installation (€)
Maintenance costs (€)
D1 Semi-professional dryer, condenser 0.0032 0.024722 1 970 79 59
D2 Semi-professional dryer, air-vented 0.0043 0.033220 1 680 67 50
D3 Professional cabinet dryer 0.0107 0.149738 3 500 140 105
D4 Professional tumble dryer, <15 kg 0.0160 0.195966 4 000 160 120
D5 Professional tumble dryer, 15-40 kg 0.0035 0.045939 7 125 285 214
D6 Professional tumble dryer, >40 kg 0.0003 0.003674 21 500 860 3 870
D7 Pass-through (transfer) tumble dryer 0.0012 0.014697 62 500 5 625 11 250
28

Preparatory Study EuP Lot 24 Part: Professional Washing Machines and Dryers
Final Report Task 5: Definition of Base Case
The running costs will be calculated based on the user behaviour and the consumables rates
presented in Table 25 and
Table 26. Gas costs of the “alternative heating” are included in the analysis.
Table 25 Energy, water and consumables rates, by professional washing machine base case
Base case Electricity
rate (€/kWh)
Gas rate (€/GJ)
Water rate (€/m3)
Detergent/Rinse aid rate (€/kg)
WM1 Semi-professional washing machine and washer extractor
WM2 Professional washer extractor, <15 kg
0.138 11.2115
WM3 Professional washer extractor, 15-40 kg 0.105 10.0097
WM4 Professional washer extractor, >40 kg 0.090 8.7921
WM5 Professional washer dryer
WM6 Professional barrier washer 0.105 10.0097
WM7 Washing tunnel machines 0.090 8.7921
2.64 2.00
Table 26 Energy rates, by professional dryer base case
Base case Electricity rate (€/kWh) Gas rate (€/GJ)
D1 Semi-professional dryer, condenser
D2 Semi-professional dryer, air-vented
D3 Professional cabinet dryer
D4 Professional tumble dryer, <15 kg
0.138 11.2115
D5 Professional tumble dryer, 15-40 kg 0.105 10.0097
D6 Professional tumble dryer, >40 kg
D7 Pass-through (transfer) tumble dryer 0.090 8.7921
The discount rate was provided by the European Commission: 4% will be used for all base
cases.
There is a significant efficiency difference between the appliances being sold today and the
appliances being used in the stock. This is a direct result from the steady progress that the
industry has been making towards the reduction of the products’ environmental impacts,
combined with the quite long lifetimes of products in this study. This could lead to an
underestimation of the environmental impacts of the products in this study as all the base
cases represent products currently sold on the market, are thus expected to be more efficient
than the average product in stock.
According to the industry, the energy and water consumption has decreased around 65%
when comparing the top class current model with the average ten-year old model. The water
29

Final Report
Task 5: Definition of Base Case Preparatory Study EuP Lot 24
Part: Professional Washing Machines and Dryers
consumption over the past 25 years has decreased around 75%. However, comparing top of
the range machines, the improvement has been 15%. This overall improvement ratio is
considered for all base cases.
Table 27 Overall improvement ratios for all professional laundry appliance base cases
Improvement ratios: ten year old product consumption divided by new product consumption
Energy consumption Water consumption Overall improvement
ratio
1.60 1.15 1.30
3 Base case environmental impact assessment
The aim of this subtask is to assess the environmental impact of each base case following
the MEEuP (EcoReport Unit Indicators) for each life cycle stage:
Raw Materials Use and Manufacturing (Production phase);
Distribution;
Use;
End-of-Life.
The BC environmental impact assessment will lead to the identification of basic technological
design parameters of outstanding environmental relevancy.7 These parameters will be listed
as they will serve as an important input to the identification of Eco-design options. The
assessment results are tracked back to the main contributing components (e.g. motor, drum),
materials and features of professional laundry machines and dryers.
Seventeen environmental indicators are considered in the EcoReport tool. Of these, 13 are
relevant to professional laundry appliances, while others have no to very little impact:
Total Gross Energy Requirement, in MJ primary;
Electricity, in kWh;
Process Water, in litre;
Hazardous Solid Waste, in g;
Non-hazardous waste, in g;
Global Warming Potential (GWP), in CO2 equivalent;
Acidification potential, in SO2 equivalent;
7 As far as the MEEuP EcoReport allows the identification of such indicators.
30

Preparatory Study EuP Lot 24 Part: Professional Washing Machines and Dryers
Final Report Task 5: Definition of Base Case
Volatile Organic Compounds (VOC), in mg;
Persistent Organic Pollutants (POP), in I-Teq;
Heavy Metals (HM), in Nickel equivalent;
Polycyclic Aromatic Hydrocarbons (PAH), in Nickel equivalent;
Particulate Matter;
Eutrophication Potential, in PO4 equivalent.
3.1 Base case WM1: Semi-professional washer extractor
Table 28 shows the environmental impacts of a semi-professional washer extractor over its
whole life cycle. The total energy consumption for the whole life cycle of base case WM1 is
135 897 MJ, of which 74 187 MJ (i.e. 7 065 kWh) electricity8.
Figure 2 exposes the contribution of each life cycle phase to each impact. The total impact of
a category is shown as 100%. However, this does not mean that each of the impacts in each
category is equally important. The categories are not directly comparable. Several observa-
tions can be made from this analysis:
The materials involved in the production of these machines have high relative impact
with regard to heavy metals and PAHs. They have medium impact in the production of
non-hazardous waste and POP. The main contributor to the impact is the stainless
steel, followed by the propylene, aluminium and copper.
The manufacturing phase has little impact over the lifetime of these machines. For all
categories its impact is between 0 and 1% of the total impact.
The distribution phase has the biggest impact regarding the particulate matter impact,
since these are installed machines that require preliminary transportation.
The use phase represents more than the 75% of the impact for most of the categories.
Its influence is less important for hazardous waste, VOCs, heavy metals to air, PAHs
and particulate matter. In particular, it accounts for about 95% of the total energy con-
sumption (98% of the total electricity consumption) and 99% of lifetime water consump-
tion.
The end-of-life phase has significant impact only for the hazardous waste indicator
(more than 75%). The amount of plastics in this machine is the main reason for this
high value. Also, it is the second most important phase regarding the particulate matter
indicator, closely followed by the use phase.
8 In MEEuP, a conversion factor of 10.5 MJ/kWhe for the public grid is specified.
31

Final Report
Task 5: Definition of Base Case Preparatory Study EuP Lot 24
Part: Professional Washing Machines and Dryers
32

Preparatory Study EuP Lot 24 Part: Professional Washing Machines and Dryers
Final Report Task 5: Definition of Base Case
Table 28 Life Cycle Impact (per unit) of base case 1 – WM1 Semi-professional washer extractor
PRODUCTION END-OF-LIFE* Life Cycle phases
Resource Use and Emissions
Material Manuf. Total
DISTRI-BUTION
USE Dis-posal
Recycl. Total TOTAL
Other Resources & Waste
Total Energy (GER) MJ 3 376 945 4 321 1 101 130 349 925 800 125 135 897
of which, electricity (in primary MJ) MJ 448 566 1 014 3 73 185 0 15 -15 74 187
Water (process) ltr 1 786 8 1 795 - 686 278 - 10 -10 688 062
Water (cooling) ltr 1 133 264 1 398 - 195 147 - 82 -82 196 462
Waste, non-haz./ landfill g 61 491 3 129 64 620 480 133 282 4 708 58 4 650 203 032
Waste, hazardous/ incinerated g 180 0 180 10 2 638 9 465 9 9 456 12 283
Emissions (Air)
Greenhouse Gases in GWP100 kg CO2 eq 221 53 273 66 5 877 69 49 20 6 237
Ozone Depletion, emissions mg R-11 eq Negligible
Acidification, emissions g SO2 eq 1 954 227 2 181 201 29 813 141 67 74 32 269
Volatile Organic Compounds (VOC) G 7 0 7 20
57 3 1 2
86
Persistent Organic Pollutants (POP) ng i-Teq 262 13 275 3 753 33 - 33 1 063
Heavy Metals mg Ni eq 3 185 30 3 215 24 2 023 253 - 253 5 515
PAHs mg Ni eq 322 0 322 44 257 - 1 -1 622
Particulate Matter (PM, dust) G 397 35 432 3 230 1 109 1 266 2 1 263 6 034
Emissions (Water)
Heavy Metals mg Hg/20 2 057 0 2 057 1 492 75 - 75 2 625
Eutrophication g PO4 55 0 55 0 69 041 4 0 4 69 100
Persistent Organic Pollutants (POP) ng i-Teq Negligible
Negative values indicate environmental credits (impacts avoided) due to recycling
33

Final Report
Task 5: Definition of Base Case Preparatory Study EuP Lot 24
Part: Professional Washing Machines and Dryers
0%
10%
20%
30%
40%
50%
60%
70%
80%
90%
100%
End‐of‐Life
Use
Distribution
Manufacturing
Material
Figure 2 Distribution of environmental impacts of BC WM1 per life cycle phase
34

Preparatory Study EuP Lot 24 Part: Professional Washing Machines and Dryers
Final Report Task 5: Definition of Base Case
35
3.2 Base case WM2: Professional washer extractor <15 kg
Table 29 shows the environmental impacts of a professional washer extractor <15 kg over its
whole life cycle. The total energy consumption for the whole life cycle of base case WM2 is
449 673 MJ, of which 254 710 MJ (i.e. 24 258 kWh) electricity.
Figure 3 shows the contribution of each life cycle phase to each impact. Several observa-
tions can be made from this analysis:
The use phase is responsible for almost 100% of the total energy consumption
(including electricity), water (process) and eutrophication. The latter is related to the
amount of detergent discarded from the process. The influence of this phase is also
very important during the production of greenhouse-gas emissions, acidification and
VOCs. For other indicators such as non-hazardous wastes, hazardous wastes, POPs
and heavy metals, its impact is around 50% of the total.
The materials involved in production have a significant influence in PAHs, heavy metals
emissions, POP and non-hazardous waste. The reason for this is the amount of metal
and plastics required for the production of the machines, i.e. stainless steel, galvanised
steel, plastics, aluminium and electronics.
The impact of manufacturing is minor for all categories.
The impact of the distribution phase is only important regarding particulate matter. This
is related to the transportation for the installation.
Finally, the end-of-life phase is responsible for around 35% of the production of
hazardous waste along the life cycle, and almost 20% of the particulate matter.

Final Report
Task 5: Definition of Base Case Preparatory Study EuP Lot 24
Part: Professional Washing Machines and Dryers
Table 29 Life Cycle Impact (per unit) of base case 2 – WM2 Professional washer extractor <15 kg
PRODUCTION END-OF-LIFE* Life Cycle phases
Resources Use and Emissions
Material Manuf. Total
DISTRI-BUTION
USE Disposal Recycl. Total
TOTAL
Other Resources & Waste
Total Energy (GER) MJ 14 572 3 196 17 768 1 207 430 291 1 258 851 407 449 673
of which, electricity (in primary MJ) MJ 3 406 1 904 5 310 3 249 408 0 11 -11 254 710
Water (process) ltr 6 461 28 6 489 - 2 819 066 - 7 -7 2 825 547
Water (cooling) ltr 1 564 878 2 442 - 664 970 - 59 -59 667 353
Waste, non-haz./ landfill G 331 973 11 265 343 238 523 439 496 14 043 42 14 002 797 259
Waste, hazardous/ incinerated G 2 866 1 2 866 10 8 695 6 790 7 6 784 18 355
Emissions (Air)
Greenhouse Gases in GWP100 kg CO2 eq. 1 060 179 1 239 72 19 417 94 56 38 20 766
Ozone Depletion, emissions mg R-11 eq. Negligible
Acidification, emissions g SO2 eq. 6 957 771 7 728 220 98 022 188 74 114 106 084
Volatile Organic Compounds (VOC) g 54 1 55 22 185 5 1 4 266
Persistent Organic Pollutants (POP) ng i-Teq 3 426 94 3 521 3 2 500 97 - 97 6 121
Heavy Metals mg Ni eq. 8 700 221 8 921 27 6 594 355 - 355 15 896
PAHs mg Ni eq. 1 633 0 1 633 48 811 - 1 -1 2 491
Particulate Matter (PM, dust) g 1 317 119 1 436 3 555 2 980 1 682 2 1 680 9 651
Emissions (Water)
Heavy Metals mg Hg/20 7 040 0 7 041 1 1 678 104 - 104 8 823
Eutrophication g PO4 155 1 156 0 212 269 6 0 6 212 431
Persistent Organic Pollutants (POP) ng i-Teq Negligible
Negative values indicate environmental credits (impacts avoided) due to recycling
36

Preparatory Study EuP Lot 24 Part: Professional Washing Machines and Dryers
Final Report Task 5: Definition of Base Case
0%
10%
20%
30%
40%
50%
60%
70%
80%
90%
100%
End‐of‐Life
Use
Distribution
Manufacturing
Material
Figure 3 Distribution of environmental impacts of BC WM2 per life cycle phase
37

Final Report
Task 5: Definition of Base Case Preparatory Study EuP Lot 24
Part: Professional Washing Machines and Dryers
38
3.3 Base case WM3: Professional washer extractor, 15-40 kg
Table 30 shows the environmental impacts of a professional washer extractor, 15-40 kg over
its whole life cycle. The total energy consumption for the whole life cycle of base case WM3
is 1 514 124 MJ, of which 783 294 MJ (i.e. 74 599 kWh) electricity.
Figure 4 exposes the contribution of each life cycle phase to each impact. Several
observations can be made from this analysis:
In this case, the use phase is as expected the biggest contributor for almost all the
impacts. For the total energy, water (process), hazardous waste, green house gases,
and acidification, this phase accounts for more than 90% of the impacts. For non-
hazardous waste, VOCs, persistent organic pollutants (POP), particulate matter and
heavy metals, its contribution is between 50 and 90%.
The materials involved in the production phase are the 2nd biggest contributor to the
impacts, having relevance in the heavy metals, POP, particulate matter, non-hazardous
waste and PAHs indicators. The main materials identified are stainless steel, steel,
plastics (polyster, Acrylonitrile Butadiene Styrene, etc) and aluminum.
End-of-life and distribution phases have significant contributions only for hazardous
waste and particulate matter respectively. The end-of-life also contributes to particulate
matter production with almost 20% of the total. The transportation (often by truck)
required for the installation of these rather heavy machines generates particulate
matter.

Preparatory Study EuP Lot 24 Part: Professional Washing Machines and Dryers
Final Report Task 5: Definition of Base Case
Table 30 Life Cycle Impact (per unit) of base case 3 – WM 3 Professional washer extractor, 15-40 kg
PRODUCTION END-OF-LIFE* Life Cycle phases
Resources Use and Emissions
Material Manuf. Total
DISTRI-BUTION
USE Disposal Recycl. Total
TOTAL
Other Resources & Waste
Total Energy (GER) MJ 36 493 4 743 41 236 2 517 1 475 857 3 611 9 097 -5 486 1 514 124
of which, electricity (in primary MJ) MJ 4 546 2 832 7 377 6 775 942 0 31 -31 783 294
Water (process) ltr 12 948 42 12 990 0 10 428 906 0 20 -20 10 441 876
Water (cooling) ltr 35 475 1 312 36 787 0 2 069 349 0 171 -171 2 105 965
Waste, non-haz./ landfill g 345 533 16 331 361 864 1 059 1 317 798 40 171 120 40 050 1 720 770
Waste, hazardous/ incinerated g 2 119 1 2 120 21 26 139 19 601 19 19 582 47 862
Emissions (Air)
Greenhouse Gases in GWP100 kg CO2 eq. 2 157 265 2 421 149 68 411 269 656 -387 70 595
Ozone Depletion, emissions mg R-11 eq. Negligible
Acidification, emissions g SO2 eq. 13 569 1 142 14 711 456 298 171 540 835 -295 313 043
Volatile Organic Compounds (VOC) g 54 1 55 46 688 13 11 2 791
Persistent Organic Pollutants (POP) ng i-Teq 3 900 111 4 011 6 7 469 277 0 277 11 763
Heavy Metals mg Ni eq. 20 338 260 20 598 54 19 810 1 020 0 1 020 41 482
PAHs mg Ni eq. 325 0 325 100 2 404 0 2 -2 2 828
Particulate Matter (PM, dust) g 4 720 176 4 896 7 588 9 069 4 828 17 4 811 26 364
Emissions (Water)
Heavy Metals mg Hg/20 12 658 0 12 658 2 5 130 297 0 297 18 087
Eutrophication g PO4 947 2 949 0 598 864 17 1 16 599 829
Persistent Organic Pollutants (POP) ng i-Teq Negligible
Negative values indicate environmental credits (impacts avoided) due to recycling
39

Final Report
Task 5: Definition of Base Case Preparatory Study EuP Lot 24
Part: Professional Washing Machines and Dryers
0%
10%
20%
30%
40%
50%
60%
70%
80%
90%
100%
End‐of‐Life
Use
Distribution
Manufacturing
Material
Figure 4 Distribution of environmental impacts of BC WM3 per life cycle phase
40

Preparatory Study EuP Lot 24 Part: Professional Washing Machines and Dryers
Final Report Task 5: Definition of Base Case
41
3.4 Base case WM4: Professional washer extractor, >40 kg
Table 31 shows the environmental impacts of a professional washer extractor, >40 kg over
its whole life cycle. The total energy consumption for the whole life cycle of base case WM4
is 10 193 432 MJ, of which 4 687 820 MJ (i.e. 446 459 kWh) electricity.
Figure 5 shows the contribution of each life cycle phase to each impact. Several
observations can be made from this analysis:
As for the other models, the use phase is the one with the greater impact. Its impact is
almost 100% regarding total energy (GER), water (process), GHG and acidification
emissions and eutrophication. This is a consequence of the high energy consumption
per cycle, and the use of detergent in the laundry process. The impact of the use phase
is over 90% for VOCs and around 60% for non-hazardous wastes, POPs and heavy
metals. This phase has less relevant impact for PAHs and particulate matter generation
(around 40%).
The extraction of raw materials involved in the machine production can be considered
as the second most impacting phase. This phase contributes almost 60% of the PAHs
and around 40% for POP, heavy metals and non-hazardous waste. The materials
having the largest contributions are steel, copper and polyamide used for the
construction of the machines.
The distribution phase contributes 20% of the particulate matter, since these are
installed units.
The end-of-life phase contributes with more than 35% of the hazardous waste and over
15% of the particulate matter.

Final Report
Task 5: Definition of Base Case Preparatory Study EuP Lot 24
Part: Professional Washing Machines and Dryers
Table 31 Life Cycle Impact (per unit) of base case WM4 – Professional washer extractor, >40 kg
PRODUCTION END-OF-LIFE* Life Cycle phases
Resources Use and Emissions Material Manuf. Total
DISTRI-BUTION
USE Dis-posal
Re-cycling
TOTAL
Total
Other Resources & Waste
Total Energy (GER) MJ 133 054 26 272 159 327 6 882 10 023 676 13 864 10 317 3 547 10 193 432
of which, electricity (in primary MJ) MJ 10 407 15 663 26 070 17 4 661 851 0 120 -119 4 687 820
Water (process) ltr 42 134 231 42 365 0 49 347 985 0 79 -79 49 390 271
Water (cooling) ltr 15 217 7 234 22 450 0 12 431 133 0 659 -659 12 452 924
Waste, non-haz./ landfill g 4 518 972
91 836 4 610 808 2 842 7 788 304 153 807 463 153 344
12 555 297
Waste, hazardous / incinerated g 843 4 847 56 153 878 75 602 73 75 529 230 311
Emissions (Air)
Greenhouse Gases in GWP100 kg CO2 eq. 9 276 1 467 10 743 406 476 486 1 033 682 352 487 987
Ozone Depletion, emissions mg R-11 eq. Negligible
Acidification, emissions g SO2 eq. 79 527 6 333 85 861 1 242 1 777 768 2 075 905 1 169 1 866 039
Volatile Organic Compounds (VOC) g 250 8 258 127 4 996 50 12 39 5 420
Persistent Organic Pollutants (POP)
ng i-Teq 27 618 718 28 336 16 44 052 1 060 0 1 060 73 464
Heavy Metals mg Ni eq. 84 330 1 682 86 012 144 116 032 3 915 0 3 915 206 104
PAHs mg Ni eq. 20 560 2 20 562 273 14 065 0 7 -7 34 894
Particulate Matter (PM, dust) g 15 789 974 16 763 21 021 48 193 18 540 26 18 514 104 491
Emissions (Water)
Heavy Metals mg Hg/20 63 161 1 63 162 5 30 691 1 141 0 1 141 94 998
Eutrophication g PO4 1 461 11 1 472 0 3 376 216 65 3 63 3 377 751
Persistent Organic Pollutants (POP) ng i-Teq Negligible
Negative values indicate environmental credits (impacts avoided) due to recycling
42

Preparatory Study EuP Lot 24 Part: Professional Washing Machines and Dryers
Final Report Task 5: Definition of Base Case
0%
10%
20%
30%
40%
50%
60%
70%
80%
90%
100%
End‐of‐Life
Use
Distribution
Manufacturing
Material
Figure 5 Distribution of environmental impacts of BC WM4 per life cycle phase
43

Final Report
Task 5: Definition of Base Case Preparatory Study EuP Lot 24
Part: Professional Washing Machines and Dryers
44
3.5 Base case WM5: Professional washer dryer
Table 32 shows the environmental impacts of a professional washer dryer over its whole life
cycle. The total energy consumption for the whole life cycle of base case WM5 is 937 133
MJ, of which 865 385 MJ (i.e. 7 864 kWh) electricity.
Figure 6 shows the contribution of each life cycle phase to each impact. Several
observations can be made from this analysis:
For this category, the impact of the use phase is less dominating than for the previous
ones. However, it is still almost 100% regarding energy consumption (including
electricity), water (process), GHGs, acidification and eutrophication. It also has an
important impact on non-hazardous waste production, hazardous waste production,
VOCs and heavy metals. Its contribution to these indicators varies from 60 to 80%.
The materials used in the production phase have a high contribution for POP, PAHs,
non-hazardous waste and heavy metals production. This is a result of the amount of
metals used for these machines. The components having the greatest impact are
galvanised steel and electronics components (printed wiring boards).
The distribution phase only has an influence on the particulate matter generation along
the lifetime. This is related to the long distance travelled during the distribution of the
equipment for installation. It represents almost 40% of the total impact.
Finally, the end-of-life phase has non negligible impacts on the hazardous waste and
particulate matter, between 10 and 20%. This is related to the plastics and electronics
found in these machines.

Preparatory Study EuP Lot 24 Part: Professional Washing Machines and Dryers
Final Report Task 5: Definition of Base Case
Table 32 Life Cycle Impact (per unit) of base case WM5 – Professional washer extractor, >40 kg
PRODUCTION END-OF-LIFE* Life Cycle phases
Resources Use and Emissions
Material Manuf. Total
DISTRI-BUTION
USE Disposal Recycl. Total
TOTAL
Other Resources & Waste
Total Energy (GER) MJ 23 676 5 502 29 178 2 289 904 666 1 876 876 1 000 937 133
of which, electricity (in primary MJ) MJ 7 309 3 275 10 584 6 854 806 0 11 -11 865 385
Water (process) ltr 8 167 48 8 215 0 1 157 135 0 7 -7 1 165 344
Water (cooling) ltr 2 062 1 508 3 570 0 2 279 236 0 60 -60 2 282 745
Waste, non-haz./ landfill g 694 615 19 528 714 143 966 1 055 265 24 958 42 24 915 1 795 289
Waste, hazardous/ incinerated g 7 022 1 7 023 19 20 901 6 933 7 6 926 34 870
Emissions (Air)
Greenhouse Gases in GWP100 kg CO2 eq. 1 706 307 2 013 136 39 499 140 57 83 41 731
Ozone Depletion, emissions mg R-11 eq. Negligible
Acidification, emissions g SO2 eq. 10 127 1 328 11 455 415 233 005 279 77 202 245 078
Volatile Organic Compounds (VOC) g 114 2 116 42 348 7 1 6 512
Persistent Organic Pollutants (POP) ng i-Teq 8 231 173 8 403 5 6 009 172 0 172 14 590
Heavy Metals mg Ni eq. 6 897 405 7 301 49 15 665 536 0 536 23 552
PAHs mg Ni eq. 1 676 0 1 677 91 1 881 0 1 -1 3 648
Particulate Matter (PM, dust) g 1 610 204 1 814 6 888 6 401 2 488 2 2 485 17 588
Emissions (Water)
Heavy Metals mg Hg/20 8 046 0 8 046 2 5 591 155 0 155 13 794
Eutrophication g PO4 145 2 147 0 82 573 9 0 9 82 729
Persistent Organic Pollutants (POP) ng i-Teq Negligible
Negative values indicate environmental credits (impacts avoided) due to recycling
45

Final Report
Task 5: Definition of Base Case Preparatory Study EuP Lot 24
Part: Professional Washing Machines and Dryers
0%
10%
20%
30%
40%
50%
60%
70%
80%
90%
100%
End‐of‐Life
Use
Distribution
Manufacturing
Material
Figure 6 Distribution of environmental impacts of BC WM5 per life cycle phase
46
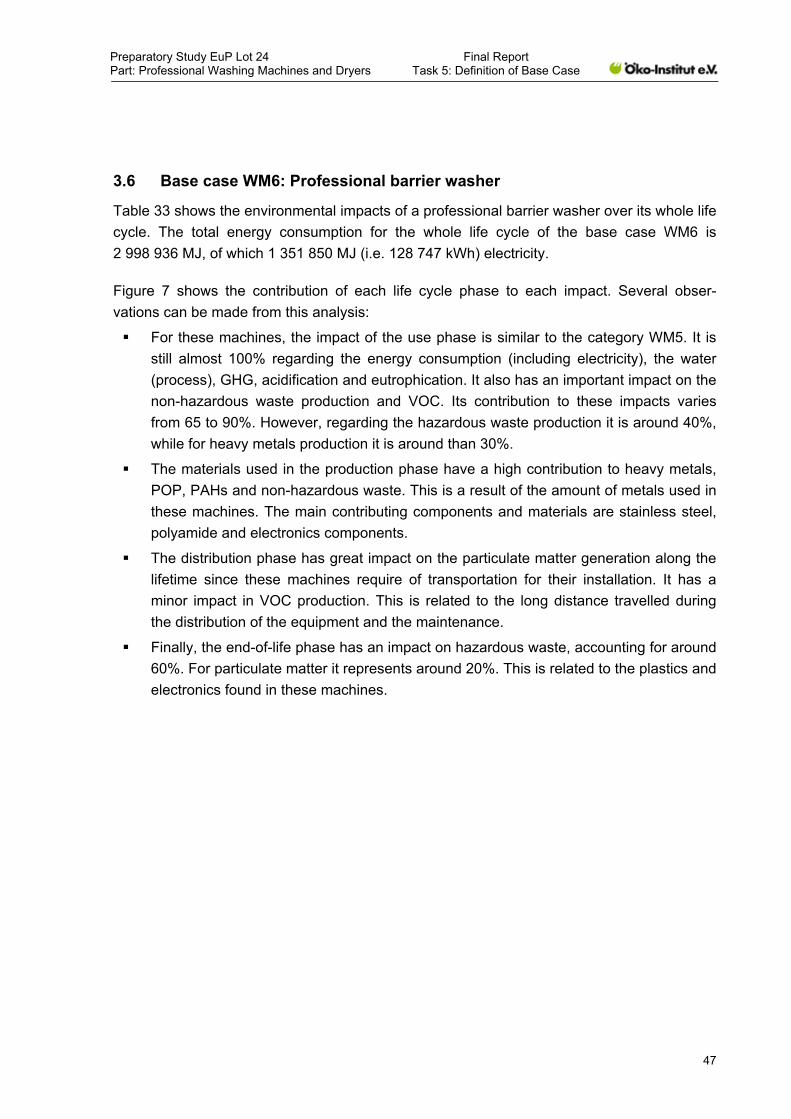
Preparatory Study EuP Lot 24 Part: Professional Washing Machines and Dryers
Final Report Task 5: Definition of Base Case
47
3.6 Base case WM6: Professional barrier washer
Table 33 shows the environmental impacts of a professional barrier washer over its whole life
cycle. The total energy consumption for the whole life cycle of the base case WM6 is
2 998 936 MJ, of which 1 351 850 MJ (i.e. 128 747 kWh) electricity.
Figure 7 shows the contribution of each life cycle phase to each impact. Several obser-
vations can be made from this analysis:
For these machines, the impact of the use phase is similar to the category WM5. It is
still almost 100% regarding the energy consumption (including electricity), the water
(process), GHG, acidification and eutrophication. It also has an important impact on the
non-hazardous waste production and VOC. Its contribution to these impacts varies
from 65 to 90%. However, regarding the hazardous waste production it is around 40%,
while for heavy metals production it is around than 30%.
The materials used in the production phase have a high contribution to heavy metals,
POP, PAHs and non-hazardous waste. This is a result of the amount of metals used in
these machines. The main contributing components and materials are stainless steel,
polyamide and electronics components.
The distribution phase has great impact on the particulate matter generation along the
lifetime since these machines require of transportation for their installation. It has a
minor impact in VOC production. This is related to the long distance travelled during
the distribution of the equipment and the maintenance.
Finally, the end-of-life phase has an impact on hazardous waste, accounting for around
60%. For particulate matter it represents around 20%. This is related to the plastics and
electronics found in these machines.

Final Report
Task 5: Definition of Base Case Preparatory Study EuP Lot 24
Part: Professional Washing Machines and Dryers
Table 33 Life Cycle Impact (per unit) of base case WM6 – Professional barrier washer
PRODUCTION END-OF-LIFE* Life Cycle phases
Resources Use and Emissions
Material Manuf. Total
DISTRI- BUTION
USE Disposal Recycl. Total
TOTAL
Other Resources & Waste
Total Energy (GER) MJ 54 769 12 751 67 520 5 649 2 925 058 8 242 7 533 709 2 998 936
of which, electricity (in primary MJ) MJ 7 072 7 613 14 684 14 1 337 254 0 103 -103 1 351 850
Water (process) ltr 35 462 112 35 575 0 15 235 907 0 68 -68 15 271 413
Water (cooling) ltr 15 604 3 527 19 131 0 3 565 811 0 569 -569 3 584 374
Waste, non-haz./ landfill g 1 154 573 43 889 1 198 462 2 338 2 194 056 65 942 400 65 542 3 460 398
Waste, hazardous/ incinerated g 1 023 2 1 025 46 43 377 65 242 63 65 179 109 627
Emissions (Air)
Greenhouse Gases in GWP100 kg CO2 eq. 4 157 711 4 868 333 139 850 614 486 128 145 179
Ozone Depletion, emissions mg R-11 eq. Negligible
Acidification, emissions g SO2 eq. 33 006 3 070 36 076 1 020 502 798 1 245 653 592 540 486
Volatile Organic Compounds (VOC) g 110 3 113 104 1 497 28 8 20 1 734
Persistent Organic Pollutants (POP) ng i-Teq 9 411 297 9 708 13 12 433 456 0 456 22 610
Heavy Metals mg Ni eq. 68 556 696 69 252 119 33 378 2 289 0 2 289 105 038
PAHs mg Ni eq. 3 546 1 3 548 224 4 170 0 6 -6 7 937
Particulate Matter (PM, dust) g 5 877 472 6 349 17 227 17 453 11 153 20 11 133 52 162
Emissions (Water)
Heavy Metals mg Hg/20 42 184 0 42 184 4 9 044 676 0 676 51 908
Eutrophication g PO4 1 114 6 1 119 0 912 555 39 2 36 913 711
Persistent Organic Pollutants (POP) ng i-Teq Negligible
Negative values indicate environmental credits (impacts avoided) due to recycling
48
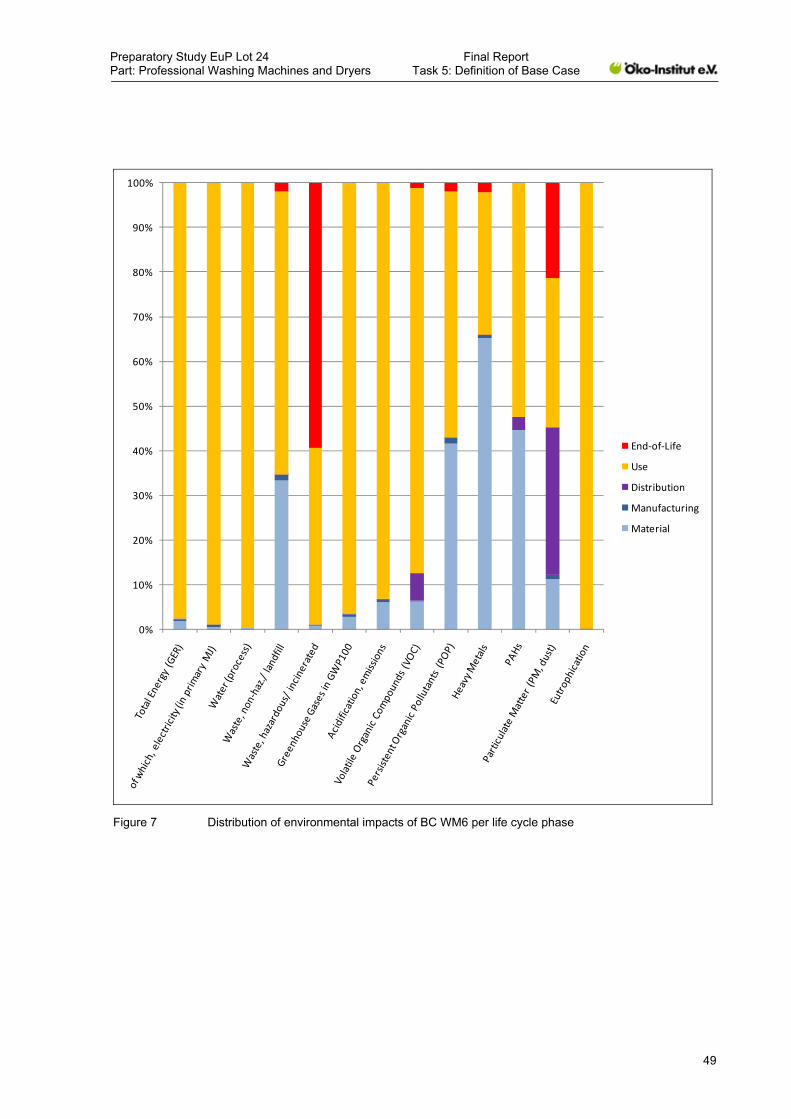
Preparatory Study EuP Lot 24 Part: Professional Washing Machines and Dryers
Final Report Task 5: Definition of Base Case
0%
10%
20%
30%
40%
50%
60%
70%
80%
90%
100%
End‐of‐Life
Use
Distribution
Manufacturing
Material
Figure 7 Distribution of environmental impacts of BC WM6 per life cycle phase
49

Final Report
Task 5: Definition of Base Case Preparatory Study EuP Lot 24
Part: Professional Washing Machines and Dryers
50
3.7 Base case WM7: Washing tunnel machine
Table 34 shows the environmental impacts of a washing tunnel machine over its whole life
cycle. The total energy consumption for the whole life cycle of WM7 is 114 095 012 MJ, of
which 11 242 144 MJ (i.e. 1 070 680 kWh) electricity.
Figure 7 shows the contribution of each life cycle phase to each impact. Several
observations can be made from this analysis:
The use phase is extremely influential in this equipment. It accounts for almost 100% of
GER, process water, GHG, acidification and VOCs.
The materials used in production have a large impact on heavy metals production,
around 75%, while its impact in non-hazardous wastes and POP is around 35%. The
main contributor is the stainless steel involved in production, though polypropylene,
Acrylonitrile Butadiene Styrene (ABS) and copper have an influence as well.
The distribution phase counts for 10% of the total impact in particulate matter.
Finally, the end-of-life impacts the hazardous waste production, around 20% of total,
and the particulate matter, around 15%.
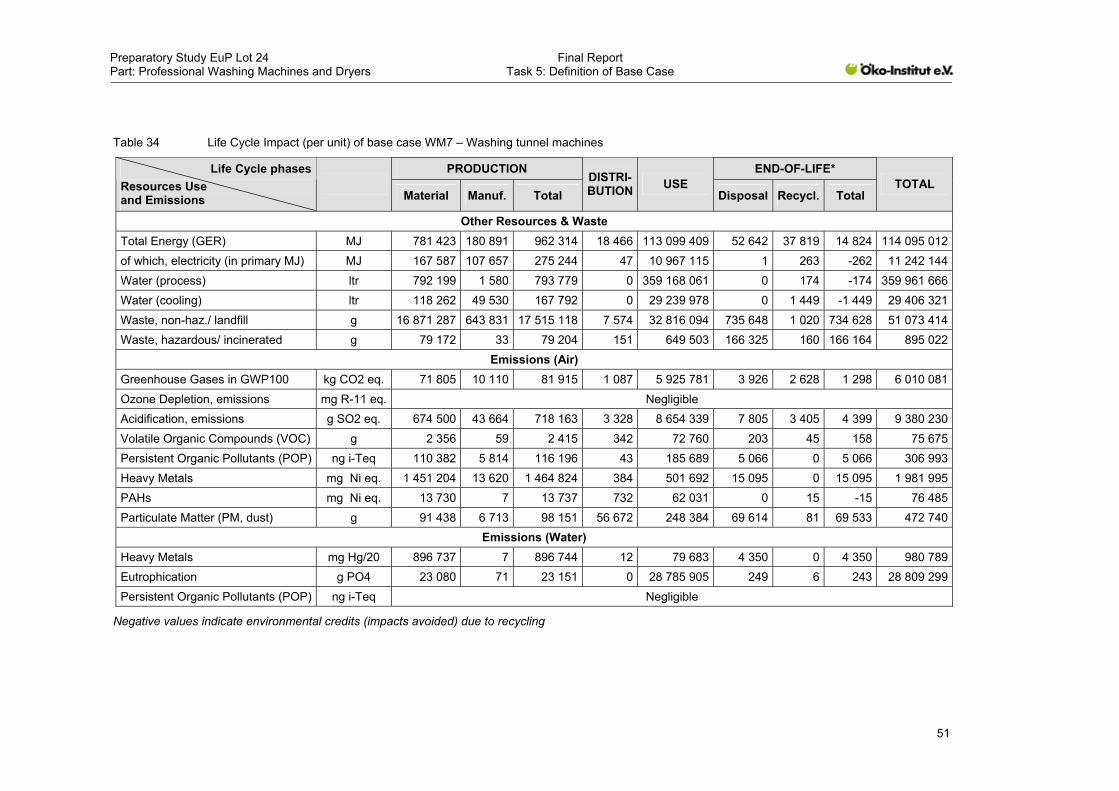
Preparatory Study EuP Lot 24 Part: Professional Washing Machines and Dryers
Final Report Task 5: Definition of Base Case
Table 34 Life Cycle Impact (per unit) of base case WM7 – Washing tunnel machines
PRODUCTION END-OF-LIFE* Life Cycle phases
Resources Use and Emissions
Material Manuf. Total
DISTRI- BUTION
USE Disposal Recycl. Total
TOTAL
Other Resources & Waste
Total Energy (GER) MJ 781 423 180 891 962 314 18 466 113 099 409 52 642 37 819 14 824 114 095 012
of which, electricity (in primary MJ) MJ 167 587 107 657 275 244 47 10 967 115 1 263 -262 11 242 144
Water (process) ltr 792 199 1 580 793 779 0 359 168 061 0 174 -174 359 961 666
Water (cooling) ltr 118 262 49 530 167 792 0 29 239 978 0 1 449 -1 449 29 406 321
Waste, non-haz./ landfill g 16 871 287 643 831 17 515 118 7 574 32 816 094 735 648 1 020 734 628 51 073 414
Waste, hazardous/ incinerated g 79 172 33 79 204 151 649 503 166 325 160 166 164 895 022
Emissions (Air)
Greenhouse Gases in GWP100 kg CO2 eq. 71 805 10 110 81 915 1 087 5 925 781 3 926 2 628 1 298 6 010 081
Ozone Depletion, emissions mg R-11 eq. Negligible
Acidification, emissions g SO2 eq. 674 500 43 664 718 163 3 328 8 654 339 7 805 3 405 4 399 9 380 230
Volatile Organic Compounds (VOC) g 2 356 59 2 415 342 72 760 203 45 158 75 675
Persistent Organic Pollutants (POP) ng i-Teq 110 382 5 814 116 196 43 185 689 5 066 0 5 066 306 993
Heavy Metals mg Ni eq. 1 451 204 13 620 1 464 824 384 501 692 15 095 0 15 095 1 981 995
PAHs mg Ni eq. 13 730 7 13 737 732 62 031 0 15 -15 76 485
Particulate Matter (PM, dust) g 91 438 6 713 98 151 56 672 248 384 69 614 81 69 533 472 740
Emissions (Water)
Heavy Metals mg Hg/20 896 737 7 896 744 12 79 683 4 350 0 4 350 980 789
Eutrophication g PO4 23 080 71 23 151 0 28 785 905 249 6 243 28 809 299
Persistent Organic Pollutants (POP) ng i-Teq Negligible
Negative values indicate environmental credits (impacts avoided) due to recycling
51

Final Report
Task 5: Definition of Base Case Preparatory Study EuP Lot 24
Part: Professional Washing Machines and Dryers
0%
10%
20%
30%
40%
50%
60%
70%
80%
90%
100%
End‐of‐Life
Use
Distribution
Manufacturing
Material
Figure 8 Distribution of environmental impacts of BC WM7 per life cycle phase
52

Preparatory Study EuP Lot 24 Part: Professional Washing Machines and Dryers
Final Report Task 5: Definition of Base Case
53
3.8 Base case D1: Semi-professional dryer, condenser
Table 35 shows the environmental impacts of a semi-professional dryer (condenser) over its
whole life cycle. The total energy consumption for the whole life cycle of base case D1 is
417 234 MJ, of which 411 934 MJ (i.e. 39 231 kWh) electricity.
Figure 4 shows the contribution of each life cycle phase to each impact. Several
observations can be made from this analysis:
The use phase has a great influence on the lifetime impacts of this equipment. It is not
surprising that it accounts for almost 100% of energy consumption, GHGs and
acidification. In contrast with professional washing machines, the impact on
eutrophication is not high, representing almost 10% and related to the electricity
generation. This phase only contributes to 45% of the production of hazardous wastes
and particulate matter; and around 60% of the emissions of heavy metals. For other
impacts, the use phase contributes between 85 and 95%.
The second most contributing element is the materials involved in production. The
greatest contribution concerns eutrophication (over 80%) due to the plastics in the
machines. It also contributes 40% of the generation of heavy metals, and about 30% of
the PAHs. It has a less important contribution to water use (process), non-hazardous
waste generation, GHG production, acid emissions, VOC and particulate matter. The
material with the most contribution is stainless steel, but plastics such as Acrylonitrile
Butadiene Styrene (ABS) and Polypropylene (PP) also have significant impacts.
The end-of-life has an important influence on the production of hazardous waste. This
impact is more than 40%. This phase also contributes less than 20% of the particulate
matter produced over the lifetime.
Finally, distribution only has a relevant influence in particulate matter generation, since
these machines are installed on the premises of the customer, hence they require
transportation. This phase represents about 25% of the total impact over the lifetime.

Final Report
Task 5: Definition of Base Case Preparatory Study EuP Lot 24
Part: Professional Washing Machines and Dryers
Table 35 Life Cycle Impact (per unit) of base case D1 – Semi-professional dryer, condenser
PRODUCTION END-OF-LIFE* Life Cycle phases
Resources Use and Emissions
Material Manuf. Total
DISTRI-BUTION
USE Disposal Recycl. Total
TOTAL
Other Resources & Waste
Total Energy (GER) MJ 5 321 1 178 6 499 640 410 015 878 798 80 417 234
of which, electricity (in primary MJ) MJ 1 552 705 2 257 2 409 691 0 15 -15 411 934
Water (process) ltr 3 694 10 3 705 0 27 348 0 10 -10 31 043
Water (cooling) ltr 1 499 328 1 827 0 1 092 466 0 84 -84 1 094 210
Waste, non-haz./ landfill g 100 660 3 970 104 630 292 476 033 3 703 59 3 645 584 600
Waste, hazardous/ incinerated g 1 303 0 1 303 6 9 453 9 590 9 9 581 20 343
Emissions (Air)
Greenhouse Gases in GWP100 kg CO2 eq. 383 66 448 39 17 904 65 48 17 18 408
Ozone Depletion, emissions mg R-11 eq. Negligible
Acidification, emissions g SO2 eq. 3 754 283 4 038 118 105 539 134 67 67 109 762
Volatile Organic Compounds (VOC) g 18 0 19 11 156 3 1 2 188
Persistent Organic Pollutants (POP) ng i-Teq 398 21 419 2 2 689 26 0 26 3 136
Heavy Metals mg Ni eq. 5 435 49 5 484 15 7 109 239 0 239 12 846
PAHs mg Ni eq. 404 0 404 26 837 0 1 -1 1 266
Particulate Matter (PM, dust) g 398 44 442 1 812 2 692 1 205 3 1 202 6 148
Emissions (Water)
Heavy Metals mg Hg/20 3 933 0 3 933 0 2 681 72 0 72 6 686
Eutrophication g PO4 93 1 93 0 14 4 0 4 111
Persistent Organic Pollutants (POP) ng i-Teq Negligible
Negative values indicate environmental credits (impacts avoided) due to recycling
54

Preparatory Study EuP Lot 24 Part: Professional Washing Machines and Dryers
Final Report Task 5: Definition of Base Case
0%
10%
20%
30%
40%
50%
60%
70%
80%
90%
100%
End‐of‐Life
Use
Distribution
Manufacturing
Material
Figure 9 Distribution of environmental impacts of BC D1 per life cycle phase
55

Final Report
Task 5: Definition of Base Case Preparatory Study EuP Lot 24
Part: Professional Washing Machines and Dryers
56
3.9 Base case D2: Semi-professional dryer, air-vented
Table 51 shows the environmental impacts of a semi-professional dryer (air-vented) over its
whole life cycle. The total energy consumption for the whole life cycle of base case D2 is
314 189 MJ, of which 257 355 MJ (i.e. 24 510 kWh) electricity.
Figure 10 exposes the contribution of each life cycle phase to each impact. Several
observations can be made from this analysis:
The use phase has a great influence on the lifetime impacts of this machine. It is not
surprising that it accounts for almost 100% of the energy consumption, GHG and
acidification. In contrast with professional washing machines, the impact on the
eutrophication is not high, representing 10% and related to the electricity generation.
This phase only contributes with 40% for the production of hazardous wastes and
particulate matter; and less than 50% for the production of heavy metals. For the other
impacts, the use phase contributes between 80 and 95%.
The second most contributing phase is the production phase - materials. The greatest
contribution concerns the eutrophication (almost 90%) due to the plastics in the
machines. It also contributes to about 50% of the generation of heavy metals, and
more than 40% of the PAHs. It has less important contribution in terms of the water use
(process), non-hazardous waste generation, GHG production, acid emissions, VOC
and particulate matter. The material with the most contribution is stainless steel, but
plastics such as Acrylonitrile Butadiene Styrene (ABS) and Polypropylene (PP) also
have significant impact.
The end-of-life has an important influence on the production of hazardous waste. This
phase also contributes to around 55% of the hazardous waste and 20% of the
particulate matter produced over the lifetime.
Finally, distribution only has a big influence on particulate matter generation, since
these machines are installed and require of transportation to the customer premises.
This phase represents about 30% of the total impact over the lifetime.

Preparatory Study EuP Lot 24 Part: Professional Washing Machines and Dryers
Final Report Task 5: Definition of Base Case
Table 36 Life Cycle Impact (per unit) of base case D2 – Semi-professional dryer, air-vented
PRODUCTION END-OF-LIFE* Life Cycle phases
Resources Use and Emissions
Material Manuf. Total
DISTRI- BUTION
USE Disposal Recycl. Total
TOTAL
Other Resources & Waste
Total Energy (GER) MJ 5 022 1 090 6 112 640 307 358 794 714 80 314 189
of which, electricity (in primary MJ) MJ 1 463 652 2 115 2 255 252 0 14 -13 257 355
Water (process) ltr 3 501 10 3 510 0 17 050 0 9 -9 20 552
Water (cooling) ltr 1 424 303 1 727 0 680 632 0 74 -74 682 285
Waste, non-haz./ landfill g 98 766 3 680 102 445 292 296 950 3 518 52 3 466 403 153
Waste, hazardous/ incinerated g 1 230 0 1 230 6 5 894 8 540 8 8 532 15 661
Emissions (Air)
Greenhouse Gases in GWP100 kg CO2 eq. 364 61 425 39 14 026 59 43 16 14 506
Ozone Depletion, emissions mg R-11 eq. Negligible
Acidification, emissions g SO2 eq. 3 602 262 3 864 118 66 614 121 60 61 70 657
Volatile Organic Compounds (VOC) g 17 0 18 11 138 2 1 2 168
Persistent Organic Pollutants (POP) ng i-Teq 386 20 406 2 1 677 24 0 24 2 109
Heavy Metals mg Ni eq. 5 161 47 5 208 15 4 483 216 0 216 9 922
PAHs mg Ni eq. 397 0 397 26 560 0 1 -1 983
Particulate Matter (PM, dust) g 386 40 426 1 812 2 305 1 089 2 1 087 5 630
Emissions (Water)
Heavy Metals mg Hg/20 3 745 0 3 745 0 1 683 65 0 65 5 493
Eutrophication g PO4 88 1 89 0 9 4 0 3 101
Persistent Organic Pollutants (POP) ng i-Teq Negligible
Negative values indicate environmental credits (impacts avoided) due to recycling
57

Final Report
Task 5: Definition of Base Case Preparatory Study EuP Lot 24
Part: Professional Washing Machines and Dryers
0%
10%
20%
30%
40%
50%
60%
70%
80%
90%
100%
End‐of‐Life
Use
Distribution
Manufacturing
Material
Figure 10 Distribution of environmental impacts of BC D2 per life cycle phase
58

Preparatory Study EuP Lot 24 Part: Professional Washing Machines and Dryers
Final Report Task 5: Definition of Base Case
59
3.10 Base case D3: Professional cabinet dryer
Table 37 shows the environmental impacts of a professional cabinet dryer over its whole life
cycle. The total energy consumption for the whole life cycle of base case D3 is 949 425 MJ,
of which 936 636 MJ (i.e. 89 203 kWh) electricity.
Figure 11 exposes the contribution of each life cycle phase to each impact. Several
observations can be made from this analysis:
The use phase has a great influence on the lifetime impacts of this equipment. It is not
surprising that it accounts for almost 100% of the energy consumption, GHG and
acidification. In contrast with professional washing machines, the impact on eutrophi-
cation is not high, representing around 45% (related to the electricity generation) and
50% of the PAH production. This phase also contributes almost 70% to the production
of POP and particulate matter; and around 90% to the production of heavy metals and
hazardous waste. For the other impacts, the use phase contributes between 90 and
95%.
The second most contributing phase is the extraction of the materials involved in the
production. The greatest contribution concerns the eutrophication and PAHs emissions
(almost 50%) due to the plastics found in the machines. It also contributes about 30%
of the POP and 20% of the generation of non-hazardous wastes. It has a less
important contribution in terms of heavy metals, water use (process), hazardous waste
generation, GHG production, acid emissions, VOC and particulate matter. The galva-
nised steel, aluminium and materials contained in the electronics components involved
in the production have the greatest impact.
The end-of-life has an influence on the production of hazardous waste. This impact is
more than 10%. This phase also contributes 7% of the particulate matter and
eutrophication produced over the lifetime.
Finally, distribution has a big influence on particulate matter generation since these
machines are transported to be installed in the customer premises. This phase
represents about 35% of the total impact over the lifetime while it represents 10% for
the VOCs.

Final Report
Task 5: Definition of Base Case Preparatory Study EuP Lot 24
Part: Professional Washing Machines and Dryers
Table 37 Life Cycle Impact (per unit) of base case D3 – Professional cabinet dryer
PRODUCTION END-OF-LIFE* Life Cycle phases
Resources Use and Emissions
Material Manuf. Total
DISTRI- BUTION
USE Disposal Recycl. Total
TOTAL
Other Resources & Waste
Total Energy (GER) MJ 10 989 2 349 13 338 2 006 933 665 798 381 417 949 425
of which, electricity (in primary MJ) MJ 2 173 1 398 3 571 5 933 066 0 6 -6 936 636
Water (process) ltr 2 020 21 2 041 0 62 222 0 4 -4 64 259
Water (cooling) ltr 601 644 1 245 0 2 488 092 0 34 -34 2 489 303
Waste, non-haz./ landfill g 288 479 8 321 296 799 850 1 084 763 9 412 24 9 388 1 391 801
Waste, hazardous/ incinerated g 2 013 0 2 013 17 21 520 3 899 4 3 895 27 445
Emissions (Air)
Greenhouse Gases in GWP100 kg CO2 eq. 724 131 855 119 40 764 59 24 36 41 774
Ozone Depletion, emissions mg R-11 eq. Negligible
Acidification, emissions g SO2 eq. 3 900 567 4 467 364 240 339 119 33 87 245 256
Volatile Organic Compounds (VOC) g 38 1 39 36 360 3 0 3 438
Persistent Organic Pollutants (POP) ng i-Teq 2 997 73 3 070 5 6 146 65 0 65 9 286
Heavy Metals mg Ni eq. 1 377 170 1 547 43 16 131 226 0 226 17 947
PAHs mg Ni eq. 2 160 0 2 160 80 1 968 0 0 0 4 208
Particulate Matter (PM, dust) g 748 87 835 6 016 6 978 1 064 1 1 062 14 891
Emissions (Water)
Heavy Metals mg Hg/20 2 543 0 2 543 1 6 041 66 0 66 8 651
Eutrophication g PO4 33 1 34 0 29 4 0 4 66
Persistent Organic Pollutants (POP) ng i-Teq Negligible
Negative values indicate environmental credits (impacts avoided) due to recycling
60

Preparatory Study EuP Lot 24 Part: Professional Washing Machines and Dryers
Final Report Task 5: Definition of Base Case
0%
10%
20%
30%
40%
50%
60%
70%
80%
90%
100%
End‐of‐Life
Use
Distribution
Manufacturing
Material
Figure 11 Distribution of environmental impacts of BC D3 per life cycle phase
61
Final Report
Task 5: Definition of Base Case Preparatory Study EuP Lot 24
Part: Professional Washing Machines and Dryers
62
3.11 Base case D4: Professional tumble dryer, <15 kg
Table 38 shows the environmental impacts of a professional tumble dryer (<15 kg) over its
whole life cycle. The total energy consumption for the whole life cycle of base case D4 is
960 721 MJ, of which 671 839 MJ (i.e. 63 984 kWh) electricity.
Figure 12 shows the contribution of each life cycle phase to each impact. Several
observations can be made from this analysis:
The use phase has a great influence on the lifetime impacts of this equipment. It is not
surprising that it accounts for almost 100% of the energy consumption, water use
(process), GHG and acidification. In contrast with washing machines, the impact on the
eutrophication is moderate, representing around 45% and related to the electricity
generation. This phase only contributes with 60% for the production of POP and
particulate matter; and around 90% for the production of heavy metals, PAHs,
hazardous and non-hazardous waste.
The second most contributing element is the materials involved in the production. The
greatest contribution is to eutrophication, contributing 50% of the total. It also
contributes more than 20% of POP. The influence on non-hazardous generation, heavy
metals and PAHs is between 5 and 10%. It has a less important contribution in terms of
the water use (process), GHG, VOC and particulate matter. The main material
contributors are the galvanised steel and copper.
Distribution has an influence on particulate matter generation, since these machines
are transported to be installed in the customer’s premises. This phase represents less
than 30% of the total impact over the lifetime while it represents less than 5% for the
VOCs.
Finally, the end-of-life has an influence on the production of hazardous wastes. This
impact is almost 10%. This phase also contributes with around 5% for the particulate
matter and eutrophication produced over the lifetime.

Preparatory Study EuP Lot 24 Part: Professional Washing Machines and Dryers
Final Report Task 5: Definition of Base Case
Table 38 Life Cycle Impact (per unit) of base case D4 – Professional tumble dryer, <15 kg
PRODUCTION END-OF-LIFE* Life Cycle phases
Resources Use and Emissions
Material Manuf. Total
DISTRI- BUTION
USE Disposal Recycl. Total
TOTAL
Other Resources & Waste
Total Energy (GER) MJ 6 582 2 083 8 665 1 740 950 399 804 886 -82 960 721
of which, electricity (in primary MJ) MJ 587 1 240 1 827 4 670 013 0 5 -5 671 839
Water (process) ltr 1 186 18 1 204 0 44 678 0 3 -3 45 879
Water (cooling) ltr 2 254 571 2 825 0 1 786 680 0 29 -29 1 789 476
Waste, non-haz./ landfill g 206 601 7 379 213 980 741 778 960 10 272 20 10 252 1 003 933
Waste, hazardous/ incinerated g 118 0 119 15 15 440 3 304 3 3 301 18 874
Emissions (Air)
Greenhouse Gases in GWP100 kg CO2 eq. 457 116 574 104 44 755 60 62 -2 45 430
Ozone Depletion, emissions mg R-11 eq. Negligible
Acidification, emissions g SO2 eq. 1 823 503 2 326 316 177 095 120 80 39 179 777
Volatile Organic Compounds (VOC) g 19 1 19 31 465 3 1 2 518
Persistent Organic Pollutants (POP) ng i-Teq 3 008 64 3 072 4 4 422 71 0 71 7 569
Heavy Metals mg Ni eq. 2 227 151 2 378 38 11 642 229 0 229 14 287
PAHs mg Ni eq. 244 0 244 69 1 454 0 0 0 1 767
Particulate Matter (PM, dust) g 523 77 600 5 196 5 869 1 068 2 1 066 12 731
Emissions (Water)
Heavy Metals mg Hg/20 1 480 0 1 480 1 4 335 66 0 66 5 882
Eutrophication g PO4 44 1 44 0 21 4 0 4 69
Persistent Organic Pollutants (POP) ng i-Teq Negligible
Negative values indicate environmental credits (impacts avoided) due to recycling
63

Final Report
Task 5: Definition of Base Case Preparatory Study EuP Lot 24
Part: Professional Washing Machines and Dryers
0%
10%
20%
30%
40%
50%
60%
70%
80%
90%
100%
End‐of‐Life
Use
Distribution
Manufacturing
Material
Figure 12 Distribution of environmental impacts of BC D4 per life cycle phase
64

Preparatory Study EuP Lot 24 Part: Professional Washing Machines and Dryers
Final Report Task 5: Definition of Base Case
65
3.12 Base case D5: Professional tumble dryer, 15-40 kg
Table 39 shows the environmental impacts of a professional tumble dryer (15-40 kg) over its
whole life cycle. The total energy consumption for the whole life cycle of base case D5 is
3 015 100 MJ, of which 1 727 027 MJ (i.e. 164 478 kWh) electricity.
Figure 13 shows the contribution of each life cycle phase to each impact. Several
observations can be made from this analysis:
The use phase has much influence in the lifetime impacts of this equipment. It
accounts for almost 100% of the energy consumption, water use (process), GHG and
acidification emissions. In contrast to washing machines, the impact on the
eutrophication is medium, representing around 25% which is related to the electricity
generation. This phase contributes with more than 50% for the production of particulate
matter; and around 80% for the production of heavy metals, PAHs and non-hazardous
waste.
The second most contributing element is the materials involved in the production. The
greatest contribution concerns the eutrophication, contributing with more than 40% of
the total. It also contributes with almost 40% of the POP. The influence on non-
hazardous generation, heavy metals and PAHs is between 10 and 20%. It has a less
important contribution in terms of the water use (process), GHG, VOC and particulate
matter. The galvanised steel and materials contained in the electronics components
present the biggest influence during the phase.
Distribution influences particulate matter generation since these machines are
transported to their final installation place. This phase represents about 30% of the total
impact along the lifetime.
Finally, the end-of-life phase has an influence on the production of hazardous waste.
This impact is less than 20%. This phase also contributes around 10% of the
particulate matter and eutrophication generated over the lifetime.

Final Report
Task 5: Definition of Base Case Preparatory Study EuP Lot 24
Part: Professional Washing Machines and Dryers
Table 39 Life Cycle Impact (per unit) of base case D5 – Professional tumble dryer, 15-40 kg
PRODUCTION END-OF-LIFE* Life Cycle phases
Resources Use and Emissions
Material Manuf. Total
DISTRI- BUTION
USE Disposal Recycl. Total
TOTAL
Other Resources & Waste
Total Energy (GER) MJ 22 205 5 142 27 347 2 911 2 983 976 1 962 1 096 866 3 015 100
of which, electricity (in primary MJ) MJ 7 119 3 062 10 182 7 1 716 853 0 15 -15 1 727 027
Water (process) ltr 7 599 45 7 644 0 114 527 0 10 -10 122 160
Water (cooling) ltr 1 932 1 411 3 343 0 4 578 037 0 85 -85 4 581 295
Waste, non-haz./ landfill g 620 030 18 171 638 201 1 220 1 996 858 22 988 60 22 928 2 659 206
Waste, hazardous/ incinerated g 6 850 1 6 851 24 39 627 9 730 9 9 721 56 223
Emissions (Air)
Greenhouse Gases in GWP100 kg CO2 eq. 1 574 287 1 861 173 145 006 146 70 76 147 116
Ozone Depletion, emissions mg R-11 eq. Negligible
Acidification, emissions g SO2 eq. 9 306 1 240 10 547 527 462 631 293 95 198 473 903
Volatile Organic Compounds (VOC) g 109 2 110 53 1 586 7 1 6 1 755
Persistent Organic Pollutants (POP) ng i-Teq 7 058 156 7 214 7 11 325 158 0 158 18 704
Heavy Metals mg Ni eq. 5 806 364 6 170 62 29 735 556 0 556 36 523
PAHs mg Ni eq. 1 396 0 1 397 116 3 652 0 1 -1 5 164
Particulate Matter (PM, dust) g 1 448 191 1 639 8 802 13 553 2 618 3 2 615 26 609
Emissions (Water)
Heavy Metals mg Hg/20 7 248 0 7 248 2 11 142 162 0 162 18 553
Eutrophication g PO4 128 2 130 0 54 9 0 9 193
Persistent Organic Pollutants (POP) ng i-Teq Negligible
Negative values indicate environmental credits (impacts avoided) due to recycling
66

Preparatory Study EuP Lot 24 Part: Professional Washing Machines and Dryers
Final Report Task 5: Definition of Base Case
0%
10%
20%
30%
40%
50%
60%
70%
80%
90%
100%
End‐of‐Life
Use
Distribution
Manufacturing
Material
Figure 13 Distribution of environmental impacts of BC D5 per life cycle phase
67

Final Report
Task 5: Definition of Base Case Preparatory Study EuP Lot 24
Part: Professional Washing Machines and Dryers
68
3.13 Base case D6: Professional tumble dryer, >40 kg
Table 40 shows the environmental impacts of a professional tumble dryer (>40 kg) over its
whole life cycle. The total energy consumption for the whole life cycle of base case D6 is
12 859 778 MJ, of which 5 518 537 MJ (i.e. 525 574 kWh) electricity.
Figure 14 exposes the contribution of each life cycle phase to each impact. Several
observations can be made from this analysis:
The use phase has a great influence on the lifetime impacts of this equipment. It is not
surprising that it accounts for almost 100% of energy consumption, water use
(process), GHG and acidification, and more than 80% of non-hazardous and
hazardous waste, VOC, POP, heavy metals generation and particulate matter. The
contribution in eutrophication is moderate, representing around 35% and being related
to the electricity generation.
The second most contributing element is the materials involved in the production. The
greatest contribution concerns eutrophication, with 60% of the total. Materials also
contribute between 20 to 30% to the POP and PAHs. The influence for non-hazardous
and hazardous generation, VOC, heavy metals and particulate matter is more than
10%. The main contributors are galvanised steel and materials contained in the
electronics components used for the production.
Distribution has an important influence on particulate matter generation. This phase
represents about 25% of the total impact along the lifetime.
Finally, the end-of-life influences the production of hazardous waste and particulate
matter. Its impact is around 10% for each.

Preparatory Study EuP Lot 24 Part: Professional Washing Machines and Dryers
Final Report Task 5: Definition of Base Case
Table 40 Life Cycle Impact (per unit) of base case D6 – Professional tumble dryer, >40 kg
PRODUCTION END-OF-LIFE* Life Cycle phases
Resources Use and Emissions
Material Manuf. Total
DISTRI- BUTION
USE Disposal Recycl. Total
TOTAL
Other Resources & Waste
Total Energy (GER) MJ 45 629 11 000 56 630 6 349 12 794 521 3 899 1 621 2 278 12 859 778
of which, electricity (in primary MJ) MJ 14 985 6 551 21 536 16 5 497 016 0 31 -30 5 518 537
Water (process) ltr 15 958 96 16 054 0 366 614 0 20 -20 382 648
Water (cooling) ltr 4 183 3 019 7 202 0 14 658 206 0 168 -168 14 665 240
Waste, non-haz./ landfill g 1 306 798 38 879 1 345 677 2 624 6 386 685 45 693 118 45 575 7 780 561
Waste, hazardous/ incinerated g 14 708 2 14 709 52 126 810 19 321 19 19 302 160 873
Emissions (Air)
Greenhouse Gases in GWP100 kg CO2 eq. 3 319 615 3 934 375 643 427 291 98 192 647 928
Ozone Depletion, emissions mg R-11 eq. Negligible
Acidification, emissions g SO2 eq. 19 872 2 654 22 526 1 146 1 533 333 582 136 446 1 557 451
Volatile Organic Compounds (VOC) g 232 3 235 117 7 433 14 2 13 7 798
Persistent Organic Pollutants (POP) ng i-Teq 14 887 333 15 220 15 36 181 315 0 315 51 731
Heavy Metals mg Ni eq. 12 400 780 13 180 133 95 102 1 105 0 1 105 109 519
PAHs mg Ni eq. 2 996 1 2 996 252 11 728 0 2 -2 14 975
Particulate Matter (PM, dust) g 3 584 408 3 992 19 381 43 601 5 201 5 5 196 72 171
Emissions (Water)
Heavy Metals mg Hg/20 15 515 0 15 515 4 35 597 321 0 321 51 437
Eutrophication g PO4 269 4 273 0 172 18 1 18 463
Persistent Organic Pollutants (POP) ng i-Teq Negligible
Negative values indicate environmental credits (impacts avoided) due to recycling
69

Final Report
Task 5: Definition of Base Case Preparatory Study EuP Lot 24
Part: Professional Washing Machines and Dryers
0%
10%
20%
30%
40%
50%
60%
70%
80%
90%
100%
End‐of‐Life
Use
Distribution
Manufacturing
Material
Figure 14 Distribution of environmental impacts of BC D6 per life cycle phase
70

Preparatory Study EuP Lot 24 Part: Professional Washing Machines and Dryers
Final Report Task 5: Definition of Base Case
71
3.14 Base case D7: Pass-through (transfer) tumble dryer
Table 41 shows the environmental impacts of a pass-through (transfer) tumble dryer over its
whole life cycle. The total energy consumption for the whole life cycle of the base case D7 is
63 374 310 MJ, of which 14 738 602 MJ (i.e. 1 403 676 kWh) electricity.
Figure 15 shows the contribution of each life cycle phase to each impact. Several
observations can be made from this analysis:
The use phase has a great influence in the lifetime impacts of this equipment. It
accounts for almost 100% for most indicators. This is not surprising due to high energy
consumption per cycle and the relative medium size of the equipment.
In contrast to other dryers, the materials involved in the production phase do not have a
high impact. They represent more than 40% of the POP impact, 30% of the
eutrophication (related to the electricity generation) and 20% of the non-hazardous
wastes production. The biggest contributions are from steel, polyethylene and materials
contained in the electronics components.
The distribution phase represents around 20% of the particulate matter. This is a
consequence of the transportation required for the installation of the machines at the
customer's premises.
The end-of-life contributes to less than 10% of the eutrophication potential and
particulate matter generation.

Final Report
Task 5: Definition of Base Case Preparatory Study EuP Lot 24
Part: Professional Washing Machines and Dryers
Table 41 Life Cycle Impact (per unit) of base case D7 – Pass-through (transfer) tumble dryer
PRODUCTION END-OF-LIFE* Life Cycle phases
Resources Use and Emissions
Material Manuf. Total
DISTRI- BUTION
USE Disposal Recycl. Total
TOTAL
Other Resources & Waste
Total Energy (GER) MJ 100 863 45 246 146 109 14 490 63 204 054 10 293 635 9 658 63 374 310
of which, electricity (in primary MJ) MJ 8 621 26 911 35 532 37 14 703 043 0 11 -11 14 738 602
Water (process) ltr 3 072 394 3 466 0 980 214 0 7 -7 983 672
Water (cooling) ltr 1 457 12 364 13 820 0 39 207 306 0 61 -61 39 221 066
Waste, non-haz./ landfill g 4 944 119 162 099 5 106 218 5 950 17 097 995 175 920 43 175 877 22 386 040
Waste, hazardous/ incinerated g 2 204 9 2 212 118 338 815 6 983 7 6 976 348 122
Emissions (Air)
Greenhouse Gases in GWP100 kg CO2 eq. 8 314 2 530 10 843 853 3 323 370 768 39 729 3 335 796
Ozone Depletion, emissions mg R-11 eq. Negligible
Acidification, emissions g SO2 eq. 24 058 10 927 34 985 2 612 4 567 750 1 511 54 1 457 4 606 803
Volatile Organic Compounds (VOC) g 412 16 427 268 40 993 42 1 41 41 729
Persistent Organic Pollutants (POP) ng i-Teq 73 749 1 534 75 283 34 97 123 1 210 0 1 210 173 650
Heavy Metals mg Ni eq. 12 959 3 594 16 553 302 254 343 3 000 0 3 000 274 197
PAHs mg Ni eq. 635 1 637 575 32 263 0 1 -1 33 473
Particulate Matter (PM, dust) g 7 980 1 680 9 660 44 435 127 346 13 446 2 13 444 194 886
Emissions (Water)
Heavy Metals mg Hg/20 12 843 2 12 845 9 94 927 854 0 854 108 635
Eutrophication g PO4 241 17 258 0 455 49 0 49 761
Persistent Organic Pollutants (POP) ng i-Teq Negligible
Negative values indicate environmental credits (impacts avoided) due to recycling
72

Preparatory Study EuP Lot 24 Part: Professional Washing Machines and Dryers
Final Report Task 5: Definition of Base Case
0%
10%
20%
30%
40%
50%
60%
70%
80%
90%
100%
End‐of‐Life
Use
Distribution
Manufacturing
Material
Figure 15 Distribution of environmental impacts of BC D7 per life cycle phase
73
Final Report
Task 5: Definition of Base Case Preparatory Study EuP Lot 24
Part: Professional Washing Machines and Dryers
74
3.15 Influence of energy sources for water / air heating: Comparison of electricity and alternative energy
Taking the base cases WM1 and D4 as examples, it is possible to make a comparison
between the impacts of a machine with only electricity as energy source (to heat the water)
and the ones of a machine with only ‘alternative’ energy source, i.e. other than electricity (to
heat the water9).
Comparing the results per indicator (Figure 16 to Figure 19), it is noticeable that the use
phase has a lower (relative) contribution in the case of equipment using alternative energy
sources for water heating. Indeed, in absolute value, the electricity used during the
manufacturing phase, the distribution and the end-of-life remains the same for the two
options (Table 42 to Table 45). However, since the primary energy and the electricity
consumption during the use phase decrease in case of alternative heating, the shares of the
other phases increase.
Table 46 and Table 47 compare the total environmental impacts of these two products. The
product using an ‘alternative’ heating source to heat water scores better for all environmental
impacts. For the case of professional washing machines, the most relevant reductions are for
the electricity consumption and water cooling (-86%), primary energy consumption (-36%),
acidification emissions (-58%), and GHG emissions (-19%). For professional dryers, the
primary energy reduction would be 54%, the electricity and cooling water would be reduced
by 92%, and for other indicators the reduction would be also very high.
This underlines the fact that energy sources do not have the same efficiency and can
influence greatly the environmental impacts of a product. In particular, this is the reason why
“weighted base cases” were “averaged” between the energy sources, to try to be as
representative as possible of the EU-27 situation in the overall results. On the other hand, it
points out the improvement potential at infrastructural level given the possibility to change the
existing (electricity heating) energy source into a more efficient (alternative heating) one. The economic impacts of having machines running exclusively on electricity and machines using alternative energy sources for water heating is presented in
Table 48 and Table 49. Since the purchase prices that have been gathered in Task 2 are
average prices for the whole market sector, the price of both kinds of machines is assumed
to be the same. Therefore, installation (of the machine) and maintenance cost are assumed
to be the same as well. The LCC is reduced by 9% for WM1 washing machines and by 47%
for D4 laundry dryers when using alternative energy sources. Thus the better environ-
mental performance of the alternative heated products goes along with important
monetary savings for the customer, and no additional costs for the manufacturer.
9 Electricity is still required for electronics and mechanical action (motors, pumps).

Preparatory Study EuP Lot 24 Part: Professional Washing Machines and Dryers
Final Report Task 5: Definition of Base Case
Table 42 Life Cycle Impact (per unit) of base case WM1 – Semi-professional washer extractor using only electricity as heating source
PRODUCTION END-OF-LIFE* Life Cycle phases
Resources Use and Emissions
Manuf. Total
DISTRI-BUTION
USE Disposal Recycl. Total
TOTAL Material
Other Resources & Waste debit credit
Total Energy (GER) MJ 3 376 945 4 321 1 101 153 281 925 800 125 158 829
of which, electricity (in primary MJ) MJ 448 566 1 014 3 111 898 0 15 - 15 112 900
Water (process) ltr 1 786 8 1 795 - 688 858 - 10 - 10 690 643
Water (cooling) ltr 1 133 264 1 398 - 298 382 - 82 - 82 299 697
Waste, non-haz./ landfill g 61 491 3 129 64 620 480 178 168 4 708 58 4 650 247 918
Waste, hazardous/ incinerated g 180 0 180 10 3 530 9 465 9 9 456 13 175
Emissions (Air)
Greenhouse Gases in GWP100 kg CO2 eq. 221 53 273 66 6 694 69 49 20 7 054
Ozone Depletion, emissions mg R-11 eq. negligible
Acidification, emissions g SO2 eq. 1 954 227 2 181 201 39 527 141 67 74 41 983
Volatile Organic Compounds (VOC) g 7 0 7 20 60 3 1 2 89
Persistent Organic Pollutants (POP) ng i-Teq 262 13 275 3 1 006 33 - 33 1 317
Heavy Metals mg Ni eq. 3 185 30 3 215 24 2 687 253 - 253 6 179
PAHs mg Ni eq. 322 0 322 44 333 - 1 - 1 698
Particulate Matter (PM, dust) g 397 35 432 3 230 1 317 1 266 2 1 263 6 242
Emissions (Water)
Heavy Metals mg Hg/20 2 057 0 2 057 1 742 75 - 75 2 875
Eutrophication g PO4 55 0 55 0 69 042 4 0 4 69 101
Persistent Organic Pollutants (POP) ng i-Teq negligible
75

Final Report
Task 5: Definition of Base Case Preparatory Study EuP Lot 24
Part: Professional Washing Machines and Dryers
Table 43 Life Cycle Impact (per unit) of base case WM1 – Semi-professional washer extractor using only alternative energy source for water heating (and electricity for mechanic parts)
PRODUCTION END-OF-LIFE* Life Cycle phases
Resources Use and Emissions
Material Manuf. Total
DISTRI-BUTION
USE Disposal Recycl. Total
TOTAL
Other Resources & Waste debit credit
Total Energy (GER) MJ 3 376 945 4 321 1 101 95 950 925 800 125 101 498
of which, electricity (in primary MJ) MJ 448 566 1 014 3 15 115 0 15 - 15 16 117
Water (process) ltr 1 786 8 1 795 - 682 406 - 10 - 10 684 191
Water (cooling) ltr 1 133 264 1 398 - 40 294 - 82 - 82 41 609
Waste, non-haz./ landfill g 61 491 3 129 64 620 480 65 954 4 708 58 4 650 135 703
Waste, hazardous/ incinerated g 180 0 180 10 1 300 9 465 9 9 456 10 945
Emissions (Air)
Greenhouse Gases in GWP100 kg CO2 eq. 221 53 273 66 4 652 69 49 20 5 012
Ozone Depletion, emissions mg R-11 eq. negligible
Acidification, emissions g SO2 eq. 1 954 227 2 181 201 15 241 141 67 74 17 697
Volatile Organic Compounds (VOC) g 7 0 7 20 52 3 1 2 81
Persistent Organic Pollutants (POP) ng i-Teq 262 13 275 3 372 33 - 33 682
Heavy Metals mg Ni eq. 3 185 30 3 215 24 1 026 253 - 253 4 518
PAHs mg Ni eq. 322 0 322 44 143 - 1 - 1 508
Particulate Matter (PM, dust) g 397 35 432 3 230 796 1 266 2 1 263 5 721
Emissions (Water)
Heavy Metals mg Hg/20 2 057 0 2 057 1 118 75 - 75 2 251
Eutrophication g PO4 55 0 55 0 69 039 4 0 4 69 098
Persistent Organic Pollutants (POP) ng i-Teq negligible
76

Preparatory Study EuP Lot 24 Part: Professional Washing Machines and Dryers
Final Report Task 5: Definition of Base Case
Table 44 Life Cycle Impact (per unit) of base case D4 – Professional air tumble dryer, <15 kg using only electricity as energy source
PRODUCTION END-OF-LIFE* Life Cycle phases
Resources Use and Emissions
Material Manuf. Total
DISTRI-BUTION
USE Disposal Recycl. Total
TOTAL
Other Resources & Waste debit credit
Total Energy (GER) MJ 3 376 945 4 321 1 101 153 281 925 800 125 158 829
of which, electricity (in primary MJ) MJ 448 566 1 014 3 111 898 0 15 - 15 112 900
Water (process) ltr 1 786 8 1 795 - 688 858 - 10 - 10 690 643
Water (cooling) ltr 1 133 264 1 398 - 298 382 - 82 - 82 299 697
Waste, non-haz./ landfill g 61 491 3 129 64 620 480 178 168 4 708 58 4 650 247 918
Waste, hazardous/ incinerated g 180 0 180 10 3 530 9 465 9 9 456 13 175
Emissions (Air)
Greenhouse Gases in GWP100 kg CO2 eq. 221 53 273 66 6 694 69 49 20 7 054
Ozone Depletion, emissions mg R-11 eq. negligible
Acidification, emissions g SO2 eq. 1 954 227 2 181 201 39 527 141 67 74 41 983
Volatile Organic Compounds (VOC) g 7 0 7 20 60 3 1 2 89
Persistent Organic Pollutants (POP) ng i-Teq 262 13 275 3 1 006 33 - 33 1 317
Heavy Metals mg Ni eq. 3 185 30 3 215 24 2 687 253 - 253 6 179
PAHs mg Ni eq. 322 0 322 44 333 - 1 - 1 698
Particulate Matter (PM, dust) g 397 35 432 3 230 1 317 1 266 2 1 263 6 242
Emissions (Water)
Heavy Metals mg Hg/20 2 057 0 2 057 1 742 75 - 75 2 875
Eutrophication g PO4 55 0 55 0 69 042 4 0 4 69 101
Persistent Organic Pollutants (POP) ng i-Teq negligible
77

Final Report
Task 5: Definition of Base Case Preparatory Study EuP Lot 24
Part: Professional Washing Machines and Dryers
78
Table 45 Life Cycle Impact (per unit) of base case D4 – Professional air tumble dryer, <15 kg using only alternative energy source for water heating (and electricity for mechanic parts)
PRODUCTION END-OF-LIFE* Life Cycle phases
Resources Use and Emissions
Material Manuf. Total
DISTRI-BUTION
USE Disposal Recycl. Total
TOTAL
Other Resources & Waste debit credit
Total Energy (GER) MJ 3 376 945 4 321 1 101 95 950 925 800 125 101 498
of which, electricity (in primary MJ) MJ 448 566 1 014 3 15 115 0 15 - 15 16 117
Water (process) ltr 1 786 8 1 795 - 682 406 - 10 - 10 684 191
Water (cooling) ltr 1 133 264 1 398 - 40 294 - 82 - 82 41 609
Waste, non-haz./ landfill g 61 491 3 129 64 620 480 65 954 4 708 58 4 650 135 703
Waste, hazardous/ incinerated g 180 0 180 10 1 300 9 465 9 9 456 10 945
Emissions (Air)
Greenhouse Gases in GWP100 kg CO2 eq. 221 53 273 66 4 652 69 49 20 5 012
Ozone Depletion, emissions mg R-11 eq. negligible
Acidification, emissions g SO2 eq. 1 954 227 2 181 201 15 241 141 67 74 17 697
Volatile Organic Compounds (VOC) g 7 0 7 20 52 3 1 2 81
Persistent Organic Pollutants (POP) ng i-Teq 262 13 275 3 372 33 - 33 682
Heavy Metals mg Ni eq. 3 185 30 3 215 24 1 026 253 - 253 4 518
PAHs mg Ni eq. 322 0 322 44 143 - 1 - 1 508
Particulate Matter (PM, dust) g 397 35 432 3 230 796 1 266 2 1 263 5 721
Emissions (Water)
Heavy Metals mg Hg/20 2 057 0 2 057 1 118 75 - 75 2 251
Eutrophication g PO4 55 0 55 0 69 039 4 0 4 69 098
Persistent Organic Pollutants (POP) ng i-Teq negligible

Preparatory Study EuP Lot 24 Part: Professional Washing Machines and Dryers
Final Report Task 5: Definition of Base Case
0%
10%
20%
30%
40%
50%
60%
70%
80%
90%
100%
End‐of‐Life
Use
Distribution
Manufacturing
Material
Figure 16 Distribution of environmental impacts of WM1 using only electricity for water heating, per life cycle phase
79

Final Report
Task 5: Definition of Base Case Preparatory Study EuP Lot 24
Part: Professional Washing Machines and Dryers
0%
10%
20%
30%
40%
50%
60%
70%
80%
90%
100%
End‐of‐Life
Use
Distribution
Manufacturing
Material
Figure 17 Distribution of environmental impacts of WM1 using only alternative energy source for water heating, per life cycle phase
80

Preparatory Study EuP Lot 24 Part: Professional Washing Machines and Dryers
Final Report Task 5: Definition of Base Case
0%
10%
20%
30%
40%
50%
60%
70%
80%
90%
100%
End‐of‐Life
Use
Distribution
Manufacturing
Material
Figure 18 Distribution of environmental impacts of D4 using only electricity for water heating, per life cycle phase
81

Final Report
Task 5: Definition of Base Case Preparatory Study EuP Lot 24
Part: Professional Washing Machines and Dryers
0%
10%
20%
30%
40%
50%
60%
70%
80%
90%
100%
End‐of‐Life
Use
Distribution
Manufacturing
Material
Figure 19 Distribution of environmental impacts of D4 using only alternative energy source for water heating, per life cycle phase
82

Preparatory Study EuP Lot 24 Part: Professional Washing Machines and Dryers
Final Report Task 5: Definition of Base Case
Table 46 Comparison of environmental indicators between WM1 units using only electricity and units using only alternative energy source for water heating9
Indicator Unit Electricity Alternative
energy source9 Variation
Total Energy (GER) MJ 158 829 101 498 -36%of which, electricity (in primary MJ) MJ 112 900 16 117 -86%Water (process) ltr 690 643 684 191 -1%Water (cooling) ltr 299 697 41 609 -86%Waste, non-haz./ landfill g 247 918 135 703 -45%Waste, hazardous/ incinerated g 13 175 10 945 -17%Emissions (Air)
Greenhouse Gases in GWP100 kg CO2
eq. 7 054 5 012 -29%
Ozone Depletion, emissions mg R-11
eq. negligible
Acidification, emissions g SO2 eq. 41 983 17 697 -58%Volatile Organic Compounds (VOC) g 89 81 -9%Persistent Organic Pollutants (POP) ng i-Teq 1 317 682 -48%Heavy Metals mg Ni eq. 6 179 4 518 -27%PAHs mg Ni eq. 698 508 -27%Particulate Matter (PM, dust) g 6 242 5 721 -8%Emissions (Water) Heavy Metals mg Hg/20 2 875 2 251 -22%Eutrophication g PO4 69 101 69 098 0%Persistent Organic Pollutants (POP) ng i-Teq negligible
Table 47 Comparison of environmental indicators between D4 units using only electricity and units using only alternative energy source for water heating9
Indicator Unit Electricity Alternative energy
source9 Variation
Total Energy (GER) MJ 1 366 914 627 777 -54%of which, electricity (in primary MJ) MJ 1 358 108 110 346 -92%Water (process) ltr 91 631 8 446 -91%Water (cooling) ltr 3 619 529 292 161 -92%Waste, non-haz./ landfill g 1 799 624 352 913 -80%Waste, hazardous/ incinerated g 34 688 5 936 -83%Emissions (Air) Greenhouse Gases in GWP100 kg CO2 eq. 59 886 33 555 -44%Ozone Depletion, emissions mg R-11 eq. negligible Acidification, emissions g SO2 eq. 351 961 38 852 -89%Volatile Organic Compounds (VOC) g 568 468 -18%Persistent Organic Pollutants (POP) ng i-Teq 12 067 3 889 -68%Heavy Metals mg Ni eq. 25 989 4 582 -82%PAHs mg Ni eq. 3 040 596 -80%Particulate Matter (PM, dust) g 15 209 8 489 -44%Emissions (Water) Heavy Metals mg Hg/20 10 307 2 262 -78%Eutrophication g PO4 90 52 -43%Persistent Organic Pollutants (POP) ng i-Teq negligible
83

Final Report
Task 5: Definition of Base Case Preparatory Study EuP Lot 24
Part: Professional Washing Machines and Dryers
84
Table 48 Comparison of economic indicators between WM1 units using only electricity for water heating and units using only alternative energy source for water heating9
Item Electricity (€) Alternative
energy source9 (€) Variation
Product price 2 670 2 670 0% Installation/ acquisition costs (if any) 107 107 0% Fuel (gas, oil, wood) 0 348 - Electricity 1 238 167 -87% Water 1 512 1 512 0% Detergent dishw. 2 168 2 168 0% Repair & maintenance costs 67 67 0%
Total 7 761 7 039 -9%
Table 49 Comparison of economic indicators between D4 units using only electricity and units using only alternative energy source for water heating9
Item Electricity (€) Alternative energy source9 (€) Variation Product price 4 000 4 000 0%Installation/ acquisition costs (if any) 160 160 0%Fuel (gas, oil, wood) 0 4 094 - Electricity 13 692 1 095 -92%Repair & maintenance costs 92 92 0%
Total 17 944 9 441 -47%

Preparatory Study EuP Lot 24 Part: Professional Washing Machines and Dryers
Final Report Task 5: Definition of Base Case
3.16 Summary by kg of laundry processed
The environmental impacts per kg of laundry processed for professional washing machines
are shown in Table 50. This table takes into account the lifetime of the product and the
capacity of laundry processing per annum, and divides the total environmental impacts by
the total number of kg of laundry washed over the lifetime. If energy and electricity
consumption over the lifetimes are compared this way, the machine that consumes most is
the category WM5, with almost 11.513 MJ/kg of primary energy and 1.013 kWh/kg of
electricity required, taking into account all life cycle phases of the machine, while the least
energy and electricity consuming equipment is the category WM7 with 2.295 MJ/kg and
0.022 kWhe/kg.
The overall environmental impacts per kg of laundry processed for professional laundry
dryers are shown in Table 51. The machine that consumes most is category D3 with
0.944 kWh/kg electricity and 10.05 MJ/kg primary energy required. The least electricity
consuming equipment is category D7 with 0.106 kWh/kg and 4.78 MJ/kg of primary energy.
85

Final Report
Task 5: Definition of Base Case Preparatory Study EuP Lot 24
Part: Professional Washing Machines and Dryers
Table 50 Impact of professional washing machines per kilogram of laundry
Impact per kg of processed laundry, over the lifetime WM1 WM2 WM3 WM4 WM5 WM6 WM7
Annual capacity (kg of laundry) 7 000 14 400 42 200 194 400 7 400 56 300 3 825 000
Lifetime (years) 8 12 14 15 11 14 13
Total Energy (GER) (in MJ) 2.427 2.602 2.563 3.496 11.513 3.805 2.295
of which electricity (in kWh) 0.126 0.140 0.126 0.153 1.013 0.163 0.022
Water process (in million m3) 12.287 16.352 17.674 16.938 14.316 19.375 7.239
Waste, non-hazardous/landfill (in kt) 3.626 4.614 2.913 4.306 22.055 4.390 1.027
Waste, hazardous/ incinerated (in kt) 0.219 0.106 0.081 0.079 0.428 0.139 0.018
Greenhouse Gases in GWP100 (in Mt CO2 eq.) 0.111 0.120 0.119 0.167 0.513 0.184 0.121
Acidification, emissions (in kt SO2 eq.) 0.576 0.614 0.530 0.640 3.011 0.686 0.189
Volatile Organic Compounds (VOC) (in kt) 0.002 0.002 0.001 0.002 0.006 0.002 0.002
Persistent Organic Pollutants (POP) (in g i-Teq.) 0.019 0.035 0.020 0.025 0.179 0.029 0.006
Heavy Metals (in ton Ni eq.) 0.098 0.092 0.070 0.071 0.289 0.133 0.040
PAHs (in ton Ni eq.) 0.011 0.014 0.005 0.012 0.045 0.010 0.002
Particulate Matter (PM, dust) (in kt) 0.108 0.056 0.045 0.036 0.216 0.066 0.010
Heavy Metals (ton Hg/20) 0.047 0.051 0.031 0.033 0.169 0.066 0.020
Eutrophication (in t PO4) 1.234 1.229 1.015 1.158 1.016 1.159 0.579
86
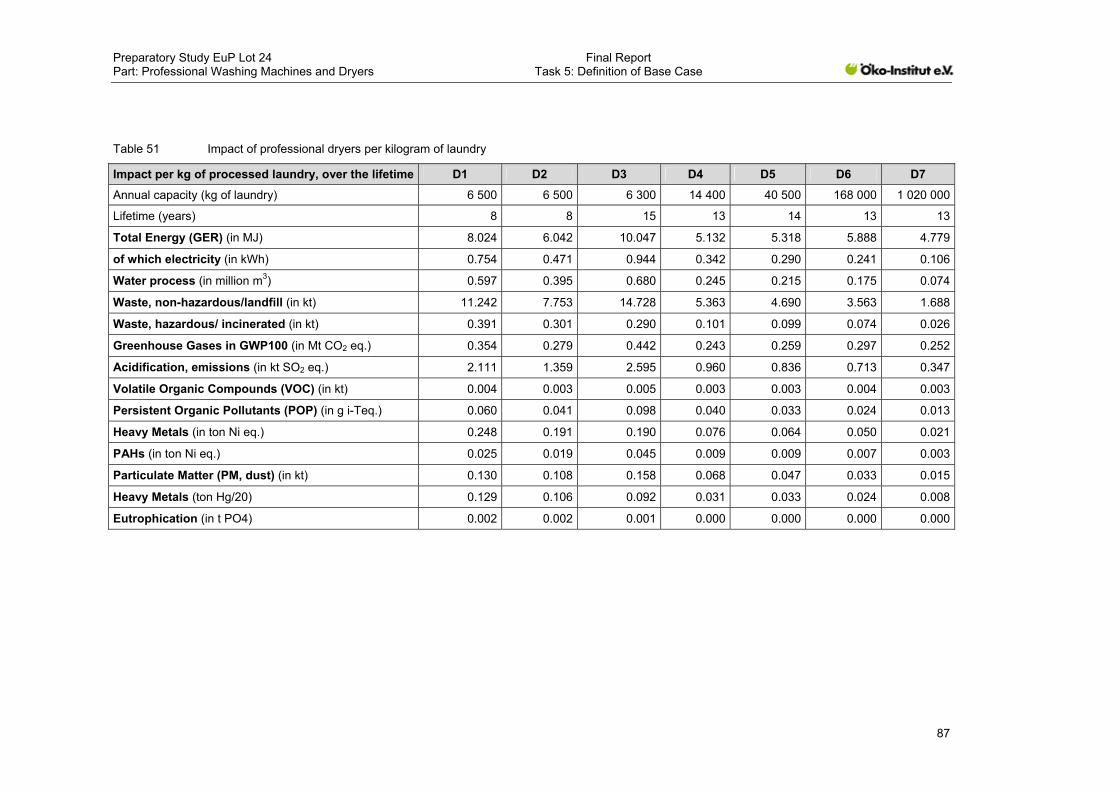
Preparatory Study EuP Lot 24 Part: Professional Washing Machines and Dryers
Final Report Task 5: Definition of Base Case
87
Table 51 Impact of professional dryers per kilogram of laundry
Impact per kg of processed laundry, over the lifetime D1 D2 D3 D4 D5 D6 D7
Annual capacity (kg of laundry) 6 500 6 500 6 300 14 400 40 500 168 000 1 020 000
Lifetime (years) 8 8 15 13 14 13 13
Total Energy (GER) (in MJ) 8.024 6.042 10.047 5.132 5.318 5.888 4.779
of which electricity (in kWh) 0.754 0.471 0.944 0.342 0.290 0.241 0.106
Water process (in million m3) 0.597 0.395 0.680 0.245 0.215 0.175 0.074
Waste, non-hazardous/landfill (in kt) 11.242 7.753 14.728 5.363 4.690 3.563 1.688
Waste, hazardous/ incinerated (in kt) 0.391 0.301 0.290 0.101 0.099 0.074 0.026
Greenhouse Gases in GWP100 (in Mt CO2 eq.) 0.354 0.279 0.442 0.243 0.259 0.297 0.252
Acidification, emissions (in kt SO2 eq.) 2.111 1.359 2.595 0.960 0.836 0.713 0.347
Volatile Organic Compounds (VOC) (in kt) 0.004 0.003 0.005 0.003 0.003 0.004 0.003
Persistent Organic Pollutants (POP) (in g i-Teq.) 0.060 0.041 0.098 0.040 0.033 0.024 0.013
Heavy Metals (in ton Ni eq.) 0.248 0.191 0.190 0.076 0.064 0.050 0.021
PAHs (in ton Ni eq.) 0.025 0.019 0.045 0.009 0.009 0.007 0.003
Particulate Matter (PM, dust) (in kt) 0.130 0.108 0.158 0.068 0.047 0.033 0.015
Heavy Metals (ton Hg/20) 0.129 0.106 0.092 0.031 0.033 0.024 0.008
Eutrophication (in t PO4) 0.002 0.002 0.001 0.000 0.000 0.000 0.000

Final Report
Task 5: Definition of Base Case Preparatory Study EuP Lot 24
Part: Professional Washing Machines and Dryers
3.17 Conclusions
The results of the impact assessments are very similar for the fourteen base cases, not in
absolute values but in the predominance of certain elements on the environmental impacts:
For all base cases, the use phase is by far the most important phase contributing to the
environmental impacts, especially energy and electricity consumption. Logically, this
influence increases with the number of cycles per year of the product and the energy
consumption per cycle, i.e. for larger machines. This is applicable for both professional
washing machines and professional dryers.
Professional washing machines also contribute to eutrophication potential and water
use, due to the detergent use and the energy and water consumption inherent to the
process. The performance of these machines could be improved to reduce the amount
of water and detergent used during the use phase.
The extraction of the materials needed for the production phase has the second
highest influence in general. This is a consequence of the large amount of metals used.
Being a structural part of the machines, no significant improvement potential is
expected. The manufacturing phase impact is negligible for all base cases and all
environmental indicators.
Distribution is always negligible except for the emissions of particulate matter, which
are due to the transportation of the appliances, which is inevitable to a certain degree.
Manufacturing lighter machines would reduce this impact but is not considered as a
priority option (and manufacturers probably already optimise this aspect).
The end-of-life phase mainly contributes to the quantity of hazardous waste generated.
However, this indicator is only an intermediate indicator as the consequences of the
management of the hazardous waste (often through incineration) are also accounted
for in the emissions environmental impacts, where no major contribution of this phase
appears. As no harmful compound has been identified in the bill of materials, it is
unlikely that any improvement option will reduce the impacts of this phase.
Looking at the results of the previous eco-design preparatory studies on domestic laundry
machines (Lot 14 and Lot 16 for former DG TREN), the environmental analysis of the base
cases shows many similarities. The use phase is the most impacting one in terms of energy
and eutrophication (professional washing machines). Concerning emissions, the use phase
is also the main contributor to greenhouse gases, acidification and VOCs. Similarly, the
production phase contributes to PAHs and heavy metals emissions and the distribution
phase contributes to particulate matter emissions (although the use phase remains the main
contributor). The material that has the most influence during the production phase is steel.
Energy consumption and water use are also identified as the most relevant elements in the
88

Preparatory Study EuP Lot 24 Part: Professional Washing Machines and Dryers
Final Report Task 5: Definition of Base Case
use phase. The differences in the results of these studies concern the total of energy and
emissions generated. Professional machines consume more overall due to the intensity of
use and therefore produce more emissions.
4 Base case life cycle costs
The capital cost does not necessarily indicate the cheapest Life Cycle Cost (LCC). The
lowest LCC should take into consideration the consumables expenditure and the specific use
rate of the machines. Table 52 and Table 53 present the details of the LCC breakdowns for
each base case.
Table 52 EcoReport outcomes of the LCC calculations of the professional washing machine base cases
Item WM1 WM2 WM3 WM4 WM5 WM6 WM7
Product price (€) 2 670 5 000 15 250 58 750 8 000 38 250 390 000
Installation (€) 107 200 610 2 350 320 1 530 35 100
Repair and maintenance costs (€)
67 117 345 10 887 191 7 215 74 892
Electricity cost (€) 809 2 563 5 854 29 617 6 807 10 089 72 189
Gas (€) 139 441 2 409 20 353 0 7 344 535 976
Water cost (€) 1 512 5 780 20 653 95 863 2 310 30 144 726 013
Detergent/Rinse aid cost (€) 2 168 6 194 16 859 93 372 2 453 25 690 825 014
Life Cycle Cost (€) 7 472 20 295 61 980 311 192 20 081 120 262 2 659 184
Table 53 EcoReport outcomes of the LCC calculations of the professional laundry dryer base cases
Item D1 D2 D3 D4 D5 D6 D7
Product price (€) 1 970 1 680 3 500 4 000 7 125 21 500 62 500
Installation (€) 79 67 140 160 285 860 5 625
Repair and maintenance costs (€)
50 42 78 92 161 2 973 8 641
Electricity cost (€) 4 531 2 823 9 089 6 764 12 953 36 191 96 802
Gas (€) 0 457 0 2 252 8 935 46 038 306 057
Life Cycle Cost (€) 6 630 5 070 12 807 13 268 29 460 107 561 479 625
Figure 20 and Figure 21 show the contributions of the product price and the resources and
consumables costs for each base case LCC. This data is also presented in percentage terms
in Table 54 and Table 55.
For professional washing machines, the aggregated costs of detergent, water and purchase
price represent from 75% to 85% of the total LCC for all categories but WM5. In the case of
89

Final Report
Task 5: Definition of Base Case Preparatory Study EuP Lot 24
Part: Professional Washing Machines and Dryers
WM5 this aggregate value is less, about 65%. The consumable cost (aggregate value of
electricity, water, detergent and gas consumption) represent between 60 to 80% for all base
cases. The maintenance and installation costs are the categories with the lower value for all
the base cases. Base case WM5 is the only one where the electricity costs are substantial
(more than 30% of the LCC). This is consequence of the additional drying function of the
machine.
0%
10%
20%
30%
40%
50%
60%
70%
80%
90%
100%
WM 1 WM 2 WM 3 WM 4 WM 5 WM 6 WM 7
Detergent/Rinse aid cost (€)
Water cost (€)
Fuel (gas, others) (€)
Electricity cost (€)
Repair and maintenance
costs (€)
Installation (€)
Product price (€)
Figure 20 Breakdown of professional washing machines base cases’ LCC
Regarding professional dryers, the energy costs always represent between 65% (D2) and
85% (D7) of the total LCC, which underlines the important monetary savings potential in case
of a better energy efficiency of the dryer.
90

Preparatory Study EuP Lot 24 Part: Professional Washing Machines and Dryers
Final Report Task 5: Definition of Base Case
0%
10%
20%
30%
40%
50%
60%
70%
80%
90%
100%
D 1 D 2 D 3 D 4 D 5 D 6 D 7
Fuel (gas, others) (€)
Electricity cost (€)
Repair and maintenance costs (€)
Installation (€)
Product price (€)
Figure 21 Breakdown of professional laundry dryer base cases’ LCC
Table 54 Expenditure cost proportion for professional washing machines
Item WM1 WM2 WM3 WM4 WM5 WM6 WM7
Product price (%) 36% 25% 25% 19% 40% 32% 15%
Installation (%) 1% 1% 1% 1% 2% 1% 1%
Repair and maintenance costs (%) 1% 1% 1% 3% 1% 6% 3%
Electricity cost (%) 11% 13% 9% 10% 34% 8% 3%
Gas (%) 2% 2% 4% 7% 0% 6% 20%
Water cost (%) 20% 28% 33% 31% 12% 25% 27%
Detergent/Rinse aid cost (%) 29% 31% 27% 30% 12% 21% 31%
Life Cycle Cost (%) 100% 100% 100% 100% 100% 100% 100%
Table 55 Expenditure cost proportion for professional dryers
Item D1 D2 D3 D4 D5 D6 D7
Product price (%) 30% 33% 27% 30% 24% 20% 13%
Installation (%) 1% 1% 1% 1% 1% 1% 1%
Repair and maintenance costs (%) 1% 1% 1% 1% 1% 3% 2%
Electricity cost (%) 68% 56% 71% 51% 44% 34% 20%
Gas (%) 0% 9% 0% 17% 30% 43% 64%
Life Cycle Cost (%) 100% 100% 100% 100% 100% 100% 100%
91

Final Report
Task 5: Definition of Base Case Preparatory Study EuP Lot 24
Part: Professional Washing Machines and Dryers
5 EU totals
This section provides the environmental assessment of the base cases at the EU-27 level
using stock and market data from task 2. The total impacts cover:
The life cycle environmental impact of the new products in 2009 (i.e. impacts of the
sales);
The annual (2009) impact of production, use and disposal of the product group and the
total LCC (i.e. impact and LCC of the stock – see Section 2.6).
5.1 Market data
Table 56 and Table 57 illustrate the market data of the base cases in EU-27 in 2009.
Table 56 Market and technical data for professional washing machines base cases in 2009
Base case Lifetime (years) Annual sales (units/year)
% of the total washing
machines sales
EU stock (units)
% of the total washing
machines stock
WM1 8 25 000 32% 193 138 24%
WM2 12 45 500 58% 557 279 65%
WM3 14 6 200 8% 81 378 9%
WM4 15 200 0% 2 799 0%
WM5 11 200 0% 2 093 0%
WM6 14 850 1% 10 470 1%
WM7 13 250 0% 3 062 0%
Table 57 Market and technical data for professional dryers base cases in 2009
Base case Lifetime (years) Annual sales (units/year)
% of the total dryers sales
EU stock (units)
% of the total dryers stock
D1 8 3 200 8% 24 722 6%
D2 8 4 300 11% 33 220 8%
D3 15 10 700 27% 149 738 29%
D4 13 16 000 41% 195 966 43%
D5 14 3 500 9% 45 939 10%
D6 13 300 1% 3 674 1%
D7 13 1 200 3% 14 697 4%
92

Preparatory Study EuP Lot 24 Part: Professional Washing Machines and Dryers
Final Report Task 5: Definition of Base Case
5.2 Life cycle environmental impacts
Table 58 shows the total environmental impacts of all products in operation in EU-27 in 2009,
based on the extrapolation of the base cases impacts (all have the same impacts as the
base case of their category).
Table 58 Environmental impacts of the EU-27 stock in 2009 for professional washing machines BC
Environmental Impact WM1 WM2 WM3 WM4 WM5 WM6 WM7
Total Energy (GER) (in PJ) 4.2 26.9 11.4 2.5 0.2 2.9 34.9
of which electricity (in primary PJ) 2.3 15.3 5.9 1.1 0.2 1.3 3.4
Water process (in million m3) 21.6 170.5 78.9 12.0 0.3 14.8 110.2
Waste, non-hazardous/landfill (in kt) 5.9 42.8 12.5 2.8 0.4 3.2 14.6
Waste, hazardous/ incinerated (in kt) 0.3 1.0 0.3 0.1 0.0 0.1 0.3 Emissions to air
Greenhouse Gases in GWP100 (in Mt CO2 eq.) 0.2 1.2 0.5 0.1 0.0 0.1 1.8
Acidification, emissions (in kt SO2 eq.) 1.0 6.3 2.3 0.4 0.1 0.5 2.8
Volatile Organic Compounds (VOC) (in kt) 0.0 0.0 0.0 0.0 0.0 0.0 0.0
Persistent Organic Pollutants (POP) (in g i-Teq.) 0.0 0.3 0.1 0.0 0.0 0.0 0.1
Heavy Metals (in ton Ni eq.) 0.2 0.8 0.3 0.0 0.0 0.1 0.5
PAHs (in ton Ni eq.) 0.0 0.1 0.0 0.0 0.0 0.0 0.0
Particulate Matter (PM, dust) (in kt) 0.2 0.5 0.2 0.0 0.0 0.0 0.1 Emissions to water
Heavy Metals (ton Hg/20) 0.1 0.4 0.1 0.0 0.0 0.0 0.2
Eutrophication (in mt PO4) 2.2 12.8 4.5 0.8 0.0 0.9 8.8
Table 59 Environmental impacts of the EU-27 stock in 2009 for professional dryers BC
Environmental Impact D1 D2 D3 D4 D5 D6 D7
Total Energy (GER) (in PJ) 1.7 1.7 12.3 18.8 12.8 4.7 93.1
of which electricity (in primary PJ) 1.7 1.4 12.1 13.2 7.4 2.0 21.7
Water process (in million m3) 0.1 0.1 0.8 0.9 0.5 0.1 1.4
Waste, non-hazardous/landfill (in kt) 2.3 2.1 17.4 18.9 10.8 2.8 31.5
Waste, hazardous/ incinerated (in kt) 0.1 0.1 0.3 0.4 0.2 0.1 0.5
93

Final Report
Task 5: Definition of Base Case Preparatory Study EuP Lot 24
Part: Professional Washing Machines and Dryers
Environmental Impact D1 D2 D3 D4 D5 D6 D7
Emissions to air
Greenhouse Gases in GWP100 (in Mt CO2 eq.) 0.1 0.1 0.5 0.9 0.6 0.2 4.9
Acidification, emissions (in kt SO2 eq.) 0.4 0.4 3.2 3.5 2.0 0.6 6.8
Volatile Organic Compounds (VOC) (in kt) 0.0 0.0 0.0 0.0 0.0 0.0 0.1
Persistent Organic Pollutants (POP) (in g i-Teq.) 0.0 0.0 0.1 0.1 0.1 0.0 0.2
Heavy Metals (in ton Ni eq.) 0.0 0.0 0.2 0.3 0.2 0.0 0.4
PAHs (in ton Ni eq.) 0.0 0.0 0.0 0.0 0.0 0.0 0.0
Particulate Matter (PM, dust) (in kt) 0.0 0.0 0.2 0.2 0.1 0.0 0.2
Emissions to water
Heavy Metals (ton Hg/20) 0.0 0.0 0.1 0.1 0.1 0.0 0.2
Eutrophication (in mt PO4) 0.0 0.0 0.0 0.0 0.0 0.0 0.0
A summary of the contribution of the base cases stock to the environmental impacts as a
percentage of the total impacts is presented in Figure 22 and Figure 23.
As the figure shows for professional washing machines, the base case WM2 has the greatest
impact in almost all indicators. The main reason behind is the high market share represented
by this category (around 60%). The base case WM7 has the second greatest impact in
almost all categories, despite its low sales, which highlights the high consumption and use
rate of the high capacity machines. Then the base cases WM1 and WM3 come. The
aggregated value of WM4, WM5 and WM6 contributions in all impact indicators is only
around 10%.
94

Preparatory Study EuP Lot 24 Part: Professional Washing Machines and Dryers
Final Report Task 5: Definition of Base Case
0%
10%
20%
30%
40%
50%
60%
70%
80%
90%
100%
Base‐Case WM 7
Base‐Case WM 6
Base‐Case WM 5
Base‐Case WM 4
Base‐Case WM 3
Base‐Case WM 2
Base‐Case WM 1
Figure 22 Professional washing machine base cases’ share of the environmental impacts of the 2009 stock
For the case of professional dryers, the category D7 has the greatest impact for all indicators
but eutrophication. The contributions of categories D3-4-5 are considered to be important as
well. Eutrophication is the indicator with the most homogenous shares.
95

Final Report
Task 5: Definition of Base Case Preparatory Study EuP Lot 24
Part: Professional Washing Machines and Dryers
0%
10%
20%
30%
40%
50%
60%
70%
80%
90%
100%
Base‐Case D 7
Base‐Case D 6
Base‐Case D 5
Base‐Case D 4
Base‐Case D 3
Base‐Case D 2
Base‐Case D 1
Figure 23 Professional dryer base cases’ share of the environmental impacts of the 2009 stock
The total energy and electricity consumption per category is shown in Figure 24 for
professional washing machines and in Figure 25 for professional laundry dryers.
The primary energy consumption for base case WM7 is by far the highest of all base cases
(42% of the overall consumption). However, the electricity consumption of WM2 stock is
about four times higher (52% of overall consumption) than the electricity consumption of the
stock of base case WM7.
Although the market share of WM7 is almost 0%, these machines use as much as 43% of
the total primary energy. The total amount of primary energy used by all professional
washing machines over their lifecycles is 83.0 PJ per year (2009).
96

Preparatory Study EuP Lot 24 Part: Professional Washing Machines and Dryers
Final Report Task 5: Definition of Base Case
0,0
5,0
10,0
15,0
20,0
25,0
30,0
35,0
40,0
WM 1 WM 2 WM 3 WM 4 WM 5 WM 6 WM 7
Total Energy (GER) (in PJ)
Electricity (in PJ)
Figure 24 Energy/electricity consumption of the 2009 stock, per washing machine base case
Similarly to washing machines, larger dryers have the highest consumption by their stock.
Category D7 represents 64% of the total consumption of all professional laundry dryers. The
aggregate of categories D3, D4 and D5 represents 30% of the total energy consumption. In
terms of electricity, the consumption for these 4 categories is more similar. The electricity
consumption for D7 counts for 36% of the total, while for D3, D4 and D5 the consumption
represents 20%, 22% and 12% respectively. These categories therefore represent the major
part of the energy saving potential. The total primary energy consumption for all dryers
together is 145.1 PJ. The total electricity consumption is 59.4 PJ (primary energy).
97

Final Report
Task 5: Definition of Base Case Preparatory Study EuP Lot 24
Part: Professional Washing Machines and Dryers
0,0
10,0
20,0
30,0
40,0
50,0
60,0
70,0
80,0
90,0
100,0
D 1 D 2 D 3 D 4 D 5 D 6 D 7
Total Energy (GER) (in PJ)
Electricity (in PJ)
Figure 25 Energy/electricity consumption of the 2009 stock, by dryer base case
5.3 Life cycle costs
Regarding the total consumer expenditure in 2009 related to professional washing machines,
between 3 to 13% of the total cost is due to electricity consumption, except for category WM5
whose electricity costs are up to 41% of total expenditure. The water costs vary from 25 to
40% for all categories, except for WM5 where they represent only around 14% of the total
expenditure. The costs of detergent represent between 20 to 29% for all categories but for
WM5 (11%). The costs of gas only has a substantial contribution for category WM7,
accounting for 23% of the total expenditure. The cost breakdown per category is presented in
Table 60 for professional washing machines.
In the case of professional dryers (Table 61), the electricity costs represent more than 75%
of the annual expenditure for D1 and D3, and more than 55% for D2 and D4. Gas costs have
their most important contributions for D7 and D6 (68 and 48% respectively). For almost all
categories the purchase price represents between 14 to 25% of the total annual expenditure,
but for D7 (9%).
98

Preparatory Study EuP Lot 24 Part: Professional Washing Machines and Dryers
Final Report Task 5: Definition of Base Case
Table 60 Total Annual Consumer expenditure for professional washing machines in EU-27 in 2009
Item WM1 WM2 WM3 WM4 WM5 WM6 WM7 Total
EU-27 sales (in units) 0.02500 0.04550 0.00620 0.00020 0.00020 0.00085 0.00025 0.07820
Share of the EU-27 sales 32% 58% 8% 0% 0% 1% 0% 100%
Product Price(in million €) 67 228 95 12 2 33 98 532
Installation (in million €) 3 9 4 0 0 1 9 26
Electricity (in million €) 30 198 59 10 2 13 29 340
Fuel (gas, others) (in million €) 5 34 24 7 0 9 214 293
Water (in million €) 56 446 207 31 1 39 289 1 070
Detergent (in million €) 62 368 130 24 1 25 253 862
Repair and maintenance costs (in million €) 2 7 3 3 0 7 23 44
Total (in million €) 225 1 289 520 86 5 128 914 3 168
Table 61 Total Annual Consumer expenditure for professional dryers in EU-27 in 2009
Item D1 D2 D3 D4 D5 D6 D7 Total
EU-27 sales (in units) 0.00320 0.00430 0.01070 0.01600 0.00350 0.00030 0.00120 0.03920
Share of the EU-27 sales 8% 11% 27% 41% 9% 1% 3% 100%
Product Price(in million €) 6 7 37 64 25 6 75 221
Installation (in million €) 0 0 1 3 1 0 7 13
Electricity (in million €) 22 18 159 173 73 17 185 647
Fuel (gas, others) (in million €) 0 3 0 57 51 22 586 719
Repair and maintenance costs (in million €) 0 0 1 2 1 1 13 18
Total (in million €) 28 29 199 298 150 47 865 1 617
99

Final Report
Task 5: Definition of Base Case Preparatory Study EuP Lot 24
Part: Professional Washing Machines and Dryers
From an overall perspective, the most important contribution to the annual expenditure is
given by the category WM2 (41%) closely followed by category WM7 (29%) for the
professional washing machines and by the category D7 (54%) for the professional laundry
dryers. This is the consequence of a balance between the market shares, the operating costs
per cycle and the lifetimes.
WM 17%
WM 241%
WM 316%WM 4
3%
WM 50%
WM 64%
WM 729%
WM 1
WM 2
WM 3
WM 4
WM 5
WM 6
WM 7
Figure 26 Base cases’ share of the total consumer expenditure for professional washing machines in 2009
D 12%
D 22%
D 312%
D 418%
D 59%
D 63%
D 754%
D 1
D 2
D 3
D 4
D 5
D 6
D 7
Figure 27 Base cases’ share of the total consumer expenditure for professional dryers in 2009
100

Preparatory Study EuP Lot 24 Part: Professional Washing Machines and Dryers
Final Report Task 5: Definition of Base Case
6 EU-27 total system impact
Washing machines transfer heat to the water, or the air in the case of dryers, and to the
laundry during their operation. The residual heat is normally transferred to the room if no
specific heat recovery options are implemented. The environmental impacts of this heat
transfer can be positive or negative:
The climate: If the room needs to be heated, the hot laundry will complement the
heating system. On the contrary, if the room needs to be cooled (not a common
situation for professional premises), operating the laundry machines will require
additional energy consumption from the ventilation/air conditioning system. A heat
recovery system or a heat pump will reduce the energy consumption of the equipment
itself, and also saves the extra work needed from the ventilation system in comparison
with a basic machine, for which the extra heat is not re-used and has to be evacuated
by the ventilation system, thus consuming energy.
The energy source of the machines and of the heating system: electricity needs to be
produced from primary energy, generally with low efficiency. If the appliance only uses
electricity as an energy source, central heating systems will be much more efficient and
indirect room heating due to the laundry equipment will reduce the global efficiency of
the heating process.
Due to huge differences between Member States and appliances, no global heat transfer can
be estimated at EU level with reliability.
The infrastructure of the building where the laundry equipment is installed also has an
influence on the possible options to reduce the energy consumption of the system. Some of
the base cases are considered as a mixture of different energy supplies (electricity and
alternative). As seen in Section 3.15, the use of alternative heating can decrease the total
energy and electricity consumption. Even if this alternative energy does not reduce the final
energy needed at the level of the machine, the energy generation is more efficient.
101

Final Report
Task 5: Definition of Base Case Preparatory Study EuP Lot 24
Part: Professional Washing Machines and Dryers
102
7 Conclusions
The environmental impact assessments carried out with the EcoReport tool for each base
case show that the use phase is by far the most impacting stage of the life cycle in terms of
energy consumption, water consumption, greenhouse-gas emissions and, in the case of all
professional washing machines, eutrophication. Therefore, the analysis of the improvement
potential in Tasks 6 and 7 will mainly focus on technologies that reduce the energy, water
and detergent consumption during the use phase of the machines.
Due to the market share, the categories WM2 for professional washing machines and D4 for
professional laundry dryers have the most important impacts, both in environmental and
economic terms. Although the market shares for categories WM7 and D7 are much lower,
their influence on the energy consumption and on the annual expenditure are very important
as well.
Task 6 will examine the relevant improvement options of professional laundry machines
considered as best available technologies, in an attempt to improve upon the base cases.

Preparatory Study EuP Lot 24 Part: Professional Washing Machines and Dryers
Final Report Task 5: Definition of Base Case
8 Annex
8.1 Detailed bills of materials of the base cases
Bill of material of Base case WM1
P o s MATERIALS Extraction & Production Weight Category Material or Processnr Description of component in g C lick &select select C atego ry f irst !
1 Stainless Steel 20606.0 3-Ferro 25-Stainless 18/8 coil
2 Steel Sheet galvanized 564.0 3-Ferro 21-St sheet galv.
3 Cast Iron 11192.0 3-Ferro 23-Cast iron
4 Polypropylen (PP) 8021.0 1-BlkPlastics 4-PP
5 Polyamid (PA) 94.0 2-TecPlastics 11-PA 6
6 Polycarbonate 190.0 2-TecPlastics 12-PC
7 Epoxy 260.0 2-TecPlastics 14-Epoxy
8 Acrylonitrile Butadiene Styrene (ABS) 1145.0 1-BlkPlastics 10-ABS
9 Plystyrene (PS) 678.0 1-BlkPlastics 5-PS
10 Polybutylene Terephthalate (PBT) 8.0 1-BlkPlastics
11 Polyvinylchlorid (PVC) 221.0 1-BlkPlastics 8-PVC
12 EPDM-rubber 1752.0 1-BlkPlastics 1-LDPE
13 Plastics others 1101.0 1-BlkPlastics 2-HDPE
14 Aluminium 2233.0 4-Non-ferro 26-Al sheet/extrusion
15 Cu wire 1305.0 4-Non-ferro 29-Cu wire
16 CuZn38 cast 99.0 4-Non-ferro 31-CuZn38 cast
17 Chrom 1761.0 4-Non-ferro
18 Bitumen 38.0 7-Misc. 55-Bitumen
19 Concrete 18205.0 7-Misc. 58-Concrete
20 Glass 1773.0 7-Misc. 54-Glass for lamps
21 Wood 2452.0 7-Misc. 56-Cardboard
22 Electronics (control) 165.0 6-Electronics 98-controller board
103

Final Report
Task 5: Definition of Base Case Preparatory Study EuP Lot 24
Part: Professional Washing Machines and Dryers
Bill of material of Base case WM2
P o s MATERIALS Extraction & Production Weight Category Material or Processnr Description of component in g C lick &select select C atego ry f irst !
1 Stainless steel 52625.0 3-Ferro 25-Stainless 18/8 coil
2 Galvanized steel 105250.0 3-Ferro 21-St sheet galv.
3 Cast Iron 18945.0 3-Ferro 23-Cast iron
4 Plastics (PP. Polyester. ABS etc.) 5200.0 1-BlkPlastics 4-PP
5 Zinc 630.0 4-Non-ferro 32-ZnAl4 cast
6 Aluminium 13900.0 4-Non-ferro 26-Al sheet/extrusion
7 Copper 3500.0 4-Non-ferro 30-Cu tube/sheet
8 PVC (cables) 210.0 1-BlkPlastics 8-PVC
9 Electronics 4300.0 6-Electronics 98-controller board
10 EDPM rubber 2740.0 1-BlkPlastics 1-LDPE
11 Glass 2100.0 7-Misc. 54-Glass for lamps
12 Polyamid (PA) 1050.0 2-TecPlastics 11-PA 6
Bill of material of Base case WM3
P o s MATERIALS Extraction & Production Weight Category Material or Processnr Description of component in g C lick &select select C atego ry f irst !
1 Stainless steel 133200.0 3-Ferrous 25-Stainless 18/8 coil
2 Steel tube 72800.0 3-Ferrous 21-St sheet galv.
3 Galvanized steel 163500.0 3-Ferrous 23-Cast iron
4 Cast Iron 102900.0 3-Ferrous 4-PP
5 Plastics (PP. Polyester. ABS etc.) 12700.0 1-BlkPlastics 11-PA 6
6 Zinc 2400.0 4-Non-ferrous 12-PC
7 Aluminium 54500.0 4-Non-ferrous 14-Epoxy
8 Copper 23000.0 4-Non-ferrous 10-ABS
9 PVC (cables) 1800.0 1-BlkPlastics 5-PS
10 Electronics 18200.0 6-Electronics 13-PMMA
11 EDPM rubber 9100.0 1-BlkPlastics 8-PVC
12 Glass 7900.0 7-Misc. 1-LDPE
13 Polyamid (PA) 3600.0 2-TecPlastics 2-HDPE
104
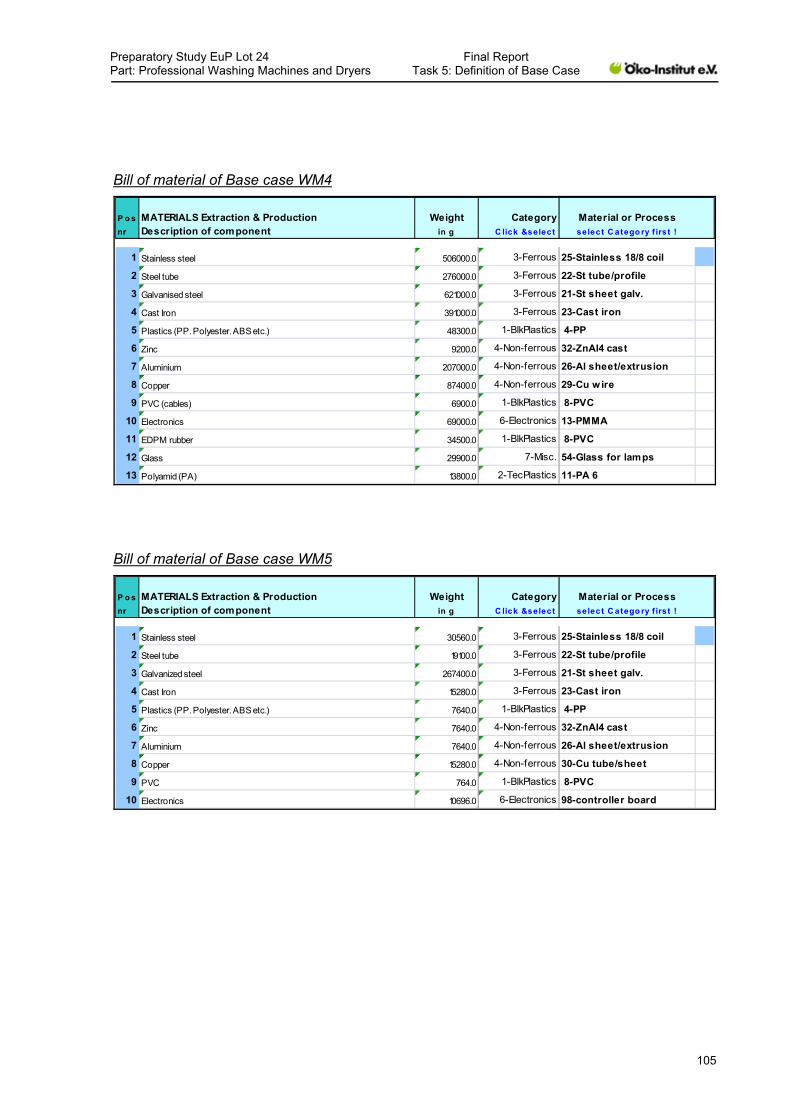
Preparatory Study EuP Lot 24 Part: Professional Washing Machines and Dryers
Final Report Task 5: Definition of Base Case
Bill of material of Base case WM4
P o s MATERIALS Extraction & Production Weight Category Material or Processnr Description of component in g C lick &select select C atego ry f irst !
1 Stainless steel 506000.0 3-Ferrous 25-Stainless 18/8 coil
2 Steel tube 276000.0 3-Ferrous 22-St tube/profile
3 Galvanised steel 621000.0 3-Ferrous 21-St sheet galv.
4 Cast Iron 391000.0 3-Ferrous 23-Cast iron
5 Plastics (PP. Polyester. ABS etc.) 48300.0 1-BlkPlastics 4-PP
6 Zinc 9200.0 4-Non-ferrous 32-ZnAl4 cast
7 Aluminium 207000.0 4-Non-ferrous 26-Al sheet/extrusion
8 Copper 87400.0 4-Non-ferrous 29-Cu w ire
9 PVC (cables) 6900.0 1-BlkPlastics 8-PVC
10 Electronics 69000.0 6-Electronics 13-PMMA
11 EDPM rubber 34500.0 1-BlkPlastics 8-PVC
12 Glass 29900.0 7-Misc. 54-Glass for lamps
13 Polyamid (PA) 13800.0 2-TecPlastics 11-PA 6
Bill of material of Base case WM5
P o s MATERIALS Extraction & Production Weight Category Material or Processnr Description of component in g C lick &select select C atego ry f irst !
1 Stainless steel 30560.0 3-Ferrous 25-Stainless 18/8 coil
2 Steel tube 19100.0 3-Ferrous 22-St tube/profile
3 Galvanized steel 267400.0 3-Ferrous 21-St sheet galv.
4 Cast Iron 15280.0 3-Ferrous 23-Cast iron
5 Plastics (PP. Polyester. ABS etc.) 7640.0 1-BlkPlastics 4-PP
6 Zinc 7640.0 4-Non-ferrous 32-ZnAl4 cast
7 Aluminium 7640.0 4-Non-ferrous 26-Al sheet/extrusion
8 Copper 15280.0 4-Non-ferrous 30-Cu tube/sheet
9 PVC 764.0 1-BlkPlastics 8-PVC
10 Electronics 10696.0 6-Electronics 98-controller board
105

Final Report
Task 5: Definition of Base Case Preparatory Study EuP Lot 24
Part: Professional Washing Machines and Dryers
Bill of material of Base case WM6
P o s MATERIALS Extraction & Production Weight Category Material or Processnr Description of component in g C lick &select select C atego ry f irst !
1 Stainless steel 441500.0 3-Ferrous 25-Stainless 18/8 coil
2 Steel tube 170600.0 3-Ferrous 22-St tube/profile
3 Galvanized steel 50100.0 3-Ferrous 21-St sheet galv.
4 Cast Iron 80300.0 3-Ferrous 23-Cast iron
5 Plastics (PP. Polyester. ABS etc.) 48200.0 1-BlkPlastics 4-PP
6 Zinc 20100.0 4-Non-ferrous 32-ZnAl4 cast
7 Aluminium 30100.0 4-Non-ferrous 26-Al sheet/extrusion
8 Brass 20100.0 0 31-CuZn38 cast
9 Copper 30100.0 4-Non-ferrous 30-Cu tube/sheet
10 PVC (cables) 2000.0 1-BlkPlastics 8-PVC
11 Electronics 60200.0 6-Electronics 8-PVC
12 EDPM rubber 20100.0 1-BlkPlastics 1-LDPE
13 Glass 10000.0 7-Misc. 54-Glass for lamps
14 Polyamid (PA) 20100.0 2-TecPlastics 11-PA 6
106

Preparatory Study EuP Lot 24 Part: Professional Washing Machines and Dryers
Final Report Task 5: Definition of Base Case
Bill of material of Base case WM7
P o s MATERIALS Extraction & Production Weight Category Material or Processnr Description of component in g C lick &select select C atego ry f irst !
1 Stainless steel 9600000.0 3-Ferrous 25-Stainless 18/8 coil
2 Galvanized steel 1200000.0 3-Ferrous 21-St sheet galv.
3 Cast iron 600000.0 3-Ferrous 23-Cast iron
4 Copper (cable) 240000.0 4-Non-ferrous 29-Cu w ire
5 EPDM rubber 79200.0 1-BlkPlastics 1-LDPE
6 Electronics 120000.0 6-Electronics 98-controller board
7 PE 79200.0 1-BlkPlastics 6-EPS
8 PVC (cables) 79200.0 1-BlkPlastics 8-PVC
Bill of material of Base case D1
P o s MATERIALS Extraction & Production Weight Category Material or Processnr Description of component in g C lick &select select C atego ry f irst !
1 Stainless Steel 34600.0 3-Ferro 25-Stainless 18/8 coil
2 Steel Sheet galvanized 3500.0 3-Ferro 21-St sheet galv.
3 Cast Iron 2400.0 3-Ferro 23-Cast iron
4 Polypropylen (PP) 7700.0 1-BlkPlastics 4-PP
5 Polyamid (PA) 400.0 2-TecPlastics 11-PA 6
6 Acrylonitrile Butadiene Styrene (ABS) 2100.0 1-BlkPlastics 6-EPS
7 Plystyrene (PS) 400.0 1-BlkPlastics 10-ABS
8 Styropor expandable polystyrene (EPS) 450.0 1-BlkPlastics 5-PS
9 Polyvinylchlorid (PVC) 150.0 1-BlkPlastics 8-PVC
10 Plastics others 2500.0 1-BlkPlastics 2-HDPE
11 Aluminium 900.0 4-Non-ferro 26-Al sheet/extrusion
12 Cu wire 2600.0 4-Non-ferro 29-Cu w ire
13 Glass for lamps 600.0 7-Misc. 54-Glass for lamps
14 Electronics (control) 1900.0 6-Electronics 98-controller board
107

Final Report
Task 5: Definition of Base Case Preparatory Study EuP Lot 24
Part: Professional Washing Machines and Dryers
Bill of material of Base case D2
P o s MATERIALS Extraction & Production Weight Category Material or Processnr Description of component in g C lick &select select C atego ry f irst !
1 Stainless Steel 32800.0 3-Ferro 25-Stainless 18/8 coil
2 Steel Sheet galvanized 3500.0 3-Ferro 21-St sheet galv.
3 Cast Iron 2800.0 3-Ferro 23-Cast iron
4 Polypropylen (PP) 7200.0 1-BlkPlastics 4-PP
5 Polyamid (PA) 400.0 2-TecPlastics 11-PA 6
6 Acrylonitrile Butadiene Styrene (ABS) 2100.0 1-BlkPlastics 6-EPS
7 Plystyrene (PS) 400.0 1-BlkPlastics 10-ABS
8 Styropor expandable polystyrene (EPS) 450.0 1-BlkPlastics 5-PS
9 Polyvinylchlorid (PVC) 150.0 1-BlkPlastics 8-PVC
10 Plastics others 1500.0 1-BlkPlastics 2-HDPE
11 Aluminium 900.0 4-Non-ferro 26-Al sheet/extrusion
12 Cu wire 2600.0 4-Non-ferro 29-Cu w ire
13 Glass for lamps 600.0 7-Misc. 54-Glass for lamps
14 Electronics (control) 1800.0 6-Electronics 98-controller board
Bill of material of Base case D3
P o s MATERIALS Extraction & Production Weight Category Material or Processnr Description of component in g C lick &select select C atego ry f irst !
1 Steel 4350.0 3-Ferro 25-Stainless 18/8 coil
2 Steel sheet galvanized 108750.0 3-Ferro 21-St sheet galv.
3 Plastics (PP. Polyester. ABS etc.) 2175.0 1-BlkPlastics 4-PP
4 Aluminium 20300.0 4-Non-ferro 26-Al sheet/extrusion
5 Copper 1450.0 4-Non-ferro 30-Cu tube/sheet
6 PVC 145.0 1-BlkPlastics 8-PVC
7 Electronics 3045.0 6-Electronics 98-controller board
8 EDPM 1450.0 1-BlkPlastics 1-LDPE
9 Other 3480.0 7-Misc. 54-Glass for lamps
108

Preparatory Study EuP Lot 24 Part: Professional Washing Machines and Dryers
Final Report Task 5: Definition of Base Case
Bill of material of Base case D4
P o s MATERIALS Extraction & Production Weight Category Material or Processnr Description of component in g C lick &select select C atego ry f irst !
1 Stainless steel 12240.0 3-Ferro 25-Stainless 18/8 coil
2 Galvanized steel 107100.0 3-Ferro 21-St sheet galv.
3 Steel 7650.0 3-Ferro 22-St tube/profile
4 Cast Iron 6120.0 3-Ferro 23-Cast iron
5 Plastics (PP. Polyester. ABS etc.) 3820.0 1-BlkPlastics 4-PP
6 Aluminium 3060.0 4-Non-ferro 6-EPS
7 Copper 6120.0 4-Non-ferro 10-ABS
8 PVC 300.0 1-BlkPlastics 5-PS
9 Electronics 4600.0 6-Electronics 8-PVC
10 Glass 1990.0 7-Misc. 2-HDPE
Bill of material of Base case D5
P o s MATERIALS Extraction & Production Weight Category Material or Processnr Description of component in g C lick &select select C atego ry f irst !
1 Stainless steel 24400.0 3-Ferro 25-Stainless 18/8 coil
2 Galvanized steel 243600.0 3-Ferro 21-St sheet galv.
3 Steel 17400.0 3-Ferro 22-St tube/profile
4 Cast Iron 13900.0 3-Ferro 23-Cast iron
5 Plastics (PP. Polyester. ABS etc.) 12200.0 1-BlkPlastics 4-PP
6 Aluminium 6950.0 4-Non-ferro 26-Al sheet/extrusion
7 Copper 13900.0 4-Non-ferro 30-Cu tube/sheet
8 PVC 700.0 1-BlkPlastics 8-PVC
9 Electronics 10400.0 6-Electronics 98-controller board
10 Glass 4550.0 7-Misc. 54-Glass for lamps
109

Final Report
Task 5: Definition of Base Case Preparatory Study EuP Lot 24
Part: Professional Washing Machines and Dryers
Bill of material of Base case D6
P o s MATERIALS Extraction & Production Weight Category Material or Processnr Description of component in g C lick &select select C atego ry f irst !
1 Stainless steel 52150.0 3-Ferro 25-Stainless 18/8 coil
2 Galvanized steel 521500.0 3-Ferro 21-St sheet galv.
3 Steel 37250.0 3-Ferro 23-Cast iron
4 Cast Iron 29800.0 3-Ferro 23-Cast iron
5 Plastics (PP. Polyester. ABS etc.) 26100.0 1-BlkPlastics 4-PP
6 Aluminium 14900.0 4-Non-ferro 26-Al sheet/extrusion
7 Copper 29800.0 4-Non-ferro 30-Cu tube/sheet
8 PVC 1500.0 1-BlkPlastics 8-PVC
9 Electronics 22350.0 6-Electronics 98-controller board
10 Glass 9650.0 7-Misc. 54-Glass for lamps
Bill of material of Base case D7
P o s MATERIALS Extraction & Production Weight Category Material or Processnr Description of component in g C lick &select select C atego ry f irst !
1 Stainless Steel 16600.0 3-Ferro 25-Stainless 18/8 coil
2 Steel 2826600.0 3-Ferro 21-St sheet galv.
3 Cast Iron 6650.0 3-Ferro 23-Cast iron
4 Copper 6650.0 4-Non-ferro 30-Cu tube/sheet
5 EPDM rubber 3325.0 1-BlkPlastics 1-LDPE
6 PE 3325.0 1-BlkPlastics 6-EPS
7 Electronics 3325.0 6-Electronics 98-controller board
8 PVC (cables) 3325.0 1-BlkPlastics 8-PVC
8.2 Additional questionnaire to stakeholders
The additional questionnaire for the final report is provided separately in the following
document:
EuP_Lot24_Wash_T2-T7_Questionnaire_for_Final_Report.xls
110


