
Preparing 21st Century Business Intelligence Students
Through 21st Century Approaches
Bellevue College
Presenters: Linda Rumans & Sylvia Unwin

The Problem
Mountains of DataBusiness People
GAP
How do I increase sales????
How do I make my product better???
How do I retain customers?

The Problem
Mountains of DataBusiness People
GAP
How do I increase sales????
How do I make my product better???
How do I retain customers?
Business Intelligence

What is BI?
The process by which an organization
manages large amounts of data, extracting pertinent information, and turning that information into knowledge upon which actions can be taken.

What is BI?
Business intelligence (BI) is a broad category of application programs and technologies for gathering, storing, analyzing, and providing access to data to help enterprise users make better business decisions.

BI
Involves PEOPLE and Technology Involves using a rational approach to
management Involves a continuous cycle of measurement,
adjustment & remeasurement
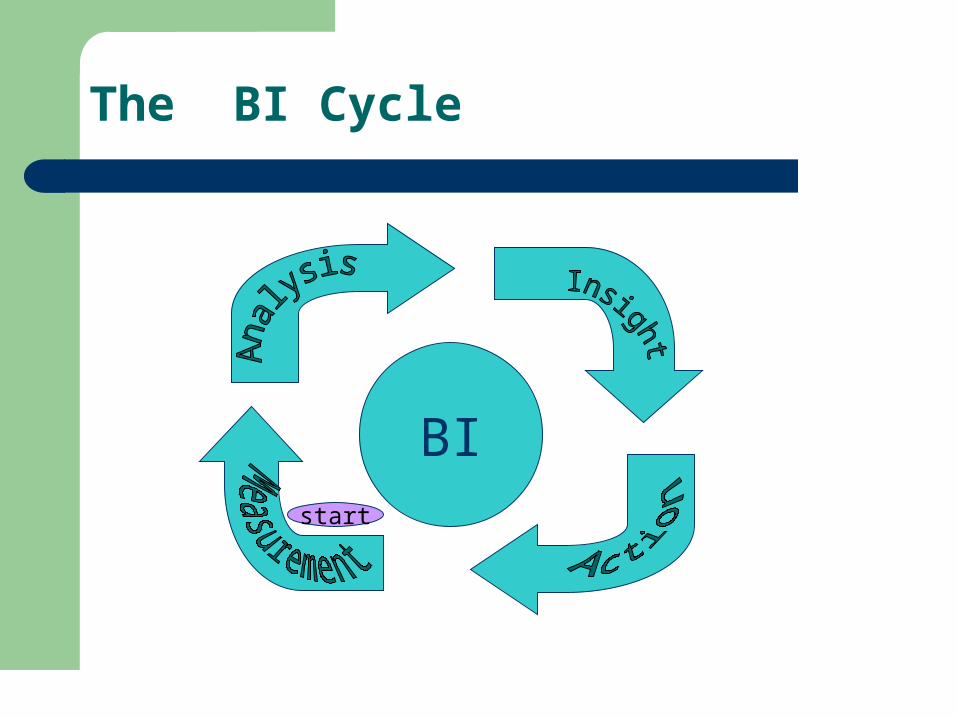
The BI Cycle
BIstart

Reasons for BI
BI enables organizations to make well informed business decisions and gain competitive advantage.
BI enables organizations to use information to quickly and constantly respond to changes.

To Note:
Although we call it Business Intelligence, the concepts and techniques are applicable to almost any organization including those in health care, biotech, education, government …

Why This Curriculum?
Discovered new, growing field– The world is a database
Target students both from Business and Technology– Upgrade skills– Jobs won’t be outsourced
example: business analyst, data analyst, data warehouse support specialist, data architect, reporting analyst

Why this Curriculum?
Organizations have lots of data Data is not in a form that is useful to
decision-makers– Not easy to review– Not informative nor insightful

Jobs, Jobs, Jobs
"business intelligence" Job Trends
Scale: Absolute - Relative
Indeed.com searches millions of jobs from thousands of job sites.
This job trends graph shows relative growth for jobs we find matching your
search terms.

BI Curriculum
Analytics– Reporting– Analytic Tools– Performance Management
Dashboards Score Cards
Data Visualization

BI Curriculum
Data Warehouses Multi-Dimensional Databases (cubes) Data Mining Dimensional Modeling

Analytics and Data Visualization
All about analyzing the data and presenting information in a meaningful format

Analytics
Reporting Applications – Limited user interaction– Fulfill a significant portion of an organization’s
information needs– SQL Server Reporting Services
Analytic Applications– Allow users to visualize and explore data
following their train of thought– Extensive interactivity– Tableau


Analytics – Performance Management
Key Performance Indicators Dashboards Score Cards

Dashboard Example

Bridging the Gap
Need software to provide access to the data, allow flexible manipulation, and provide meaningful presentation
Need data storage structures to facilitate fast analysis of huge volumes of data

Data Storage Structures
Multi-Dimensional DatabasesCubes

Multi-Dimensional Databases
Measures– Any quantitative expression – Some are designated as Key Performance Indicators (KPI)– Appropriate to the business process.
Dimensions– How we describe the measures:
Product/Customer/Region/Time– These are the “By’s– “What were our Customer Sales by Product Line by
Region by Quarter for the past two years?”.

Logical Structure

Multi-Dimensional Databases (Cubes)
ODS ODS ODS
Data Warehouse
Multi-Dimensional Database (Cube)
* ODS = Operational Data Store
Relational Database Programs
Business Intelligence Programs

Multi-Dimensional Databases
Multi-Dimensional Database (Cube)

Software Applications
Multi-Dimensional Database
(Cube)
Business Person
Business Person
Business Person
Reporting
Applications
Analytic Applications
Score Cards
Dashboards

Summary
Students learn to:– Create multi-dimensional databases– Create professional quality reports– Use analytics to provide in-depth data analysis

Data Warehouse Topics
Decision Support Systems– history
Requirements Gathering– Where data located, owners, definition, how often
updated
Data Analysis– Determine table structures (Facts & Dimensions)– What makes good data

Data Warehouse
ETL Processes & Deliverables– Cleaning & Conforming
Valid, missing Address, gender
– Staging areas– Schemas
Dimension Tables Fact Tables

Key Concepts
Design and plan the data extraction– Data source type => extract/load => Target
database
Analyze the source data– Column name, data type, delimiter, transformation
Target Database Determine logical data mapping

Logical Data Mapping
Target SourceTransformation
DB Name Table Name Column Name
Data Type Source File Name
Column Name
Data Type
MachineVars EnvironVars VarName VarChar
(50)
Setup.txt VarName VarChar
(50)
MachineVars EnvironVars VarValue VarChar
(500)
Setup.txt VarValue VarChar
(500)

Slowly Changing Dimensions
Updating and inserting records into a data warehouse dimension tables
Type 1– New changes will overwrite existing data
Type 2– New changes create new records instead of updating
existing ones. Will change date to indicate current or expired record.
Type 3– Limited historical data; add columns for “old” value, update
“new” data

Data Mining
The process of identifying patterns in data
Goes beyond simple querying of the database
Goes beyond multi-dimensional database queries as well

Data Mining
Data Mining works for problems like:– Develop a general profile for credit card customers
…– Differentiate individuals who are poor credit risks
…– Determine what characteristics differentiate male
& female investors.

Data Mining vs. Data Query
Use data query if you already almost know what you are looking for.
Use data mining to find regularities in data that are not obvious.

Data Mining Applications
Fraud detection Targeted Marketing Risk Management Business Analysis

Origins of Data Mining
Mathematics– Statistics– Numerical Analysis
Artificial Intelligence/Machine Learning Computer Science
– Data Storage and Manipulation

How does Data Mining work?
Uses induction-based learning:
The process of forming general concept definitions by observing specific examples of concepts to be learned.

How does Data Mining work?
What-Cha-Ma-Call-Its NOT What-Cha-Ma-Call-Its

How does Data Mining work?
Which of these are What-Cha-Ma-Call-Its?

Data Mining Process
List of Customers:
-some bicycle buyers
-some not
Data Mining
SoftwareModel
List of Prospective Buyers
Model
List of Likely Buyers

Overview of Mining Strategies
Data MiningStrategies
SupervisedLearning
Market Basket
Analysis
UnsupervisedClustering
Note: This representation is over-simplified and data mining strategies are continually being invented.

Skills
Written communication Problem Solving
– Analytical – Troubleshooting
Software– Microsoft SQL Server Management Studio– SQL Server BI Development Studio– SQL Server Reporting Services– Tableau

E-Modularity
Delivery online– Available across the country – Available across foreign lands
Each class has modules– How to get started– Introduction to the topic– Intermediate– Advanced– Each with hands on applied assessments

Delivery Methods
Use of Camtasia for– Software demonstrations– PowerPoint lectures
Elluminate Camtasia Relay You tube

Marketing
Internal– Faculty– Career center– Workforce, Workfirst– Community Relations office (press release)
External– Agency
Web pages, brochures, posters, radio ad
– Continuing Education: Chamber of Commerce contacts, memberships to business organizations

Higher Level
Designed for those students already in the field: database analyst, developer, business analyst
How do we prepare students? Certificates as a stepping ladder

Certificates
Database Analyst (6 classes)– SA & D, programming, reporting, spreadsheets, db
theory– 2 quarters full-time/ 3 quarters part-time
Database Report Developer (3 additional classes)– Programming, SQL, group processes
Web site: www.bellevuecollege.edu/prog

Certificates
Business Intelligence Analyst (5 classes)– Analytics, Multi-dimensional analysis, data
warehousing, data mining, statistics, general business– 2 quarters full-time/ 3 quarters part-time
Business Intelligence Developer (4 additional classes)– Dimensional modeling, data visualization, multi-
dimensional analysis II, data warehousing II (more programming with SQL Server)
Web site: www.bellevuecollege.edu/prog/bi

Student Placement
Outside Businesses have found our program– Hiring Agencies/Recruiters– Microsoft– Consulting firms– Coldwater Creek– Start-ups
Advisory Board volunteers– Small Businesses– Curriculum


