
FEDERAL RESERVE BANK OF SAN FRANCISCO
WORKING PAPER SERIES
Prepayment and Delinquency in the Mortgage Crisis Period
John Krainer
Federal Reserve Bank of San Francisco
Elizabeth Laderman Federal Reserve Bank of San Francisco
September 2011
The views in this paper are solely the responsibility of the authors and should not be interpreted as reflecting the views of the Federal Reserve Banks of San Francisco and Atlanta or the Board of Governors of the Federal Reserve System.
Working Paper 2011-25 http://www.frbsf.org/publications/economics/papers/2011/wp11-25bk.pdf

Prepayment and Delinquency in the Mortgage Crisis Period∗
September 2011
John Krainer and Elizabeth Laderman
Abstract
We study the interaction of borrower mortgage prepayment and mortgage delinquency during
the period between 2001 and 2010. We show that when house prices flattened and began
their subsequent decline, borrowers had increasingly slow prepayments and that this decline in
prepayment rates roughly coincided with the sharp increase in their delinquency rates. Low
credit score borrowers, in particular, display a pronounced negative correlation between default
rates and prepayment rates. Shortfalls of actual prepayment rates from predicted rates based
on an estimated prepayment model suggest that, in addition to the effects of declining house
prices, tighter lending standards also may have played a role in weak prepayment activity.
JEL Codes: G21, L11, D82. Key Words: Mortgage Lending, Refinancing, Default, Credit Risk.∗Both authors are from the Federal Reserve Bank of San Francisco. The views expressed are those of the authors
and not necessarily those of the Federal Reserve System. We would like to thank James Gillan and William Hedbergfor excellent research assistance. We thank Bob Avery and Neil Bhutta for helpful comments on an earlier draft.
1

1 Introduction
In this paper we document the connection between declines in borrower prepayment rates and in-
creases in delinquency rates in the 2001-2010 period. During the housing boom in the mid-2000s,
low credit score borrowers had higher prepayment speeds than borrowers with higher credit scores.
When house price appreciation slowed, however, the situation reversed itself. More and more bor-
rowers, especially low credit score borrowers, were unable to prepay, and quickly became unable
(or unwilling) to keep current on their mortgages. We also document that even after controlling
for risk factors that would impede mortgage prepayment, including loan-to-value ratios, post-2007
prepayment rates appear unaccountably slow, suggesting that lenders tightened underwriting stan-
dards towards the end of the 2000s. Finally, we quantify the size of this possible negative credit
supply shock in residential mortgage lending.
The expected return on a mortgage loan is determined by the expected cash flows in the form
of monthly mortgage payments. The primary risk that mortgage lenders and investors face is that
these cash flows cease, either because the borrower prepays the loan or because the borrower falls
into default. For most of the past several decades researchers studying mortgage loan performance
have focused on prepayment risk and the related question of whether borrower prepayment behavior
was optimal or not.1 Indeed, prior to the boom in mortgage lending in the 2000s, downpayment
requirements and other underwriting standards were effectively so stringent as to make default
a fairly unusual event. Between 1980 and 2005, the mortgage delinquency rate (defined to be
loans past-due 60 days or more, plus foreclosures) averaged just over 2 percent. With the first-lien
mortgage delinquency rate in 2010 at nearly 11 percent, much of the research focus on mortgage
loan performance has shifted to default risk. For example, see Doms, Furlong, and Krainer (2007),
Gerardi, Shapiro, and Willen (2008), and Gerardi, Lehnert, Sherlund, and Willen (2009) for papers
accounting for the patterns of default using observable borrower and market-specific variables, and
Bubb and Kaufman (2009), Elul (2009), Keys, Mukherjee, Seru, and Vig (2010), and Krainer
and Laderman (2009) for papers examining the role of possible agency problems between loan
originators and investors.1For example see Brennan and Schwartz (1985), Green and LaCour-Little (1999), Schwartz and Torous (1989).
2

Subprime loans, or loans to borrowers with high ex ante default probabilities, were originally
conceived as credit repair loans. The typical subprime borrower was a person (or household) with
some history of loan delinquency and financial distress. The subprime mortgage was a form of
bridge finance for these borrowers. Loan rates were typically so high as to be burdensome for a
household in the long run. But by meeting payment obligations the household would be rewarded
with a higher credit score and, with luck, would build some equity in the house. At this point,
the borrower would prepay and effectively refinance into a more affordable loan. This basic story
is at the heart of the narrative sketched out by Gorton (2008), with the added emphasis that
at the peak of the subprime lending boom in the mid 2000s, expectations for strong house price
appreciation would tend to make this type of business model quite attractive to lenders.2 Indeed,
Gorton’s description of the subprime lending model is effectively one where lenders shifted the
emphasis from traditional underwriting standards to a business model that depended on continued
house price appreciation. Early prepayment was a core part of the story for borrowers and lenders
alike.3 If house prices failed to rise, however, this event could short circuit the refinancing option.
If borrowers were unable to prepay the loan, the loose underwriting and generally high LTVs at
origination would imply high default probabilities.
The literature on the housing and mortgage market collapse is now quite substantial. To date,
however, there has been relatively little analysis on prepayment rates during the last decade. One
important early paper that integrates prepayment and default risk is the work of Deng, Quigley, and
VanOrder (2000) who observe that accounting for a borrower’s prepayment option helps to explain
the seemingly slow propensities of borrowers to default during the 1990s.4 Deng et. al. demonstrate
that the default hazard is sensitive to interest rate volatility. Borrowers evidently lower their default
points because of the value of their prepayment options. In some cases, the prepayment option
provides the borrower with an added incentive to wait for further house price appreciation, and
thereby induces the borrower to stay current on the mortgage. Much of our empirical analysis is2For an empirical demonstration of the bridge loan aspect of subprime mortgages, see Demyanyk (2009)3This transition dynamic is also at work in Mian and Sufi (2009)) in their description of how a credit supply
shock bred risky lending.4See also Agarwal, Chang, and Yavas (2010) who study the propensity of different lenders to securitize loans
according to prepayment risk.
3
conducted in the same spirit as the Deng et. al. paper, although it is implemented on a different
sample period with quite different economic outcomes for borrowers and lenders.
The main empirical question we address is the extent to which the increase in delinquency rates
during the housing market bust was related to a decrease in the ability of borrowers to prepay. We
informally link this inability prepay to an inability to qualify for a new loan due to a decline in
house prices. Then we estimate a competing risks hazard model of prepayment that includes house
prices as an explanatory variable. We use this model to predict prepayment and find that, since
the end of 2007, actual prepayment has lagged predicted values. We posit therefore that tighter
lending standards also decreased borrowers’ ability to refinance.
The rest of the paper is organized as follows. Section 2 discusses our data set, consisting of
loan level information on home mortgages originated between 2001 and 2008. In Section 3 we
describe the basic patterns in the data, while Section 4 discusses the estimation of the prepayment
model and how we use the model to assess the impact of changing lending standards on mortgage
prepayment. Section 5 concludes.
2 Data
Mortgage prepayments occur when a borrower sells the house or refinances the mortgage. In
the data we can not distinguish between these two reasons behind prepayment. The primary
motive for refinancing a mortgage is to reduce the interest rate on the loan, although borrowers
may also want to alter other contract terms of the loan as well, such as switch from adjustable-
rate to fixed payments, or change the maturity of the loan. Another motive for borrowers to
prepay their mortgages is to capitalize on house price appreciation. This motive could reflect the
desire to smooth nonhousing consumption through a cash-out refinance of built up home equity.
Alternatively, for the most financially constrained borrowers, house price appreciation could loosen
their financial constraints and allow borrowers to qualify for lower mortgage rates. This motive
would be particularly strong for ARM borrowers with introductory teaser rates who are facing a
future reset to a higher rate.
Prepayment rates are related to default rates in the sense that prepayment and default are
4

competing risks that determine the payoff on a mortgage loan. If prepayment occurs, then default
cannot occur. Default is thought to be costly to borrowers, so a borrower experiencing a life event
(e.g., divorce, illness, job loss) would likely want to refinance or prepay his mortgage rather than
incur default costs. Similarly, for a borrower with other, “strategic” motives for default (e.g., the
value of the house has declined), the ability to prepay some time in the future acts as an incentive
not to default. This is because, from a borrower’s perspective, lowering the cost of financing a
home purchase can offset capital losses on the home itself.
We study mortgage default and prepayment using data from LPS Applied Analytics, which
collects reports from most of the nation’s major mortgage servicers.5 Our data set consists of
loan level information on the credit score, interest rate, and performance of over 770,000 first-lien,
1-4 family, owner-occupied, conventional, mortgages originated between the first quarter of 2001
and the first quarter of 2008. For the results that we present in the charts in Section 3, our loan
performance observation window is from the first quarter of 2001 through the first quarter of 2010.
For the estimation of the pre-payment hazard model in Section 4, we cut off originations and the
observation window at the fourth quarter of 2007.
One drawback to the LPS data is that the database has grown discretely over time as new
servicers have entered into relationships with LPS. This raises the possibility that defaults and
prepayments from earlier years will be under-represented in our data. For example, if a servicer
starts contributing data to LPS in 2005.Q1, then we will start observing vintages of seasoned loans
in that servicing portfolio as of that date, but miss the loans from those vintages that terminated
prior to that date. We control for this problem by only considering loans that first appear in the
LPS data at most one quarter following the stated closing date of the loan.
Table 1 shows the ratios of pre-paid and 60-day delinquent loans by mortgage origination year
and interest rate type–fixed or adjustable.6 Not surprisingly, we can conclude that the performance
of FRMs has differed somewhat from that of ARMs, with the latter exhibiting generally higher5In LPS’s marketing literature, they claim that their participating servicers account for about 60% of the entire
mortgage market.6In Table 1 and Table 2 and in the upper left-hand panels of Figure 1 and Figure 2 we extend the origination
date window through the fourth quarter of 2009. We can then situate the prepayment and delinquency rate trendsof our main sample, which ends with the first quarter of 2008, within slightly longer term trends.
5

prepayment rates as well as higher delinquency rates.
Table 1: Fixed and Adjustable Rate Home Mortgages
Origination Year Total Loans Percent Pre-Paid by 2010.Q1 Percent Delinquent by 2010.Q1Fixed Adj. Fixed Adj. Fixed Adj.
2001 54,288 4,603 73.6 87.8 1.8 2.02002 64,403 11,384 75.8 90.0 1.8 1.62003 99,539 20,607 50.5 77.7 1.9 1.82004 56,494 34,021 45.9 68.3 3.4 4.82005 75,907 47,248 34.4 50.9 6.0 11.52006 67,783 36,812 34.2 32.0 9.7 19.82007 74,051 15,052 25.8 21.1 10.6 14.42008 48,010 3,927 24.1 23.4 3.5 5.02009 63,020 1,461 2.3 7.1 0.1 0
In addition to interest rate type, we also segment our analysis by the FICO score category
of the borrower–low or high, with 650 the point of division. If prepayment opportunities and
behavior are important inputs into mortgage delinquency, then we expect that these effects will
differ according to the probability of delinquency of the borrower, independent of prepayment.
Again, not surprisingly, delinquency rates on low FICO score loans have been higher than on high
FICO score loans. (Table 2.)
Table 2: Low FICO and High FICO Home Mortgages
Origination Year Total Loans Percent Pre-Paid by 2010.Q1 Percent Delinquent by 2010.Q1Low FICO High FICO Low FICO High FICO Low FICO High FICO
2001 7,362 51,529 66.9 75.8 6.6 1.12002 8,401 67,386 73.5 78.5 7.2 1.12003 11,843 108,303 57.7 54.9 7.8 1.32004 12,528 77,987 59.3 53.5 11.3 2.72005 18,946 104,209 44.5 40.1 18.6 6.22006 19,481 85,114 26.9 34.9 27.3 10.02007 13,115 75,988 16.1 26.5 24.4 9.02008 3,468 48,469 13.1 24.8 13.6 2.92009 1,373 63,108 1.7 2.4 1.0 0.1
6

3 Recent behavior of mortgage prepayments
Figure 1 and Figure 2 show the progression over time of the prepayment and delinquency rates for
FRMs and ARMs that were summarized in Table 1. The proportion of loans that were pre-paid or
delinquent by the end of our observation window is seen in the upper left-hand panel of each figure.
For both FRMs and ARMs, pre-payments within this window peaked with the 2002 vintage. For
FRMs, the 2007 vintage showed the highest delinquency rate; for ARMs, it was the 2006 vintage.
We note that when the incidence of prepayment and delinquencies is measured between orig-
ination and a fixed date, as it is in these upper left-hand panels, the shorter observation periods
for loans of more recent vintage tend to depress their prepayment and delinquency rates relative
to those for older loans. Despite this bias, the declines in prepayment rates over time that are
prominent in the upper left-hand panels of Figure 1 and Figure 2 also appear, in rough form, in
the other three panels, which measure incidence over a fixed period of time after origination and
therefore are not subject to the same effect. The general increases in delinquencies can be seen in
these other panels, too. In addition, for both types of panels, prepayments and delinquencies tend
to be higher for ARMs than for FRMs.
Given the broad similarities in the patterns of prepayments and delinquencies across the four
panels, it probably matters little which time window we choose for our analysis of loan performance.
But, in order to minimize the type of bias just discussed, we choose to measure incidence over a
fixed period of time after origination. In particular, we choose to report incidence of prepayment
and default over a period of 24 months since origination. With this window, originations after the
first quarter of 2008 must be discarded due to an insufficiently long observation period, but we
think the length of the observation window is ample enough.
There does appear to be some association between increases in delinquency rates and decreases
in prepayment rates. In order to assess whether the decreases in prepayment rates are due to a
decrease in the ability to prepay, we observe the path of prepayment rates along with the path of
the proportion of the loans of the indicated vintage whose borrowers should have had incentive to
prepay within 24 months of their loan origination. If, during any of the eight quarters after and
including the closing quarter for the loan, the current interest rate on the loan is above the market
7

rate on FRMs, then we identify that borrower as a prepayment candidate.7
In the top left panels of Figure 3 and Figure 4, we observe that, for the earlier vintages of
our sample, the relationship between our variable measuring the incentive to prepay and actual
prepayment rates is as would be expected if it were relatively easy to prepay. Roughly speaking,
when the proportion of borrowers with an incentive to prepay (the black line in the figures) decreases
(increases), we observe a corresponding decrease (increase) in prepayment rates. This pattern for
the earlier vintages is more pronounced for adjustable-rate loans, but, within a reasonable level of
tolerance, shows up in the fixed-rate sector, too. What is striking, however, is that this pattern
appears to break down beginning with the 2005 or 2006 vintages. Again, this observation is more
pronounced for adjustable-rate mortgages. For the 2005 vintage, prepayments of ARMs fall slightly
even though more borrowers should want to refinance. Prepayments fall more sharply for the 2006
and 2007 vintages. For FRMs, prepayment rates do increase with interest rate incentives for the
2006 and 2007 vintages, but only very slightly and do not approach the rates for 2001 and 2002,
when incentives were similarly strong.
Weak prepayment activity in the face of strong incentives suggests an inability to prepay, and,
consistent with this view, the bottom left panels show jumps in ARM delinquencies for the 2005
cohort and in FRM delinquencies for the 2006 group. We do note, however, the slight decrease in
delinquencies in ARMs for the 2007 vintage, despite a continued drop in prepayments.
Three of the total of four FICO subcategories within the interest rate type categories also
exhibit positive correlations between the attractiveness of prepayment as indicated by the path of
the interest rate spread and the incidence of prepayment, up until the 2005 or 2006 vintages, when
prepayment rates decline, despite a decline in market interest rates relative to the current rate on the
loan. (Upper left panels of Figure 5, Figure 6, and Figure 8.) Again, delinquency rates jump for the
2005 or 2006 vintages. (Lower left panels.) Although, for the 2001-2003 cohorts, the interest rate
and prepayment patterns for the remaining subcategory, low FICO ARMs, appear to differ from
the early vintage norm, the post-2004 patterns of interest rates, prepayment rates, and delinquency
rates for low FICO ARM borrowers are consistent with those for the other subcategories (Figure 7).7We use the Freddie Mac Primary Mortgage Market Survey contract interest rate on conventional fixed-rate first
mortgages.
8

The main reason to suspect that borrowers, starting with the 2005 or 2006 vintages, were
encountering prepayment difficulties is that house price appreciation slowed and then fell as the
recession took hold. (In Section 4, below, we will explore whether house prices really are sufficient to
explain relatively weak prepayment activity for these groups of borrowers.) A higher proportion of
FRM borrowers who took out loans in 2006 and in 2007 should have wanted to prepay than actually
did. But the 2006 and 2007 borrowers were facing falling house prices and, therefore, increasing
LTVs, which could have made it more difficult to prepay.8 (Top row of panels in Figure 3.) Similarly,
a higher proportion of ARM borrowers who took out loans in 2005, 2006, or 2007 should have wanted
to prepay than borrowers who took out loans in 2004. But the 2005-2007 borrowers were facing
stagnant or falling house prices.9 (Top row of panels in Figure 4.) Similar associations between
house price depreciation and falling or weak prepayment despite greater interest rate motives can
be seen for the FICO score subcategories of both FRMs and ARMs.
Borrowers with lower FICO scores and likely fewer resources with which to meet unexpected
financial challenges clearly experienced sharper increases in delinquency rates in the 2004 to 2007
vintages than did borrowers in the same vintages with higher FICO scores. This is apparent for
both FRMs (bottom row of panels in Figure 5 and Figure 6) and, especially, ARMs (bottom row
of panels in Figure 7 and Figure 8). Figure 9 and Figure 10 also portray more rapid deterioration
for lower FICO scores, across the whole range of FICO scores.10
Of course, there are many reasons, in addition to the differential burden of prepayment dif-
ficulties, why low FICO delinquency rates increased more quickly than high FICO delinquency
rates. Any financial setback will be more likely to result in delinquency for low FICO borrowers
than for high FICO borrowers. Given this consideration, we identify low FICO ARM borrowers
as showing evidence of being under particular financial duress, and we compare their delinquency8We measure house price appreciation over the two years following origination of the mortgage in the zip code of
the property using the Home Value Indices constructed by Zillow.9Vintage 2005 FRM borrowers who wanted to prepay might also have faced increased difficulty due to flat house
prices, but we would not be able to observe this, because, for most 2005 FRM borrowers, interest rates increasedafter they took out their mortgage. The general decrease in the incentive to prepay would mask any general decreasein the ability to prepay.
10The figures plot mean delinquency rates for 10-point FICO score bins with fitted lines from estimations ofthird-order polynomials in these mean FICO scores. A wider bin is used for ARMS of the 2008 vintage, due to fewobservations at the very low FICO range.
9

with a financially more similar group of borrowers, low FICO FRM borrowers.
In particular, vintage 2002 and 2003 low FICO ARM borrowers’ prepayment and delinquency
behavior is notable. Even though market interest rates increased for the low FICO ARM borrowers
of 2002 and 2003, their prepayment rates stayed at high levels. This was not true for low FICO
FRM borrowers, for whom the 2003 cohort saw less reason, based on interest rates, to prepay than
the 2002 cohort and behaved accordingly. A possible explanation for the 2002-2003 low FICO
ARM borrowers’ behavior is that they were highly motivated to refinance into new ARMs in order
to remain in or reenter the initial low teaser rate period of adjustable rate loans or in order to
obtain cash, especially if their adjustable rates were about to reset to the higher market levels.
(Top left panel of Figure 7.) Rapid house price appreciation facilitated such strategies. But, the
uptick in delinquency rates in 2004 (lower left panel) signals that such behavior may have been
due to financial distress and that, beginning with the 2004 vintage, ARM borrowers with poor
credit could not, as a group, refinance as easily as they would have liked, even when house prices
were still skyrocketing. And, even in the absence of the 2004 increase in delinquency, low FICO
ARM borrowers’ apparent overall prepayment incentives themselves suggest a shakier financial
foundation.
Consistent with the view that low FICO ARM borrowers were especially financially vulnerable
in the face of prepayment difficulties, we note that, from nearly equal delinquency rates for the
2002 cohort, low FICO ARM delinquencies increased much more rapidly than low FICO FRM
delinquencies over the remainder of the sample period. (Lower left panels of Figure 7 and Figure 5.)
That an analogous contrast is not as obvious for high FICO ARM delinquencies (Figure 8) as
opposed to high FICO FRM delinquencies (Figure 6) suggests that the contrast for the low FICO
delinquencies is not due solely to non-prepayment distinctions between ARMs and FRMs in general.
Figure 12 reveals an illuminating cycle in the ARM prepayment-FICO score schedule over the
2001-2008 period. For the 2001 vintage of borrowers, there is a positive correlation between credit
quality and prepayment rates. This positive correlation would be consistent with prepayment
being easier for less risky borrowers, a state of affairs which would seem to be "normal." Indeed,
according to the relative 2001 levels of our prepayment attractiveness variable for low and high
10

FICO ARM borrowers, relatively more low FICO ARM borrowers should have wanted to prepay
than high FICO ARM borrowers. (Left-hand panels of Figure 7 and Figure 8.) A greater ability to
prepay for the lower risk borrowers is then a good candidate explanation for the upward slope of
the prepayment versus FICO plot for the 2001 group. But, as prepayment rates stayed at a high
level for the riskier borrowers and decreased for the less risky borrowers as originations moved into
2002-2004, the prepayment-FICO score relationship became inverted. We argue that this inversion
was largely due to a strong motivation for ARM borrowers with a relatively small financial buffer
to refinance under any circumstances during these years. As house prices stagnated and then
plummeted beginning with the 2005 vintage, prepayment rates sagged and what would seem to be
a more normal upward-sloping schedule showed signs of reappearing.
The prepayment-FICO schedule for FRMs displays a somewhat similar cycle, but both the
positive and negative slopes are shallower. (Figure 11.) Perhaps credit quality matters less for
prepayment opportunities for FRMs, and we already know that, as a group, low FICO FRM
borrowers never displayed an obvious tendency to prepay when interest rates were rising.
4 Changes in lending standards after 2007
The steady, relatively high level of mortgage prepayments by low FICO 2001-2003 borrowers, when
interest rate incentives were abating, fits with the claims made by industry participants and some
researchers (e.g., Mian and Sufi (2009)) that much of the boom in non-prime lending in the U.S.
in the early and mid-2000s was due to a large positive credit supply shock. The results below
suggest the possibility that mortgage borrowers also experienced a large credit supply shock in the
opposite direction in the late 2000s. Changes in house prices, which, in Section 3, were argued to
offer a plausible reason for weak levels of prepayment for the 2005 to early 2009 vintages, appear
to be insufficient to explain low prepayment after 2007, a period that overlaps the two-year post-
origination window of many of the borrowers in those vintages.
Prepayment rates offer a convenient way to measure the effects of possible credit supply shocks
because the difficult problem of disentangling demand from supply is not as precarious as it is for
other types of credit market interactions. We would normally expect that the demand for housing
11

and, thus, the demand for mortgages, would be weak during periods when lenders were tightening
loan terms. This is the identification problem: in weak economic times, is new lending weak because
of demand or supply considerations? For existing homeowners and borrowers, however, the housing
tenure decision has already been made. Given the lumpiness of the housing good, it is very costly
to adjust housing consumption and there is ample evidence that households adjust their housing
consumption only after large changes in demand.11 Regardless of general demand conditions, all
borrowers with mortgages and prepayment options have incentive to prepay their mortgages when
interest rates fall. Thus, if the general level of interest rates falls and mortgage prepayment activity
does not increase, we could surmise that the lack of prepayment reflects an unwillingness on the
part of lenders to ease terms and facilitate prepayment. That is, we can interpret unexpectedly low
prepayment rates as the result of changes in the supply of mortgage credit.
Table 3: Prepayment Model Summary Statistics
Full Sample Fixed-rate loans Adjustable-rate loansmean std. dev. mean std. dev. mean std. dev.
Securitized .593 .654 .461Privately securitized .220 .179 .308Jumbo .166 .087 .337Option ARM .093 .286Loan amount $263,502 $222,065 $144,250 $144,592 $352,863 $295,143Loan-to-value .724 .148 .722 .153 .728 .136Subprime .041 .013 .101FICO 712 57 715 56 707 61Full documentation .250 .262 .225Prepay penalty .115 .04 .277Prepayment .346 .312 .421Delinquent 60+ days .023 .017 .037Observations 448,824 306,835 141,989
Following this line of reasoning, we can get a sense of the magnitude of any credit supply shock
in the late 2000s by estimating a mortgage prepayment model on a period prior to the evident
change in prepayment behavior and then comparing predicted prepayment rates for the late 2000s
to actual prepayment rates during the same period. To implement this exercise we estimate a11See Grosman and Laroque (1990) and the ensuing literature on household portfolio rebalancing in the presence
of illiquid assets such as housing.
12

competing risks hazard model where prepayment and default are competing risks. The hazard
rate for risk j, hj(t) is the probability that the borrower terminates the mortgage at time T by
termination type j, conditional on surviving to time t,
hj(t) = limδ→0
Pr(t < T ≤ T + δ, j|T ≥ t)δ
.
In the literature it is common to assume a proportional hazard framework where the conditional
hazard function is factored into a “baseline” hazard hbj that is a function of t alone, and a function
φ(x, βj) that incorporates explanatory variables related to the hazard of interest. That is, the
covariates shift the relative risk of failure but they do not affect the underlying shape of the hazard
function. Note that the parameter vector βj is indexed by j, reflecting the way that covariates are
allowed to impact the two hazards (default and prepayment) in different ways. We assume that
the function φ takes an exponential form so that the hazard is given by,
hj(t|x) = hbj(t)exp(xβj).
This specification lends itself to a fairly straightforward interpretation of the effects of the covariates
on the hazard rate. Consider two mortgage histories A and B with x’s that differ only in that one
history (history A) has a one unit increase in a single covariate xs. In comparing the hazard
functions of these two mortgage histories, the hazard ratio, hj(t|xA)
hj(t|xB), takes the simple form eβjs .
A hazard ratio greater than one (less than one) indicates an estimated increase (decrease) in
termination probability associated with that particular covariate.12
Summary statistics for the covariates used in the hazard models are listed in Table 3. In all
of the specifications explored here we update the current LTV throughout the loan history by12The canonical competing risks proportional hazards model is estimated by maximizing the partial likelihood
function
L(β) =
m∏j=1
kj∏i=1
exp[xji(tji)βj ]∑l∈R(tji)
exp[xl(tji)βj ],
where i denotes a history, j = 1, ..,m denotes the types of termination, kj denotes the number of subjects in thedata with termination type j, and R(tji) denotes the set of observations exposed to risk j after t periods of history.The likelihood function is “partial” in the sense that the method produces consistent estimates of the βs without asimultaneous estimation of the baseline hazard. See Cameron and Trivedi (2005) for details.
13

applying the house price appreciation of the relevant zip code-level house price index from Zillow
to the reported LTV at origination. We also include a squared current LTV term to capture possible
nonlinearities in the mortgage prepayment function with respect to LTV. In addition, we employ
a set of static covariates such as the log of the loan amount at origination, the FICO score, and
indicators for subprime, jumbo, full documentation and, for ARMs, an indicator of whether the
mortgage is an option ARM.
All results in Table 3 are based on loans originated between 2001.Q1 and 2007.Q4 and observed
over the same period. Given the different sensitivities of FRM and ARM borrowers to changes in
interest rates, we estimate the prepayment models separately for FRMs and ARMs. For FRMs we
model the incentive to prepay by the deviation of the borrower’s (fixed) mortgage rate from the
current market rate as given by the Freddie Mac primary mortgage market survey. As with the
LTV variable, we include a squared interest rate deviation term to capture possible nonlinearities.
For ARM borrowers, we adopt a different specification of the interest rate incentive to prepay. Since
the borrower’s mortgage rate moves roughly with the level of current mortgage rates, we do not
construct a deviation of the borrowers mortgage rate from the market rate, but instead simply use
the prevailing 30-year FRM rate as a proxy for prepayment motive. Accordingly, interpretation of
the propensity to prepay in the ARM models is different from the case of FRMs. For ARMs, it is
a decrease in the fixed interest rate variable that would increase a borrower’s incentive to switch
contracts, in addition, take on a different exposure to interest rate risk.
The results from the prepayment modeling may be found in Tables 4 and 5 below. We report
hazard ratios with robust standard errors in parentheses. Again, a reported hazard ratio less than
one indicates that the covariate is negatively associated with the prepayment hazard, and vice-versa
for hazard ratios greater than one. The reported results are for the prepayment hazard. By and
large the hazard ratios have the expected signs. For FRMs, a one percentage point increase in the
difference between the current mortgage rate and the prevailing market rate raises the prepayment
hazard by a factor of nearly three. Prepayment probabilities increase at a declining rate, however,
as this deviation between the borrower’s fixed interest rate and the market rate grows larger.
For relatively low LTVs, an increase in the current LTV is associated with a slightly higher
14

prepayment hazard rate. However, again we see that the squared term is negatively associated with
mortgage prepayment. Thus, if LTV rises high enough, it can have a depressing effect on mortgage
prepayment rates, consistent with the story sketched out in Section 3. Unsurprisingly, mortgages
with stated prepayment penalties are about 20-25 percent less likely to prepay than otherwise
identical mortgages. Borrowers with higher FICO scores have higher prepayment hazards, although
the effect is not statistically significant in all the specifications considered here. The subprime
indicator is significantly related to the prepayment hazard. Again, this is not too surprising given
the presumption that the subprime indicator is negatively associated with access to credit. Jumbo
mortgages have lower prepayment rates. Mortgages with full documentation of income sources have
low prepayment rates over this time.
Borrowers with conforming mortgages purchased or pooled by the GSEs had prepayment haz-
ards about 15 percent lower than the benchmark of loans that were retained in the lenders’ port-
folios. Privately securitized mortgages also had lower prepayment rates than retained mortgages.
Finally, we include some economic and financial market indicators in the hazard rate specifications.
The unemployment rate is positively associated with the prepayment hazard. Higher interest rate
volatility, as given by the MOVE index, has a slightly negative effect on the prepayment hazard.13
This latter finding is consistent with the notion that prepayment is an option for the mortgage
borrower and, all other things held equal, an increase in volatility of a key state variable such as
interest rates tends to increase the value of delaying exercise of the option.
For ARMs (Table 5), the interest rate enters into the prepayment model differently, as discussed
above. Thus, ARM borrowers are about 15-25 percent less likely to prepay their mortgages when
the fixed mortgage rate goes up by one percent. Many of the other hazard ratios in Table 5 look
qualitatively similar to the results for FRMs, with some notable exceptions. First, for ARMs, the
presence of a prepayment penalty is associated with a higher prepayment probability–not lower, as
was the case of FRMs. This finding is consistent with the story outlined in Gorton (2008) about
how high rates and fees for certain high risk borrowers could be viewed as a way of sharing house
price risk between borrowers and lenders. Related to this point, subprime borrowers with ARMs13The MOVE index is a measure of implied volatilities taken from interest rate options.
15

Table 4: Prepayment Hazard Model for Fixed-Rate Mortgages
(i) (ii) (iii) (iv) (v)Rate spread 3.129 3.010 3.022 2.762 2.793
(.022)*** (.022)*** (.022)*** (.021)*** (.022)***
Rate spread sq. .831 .843 .842 .857 .856(.003)*** (.004)*** (.004)*** (.004)*** (.004)***
Current LTV 1.044 1.042 1.043 1.040 1.043(.001)*** (.001*** (.001)*** (.001)*** (.001)***
Current LTV sq. .999 .999 .999 .999 .999(1.11e-5)*** (1.12e-5) (1.12e-5)*** (1.13e-5)*** (1.14e-5)***
Log loan size 1.435 1.570 1.569 1.585 1.514(.008)*** (.011)*** (.011)*** (.012)*** (.012)***
Penalty .563 .779 .776 .789 .765(.011)*** (.020)*** (.020)*** (.021)*** (.020)***
FICO 1.0001 1.0001 1.000 1.000(5.84e-5)* (5.84e-5)** (5.94e-5) (5.98e-5)
Subprime .634 .625 .651 .665(.023)*** (.023)*** (.024)*** (.025)***
Jumbo .739 .759 .743 .758(.010)*** (.011)*** (.011)*** (.012)***
Full doc. .619 .616 .653 .652(.006)*** (.006)*** (.007)*** (.007)***
GSE .863 .846 .841(.016)*** (.016)*** (.016)***
Private-label .829 .831 .822(.016) (.016)*** (.016)***
Unemployment 1.044 1.029(.001)*** (.003)***
MOVE Index 1.005 1.005(1.63e-4)*** (1.63-e4)***
State fixed effects No No No No YesLog pseudolikelihood -1,163,011 -1,161,448 -1,161,396 -1,113,155 -1,111,699Number of observations 2,433,719 2,433,719 2,433,719 2,433,719 2,433,719Number subjects 306,835 306,835 306,835 306,835 306,835Number of failures 99,172 99,172 99,172 99,172 99,172Number of competing 5,364 5,364 5,364 5,364 5,364Number of censored 202,299 202,299 202,299 202,299 202,299Hazard ratios with standard errors in parenthesesSignificance: .01(***), .05(**), .1(*).
16

had prepayment hazards about 25 percent higher than other ARM borrowers. Finally, for the
ARM specifications we also include an option ARM indicator. In our data we do not have reliable
observations on option ARM recast dates, but the mere presence of the option ARM contract
feature raises the prepayment hazard by about 15 percent, on average.
4.1 An out-of-sample exercise
We can aggregate the prepayment model’s predictions to show the fitted prepayment rate for a given
quarter and, thus, attempt to indirectly measure the extent to which the supply of mortgage credit
may have shifted as the housing bust and economy-wide recession progressed. For this exercise
we apply the specification in columns (iv) of Tables 4 and 5 to the same set of loans used for the
model estimation, now observed from 2008.Q1 through 2010.Q1. The bar in Figure 13 denotes the
demarcation between the in-sample prepayment model estimation period and the out-of-sample
perfect-foresight prediction period. With the in-sample window ending in 2007.Q4, several of the
large shocks to mortgage finance, such as the failure of Bear Stearns and Lehman Brothers, as
well as the the collapse of the GSEs, are not part of the estimation period. The out-of-sample
prepayment predictions make use of a perfect foresight assumption for the variables assumed to
determine prepayment. That is, the model takes as given the actual evolution of interest rates,
house prices, and principal balances when generating a prepayment probability.
The results from the exercise may be found in Figure 13, where we plot actual mortgage prepay-
ment rates by quarter (solid line) alongside predicted prepayment rates (dashed line). The actual
prepayment rate is the percentage of all loans entering a quarter that terminated in that quarter
via a prepayment. The predicted prepayment rate is the average prepayment probability for all
loans entering a quarter, based on the actual realizations of the covariates (e.g., LTV, the mortgage
interest rate, age of loan, etc...) at the end of the previous quarter. For example, in the fourth
quarter of 2002, approximately 3.4 percent of all mortgages in our sample were predicted to prepay,
whereas in fact only 2.3 percent of the mortgages actually prepaid.
Overall, the model appears to capture the basic patterns of prepayment during the estimation
period. For example, predicted prepayment rates increase with actual prepayment rates in early
17

Table 5: Prepayment Hazard Model for Adjustable-Rate Mortgages
(i) (ii) (iii) (iv) (v)FRM rate .729 .734 .750 .856 .837
(.010)*** (.010)*** (.011)*** (.013)*** (.013)***
Current LTV 1.039 1.037 1.037 1.040 1.043(.002)*** (.002)*** (.002)*** (.002)*** (.002)***
Current LTV sq. .999 .999 .999 .999 .999(1.33e-5)*** (1.34e-5)*** (1.34e-5)*** (1.36e-5)*** (1.38e-5)***
Log loan size 1.042 1.029 1.025 1.051 .966(.006)*** (.010)*** (.009)*** (.010)*** (.010)***
Penalty 1.279 1.059 1.044 1.054 1.042(.011)*** (.012)*** (.012)*** (.013)*** (.013)***
FICO .998 .999 .998 .999(7.75e-5) (7.78e-5) (7.88e-5) (7.91e-5)***
Subprime 1.268 1.252 1.254 1.257(.020)*** (.021)*** (.021)*** (.021)***
Jumbo 1.069 1.036 1.012 1.017(.014)*** (.014)** (.014) (.014)
Full doc. .752 .752 .778 .780(.007)*** (.007)*** (.008)*** (.008)***
Option ARM 1.152 1.132 1.166 1.134(.012)*** (.013)*** (.013)*** (.013)***
GSE .831 .834 .839(.010)*** (.010)*** (.010)***
Private-label .866 .885 .878(.009)*** (.009)*** (.008)***
Unemployment 1.074 1.060(.003)*** (.004)***
MOVE Index 1.005 1.005(2.13e-4)*** (2.14e-4)***
State fixed effects No No No No YesLog pseudolikelihood -696,231 -695,332 -695,193 -673,432 -672,864Number of observations 1,011,145 1,011,145 1,011,145 1,011,145 1,011,145Number subjects 141,989 141,989 141,989 141,989 141,989Number of failures 60,275 60,275 60,275 60,275 60,275Number of competing 5,033 5,033 5,033 5,033 5,033Number of censored 76,681 76,681 76,681 76,681 76,681Hazard ratios with standard errors in parenthesesSignificance: .01(***), .05(**), .1(*).
18

2001 and in the second half of 2002, when mortgage interest rates fell.14 It is true that the
model does not capture the full magnitude of the high prepayments throughout 2001 or, especially,
late 2002-late 2003, perhaps because borrowers’ sensitivity to rate declines during those periods
was more complicated than this simple model indicates. In particular, as noted by Krainer and
Marquis (2003), when interest rates hit local minima during these years, unusually large numbers
of households quickly refinanced. These periods coincided with housing market booms, and the
opportunity to obtain extra cash or trade up may have been especially motivating. In any case, the
literature has recognized these periods as ones with unusually high levels of refinancing activity.15
In the period surrounding the financial crisis, the out-of-sample prediction exceeds the actual
prepayment rate by a considerable margin. Figure 13 shows the deviation for all mortgages, but a
similar picture would emerge if we plotted predicted prepayment versus actual for ARMs and FRMs
separately. The aggregate deviation between predicted and actual peaked in 2008.Q4 when, after
a large decline in (conforming) mortgage rates, the predicted prepayment rate jumped to about 8
percent of all mortgages, but only about 1.5 percent of the borrowers in our sample managed to
refinance.
The model should be capturing borrower incentives to prepay or refinance following the drop in
market rates that occurred as the Federal Reserve slashed the federal funds target rate to 0-25 basis
points and then embarked upon the first round of large scale asset purchases (LSAPs). Evidently,
the usual rise in prepayments that would be predicted following a prolonged period of low interest
rates was offset by some other factor or combination of factors. We do not believe that house
price depreciation (or rising LTVs) is the primary culprit for the deviation in the post-2007 period,
as this variable is explicitly part of the prepayment model. Income shocks to borrowers could be
a problem. Unemployment enters our prepayment model crudely: we have the market level of
unemployment but not the job status of the actual borrower whose prepayment incentive we are
trying to evaluate. Additionally, borrowers may hesitate to refinance their mortgages because of14The high actual prepayment levels shown throughout 2001 and from the second half of 2002 through the second
half of 2003 in Figure 13 are consistent with the high levels shown in the charts in Section 3 for vintage 2001-2002borrowers.
15In addition to Krainer and Marquis (2003), see Canner, Dynan, and Passmore (2002) and McConnell, Peach,and Al-Haschimi (2003).
19

uncertainty about their housing consumption status. If economic factors raise the likelihood that
a household moves in the future, then it may not make sense to refinance. But we would like to
think that job-related obstacles to prepayment would be randomly distributed across borrowers in
a given market–at least from the perspective of the econometrician.
We posit that the most likely explanation for this deviation between predicted and actual is a
consequence of the relative tightening of conditions in the mortgage market. For example, for FRMs,
our measure of the prepayment probability function largely depends on the difference between the
borrowers old fixed interest rate and the current value of a market benchmark rate. It could be the
case that the existing rates of borrowers entering into our out-of-sample period were abnormally
cheap relative to the benchmark rate at the time of origination and that these bargain rates were
either much higher or no longer available.
5 Conclusion
In this paper we study the dynamics of mortgage prepayment behavior over the recent U.S. housing
cycle. We document the connection between robust house price appreciation and prepayment during
the housing boom in the early and mid 2000s. Similarly, once the housing market stalled and the
recession began, we see depressed prepayment. We show how mortgage prepayment behavior during
the boom period differed along the credit score spectrum. In these years, low credit score borrowers
were actually more likely to prepay their mortgages than higher credit score borrowers. This fact
is consistent with the Gorton (2008) description of how the subprime lending business was closely
tied to house price appreciation and prepayment. When the housing market faltered, low credit
score borrowers experienced lower prepayment rates than higher credit score borrowers. These
borrowers, of course, eventually suffered high mortgage default rates.
While we feel that we have established an empirical link between house prices and prepayment
and default, house price declines alone can not account for the low prepayment rates in the late
2000s, a period when mortgage interest rates were at historic lows. Our estimated prepayment
model supports the view that, once the recession was under way, lenders tightened their standards
and further constrained prepayment activity. Thus, our research supports the notion that not just
20

house price dynamics, but credit supply conditions as well, have played an integral role in housing
market performance during the most recent cycle.
21

6 References
Agarwal, S., Y. Chang, and A. Yavas (2010): “Adverse Selection in Mortgage Securitization,”
working paper.
Brennan, M. J., and E. S. Schwartz (1985): “Determinants of GNMA Mortgage Prices,”
AREUEA Journal, 13(3), 209–228.
Bubb, R., and A. Kaufman (2009): “Securitization and Moral Hazard: Evidence from Lender
Cutoff Rule,” Federal Reserve Bank of Boston Public Policy Discussion Papers, (09-5).
Canner, G. B., K. Dynan, and W. Passmore (2002): “Mortgage Refinancing in 2001 and Early
2002,” Federal Reserve Bulletin, 88(12), 469–481.
Demyanyk, Y. S. (2009): “Quick Exits of Subprime Mortgages,” Federal Reserve Bank of St.
Louis Review, 91(2), 79–93.
Deng, Y., J. M. Quigley, and R. VanOrder (2000): “Mortgage Terminations, Heterogeneity
and the Exercise of Mortgage Options,” Econometrica, 2, 275–307.
Doms, M., F. Furlong, and J. Krainer (2007): “Subprime Mortgage Delinquency Rates,”
working paper, SFFRB working paper No. 2007-33.
Elul, R. (2009): “Securitization and Mortgage Default: Reputation versus Adverse Selection,”
Federal Reserve Bank of Philadelphia working paper.
Gerardi, K., A. H. Shapiro, and P. S. Willen (2008): “Subprime Outcomes: Risky Mortgages,
Homeownership Experiences, and Foreclosures,” working paper.
Gerardi, K. S., A. Lehnert, S. M. Sherlund, and P. S. Willen (2009): “Making Sense of
the Subprime Crisis,” Brookings Papers on Economic Activity.
Gorton, G. (2008): “The Panic of 2007,” Paper prepared for the 2008 Jackson Hole Conference.
Green, R., and M. LaCour-Little (1999): “Some Truths about Ostriches: Who Doesn’t Prepay
Their Mortgages and Why They Don’t",” Journal of Housing Economics, 8(3), 233–248.
22

Grosman, S. J., and G. Laroque (1990): “Asset Pricing and Optimal Portfolio Choice in the
Presence of Illiquid Durable Consumption Goods,” Econometrica, 58(1).
Keys, B. J., T. K. Mukherjee, A. Seru, and V. Vig (2010): “Did Securitization Lead to Lax
Screening? Evidence from Subprime Loans,” Forthcoming in Quarterly Journal of Economics,
125(1).
Krainer, J., and E. Laderman (2009): “Mortgage Loan Securitization and Relative Loan Per-
formance,” (22).
Krainer, J., and M. Marquis (2003): “Mortgage Refinancing,” Federal Reserve Bank of San
Francisco Economic Letter, 2003(29).
McConnell, M. M., R. W. Peach, and A. Al-Haschimi (2003): “After the Refinancing Boom:
Will Consumers Scale Back their Spending?,” Federal Reserve Bank of New York Current Issues
in Economics and Finance, 9(12), 1–7.
Mian, A. R., and A. Sufi (2009): “The Consequences of Mortgage Credit Expansion: Evidence
from the U.S. Mortgage Default Crisis,” Quarterly Journal of Economics, 124(4).
Schwartz, E. S., and W. N. Torous (1989): “Prepayment and the Valuation of Mortgage-
Backed Securities,” Journal of Finance, 44(2), 375–392.
23

Figure 1:
0.2
.4.6
.8
2001 2002 2003 2004 2005 2006 2007 2008 2009
By First Quarter 2010
past due >= 60 days pre−paid0
.2.4
.6.8
2001 2002 2003 2004 2005 2006 2007 2008 2009
Within Four Quarters of Origination
past due >= 60 days pre−paid
0.2
.4.6
.8
2001 2002 2003 2004 2005 2006 2007 2008
Within Six Quarters of Origination
past due >= 60 days pre−paid
0.2
.4.6
.8
2001 2002 2003 2004 2005 2006 2007 2008
Within Eight Quarters of Origination
past due >= 60 days pre−paid
Fixed Rate Home Mortgage LoansProportion Delinquent and Pre−Paid, by Origination Year
24

Figure 2:
0.2
.4.6
.8
2001 2002 2003 2004 2005 2006 2007 2008 2009
By First Quarter 2010
past due >= 60 days pre−paid0
.2.4
.6.8
2001 2002 2003 2004 2005 2006 2007 2008 2009
Within Four Quarters of Origination
past due >= 60 days pre−paid
0.2
.4.6
.8
2001 2002 2003 2004 2005 2006 2007 2008
Within Six Quarters of Origination
past due >= 60 days pre−paid
0.2
.4.6
.8
2001 2002 2003 2004 2005 2006 2007 2008
Within Eight Quarters of Origination
past due >= 60 days pre−paid
Adjustable Rate Home Mortgage LoansProportion Delinquent and Pre−Paid, by Origination Year
25

Figure 3:
020
4060
8010
0m
ortg
age
rate
dec
linin
g, p
erce
nt
010
2030
4050
6070
pre−
paid
, per
cent
2001 2002 2003 2004 2005 2006 2007 2008
pre−paid mortgage rate decliningmortgage rate declining: percent of mortgages with higher current rate than market rate anytime within 24 months
Pre−Payment Vs. Mortgage Rate Declining
−30
−20
−10
010
2030
402−
yr h
ouse
pric
e ch
ange
, per
cent
010
2030
4050
6070
pre−
paid
, per
cent
2001 2002 2003 2004 2005 2006 2007 2008
pre−paid 2−yr house price change
Pre−Payment Vs. House Price Change
020
4060
8010
0m
ortg
age
rate
dec
linin
g, p
erce
nt
010
2030
past
due
>=60
day
s, p
erce
nt
2001 2002 2003 2004 2005 2006 2007 2008
past due>=60 days mortgage rate decliningmortgage rate declining: percent of mortgages with higher current rate than market rate anytime within 24 months
Delinquency Vs. Mortgage Rate Declining
−30
−20
−10
010
2030
402−
yr h
ouse
pric
e ch
ange
, per
cent
010
2030
past
due
>=60
day
s, p
erce
nt
2001 2002 2003 2004 2005 2006 2007 2008
past due>=60 days 2−yr house price change
Delinquency Vs. House Price Change
Fixed Rate Home Mortgage Loans
Percent Pre−Paid and Delinquent within 24 MonthsBy Origination Year
26

Figure 4:
020
4060
8010
0m
ortg
age
rate
dec
linin
g, p
erce
nt
010
2030
4050
6070
pre−
paid
, per
cent
2001 2002 2003 2004 2005 2006 2007 2008
pre−paid mortgage rate decliningmortgage rate declining: percent of mortgages with higher current rate than market rate anytime within 24 months
Pre−Payment Vs. Mortgage Rate Declining
−30
−20
−10
010
2030
402−
yr h
ouse
pric
e ch
ange
, per
cent
010
2030
4050
6070
pre−
paid
, per
cent
2001 2002 2003 2004 2005 2006 2007 2008
pre−paid 2−yr house price change
Pre−Payment Vs. House Price Change
020
4060
8010
0m
ortg
age
rate
dec
linin
g, p
erce
nt
010
2030
past
due
>=60
day
s, p
erce
nt
2001 2002 2003 2004 2005 2006 2007 2008
past due>=60 days mortgage rate decliningmortgage rate declining: percent of mortgages with higher current rate than market rate anytime within 24 months
Delinquency Vs. Mortgage Rate Declining
−30
−20
−10
010
2030
402−
yr h
ouse
pric
e ch
ange
, per
cent
010
2030
past
due
>=60
day
s, p
erce
nt
2001 2002 2003 2004 2005 2006 2007 2008
past due>=60 days 2−yr house price change
Delinquency Vs. House Price Change
Adjustable Rate Home Mortgage Loans
Percent Pre−Paid and Delinquent within 24 MonthsBy Origination Year
27
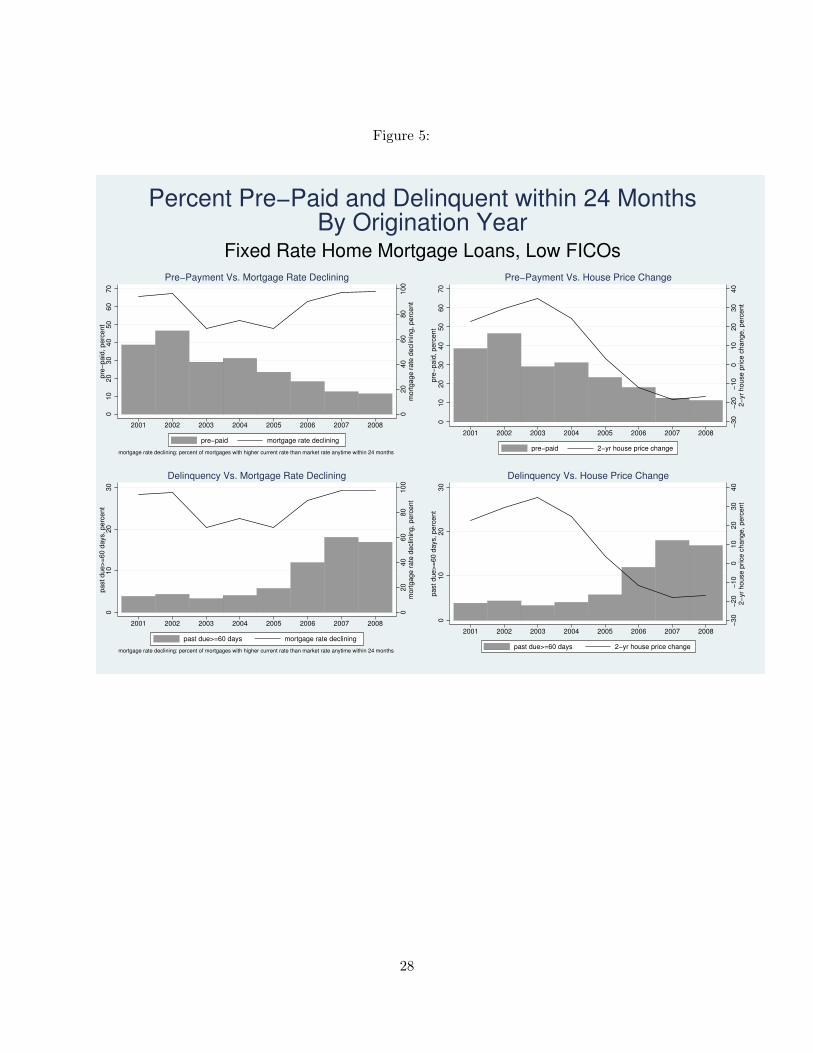
Figure 5:
020
4060
8010
0m
ortg
age
rate
dec
linin
g, p
erce
nt
010
2030
4050
6070
pre−
paid
, per
cent
2001 2002 2003 2004 2005 2006 2007 2008
pre−paid mortgage rate decliningmortgage rate declining: percent of mortgages with higher current rate than market rate anytime within 24 months
Pre−Payment Vs. Mortgage Rate Declining
−30
−20
−10
010
2030
402−
yr h
ouse
pric
e ch
ange
, per
cent
010
2030
4050
6070
pre−
paid
, per
cent
2001 2002 2003 2004 2005 2006 2007 2008
pre−paid 2−yr house price change
Pre−Payment Vs. House Price Change
020
4060
8010
0m
ortg
age
rate
dec
linin
g, p
erce
nt
010
2030
past
due
>=60
day
s, p
erce
nt
2001 2002 2003 2004 2005 2006 2007 2008
past due>=60 days mortgage rate decliningmortgage rate declining: percent of mortgages with higher current rate than market rate anytime within 24 months
Delinquency Vs. Mortgage Rate Declining
−30
−20
−10
010
2030
402−
yr h
ouse
pric
e ch
ange
, per
cent
010
2030
past
due
>=60
day
s, p
erce
nt
2001 2002 2003 2004 2005 2006 2007 2008
past due>=60 days 2−yr house price change
Delinquency Vs. House Price Change
Fixed Rate Home Mortgage Loans, Low FICOs
Percent Pre−Paid and Delinquent within 24 MonthsBy Origination Year
28

Figure 6:
020
4060
8010
0m
ortg
age
rate
dec
linin
g, p
erce
nt
010
2030
4050
6070
pre−
paid
, per
cent
2001 2002 2003 2004 2005 2006 2007 2008
pre−paid mortgage rate decliningmortgage rate declining: percent of mortgages with higher current rate than market rate anytime within 24 months
Pre−Payment Vs. Mortgage Rate Declining
−30
−20
−10
010
2030
402−
yr h
ouse
pric
e ch
ange
, per
cent
010
2030
4050
6070
pre−
paid
, per
cent
2001 2002 2003 2004 2005 2006 2007 2008
pre−paid 2−yr house price change
Pre−Payment Vs. House Price Change
020
4060
8010
0m
ortg
age
rate
dec
linin
g, p
erce
nt
010
2030
past
due
>=60
day
s, p
erce
nt
2001 2002 2003 2004 2005 2006 2007 2008
past due>=60 days mortgage rate decliningmortgage rate declining: percent of mortgages with higher current rate than market rate anytime within 24 months
Delinquency Vs. Mortgage Rate Declining
−30
−20
−10
010
2030
402−
yr h
ouse
pric
e ch
ange
, per
cent
010
2030
past
due
>=60
day
s, p
erce
nt
2001 2002 2003 2004 2005 2006 2007 2008
past due>=60 days 2−yr house price change
Delinquency Vs. House Price Change
Fixed Rate Home Mortgage Loans, High FICOs
Percent Pre−Paid and Delinquent within 24 MonthsBy Origination Year
29

Figure 7:
020
4060
8010
0m
ortg
age
rate
dec
linin
g, p
erce
nt
010
2030
4050
6070
pre−
paid
, per
cent
2001 2002 2003 2004 2005 2006 2007 2008
pre−paid mortgage rate decliningmortgage rate declining: percent of mortgages with higher current rate than market rate anytime within 24 months
Pre−Payment Vs. Mortgage Rate Declining
−30
−20
−10
010
2030
402−
yr h
ouse
pric
e ch
ange
, per
cent
010
2030
4050
6070
pre−
paid
, per
cent
2001 2002 2003 2004 2005 2006 2007 2008
pre−paid 2−yr house price change
Pre−Payment Vs. House Price Change
020
4060
8010
0m
ortg
age
rate
dec
linin
g, p
erce
nt
010
2030
past
due
>=60
day
s, p
erce
nt
2001 2002 2003 2004 2005 2006 2007 2008
past due>=60 days mortgage rate decliningmortgage rate declining: percent of mortgages with higher current rate than market rate anytime within 24 months
Delinquency Vs. Mortgage Rate Declining
−30
−20
−10
010
2030
402−
yr h
ouse
pric
e ch
ange
, per
cent
010
2030
past
due
>=60
day
s, p
erce
nt
2001 2002 2003 2004 2005 2006 2007 2008
past due>=60 days 2−yr house price change
Delinquency Vs. House Price Change
Adjustable Rate Home Mortgage Loans, Low FICOs
Percent Pre−Paid and Delinquent within 24 MonthsBy Origination Year
30

Figure 8:
020
4060
8010
0m
ortg
age
rate
dec
linin
g, p
erce
nt
010
2030
4050
6070
pre−
paid
, per
cent
2001 2002 2003 2004 2005 2006 2007 2008
pre−paid mortgage rate decliningmortgage rate declining: percent of mortgages with higher current rate than market rate anytime within 24 months
Pre−Payment Vs. Mortgage Rate Declining
−30
−20
−10
010
2030
402−
yr h
ouse
pric
e ch
ange
, per
cent
010
2030
4050
6070
pre−
paid
, per
cent
2001 2002 2003 2004 2005 2006 2007 2008
pre−paid 2−yr house price change
Pre−Payment Vs. House Price Change
020
4060
8010
0m
ortg
age
rate
dec
linin
g, p
erce
nt
010
2030
past
due
>=60
day
s, p
erce
nt
2001 2002 2003 2004 2005 2006 2007 2008
past due>=60 days mortgage rate decliningmortgage rate declining: percent of mortgages with higher current rate than market rate anytime within 24 months
Delinquency Vs. Mortgage Rate Declining
−30
−20
−10
010
2030
402−
yr h
ouse
pric
e ch
ange
, per
cent
010
2030
past
due
>=60
day
s, p
erce
nt
2001 2002 2003 2004 2005 2006 2007 2008
past due>=60 days 2−yr house price change
Delinquency Vs. House Price Change
Adjustable Rate Home Mortgage Loans, High FICOs
Percent Pre−Paid and Delinquent within 24 MonthsBy Origination Year
31

Figure 9:
0.1
5.3
.45
500 600 700 800fico_orig_new
mean delinquency rate Fitted values
20010
.15
.3.4
5
500 600 700 800fico_orig_new
mean delinquency rate Fitted values
2002
0.1
5.3
.45
500 600 700 800fico_orig_new
mean delinquency rate Fitted values
2003
0.1
5.3
.45
500 600 700 800fico_orig_new
mean delinquency rate Fitted values
2004
0.1
5.3
.45
500 600 700 800fico_orig_new
mean delinquency rate Fitted values
2005
0.1
5.3
.45
500 600 700 800fico_orig_new
mean delinquency rate Fitted values
2006
0.1
5.3
.45
500 600 700 800fico_orig_new
mean delinquency rate Fitted values
2007
0.1
5.3
.45
500 600 700 800fico_orig_new
mean delinquency rate Fitted values
2008
By FICO and Origination Year
Fixed Rate Home MortgagesDelinquent Within 24 Months
32

Figure 10:
0.1
5.3
.45
500 600 700 800fico_orig_new
mean delinquency rate Fitted values
20010
.15
.3.4
5
500 600 700 800fico_orig_new
mean delinquency rate Fitted values
2002
0.1
5.3
.45
500 600 700 800fico_orig_new
mean delinquency rate Fitted values
2003
0.1
5.3
.45
500 600 700 800fico_orig_new
mean delinquency rate Fitted values
2004
0.1
5.3
.45
500 600 700 800fico_orig_new
mean delinquency rate Fitted values
2005
0.1
5.3
.45
500 600 700 800fico_orig_new
mean delinquency rate Fitted values
2006
0.1
5.3
.45
500 600 700 800fico_orig_new
mean delinquency rate Fitted values
2007
0.1
5.3
.45
500 600 700 800fico_orig_new
mean delinquency rate Fitted values
2008
By FICO and Origination Year
Adjustable Rate Home MortgagesDelinquent Within 24 Months
33

Figure 11:
0.2
.4.6
.8
500 600 700 800fico_orig_new
mean refinance rate Fitted values
20010
.2.4
.6.8
500 600 700 800fico_orig_new
mean refinance rate Fitted values
2002
0.2
.4.6
.8
500 600 700 800fico_orig_new
mean refinance rate Fitted values
2003
0.2
.4.6
.8
500 600 700 800fico_orig_new
mean refinance rate Fitted values
2004
0.2
.4.6
.8
500 600 700 800fico_orig_new
mean refinance rate Fitted values
2005
0.2
.4.6
.8
500 600 700 800fico_orig_new
mean refinance rate Fitted values
2006
0.2
.4.6
.8
500 600 700 800fico_orig_new
mean refinance rate Fitted values
2007
0.2
.4.6
.8
500 600 700 800fico_orig_new
mean refinance rate Fitted values
2008
By FICO and Origination Year
Fixed Rate Home MortgagesPre−Paid Within 24 Months
34

Figure 12:
0.2
.4.6
.8
500 600 700 800fico_orig_new
mean refinance rate Fitted values
20010
.2.4
.6.8
500 600 700 800fico_orig_new
mean refinance rate Fitted values
2002
0.2
.4.6
.8
500 600 700 800fico_orig_new
mean refinance rate Fitted values
2003
0.2
.4.6
.8
500 600 700 800fico_orig_new
mean refinance rate Fitted values
2004
0.2
.4.6
.8
500 600 700 800fico_orig_new
mean refinance rate Fitted values
2005
0.2
.4.6
.8
500 600 700 800fico_orig_new
mean refinance rate Fitted values
2006
0.2
.4.6
.8
500 600 700 800fico_orig_new
mean refinance rate Fitted values
2007
0.2
.4.6
.8
500 600 700 800fico_orig_new
mean refinance rate Fitted values
2008
By FICO and Origination Year
Adjustable Rate Home MortgagesPre−Paid Within 24 Months
35

Figure 13:
0.06
0.08
0.1
0.12
0.14
0.16
Mortgage prepayment rate%
prediction
actual
0
0.02
0.04
0.06
Source: LPS Applied Analytics
36


