Event organized by the Council of the Americas in collaboration with the Asian Development Bank Institute and the Inter-American Development Bank
September 10, 2013, Washington D.C.
Presentation by Antoni Estevadeordal (Manager, Integration and Trade Sector, IDB)
and Masahiro Kawai (Dean and CEO, ADBI)
I. Dealing with a trade surge II. Boosting cross-regional investment
III. Emerging new regional and trans-pacific trade architecture
IV. Exploring cooperation opportunities
V. Conclusions
Outline

The Trade Surge

Asia’s share of LAC’s trade doubled in one decade
• Asia has become LAC’s second highest trading partner, behind the U.S. (35%)
• In 2012, Asia-LAC trade reached an estimated US$ 497 billion
1.6 2.4
4.2
7.6 8.1 8.8
10.4
20.8 22.1
1.1 2.3
4.2 4.1 3.8 2.7 2.4
4.4 4.8
0.0
5.0
10.0
15.0
20.0
25.0
1928 1953 1962 1972 1982 1992 2002 2010 2012
Asia's share of LAC trade LAC's share of Asia's trade
Asia's share of LAC trade is defined as: (LAC's imports from Asia + LAC's exports to Asia)/(LAC's imports from the world+LAC's exports to the world)
75 years 11 years
%
Asia’s Share of LAC’s Trade and LAC’s Share in Asian Trade

But trade is Concentrated in a Few Countries, with Some Important Imbalances
-100 -50 0 50 -100 -50 0 50
Mexico Colombia Argentina
Brazil Chile Peru
CA
Peru CA
Brazil Mexico
Colombia Argentina
Chile
Mexico Colombia
CA Argentina
Brazil Peru Chile
Mexico Colombia
Brazil CA
Peru Argentina
Chile
PRC India
Japan Republic of Korea
(%) (%)
Note: Red bars represent deficits for LAC countries. Blue bars are surpluses for Asian countries. Source: Own calculation with IMF-DOTS data..
Trade balances as % of bilateral trade, 2012.
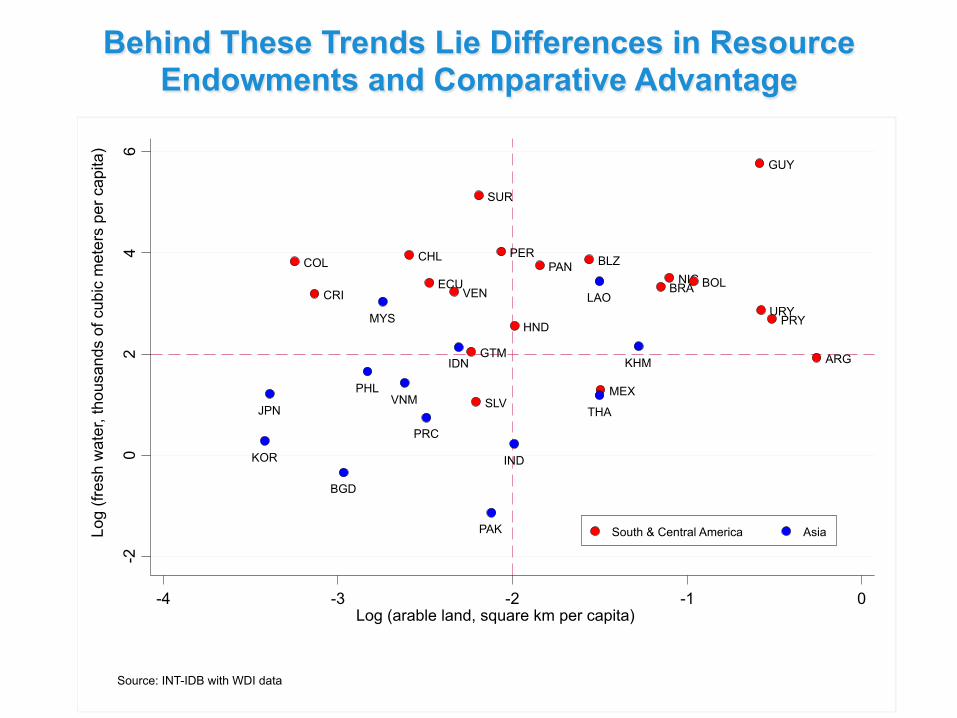
Behind These Trends Lie Differences in Resource Endowments and Comparative Advantage
COL CRI
CHL ECU
VEN
GTM SLV
SUR
PER
HND
PAN BLZ
MEX
BRA NIC BOL
GUY
URY PRY
ARG
KOR JPN
BGD
PHL
MYS
VNM PRC
IDN
PAK
IND
LAO
THA KHM
-2
0 2
4 6
Log
(fres
h w
ater
, tho
usan
ds o
f cub
ic m
eter
s pe
r cap
ita)
-4 -3 -2 -1 0 Log (arable land, square km per capita)
South & Central America Asia
Source: INT-IDB with WDI data
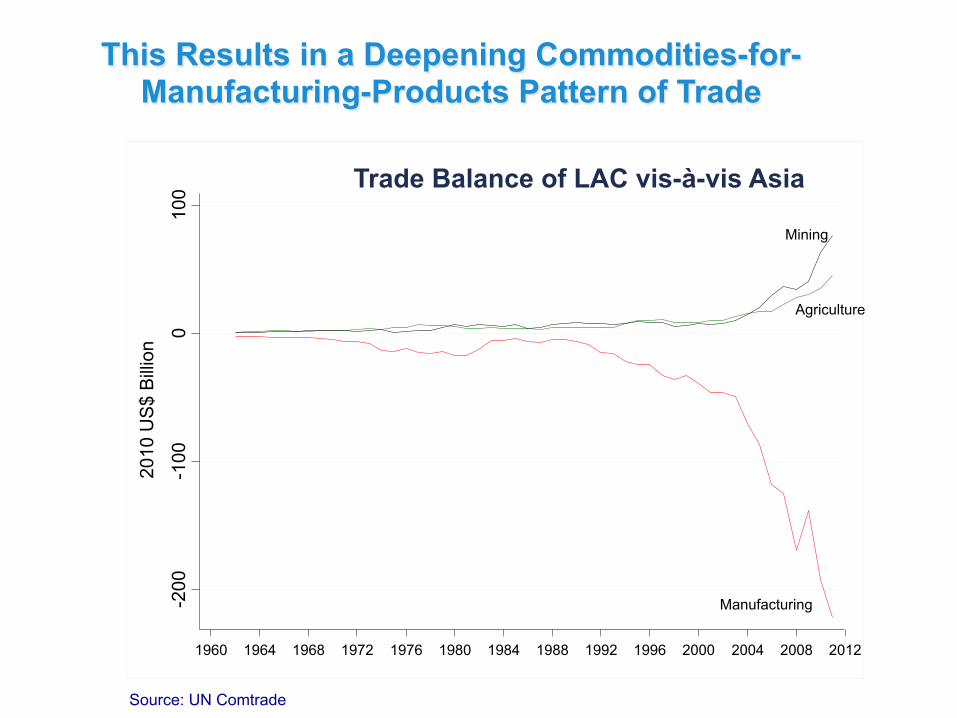
This Results in a Deepening Commodities-for- Manufacturing-Products Pattern of Trade
Mining
Agriculture
Manufacturing -200
-1
00
0 10
0 20
10 U
S$
Bill
ion
1960 1964 1968 1972 1976 1980 1984 1988 1992 1996 2000 2004 2008 2012
Trade Balance of LAC vis-à-vis Asia
Source: UN Comtrade

The commodities-for-manufacturing-goods trade is likely to remain at the core of the Asia-LAC relationship for decades. Yet, this does not mean there are no opportunities for diversification. For this, tariffs
and other trade costs need to come down.
Sector Caribbean C. America S. America Caribbean C. America S. America Caribbean C. America S. AmericaMining 0 2 1 0 2 1 8 4 4Agriculture 17 13 7 16 10 9 38 55 21Manufactures 5 8 7 5 6 5 11 17 13
Asia's tariffs on LAC's exports (%)ASEAN East Asia South Asia
Sector ASEAN East Asia South Asia ASEAN East Asia South Asia ASEAN East Asia South AsiaMining 7 5 6 4 5 4 6 6 4Agriculture 16 13 17 10 13 14 11 11 14Manufactures 10 11 17 6 7 10 8 11 15
LAC's tariffs on Asia's exports (%)Caribbean Central America South America
Note: ASEAN includes Cambodia, Indonesia, Laos, Malaysia, Philippines, Singapore, Vietnam, Thailand. East Asia: PRC, Japan, Republic of Korea and Taiwan South Asia: Bangladesh, India and Pakistan
Room for Reduction in Tariffs and Other Trade Costs
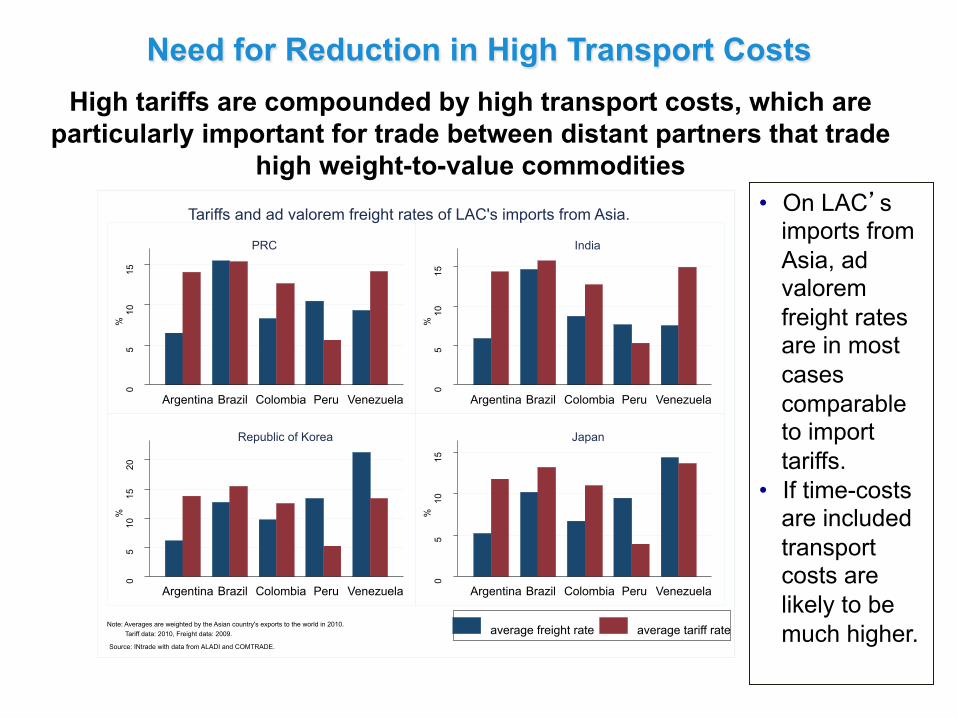
High tariffs are compounded by high transport costs, which are particularly important for trade between distant partners that trade
high weight-to-value commodities • On LAC’s
imports from Asia, ad valorem freight rates are in most cases comparable to import tariffs.
• If time-costs are included transport costs are likely to be much higher.
0 5
10
15
%
Argentina Brazil Colombia Peru Venezuela
PRC
0 5
10
15
%
Argentina Brazil Colombia Peru Venezuela
India
0 5
10
15
20
%
Argentina Brazil Colombia Peru Venezuela
Republic of Korea 0
5 10
15
%
Argentina Brazil Colombia Peru Venezuela
Japan
Tariffs and ad valorem freight rates of LAC's imports from Asia.
average freight rate average tariff rate Note: Averages are weighted by the Asian country's exports to the world in 2010. Source: INtrade with data from ALADI and COMTRADE.
Tariff data: 2010, Freight data: 2009.
Need for Reduction in High Transport Costs
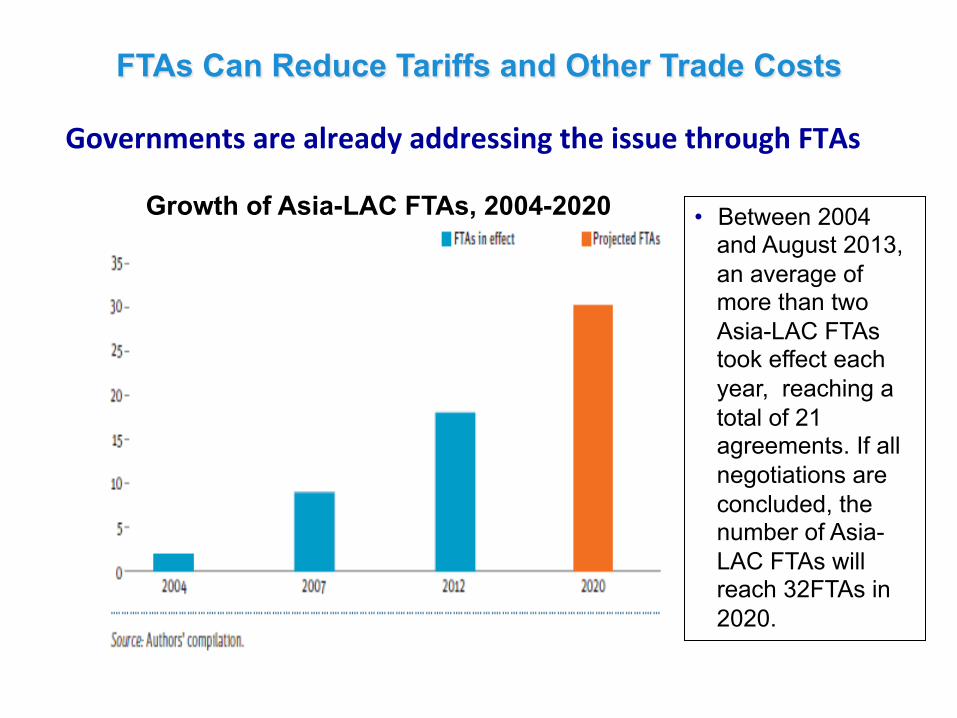
Governments are already addressing the issue through FTAs
• Between 2004 and August 2013, an average of more than two Asia-LAC FTAs took effect each year, reaching a total of 21 agreements. If all negotiations are concluded, the number of Asia-LAC FTAs will reach 32FTAs in 2020.
FTAs Can Reduce Tariffs and Other Trade Costs
Growth of Asia-LAC FTAs, 2004-2020
Some Governments Are More Proactive
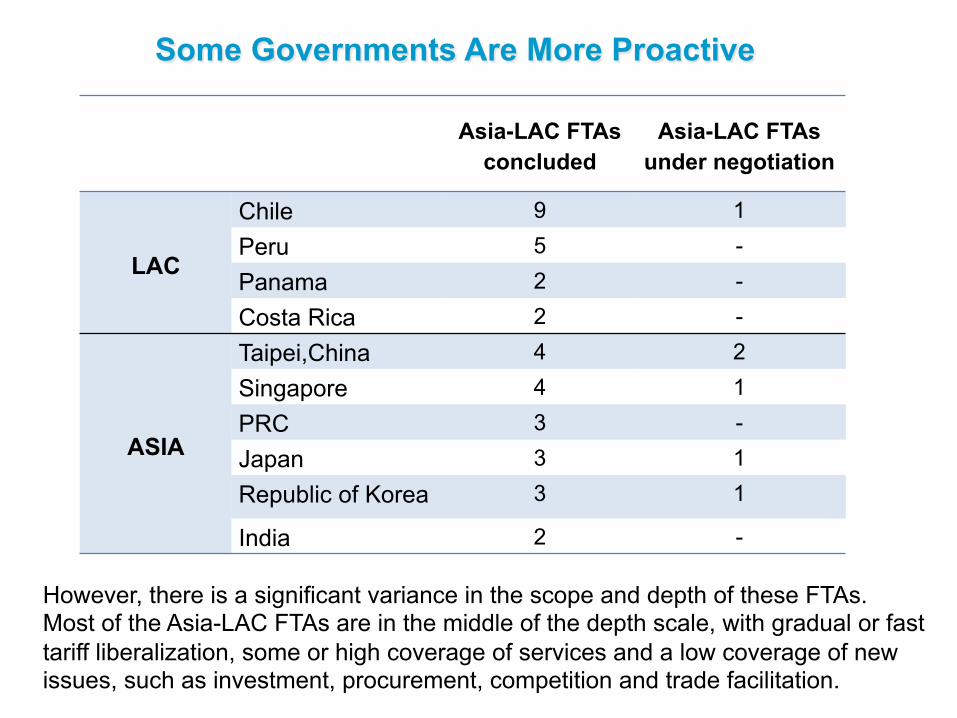
However, there is a significant variance in the scope and depth of these FTAs. Most of the Asia-LAC FTAs are in the middle of the depth scale, with gradual or fast tariff liberalization, some or high coverage of services and a low coverage of new issues, such as investment, procurement, competition and trade facilitation.
Asia-LAC FTAs
concluded Asia-LAC FTAs
under negotiation
LAC
Chile 9 1 Peru 5 - Panama 2 - Costa Rica 2 -
ASIA
Taipei,China 4 2 Singapore 4 1 PRC 3 - Japan 3 1 Republic of Korea 3 1
India 2 -
Boosting Cross-Regional Foreign Direct Investment

Robust Cross-Regional FDI Can Ease Some of the Trade Imbalances
Some good news on Asia’s side • Asia-Pacific’s greenfield investments in
LAC totaled 127 billion in 2003-2011. • But this still only amounts to 14% of LAC
inflows in the period.
LAC’s side has yet to reach a critical mass
• LAC’s greenfield investments in Asia in 2003-2011 amounted to only US$ 18 billion.
• This amounts to only 20% of the number of LAC’s investment projects abroad.
* 2011 data is only up to August.
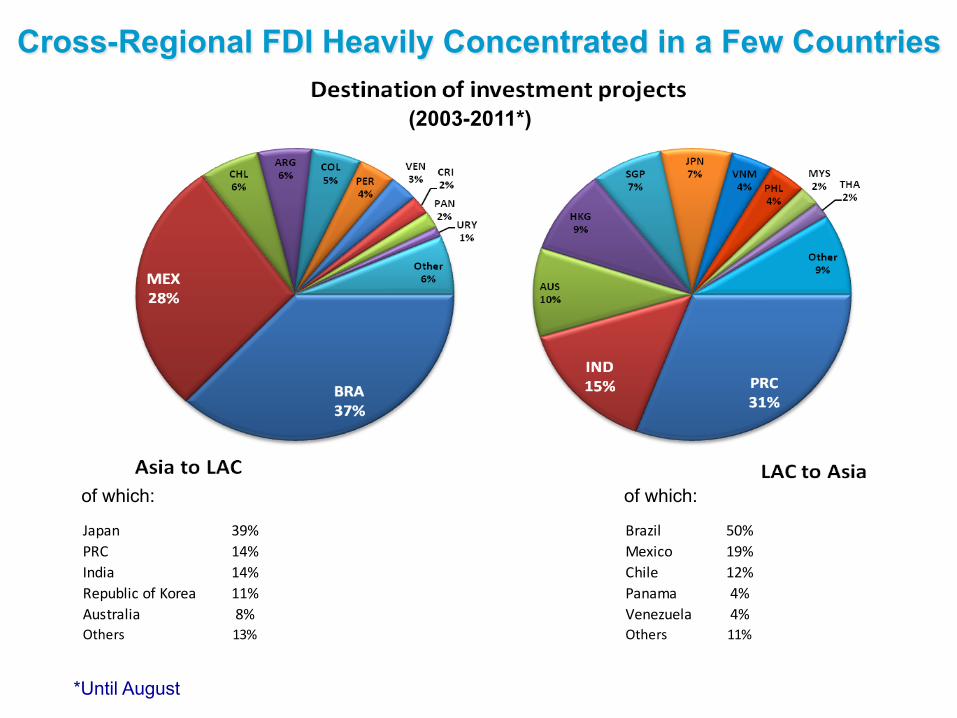
Cross-Regional FDI Heavily Concentrated in a Few Countries
of which: of which:
Japan 39%PRC 14%India 14%Republic of Korea 11%Australia 8%Others 13%
Brazil 50%Mexico 19%Chile 12%Panama 4%Venezuela 4%Others 11%
(2003-2011*)
*Until August

0
20
40
60
80
100
2004 2005 2006 2007 2008 2009 2010 2011* 2012* $U
S billion
s
FDI from Japan, PRC, and Republic of Korea in LAC (stock)
0
200
400
600
800
1000
1200
2004 2005 2006 2007 2008 2009 2010 2011 2012
$US millions
FDI from LAC into Japan, PRC, and Republic of Korea (stock)
The view from official FDI statistics: strong
growth in both directions, but Asian
investment still dwarfs LAC investment
Sources: Japan JETRO, PRC MOFCOM, Republic of Korea Ex-Im Bank, and OECD Statistics; *Data for PRC outward investment in LAC for 2011 and 2012 are projections
FDI Rising, but with an Imbalance
Emerging New Regional and Trans-Pacific Trade
Architecture

LAC Active in Forging FTAs since the 1990s
0
5
10
15
20
25
30 Argen2
na
Bolivia
Brazil
Chile
Colombia
Costa Rica
Dominican Rep
ublic
Ecuado
r
Guatem
ala
Hond
uras
Mexico
Nicaragua
Panama
Peru
Paraguay
El Salvado
r
Uruguay
Vene
zuela
Number of concluded FTAs by country in LAC
2000 Concluded FTAs 2013 Concluded FTAs
Note: Concluded FTAs include those that are in effect as well as those that have been signed but are not yet in effect. Source: IDB INTrade

Number of concluded FTAs by country in Asia
Note: Concluded FTAs include those that are in effect as well as those that have been signed but are not yet in effect.
Source: ADB’s Asia Regional Integration Center (ARIC) FTA Database (www.aric.adb.org), data as of April 2013. 18
Asia a Latecomer to FTAs, but Rapid Spread Recently
0
5
10
15
20
25
Japan
PRC
Korea, Rep
. of
Hong Kon
g
Taipei,China
Brun
ei Darussalam
Cambo
dia
Indo
nesia
Lao PD
R
Malaysia
Myanm
ar
Philipp
ines
Singapore
Thailand
Viet Nam
India
2000 Concluded FTAs 2013 Concluded FTAs

• Though a latecomer, the number of FTAs in Asia increased from 3 to 71 between 2000 to 2013
• With Doha Development Round stalled, FTAs have brought net benefits for LAC and Asian economies & businesses
• However, the spread of FTAs has also posed several challenges: 1. Increasing use of FTA preferences 2. Tackling the risk of LAC “spaghetti bowl” & Asian “noodle bowl” 3. Promoting comprehensive coverage of agricultural trade 4. Facilitating services-trade liberalization 5. Increasing WTO-plus elements
• To resolve these concerns, innovative policy options are needed
Slide 19
LAC and Asian FTAs Spreading, but Many Challenges
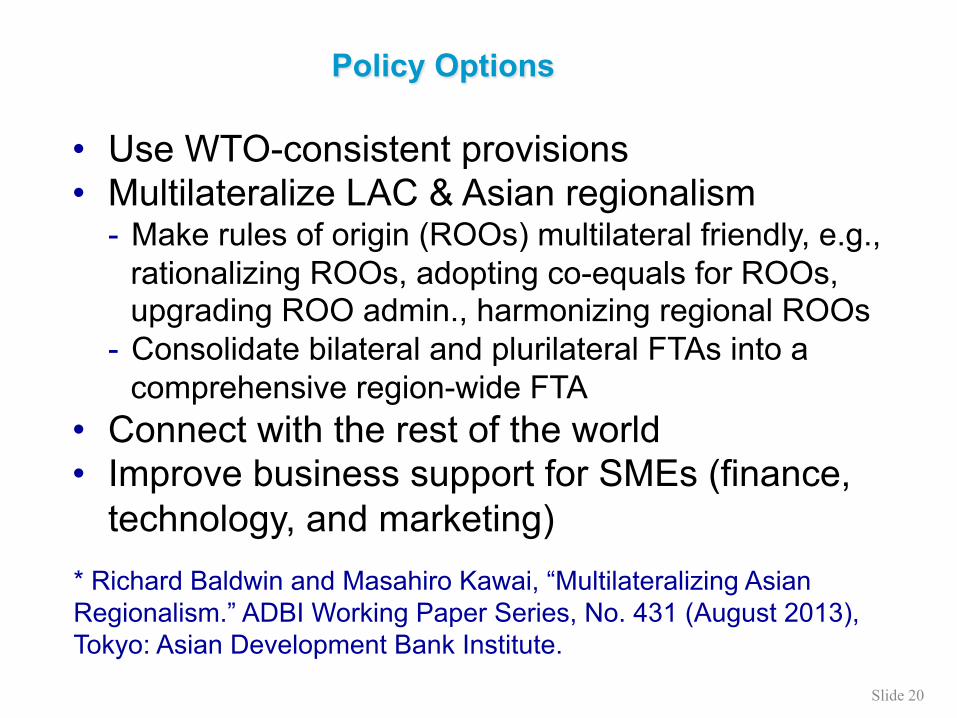
• Use WTO-consistent provisions • Multilateralize LAC & Asian regionalism
- Make rules of origin (ROOs) multilateral friendly, e.g., rationalizing ROOs, adopting co-equals for ROOs, upgrading ROO admin., harmonizing regional ROOs
- Consolidate bilateral and plurilateral FTAs into a comprehensive region-wide FTA
• Connect with the rest of the world • Improve business support for SMEs (finance,
technology, and marketing) * Richard Baldwin and Masahiro Kawai, “Multilateralizing Asian Regionalism.” ADBI Working Paper Series, No. 431 (August 2013), Tokyo: Asian Development Bank Institute.
Slide 20
Policy Options
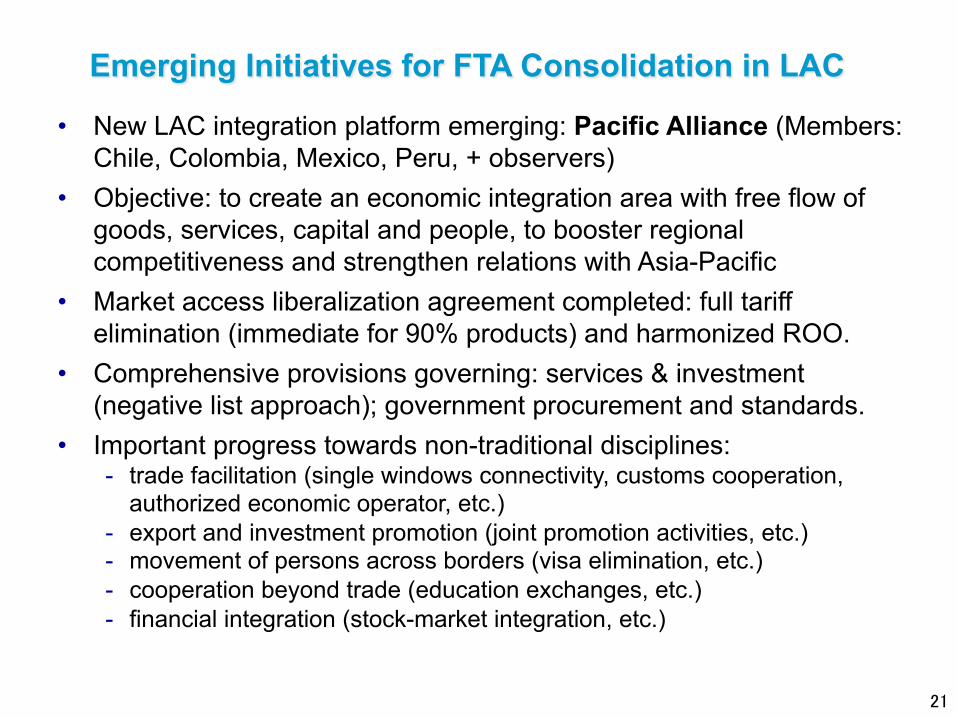
• New LAC integration platform emerging: Pacific Alliance (Members: Chile, Colombia, Mexico, Peru, + observers)
• Objective: to create an economic integration area with free flow of goods, services, capital and people, to booster regional competitiveness and strengthen relations with Asia-Pacific
• Market access liberalization agreement completed: full tariff elimination (immediate for 90% products) and harmonized ROO.
• Comprehensive provisions governing: services & investment (negative list approach); government procurement and standards.
• Important progress towards non-traditional disciplines: - trade facilitation (single windows connectivity, customs cooperation,
authorized economic operator, etc.) - export and investment promotion (joint promotion activities, etc.) - movement of persons across borders (visa elimination, etc.) - cooperation beyond trade (education exchanges, etc.) - financial integration (stock-market integration, etc.)
21
Emerging Initiatives for FTA Consolidation in LAC
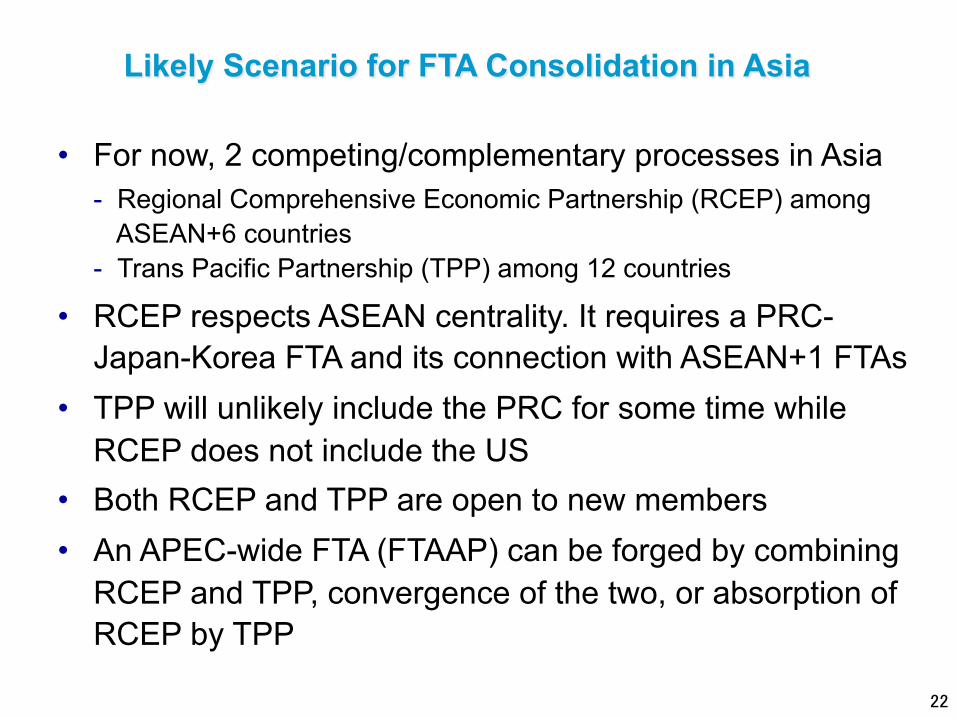
• For now, 2 competing/complementary processes in Asia - Regional Comprehensive Economic Partnership (RCEP) among
ASEAN+6 countries - Trans Pacific Partnership (TPP) among 12 countries
• RCEP respects ASEAN centrality. It requires a PRC-Japan-Korea FTA and its connection with ASEAN+1 FTAs
• TPP will unlikely include the PRC for some time while RCEP does not include the US
• Both RCEP and TPP are open to new members • An APEC-wide FTA (FTAAP) can be forged by combining
RCEP and TPP, convergence of the two, or absorption of RCEP by TPP
22
Likely Scenario for FTA Consolidation in Asia

• RCEP – Negotiations launched in November 2012 and expected to be
completed by the end of 2015 – Focus: goods trade, services trade, and investment – Common tariff tables for each country – Special and differential treatment of developing countries
• TPP – Negotiations to expanded P-4 membership started in March
2010 – Comprehensive coverage of new trade issues e.g. intellectual
property, government procurement, competition, labour and the environment
– Bilateral tariff tables, potentially 66 in total – High degree of openness and hence limited membership
• Both are building blocs for an APEC Free Trade Area
Slide 23
RCEP and TPP – Salient Feature
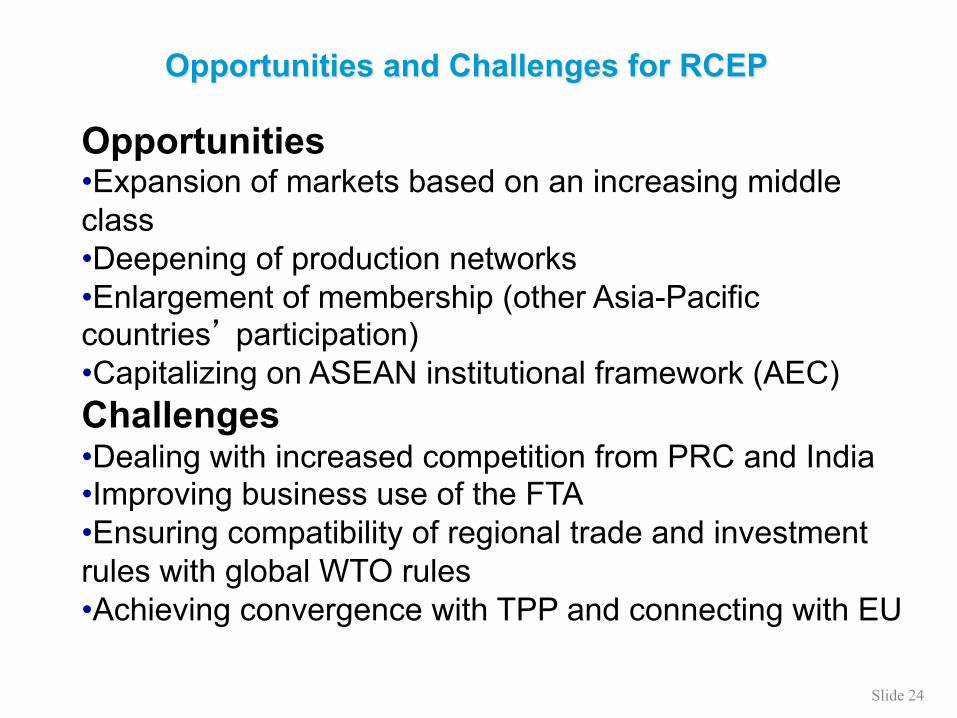
Opportunities • Expansion of markets based on an increasing middle class • Deepening of production networks • Enlargement of membership (other Asia-Pacific countries’ participation) • Capitalizing on ASEAN institutional framework (AEC) Challenges • Dealing with increased competition from PRC and India • Improving business use of the FTA • Ensuring compatibility of regional trade and investment rules with global WTO rules • Achieving convergence with TPP and connecting with EU
Slide 24
Opportunities and Challenges for RCEP
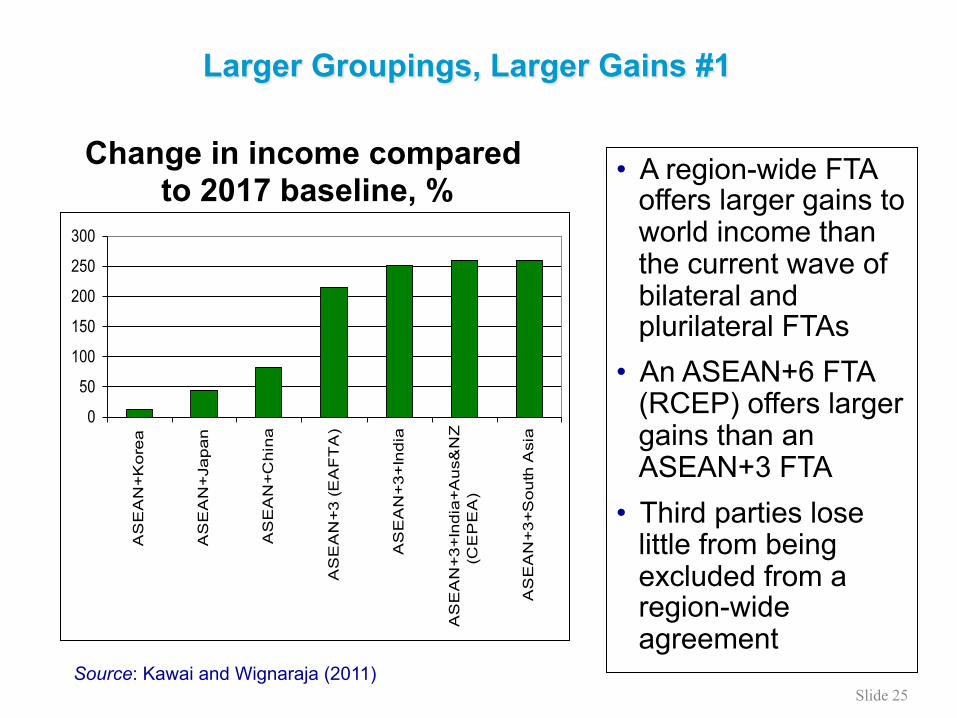
Change in income compared to 2017 baseline, % • A region-wide FTA
offers larger gains to world income than the current wave of bilateral and plurilateral FTAs
• An ASEAN+6 FTA (RCEP) offers larger gains than an ASEAN+3 FTA
• Third parties lose little from being excluded from a region-wide agreement
Source: Kawai and Wignaraja (2011)
0
50
100
150
200
250
300
AS
EA
N+
Ko
rea
AS
EA
N+
Jap
an
AS
EA
N+
Ch
ina
AS
EA
N+
3 (
EA
FT
A)
AS
EA
N+
3+
Ind
ia
AS
EA
N+
3+
Ind
ia+
Au
s&N
Z(C
EP
EA
)
AS
EA
N+
3+
So
uth
Asi
a
Slide 25
Larger Groupings, Larger Gains #1
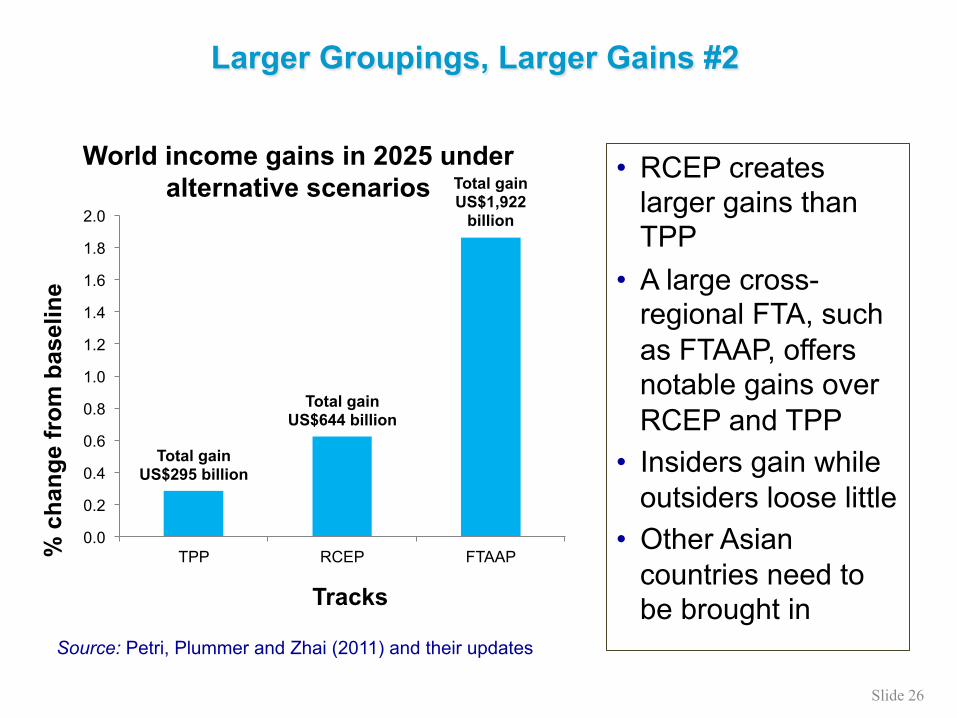
Total gain US$295 billion
Total gain US$644 billion
Total gain US$1,922
billion
0.0
0.2
0.4
0.6
0.8
1.0
1.2
1.4
1.6
1.8
2.0
TPP RCEP FTAAP % c
hang
e fr
om b
asel
ine
Tracks
World income gains in 2025 under alternative scenarios
• RCEP creates larger gains than TPP
• A large cross-regional FTA, such as FTAAP, offers notable gains over RCEP and TPP
• Insiders gain while outsiders loose little
• Other Asian countries need to be brought in
Source: Petri, Plummer and Zhai (2011) and their updates
Slide 26
Larger Groupings, Larger Gains #2

Exploring Cooperation Opportunities
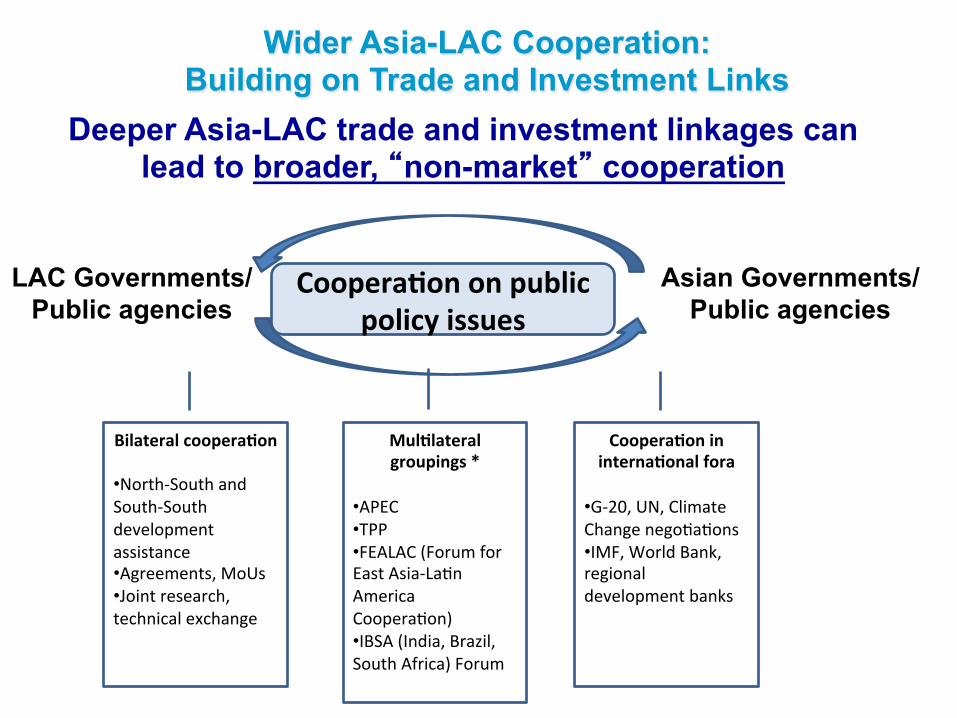
Wider Asia-LAC Cooperation: Building on Trade and Investment Links
Deeper Asia-LAC trade and investment linkages can lead to broader, “non-market” cooperation
MulKlateral groupings *
• APEC • TPP • FEALAC (Forum for East Asia-‐La2n America Coopera2on) • IBSA (India, Brazil, South Africa) Forum
CooperaKon in internaKonal fora
• G-‐20, UN, Climate Change nego2a2ons • IMF, World Bank, regional development banks
Bilateral cooperaKon
• North-‐South and South-‐South development assistance • Agreements, MoUs • Joint research, technical exchange
CooperaKon on public policy issues
LAC Governments/ Public agencies
Asian Governments/ Public agencies

• Traditional trade agreements have provided the basis for concrete cooperation in wider policy areas, such as visa procedures and data privacy, education and human resource development, agriculture, and science and technology
• These occurred through bilateral agreements such as the Japan-Mexico EPA, as well as regional forums like APEC
• Key motivation for cooperation is the presence of complementarities
• Possible areas for more cooperation where there are clear synergies between trade and cooperation include: – Infrastructure connectivity to promote trade and investment – Behind-the-border policy issues including trade facilitation – Poverty reduction, disaster response, climate change, financial
regulation – Global dialogue
Trade Agreements can be a Stepping Stone to Broader Cooperation

• Asia and LAC can strengthen cooperation through joint work between the two regions’multilateral institutions such as the ADB and IDB
• The two banks are working together under a formal partnership; ADB and IDB Presidents have signed agreements to support sustainable, low-carbon transport, and to share access to trade finance programs that link more than 100 financial institutions to support trade between the two regions
• The two banks are well positioned to facilitate exchanges and knowledge sharing among policymakers, academics and businesses from the two regions on a wide set of issues, particularly for cross-regional cooperation and on key global issues
Leverage Regional Multilateral Institutions

Conclusions

Bringing trade costs down and boosting investment and cooperation is key to maintain the momentum
• Despite a substantial rise in Asia-LAC trade and investment, trade is concentrated on a few countries and, on LAC exports side, on a few commodities. Asia-LAC trade imbalances have developed
• Cross-regional FDI has been growing, particularly on the Asian side, but it is still lagging behind trade
• To promote balanced and diversified relationship and cross-regional FDI, high trade costs and high barriers to investment can be reduced through cross-regional bilateral FTAs and the broader initiatives led by APEC and the Trans-Pacific Partnership
• Mega regional FTAs (RCEP in Asia and Pacific Alliance in LAC) can set conditions for a more ambitious cross-regional FTA, i.e., FTAAP
• Global recovery from the global financial crisis could be slow, putting constraints on Asia-LAC trade and investment. But the two regions can overcome this by deepening the relationship through FTAs and wider cooperation on technological & development experiences and on others, and by coordinating interests in the international arena

Event organized by the Council of the Americas in collaboration with the Asian Development Bank Institute and the Inter-American Development Bank
September 10, 2013, Washington D.C.
Presentation by Antoni Estevadeordal (Manager, Integration and Trade Sector, IDB) and
Masahiro Kawai (Dean and CEO, ADBI)


