Presentation for 1-on-1 meetingsNovember 2020
Pure Minerals for Healthy Lives
Phosagro | Pure Minerals for Healthy Lives 2
These materials have been prepared by PJSC PhosAgro (PhosAgro) solely for your information and may not be copied, reproduced, retransmitted or further distributed, directly or indirectly, by any recipient to any other person or published, in whole or in part, for any purpose or under any circumstances.
These materials have not been independently verified. All information presented or contained in this presentation is subject to verification, correction, completion and change without notice. None of PhosAgro nor any other person undertakes any obligation to amend, correct or update this presentation or to provide the recipient with access to any additional information that may arise in connection with it.
These materials may contain projections and other forward-looking statements regarding future events or the future financial performance of PhosAgro. You can identify forward-looking statements by terms such as “expect,” “believe,” “estimate,” “intend,” “will,” “could,” “may” or “might”, or other similar expressions. PhosAgro cautions you that these statements are only statements regarding PhosAgro's intentions, beliefs or current expectations concerning, among other things, its results of operations, financial condition, liquidity, prospects, growth, strategies and the fertilizer and mining industry and are based on numerous assumptions and accordingly actual events or results may differ materially. PhosAgro will not update these statements to reflect events and circumstances occurring after the date hereof. Factors that could cause the actual results to differ materially from those contained in projections or forward-looking statements of PhosAgro may include, among others, general economic and competitive environment conditions in the markets in which PhosAgro operates, market change in the fertilizer and mining industries, as well as many other risks affecting PhosAgro and its operations. Past performance should not be taken as an indication or guarantee of future results, and no representation or warranty, express or implied, is made regarding future performance.
These materials do not constitute or form part of any advertisement of securities, any offer or invitation to sell or issue or any solicitation of any offer to purchase or subscribe for, any securities of PhosAgro in any jurisdiction, nor shall they or any part of them nor the fact of their presentation, communication or distribution form the basis of, or be relied on in connection with, any contract or investment decision. No representation or warranty, express or implied, is given by PhosAgro, its affiliates or any of their respective advisers, officers, employees or agents, as to the accuracy, completeness or fairness of the information or opinions or for any loss howsoever arising, directly or indirectly, from any use of these materials or their contents. The merit and suitability of any investment in PhosAgro should be independently evaluated and any person considering such an investment in PhosAgro is advised to obtain independent advice as to the legal, tax, accounting, financial, credit and other related advice prior to making an investment.
By accepting a copy of these materials, you agree to be bound by the foregoing limitations.
DISCLAIMER

PhosAgro at glance
Position in Russia
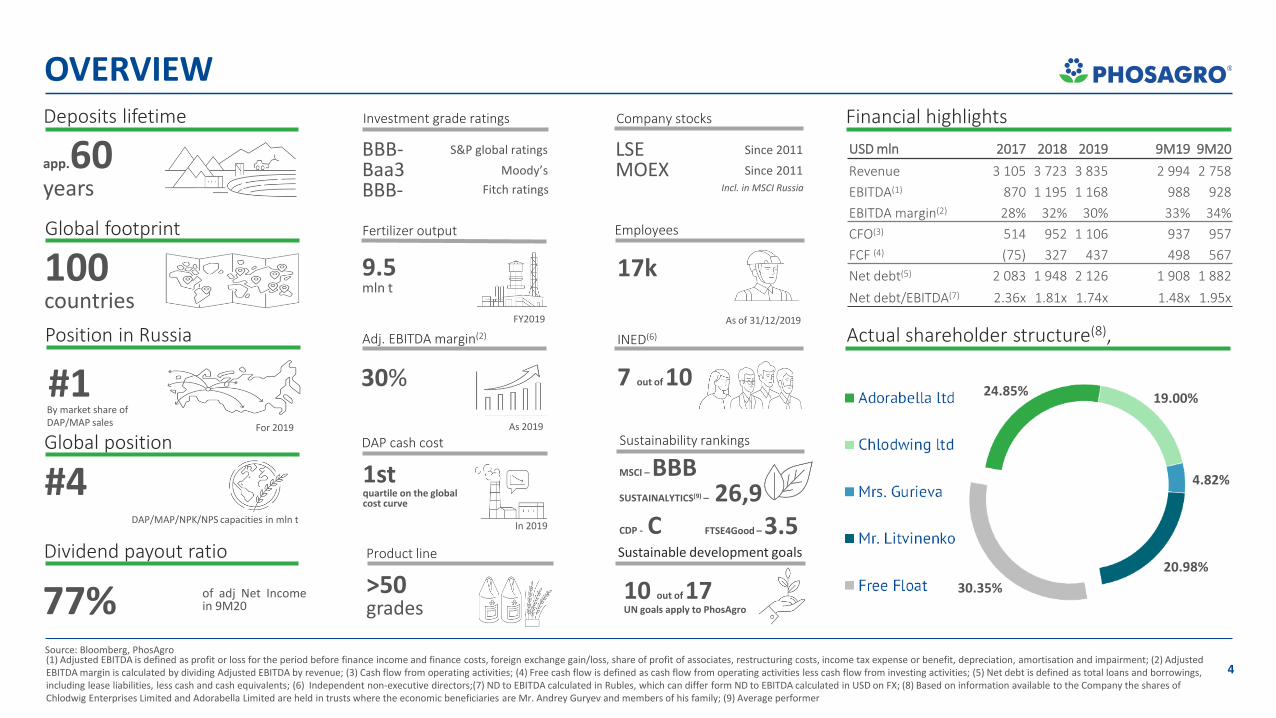
#1By market share of DAP/MAP sales
DAP/MAP/NPK/NPS capacities in mln t
Global position
#4
100countries
Global footprint
DAP cash cost
In 2019
OVERVIEW
Actual shareholder structure(8),
Financial highlights
Source: Bloomberg, PhosAgro
9.5mln t
Fertilizer output
17k
Employees
INED(6)
7 out of 10
Deposits lifetime
app.60years
BBB-Baa3BBB-
Investment grade ratings
S&P global ratings
Moody’s
Fitch ratings
30%
Adj. EBITDA margin(2)
>50grades
Product line
LSEMOEX
Company stocks
Since 2011
Since 2011
USD mln 2017 2018 2019 9M19 9M20
Revenue 3 105 3 723 3 835 2 994 2 758
EBITDA(1) 870 1 195 1 168 988 928
EBITDA margin(2) 28% 32% 30% 33% 34%
CFO(3) 514 952 1 106 937 957
FCF (4) (75) 327 437 498 567
Net debt(5) 2 083 1 948 2 126 1 908 1 882
Net debt/EBITDA(7) 2.36x 1.81x 1.74x 1.48x 1.95х
As 2019
Incl. in MSCI Russia
(1) Adjusted EBITDA is defined as profit or loss for the period before finance income and finance costs, foreign exchange gain/loss, share of profit of associates, restructuring costs, income tax expense or benefit, depreciation, amortisation and impairment; (2) Adjusted EBITDA margin is calculated by dividing Adjusted EBITDA by revenue; (3) Cash flow from operating activities; (4) Free cash flow is defined as cash flow from operating activities less cash flow from investing activities; (5) Net debt is defined as total loans and borrowings, including lease liabilities, less cash and cash equivalents; (6) Independent non-executive directors;(7) ND to EBITDA calculated in Rubles, which can differ form ND to EBITDA calculated in USD on FX; (8) Based on information available to the Company the shares of Chlodwig Enterprises Limited and Adorabella Limited are held in trusts where the economic beneficiaries are Mr. Andrey Guryev and members of his family; (9) Average performer
As of 31/12/2019FY2019
1stquartile on the globalcost curve
Sustainable development goals
Sustainability rankings
10 out of17UN goals apply to PhosAgro
MSCI – BBBSUSTAINALYTICS(9) – 26,9CDP - C
For 2019
Dividend payout ratio
77% of adj Net Incomein 9M20
4
24.85% 19.00%
4.82%
20.98%
30.35%
FTSE4Good – 3.5
China
USA
Morocco
S. Arabia
Other
0
10
20
30
40
50
20 25 30 35 40 45
Cad
miu
m c
on
ten
t, p
pm
Content of P2O5,%
(1) Defined as phosphate rock with P2O5 content of not less than 35.7 per cent. by production volume worldwide, according to the IFA(2) In accordance with JORC code (01.01.2018), measured by SPK Consulting(3) Includes DAP/MAP/NPS/NPK
(4) As of 31/12/2019(5) Jordan Phosphate Mines Company(6) Guizhou Phosphate Chemical Group (Kailin+Wengfu)
#1 GLOBAL PRODUCER OF HIGH GRADE PHOSPHATE ROCK
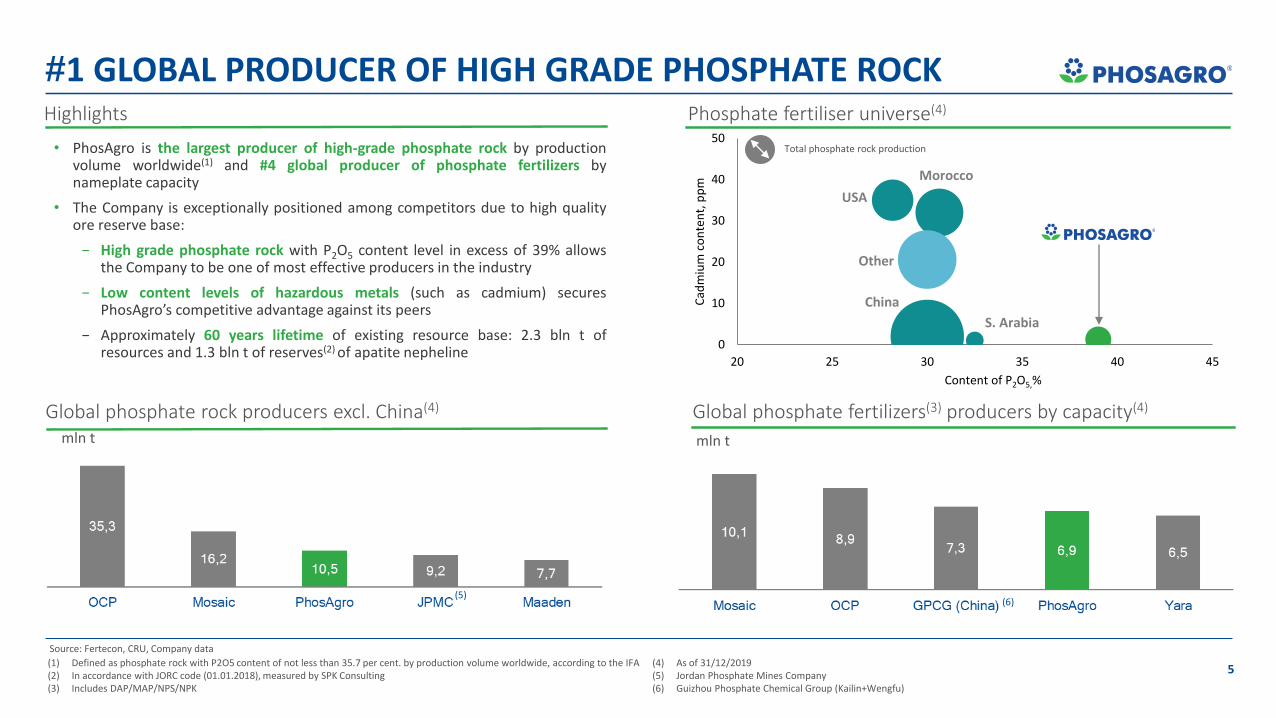
• PhosAgro is the largest producer of high-grade phosphate rock by productionvolume worldwide(1) and #4 global producer of phosphate fertilizers bynameplate capacity
• The Company is exceptionally positioned among competitors due to high qualityore reserve base:
− High grade phosphate rock with P2O5 content level in excess of 39% allowsthe Company to be one of most effective producers in the industry
− Low content levels of hazardous metals (such as cadmium) securesPhosAgro’s competitive advantage against its peers
− Approximately 60 years lifetime of existing resource base: 2.3 bln t ofresources and 1.3 bln t of reserves(2) of apatite nepheline
Global phosphate rock producers excl. China(4)
Phosphate fertiliser universe(4)
Total phosphate rock production
Global phosphate fertilizers(3) producers by capacity(4)
mln tmln t
Source: Fertecon, CRU, Company data
Highlights
(6)(5)
5
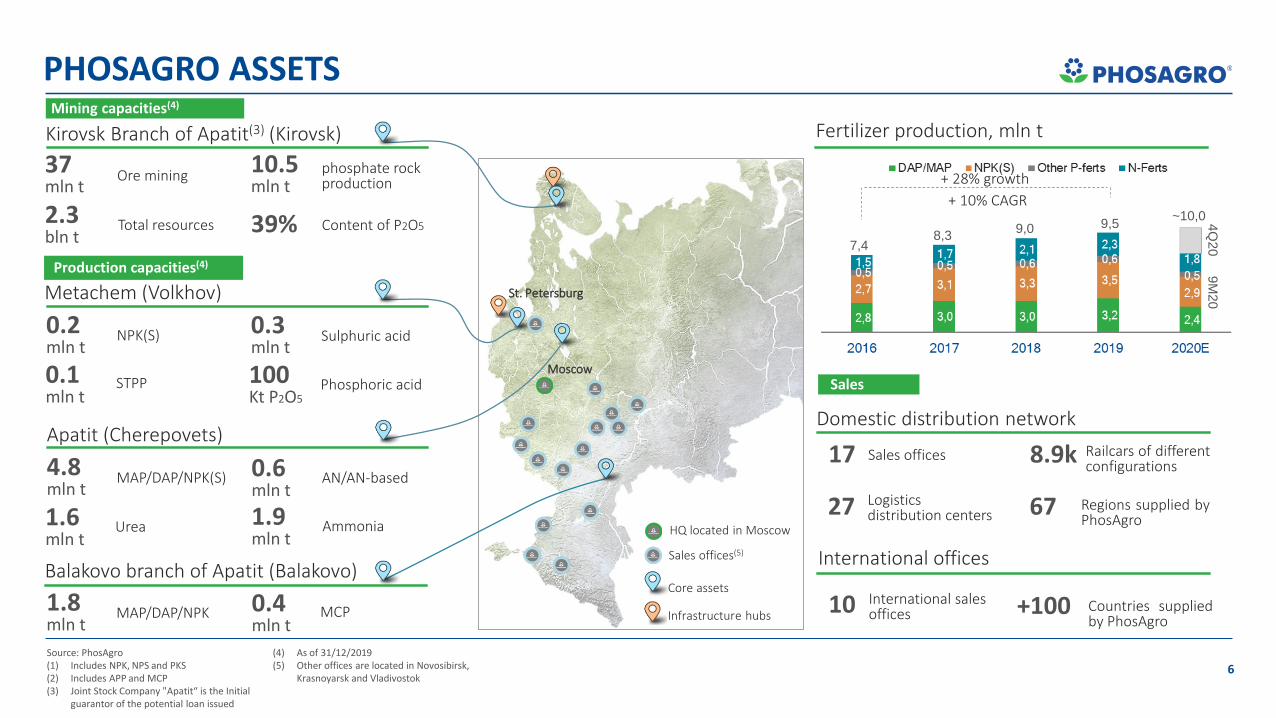
Balakovo branch of Apatit (Balakovo)
1.8mln t
MAP/DAP/NPK 0.4mln t
MCP
PHOSAGRO ASSETS
Source: PhosAgro(1) Includes NPK, NPS and PKS(2) Includes APP and MCP(3) Joint Stock Company "Apatit“ is the Initial
guarantor of the potential loan issued
(4) As of 31/12/2019(5) Other offices are located in Novosibirsk,
Krasnoyarsk and Vladivostok
Kirovsk Branch of Apatit(3) (Kirovsk)
37mln t
Ore mining10.5mln t
phosphate rockproduction
2.3bln t
Total resources
International offices
10 International salesoffices +100 Countries supplied
by PhosAgro
Domestic distribution network
17 Sales offices
27 Logisticsdistribution centers
8.9k Railcars of differentconfigurations
67
Mining capacities(4)
Production capacities(4)
Sales
HQ located in Moscow
Sales offices(5)
Core assets
Infrastructure hubs
39% Content of P2O5
Metachem (Volkhov)
0.2mln t
NPK(S)
0.1mln t
STPP
0.3mln t
Sulphuric acid
100Kt P2O5
Phosphoric acid
Apatit (Cherepovets)
4.8mln t
MAP/DAP/NPK(S)
1.6mln t
Urea
0.6mln t
AN/AN-based
1.9mln t
Ammonia
Moscow
St. Petersburg
Fertilizer production, mln t
Regions supplied byPhosAgro
6
+ 28% growth
+ 10% CAGR
9M
20
4Q
207,4
8,39,0 9,5
~10,0
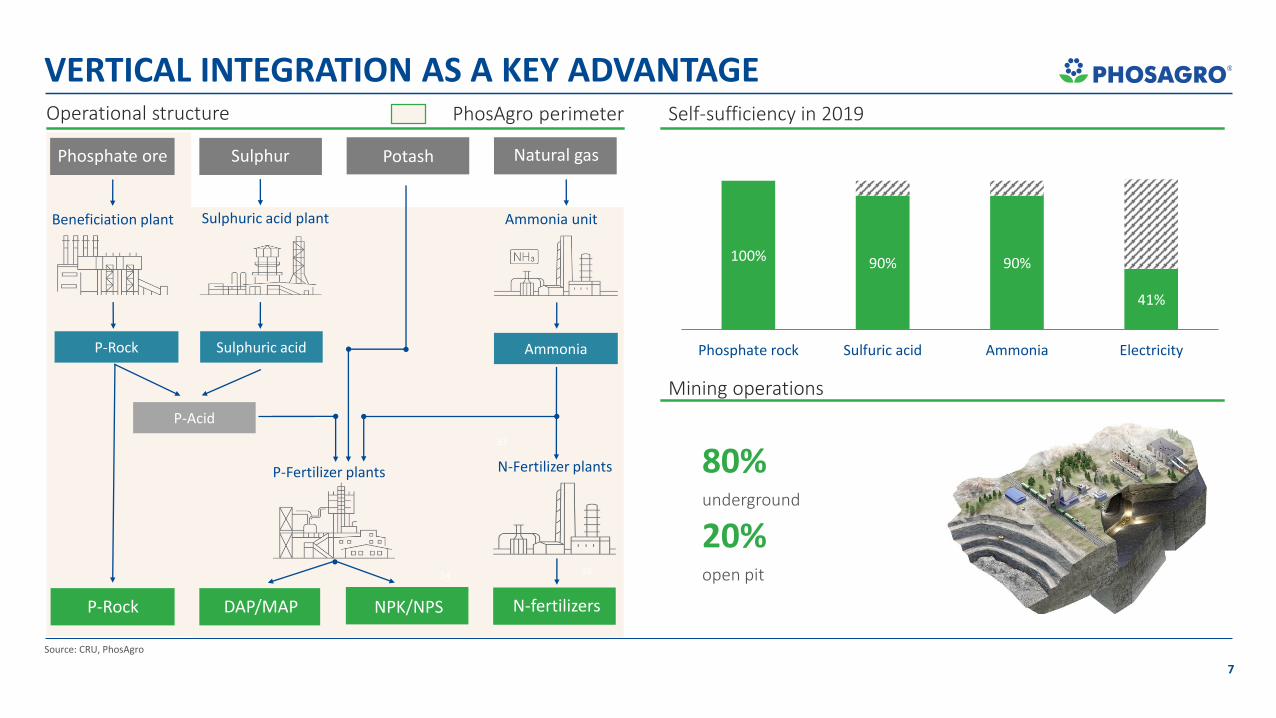
Operational structure Self-sufficiency in 2019
Source: CRU, PhosAgro
Beneficiation plant
Potash
P-Rock
Sulphur
Sulphuric acid plant Ammonia unit
Natural gasSulphurPhosphate ore
P-Fertilizer plants
NPK/NPS N-fertilizersDAP/MAPP-Rock
P-Acid
N-Fertilizer plants
Sulphuric acid Ammonia
PhosAgro perimeter
33
3624
80% underground
20% open pit
41%
90%90%100%
ElectricityAmmoniaSulfuric acidPhosphate rock
Mining operations
VERTICAL INTEGRATION AS A KEY ADVANTAGE
7

GLOBAL FOOTPRINT WITH DIVERSIFIED PRODUCT PORTFOLIO
Source: PhosAgro
Russia fertilizer sales, mln t Export fertilizer sales, mln t
Access to markets Global footprint
+ 108% growth
+ 13% CAGR
PhosAgro sales
Other regions
Net fertilizer exporters
2540+39
Fertilizer grades
+ 51% growth
+ 7% CAGR
8

CORPORATE GOVERNANCEBOARD OF DIRECTORS EXPERIENCE
Andrey G GuryevDeputy Chairman
Sven OmbudstvedtChairman of the Strategy Committee// Chairman of the Risk management Committee
Andrey A Guryev Chief Executive Officer
James Rogers Chairman of the Remuneration and HR Committee
Mikhail RybnikovChairman of the Environmental, Health and Safety Committee
Xavier Robert Rolet KBEChairman
Irina Bokova Chairman of the Sustainable Development Committee
Andrey SharonovNon-Executive Director
Natalia PashkevichNon-Executive Director
Marcus Rhodes Chairman of the Audit Committee
Independent Directors
Executive Directors
HIGHLIGHTS
10DIRECTORS
7INED
6COMMITTEES
5COMMITTEES ARE CHAIRED BY INED
Source: PhosAgro
9

Strategic focus on ESG & UN Sustainable Development Goals
10
PhosAgro directly contribute to 11 SDGs
Company has been recognized as a Global Compact LEAD
PhpsAgro is a first Russian company selected as strategic partner of FAO on implementation of Sustainable Soil Management Initiative
PhosAgro initiated with UNESCO and IUPAC «GreenChemistry for Life» grant programme for young scientists
PhosAgro carries out joint agricultural research with RussianAcademy of Science and Universities and with foreignresearch institutions (University of Milan, Adam MickiewiczUniversity in Poznań, Rothamsted Research)
Source: PhosAgro
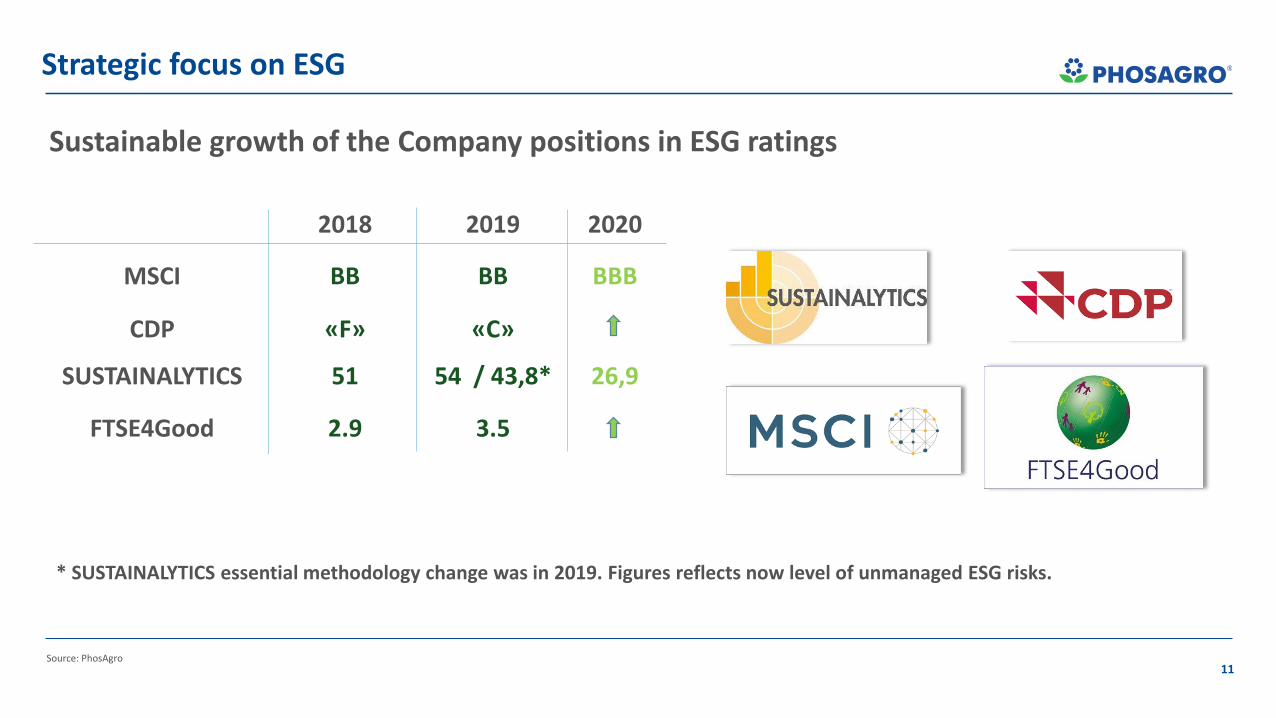
Strategic focus on ESG
11
2018 2019 2020
MSCI ВВ ВВ BBB
CDP «F» «С»
SUSTAINALYTICS 51 54 / 43,8* 26,9
FTSE4Good 2.9 3.5
Sustainable growth of the Company positions in ESG ratings
* SUSTAINALYTICS essential methodology change was in 2019. Figures reflects now level of unmanaged ESG risks.
Source: PhosAgro

ESG PRIORITIES
Source: PhosAgro
1. LTIFR 0.75 (per 1 million working hours)
2. Employee loyalty and satisfaction index is 57 %
3. Average annual number of education hours peremployee up to 82
4. Safety Culture Transformation Project started in2020.
12
2018 2019 Goal 2025
Air emissions, kg/ton 1,048 0,888 0,800
GHG emissions, kg/ton 157,973 143,27 142,1
Wastewater discharges, m3/ton
6,039 4,684 4,4
Waste recycling, % 26,8 34,5 40,0
Environmental performance OHS and Social performance
1. In 2019, PhosAgro’s production facilities were 41% self-sufficient in electricity.
2. In 2020 PhosAgro developed an Energy Efficiency Program focused on efficient use and renewable energy generation and use.
1. PhosAgro submitted CDP report and was rated «С» in 2019.
2. In 2020 Company developed a Climate Strategy with climate related risks assessment and mitigation action plan and low carbon transition plan.
Climate change Energy efficiency
Fertilizer Industry

14
FERTILIZER PRICE PERFORMANCE, FOB BALTICS (USD/T)
Source: CRU/FW, Fertecon, Argus, Green Markets, Prophecy, PhosAgro
India accelerated import amid slowramp up of new capacities at Ma’adenand OCP
Ramp up of new capacities atMa’aden and OCP sites/ flood in theUSA/slow domestic demand in China
Capacities cut in Morocco, N. America, China
10 year high affordability Mosaic petition filed to ITC
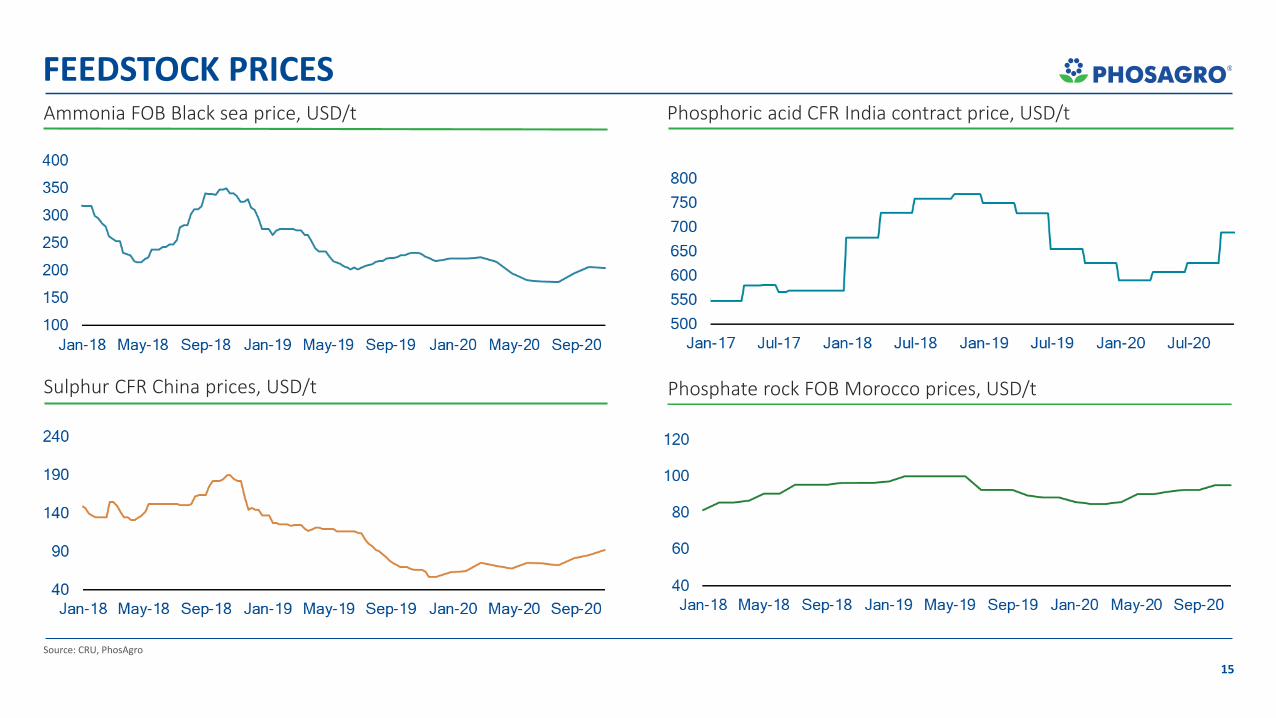
Sulphur CFR China prices, USD/t
Ammonia FOB Black sea price, USD/t
Phosphate rock FOB Morocco prices, USD/t
Phosphoric acid CFR India contract price, USD/t
15
Source: CRU, PhosAgro
FEEDSTOCK PRICES
0
100
200
300
400
500
600
0 5 000 10 000 15 000 20 000 25 000 30 000 35 000 40 000 45 000 50 000 55 000
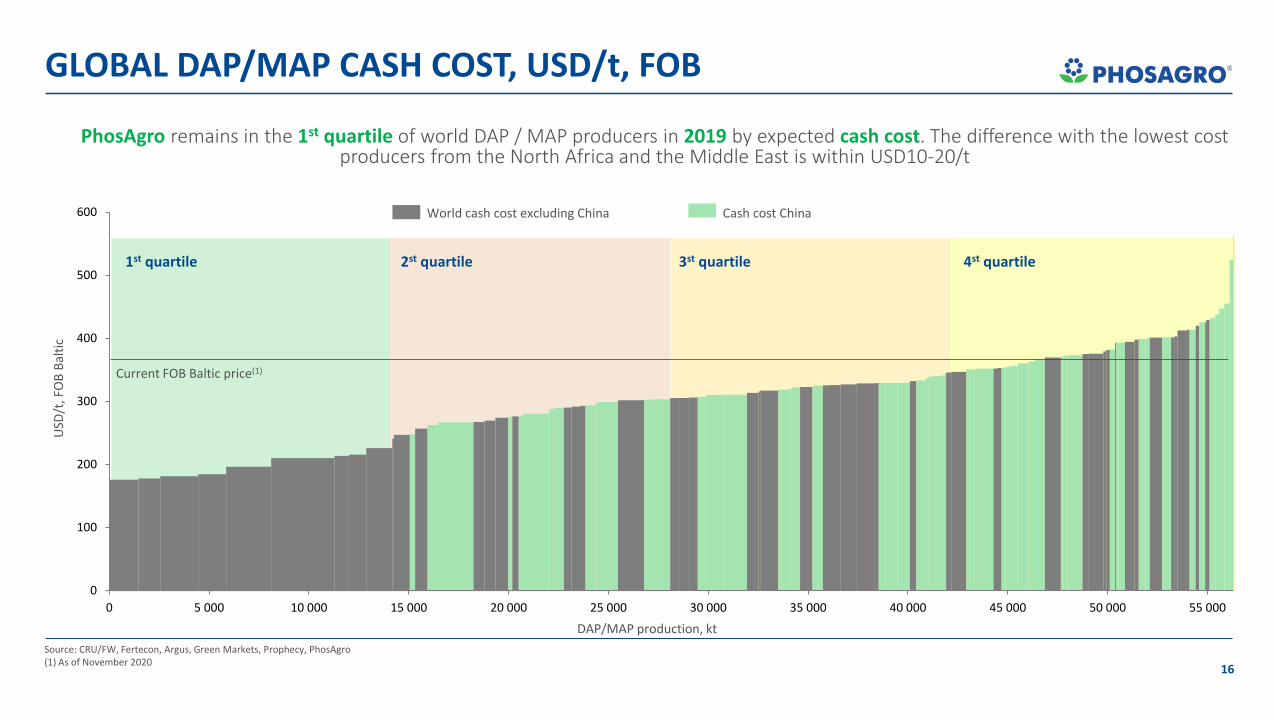
Source: CRU/FW, Fertecon, Argus, Green Markets, Prophecy, PhosAgro(1) As of November 2020
World cash cost excluding China
DAP/MAP production, kt
USD
/t, F
OB
Bal
tic
Cash cost China
Current FOB Baltic price(1)
1st quartile 2st quartile 3st quartile 4st quartile
PhosAgro remains in the 1st quartile of world DAP / MAP producers in 2019 by expected cash cost. The difference with the lowest cost producers from the North Africa and the Middle East is within USD10-20/t
GLOBAL DAP/MAP CASH COST, USD/t, FOB
16
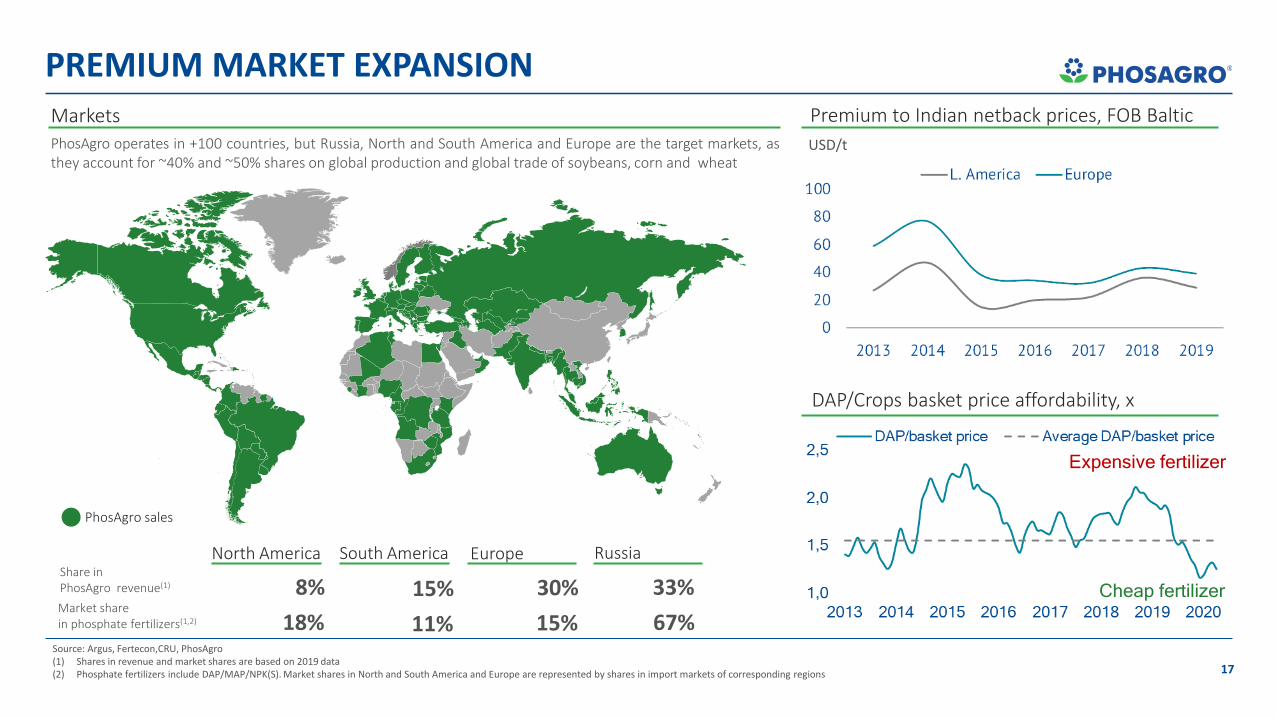
Premium to Indian netback prices, FOB BalticMarketsPhosAgro operates in +100 countries, but Russia, North and South America and Europe are the target markets, asthey account for ~40% and ~50% shares on global production and global trade of soybeans, corn and wheat
DAP/Crops basket price affordability, x
PhosAgro sales
USD/t
Source: Argus, Fertecon,CRU, PhosAgro(1) Shares in revenue and market shares are based on 2019 data (2) Phosphate fertilizers include DAP/MAP/NPK(S). Market shares in North and South America and Europe are represented by shares in import markets of corresponding regions
RussiaShare inPhosAgro revenue(1)
Market share in phosphate fertilizers(1,2) 67%
33%
Europe
15%
30%
South America
11%
15%
North America
18%
8%
PREMIUM MARKET EXPANSION
17
Cheap fertilizer
Expensive fertilizer
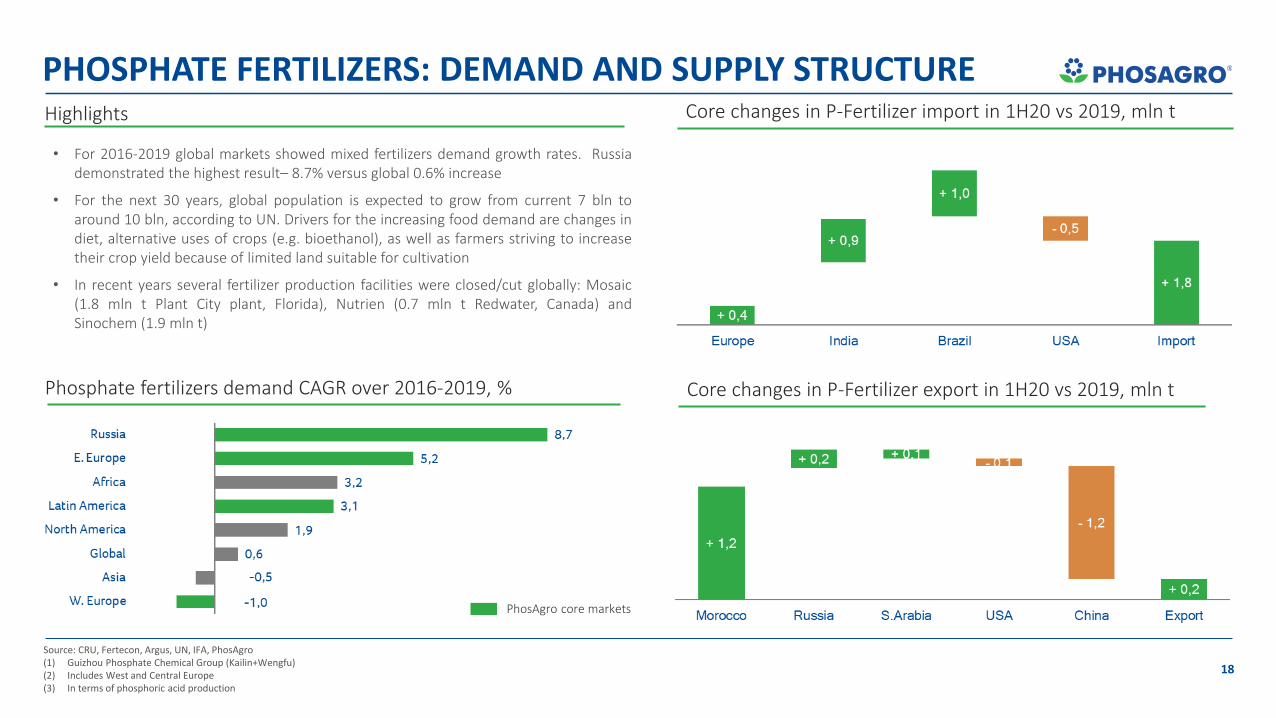
Phosphate fertilizers demand CAGR over 2016-2019, %
Core changes in P-Fertilizer import in 1H20 vs 2019, mln t
18
PHOSPHATE FERTILIZERS: DEMAND AND SUPPLY STRUCTURE
Source: CRU, Fertecon, Argus, UN, IFA, PhosAgro(1) Guizhou Phosphate Chemical Group (Kailin+Wengfu)(2) Includes West and Central Europe(3) In terms of phosphoric acid production
PhosAgro core markets
Core changes in P-Fertilizer export in 1H20 vs 2019, mln t
• For 2016-2019 global markets showed mixed fertilizers demand growth rates. Russiademonstrated the highest result– 8.7% versus global 0.6% increase
• For the next 30 years, global population is expected to grow from current 7 bln toaround 10 bln, according to UN. Drivers for the increasing food demand are changes indiet, alternative uses of crops (e.g. bioethanol), as well as farmers striving to increasetheir crop yield because of limited land suitable for cultivation
• In recent years several fertilizer production facilities were closed/cut globally: Mosaic(1.8 mln t Plant City plant, Florida), Nutrien (0.7 mln t Redwater, Canada) andSinochem (1.9 mln t)
Highlights

Strategic Developments
20
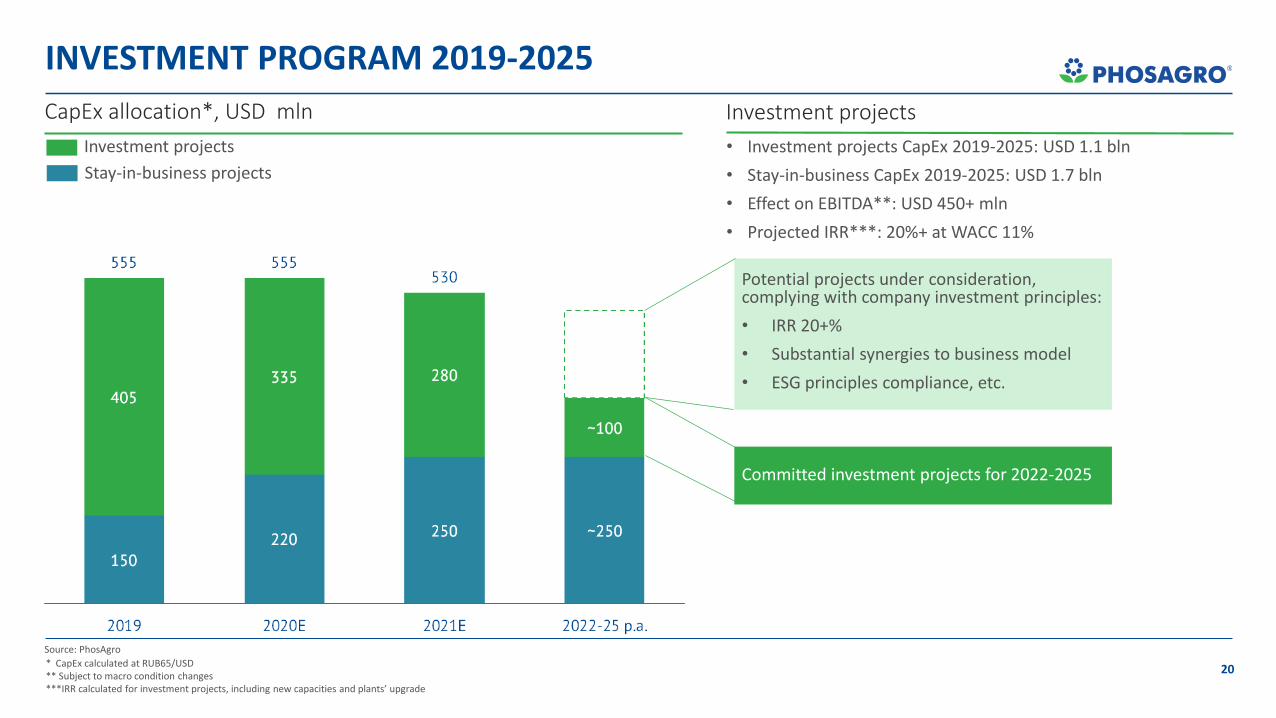
INVESTMENT PROGRAM 2019-2025
* CapEx calculated at RUB65/USD** Subject to macro condition changes***IRR calculated for investment projects, including new capacities and plants’ upgrade
Investment projects
Stay-in-business projects
Potential projects under consideration, complying with company investment principles:
• IRR 20+%
• Substantial synergies to business model
• ESG principles compliance, etc.
• Investment projects CapEx 2019-2025: USD 1.1 bln
• Stay-in-business CapEx 2019-2025: USD 1.7 bln
• Effect on EBITDA**: USD 450+ mln
• Projected IRR***: 20%+ at WACC 11%
Investment projectsCapEx allocation*, USD mln
Source: PhosAgro
Committed investment projects for 2022-2025

21
PRODUCTION GUIDANCE 2019-2025
Fertilizer production outlook, mln t Phosphate fertilizer production, mln t
Source: PhosAgro
+ 5% CAGR+ 25% growth
+ 5% CAGR
+ 25% growth
Phosphate rock output, mln t
+ 5% growth
Processing margin*, USD/ t of Ph-rock
NPK share will grow to 55%
*additional margin, that company expected to get from processing of Phrock into Fertilizers instead of selling it to 3rd
parties.“E” stands for Expected by Management team
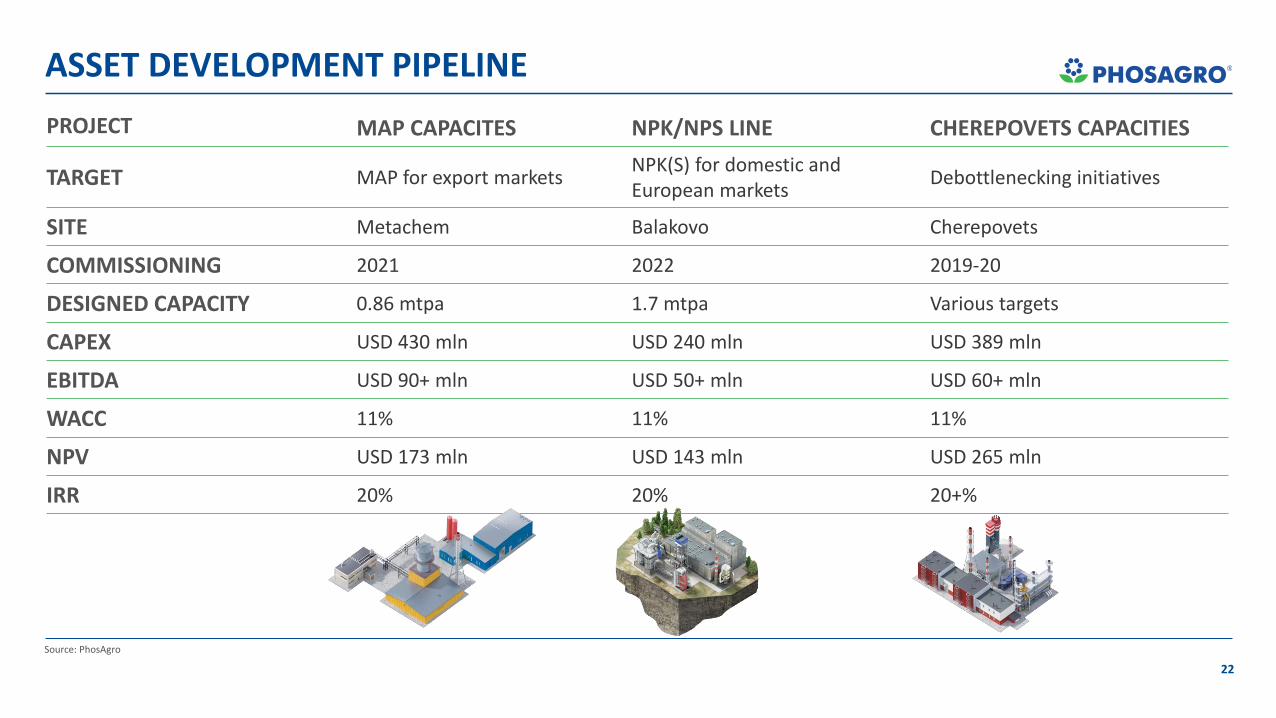
22
ASSET DEVELOPMENT PIPELINE
Source: PhosAgro
PROJECT MAP CAPACITES NPK/NPS LINE CHEREPOVETS CAPACITIES
TARGET MAP for export marketsNPK(S) for domestic and European markets
Debottlenecking initiatives
SITE Metachem Balakovo Cherepovets
COMMISSIONING 2021 2022 2019-20
DESIGNED CAPACITY 0.86 mtpa 1.7 mtpa Various targets
CAPEX USD 430 mln USD 240 mln USD 389 mln
EBITDA USD 90+ mln USD 50+ mln USD 60+ mln
WACC 11% 11% 11%
NPV USD 173 mln USD 143 mln USD 265 mln
IRR 20% 20% 20+%
Financial review

Sales breakdown, mln tonnes
Revenue by region Revenue by productRevenue dynamics, RUB bln
FX rates, RUB/USD
24
Source: PhosAgro
Fertilizer Industry Financial review Market outlook
REVENUE BREAKDOWN

25
THE MOST EFFICIENT COMPANY AMID MARKET HEADWINDSEBITDA and EBITDA margin for the last 7 years
EBITDA margin comparison in 2019
Source: PhosAgro
EBITDA margin comparison in 2018
EBITDA margin comparison in 9M20
Note: Peer group includes Mosaic, Nutrien, ICL, Yara, Ma’aden, Eurochem
PhosAgro has a proven track record as a sustainablyprofitable company in the industry, delivering leadingEBITDA margin performance throughout the cycle
Not reported yet
Not reported yet
Not reported yet
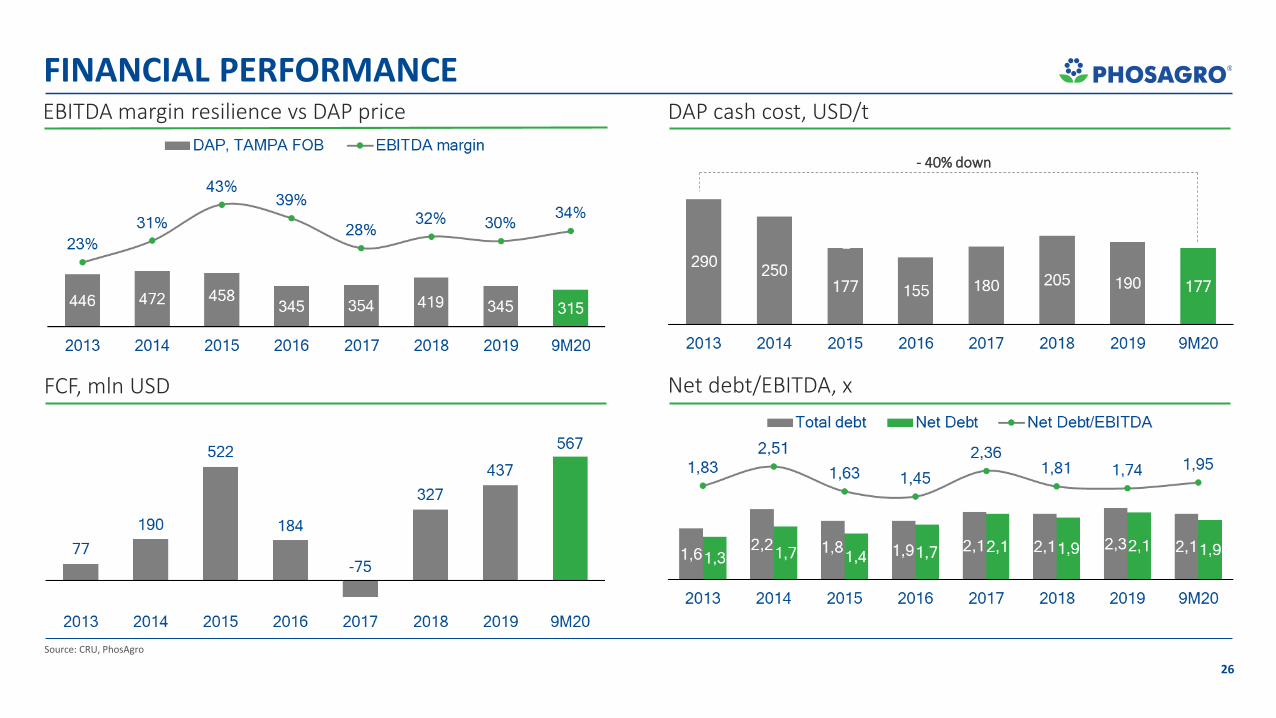
26
2
FINANCIAL PERFORMANCE
Source: CRU, PhosAgro
FCF, mln USD Net debt/EBITDA, x
DAP cash cost, USD/tEBITDA margin resilience vs DAP price
- 40% down

27
DEBT PROFILE
812
17
Source: PhosAgro(1) Includes interest payable (2) Short term debt is defined as debt with maturity less than 12 months, long-term debt – with maturity greater than 12 months
1 288
537553
Current credit rating:
BBB-Baa3BBB-
S&P global ratings
Moody’s
Fitch Ratings
Liquidity position Debt repayment schedule(1) as of 30/09/2020
LT
Debt maturity(2) Debt currency(3)
EURUSD
Debt type
Floating rateFixed rate
Ava
ilab
le c
red
it li
ne
sC
ash
ST
USD mln USD mln
636
28
Source: PhosAgroSource: PhosAgro
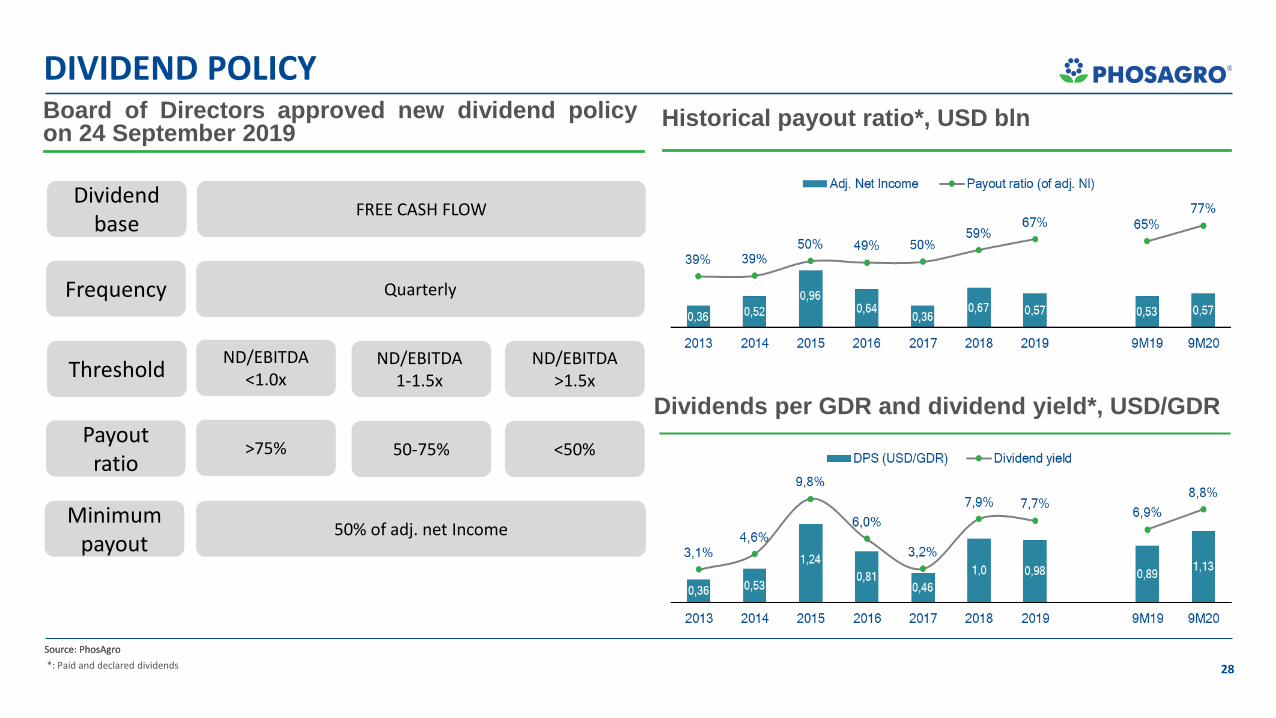
Historical payout ratio*, USD bln
FREE CASH FLOW
Quarterly
ND/EBITDA<1.0x
ND/EBITDA1-1.5x
ND/EBITDA>1.5x
>75% 50-75% <50%
50% of adj. net Income
Threshold
Dividend base
Frequency
Payout ratio
Minimum payout
Dividends per GDR and dividend yield*, USD/GDR
DIVIDEND POLICYBoard of Directors approved new dividend policyon 24 September 2019
*: Paid and declared dividends

Appendix
30
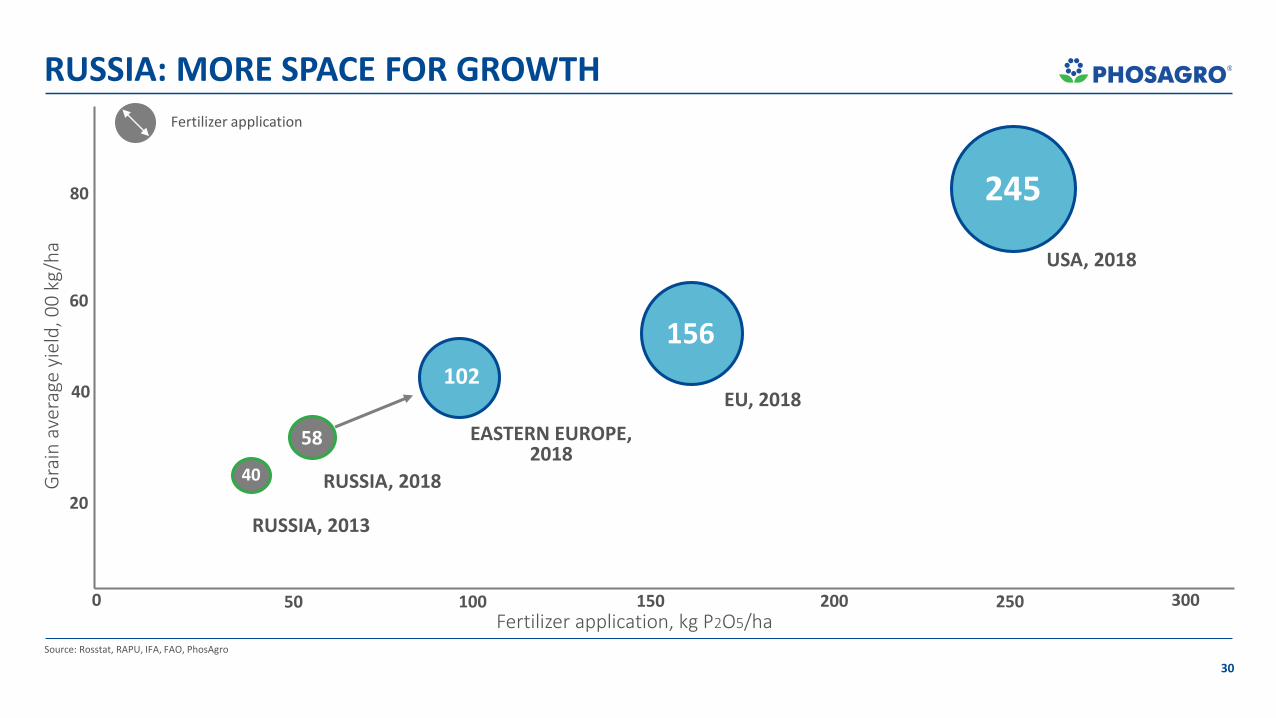
RUSSIA: MORE SPACE FOR GROWTH
40
RUSSIA, 2013
58
102
156
245
EASTERN EUROPE, 2018
RUSSIA, 2018
EU, 2018
USA, 2018
Gra
in a
vera
ge y
ield
, 00
kg
/ha
Fertilizer application, kg P2O5/ha0 50 100 150 200 250 300
Source: Rosstat, RAPU, IFA, FAO, PhosAgro
Fertilizer application
20
40
60
80

PhosAgro IR contact
Thank you!
Address: 55/1, Leninsky prospect, Bldg.1. Moscow, 119333, Russia
IR E-mail: [email protected]
Phone number: +7 495 232 96 89
www.phosagro.ru


