Presentation to the Allianz SE High Yield Group May 31, 2016
Michael McGillen David Hollander Kathy Mohanna Will Hasten
PRESENTATION TO THE ALLIANZ SE HIGH YIELD GROUP
1
Table of Contents Executive Summary ............................................................................................................................. 3
Company ................................................................................................................................................... 6
History & Business Description ............................................................................................... 6
Manufacturing Process & Value Chain ................................................................................. 9
Products ............................................................................................................................................... 9
Management .................................................................................................................................... 11
Shareholder Profile ..................................................................................................................... 13
Capital Structure ........................................................................................................................... 14
Recent Financial Performance .............................................................................................. 18
Segment Financial Analysis ..................................................................................................... 19
Industry .................................................................................................................................................. 22
Market Trends ............................................................................................................................... 22
Competitive Landscape ............................................................................................................. 26
SWOT Analysis ............................................................................................................................... 29
Valuation ................................................................................................................................................ 30
Discounted Cash Flow Analysis ............................................................................................. 30
Comparable Companies Analysis ......................................................................................... 31
Precedent Transactions Analysis ......................................................................................... 33
Historical Prices Analysis ........................................................................................................ 34
Sum-of-the-Parts Analysis ....................................................................................................... 35
Plan of Reorganization ................................................................................................................... 36
Key Challenges to Financial Restructuring ..................................................................... 36
Board Control ................................................................................................................................. 37
Operational Improvements .................................................................................................... 38
Acquisitions & Divestments .................................................................................................... 42
Capital Structure Reorganization ........................................................................................ 44
Recovery Analysis ........................................................................................................................ 47
Allianz Recovery Analysis ........................................................................................................ 49
Appendix ................................................................................................................................................ 50
Exhibit 1: Comparable Trading Multiples .......................................................................... 0
PRESENTATION TO THE ALLIANZ SE HIGH YIELD GROUP
2
Exhibit 2: Historical Financials – Income Statement .................................................... 1
Exhibit 3: Historical Financials – Balance Sheet ............................................................. 2
Exhibit 4: Historical Financials – Cash Flow Statement .............................................. 3
Exhibit 5: Projected Financials + Proposed Capital Structure................................. 4
Exhibit 6: Projected Financials + Proposed Capital Structure................................. 5
Exhibit 7: Projected Financials + Proposed Capital Structure................................. 6
Exhibit 8: Sum-of-the-parts Valuation .................................................................................. 7
Exhibit 9: Asset Waterfall in Bankruptcy............................................................................ 7
Exhibit 10: Pro-forma Balance Sheet following recapitalization ........................... 8
Exhibit 11: Pre-Restructuring Debt Repayment Schedule ........................................ 8
Exhibit 12: DCF Sensitivity ......................................................................................................... 9
PRESENTATION TO THE ALLIANZ SE HIGH YIELD GROUP
3
Executive Summary Cenveo Corporation (‘Cenveo’ or ‘the Company’) is a market-leading manufacturer
of envelopes, labels, and commercial print applications. Over the last ten years, it
has been beset by secular declines in nearly all of its businesses. As advertising
spend continues its shift toward digital customer acquisition, direct-mail-dependent
Cenveo has seen pricing and sales volumes worsen. It has attempted three re-
financings in six years and our analysis indicates a likely bankruptcy within three.
Negative revenue growth, untenable 8.7x EBITDA leverage, an ABL facility drawn
dangerously close to its $190mm limit, and $540mm of first-lien notes coming due
in 2019 all spell reorganization for the envelope giant.
There has been a growing trend among private equity and hedge funds with
appetites for equity-like risks/rewards to use debt as a way for acquiring control of
financially distressed companies. The most common approach is to acquire
discounted loans (e.g., second-lien loans, senior subordinated notes, etc.) in the
secondary market or by lending more money to the company to avoid bankruptcy.
Underlying the success of such strategies is growing evidence of creditors effectively
influencing management and the overall direction of a company.1
An effective “loan-to-own” strategy should minimize the risk of litigation, liquidation
(i.e., the target company fails) and valuation that exceeds the investor’s value
proposition. As a result, any firm engaging in a loan-to-own strategy using the
junior debt must account for the interests of other creditors and management.
1 “Creditor Control and Conflict in Chapter 11”, Kenneth Ayotte and Edward Morrison, 2009
PRESENTATION TO THE ALLIANZ SE HIGH YIELD GROUP
4
European insurance company Allianz SE (“Allianz”) began purchasing Cenveo
second lien, unsecured debt, and equity when Cenveo refinanced its obligations in
2012, and increased the investment in 2013 and 2014. Currently, Allianz is the
largest single holder of debt and equity in the company2. Allianz’s strategy has
many of the trademarks of a loan-to-own strategy, including a pending exchange of
existing junior debt for a combination of senior debt and equity. Following the
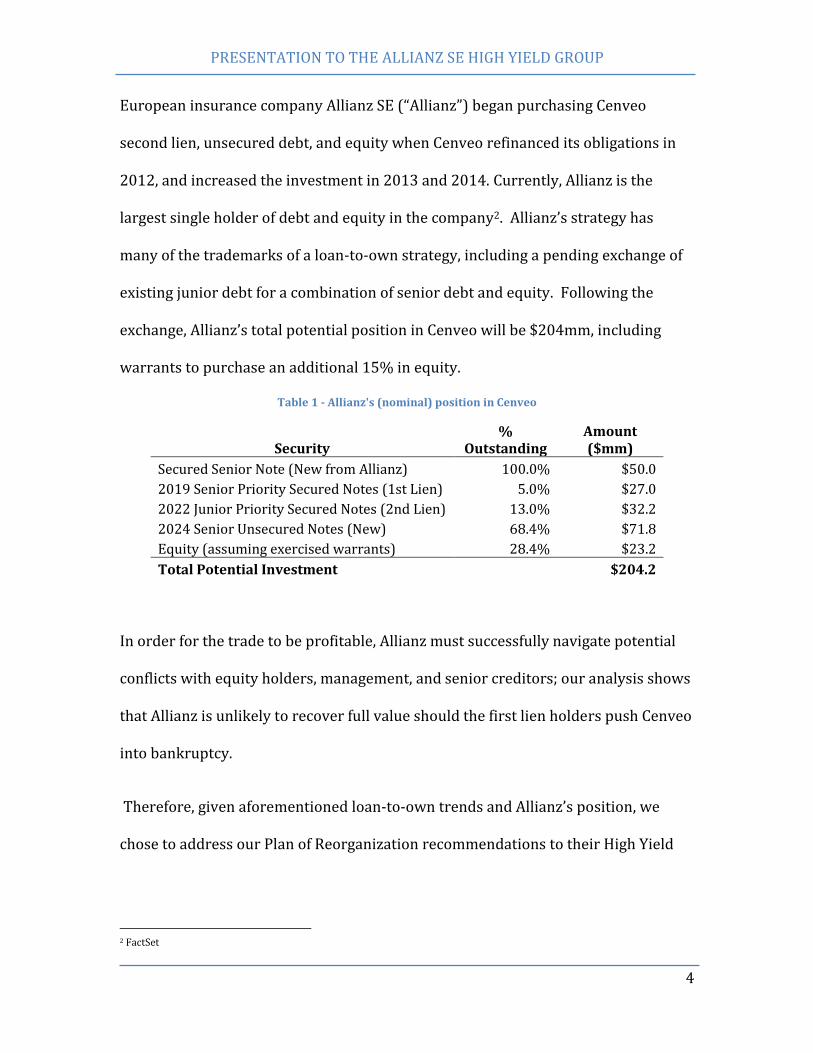
exchange, Allianz’s total potential position in Cenveo will be $204mm, including
warrants to purchase an additional 15% in equity.
Table 1 - Allianz's (nominal) position in Cenveo
Security %
Outstanding Amount ($mm)
Secured Senior Note (New from Allianz) 100.0% $50.0
2019 Senior Priority Secured Notes (1st Lien) 5.0% $27.0
2022 Junior Priority Secured Notes (2nd Lien) 13.0% $32.2
2024 Senior Unsecured Notes (New) 68.4% $71.8
Equity (assuming exercised warrants) 28.4% $23.2
Total Potential Investment $204.2
In order for the trade to be profitable, Allianz must successfully navigate potential
conflicts with equity holders, management, and senior creditors; our analysis shows
that Allianz is unlikely to recover full value should the first lien holders push Cenveo
into bankruptcy.
Therefore, given aforementioned loan-to-own trends and Allianz’s position, we
chose to address our Plan of Reorganization recommendations to their High Yield
2 FactSet
PRESENTATION TO THE ALLIANZ SE HIGH YIELD GROUP
5
Group:
1. Operational Improvements: Use equity/debt position to obtain board
control and put in place new management familiar with higher-margin
labeling and modern mailing campaigns, cross-sell Kadena platform, and
expand labeling operations in underpenetrated geographic areas
2. M&A: Divest negative-growth Commercial Print segment to synergy-capable
strategic buyer, using proceeds to pay off 1st lien debt and reduce leverage
ratios
3. Capital Structure Reorganization: Coordinate with 1st and 2nd lien holders
to de-lever Cenveo through debt-to-equity conversion in pre-packaged
bankruptcy, use market position to entice strategic buyer
We estimate that execution of this plan will provide for complete recovery for the
ABL, 1st Lien and 2nd Lien holders and leave a significant stake in equity for Allianz.
Finally, it is important to remember that we believe Allianz has little long-term
interest in managing an envelope company. The recommendations below are aimed
at streamlining Cenveo and paving the way towards a profitable exit.
PRESENTATION TO THE ALLIANZ SE HIGH YIELD GROUP
6
Company
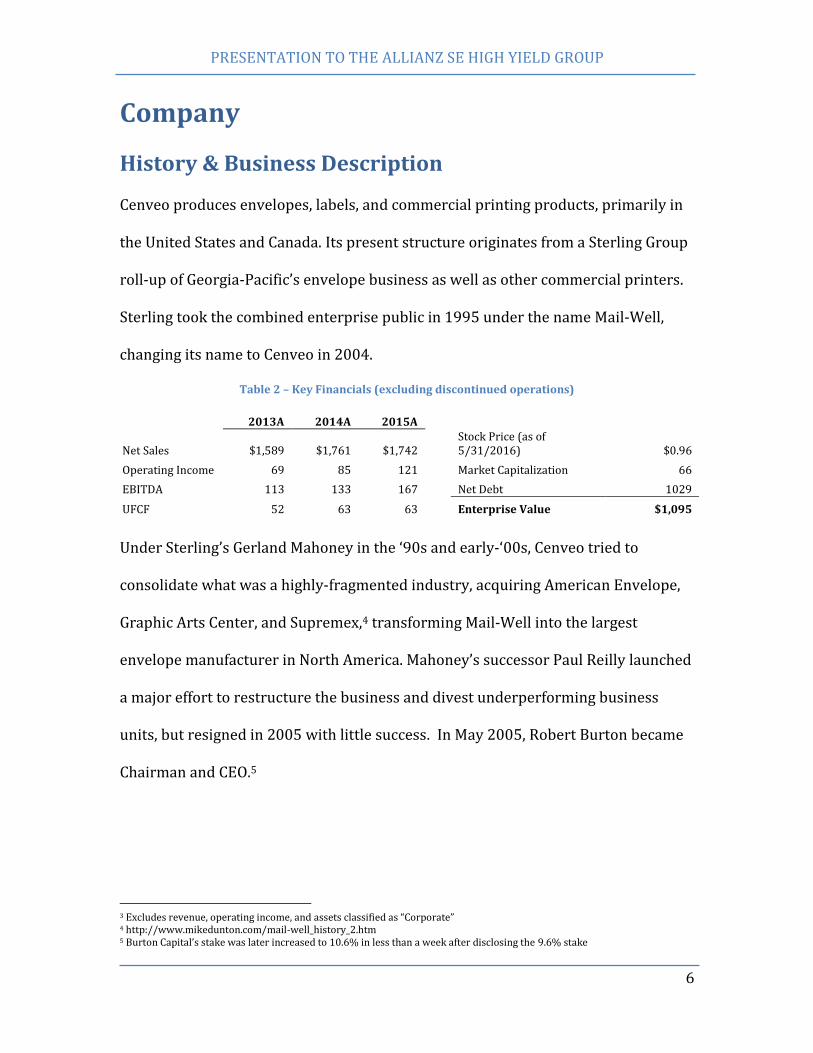
History & Business Description Cenveo produces envelopes, labels, and commercial printing products, primarily in
the United States and Canada. Its present structure originates from a Sterling Group
roll-up of Georgia-Pacific’s envelope business as well as other commercial printers.
Sterling took the combined enterprise public in 1995 under the name Mail-Well,
changing its name to Cenveo in 2004.
Table 2 – Key Financials (excluding discontinued operations)
2013A 2014A 2015A
Net Sales $1,589 $1,761 $1,742 Stock Price (as of 5/31/2016) $0.96
Operating Income 69 85 121 Market Capitalization 66
EBITDA 113 133 167 Net Debt 1029
UFCF 52 63 63 Enterprise Value $1,095 3
Under Sterling’s Gerland Mahoney in the ‘90s and early-‘00s, Cenveo tried to
consolidate what was a highly-fragmented industry, acquiring American Envelope,
Graphic Arts Center, and Supremex,4 transforming Mail-Well into the largest
envelope manufacturer in North America. Mahoney’s successor Paul Reilly launched
a major effort to restructure the business and divest underperforming business
units, but resigned in 2005 with little success. In May 2005, Robert Burton became
Chairman and CEO.5
3 Excludes revenue, operating income, and assets classified as “Corporate” 4 http://www.mikedunton.com/mail-well_history_2.htm 5 Burton Capital’s stake was later increased to 10.6% in less than a week after disclosing the 9.6% stake
PRESENTATION TO THE ALLIANZ SE HIGH YIELD GROUP
7
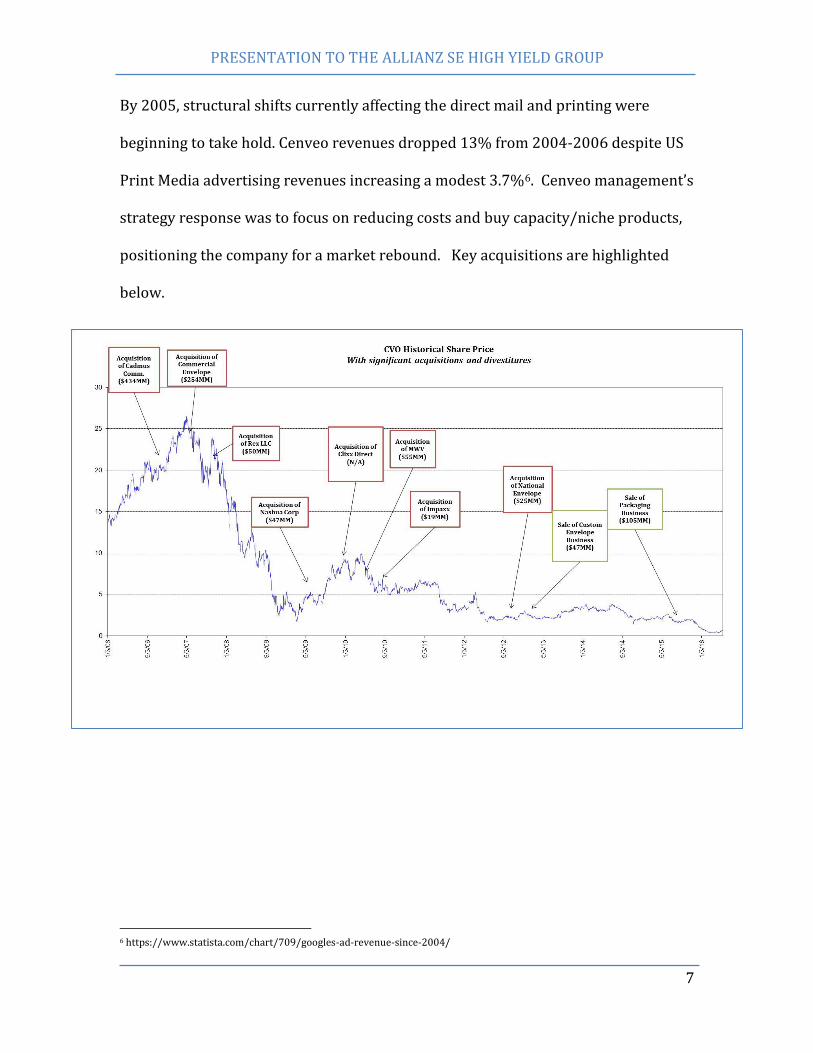
By 2005, structural shifts currently affecting the direct mail and printing were
beginning to take hold. Cenveo revenues dropped 13% from 2004-2006 despite US
Print Media advertising revenues increasing a modest 3.7%6. Cenveo management’s
strategy response was to focus on reducing costs and buy capacity/niche products,
positioning the company for a market rebound. Key acquisitions are highlighted
below.
6 https://www.statista.com/chart/709/googles-ad-revenue-since-2004/
PRESENTATION TO THE ALLIANZ SE HIGH YIELD GROUP
8
Cadmus Communications (March 2007): Paid $241mm in cash (12.3x LTM
EBITDA, representing an 18% premium to the prior-day’s closing price) to
expand into scientific and technical journal printing
Commercial Envelope Manufacturing (August 2007): Paid $230mm in
cash (11.3x LTM EBITDA) to expand its envelope manufacturing business
MeadWestVaco’s Envelope Products Group (February 2011): Paid
$55mm in cash to expand direct mail and billing business.
National Envelope (August 2013): Purchased one of Cenveo’s chief
envelope competitors out of bankruptcy for $133mm (including assumption
of debt). This helped solidify Cenveo’s position as the largest North
American envelope manufacturer
Cenveo had expanded its suite of niche products and services but borrowed heavily
to do so. From 2006 to 2009, Cenveo’s net debt ballooned 83% ($676mm to
$1,234mm) while revenue increased only 14% owing to the 2008 recession. As
pricing pressure increased and demand slowed, Cenveo’s interest coverage went
from 1.77x to 1.00x over the same period.
Declining sales in 2012 and 2013 prompted management to change tactics once
more by focusing on the commercial envelope business and reducing exposure to
printing. From 2011-2016, it sold 5 print facilities ($14.6mm), 6 niche envelope
facilities ($9.4mm), its Custom Envelope business ($48mm), and its Packaging
business ($105mm), using the proceeds to pay down debt.
Cenveo has since become increasingly dependent on the high-yield market to
refinance its existing debt obligations, engaging in three exchange offers/issuances
PRESENTATION TO THE ALLIANZ SE HIGH YIELD GROUP
9
from 2011-2015. While these have helped reduce overall interest expense by
$20mm per year, Cenveo has struggled to generate cash flow to grow its way out of
debt.
Manufacturing Process & Value Chain Cenveo operates 46 manufacturing facilities (15 owned, 31 leased) and leases its
Stamford headquarters as well as its sales and support facilities. Its primary product
inputs include paper, ink, film, offset plates and chemicals, with paper accounting
for the majority of total material costs. Understandably, Cenveo’s business requires
the use of heavy, capital-intensive machinery—roughly 83% of the Company’s
$636mm in Gross PP&E is devoted to machines like digital presses, which can cost
up to $900,000 and comprise much of one facility’s output. Many of these machines
are highly productive, however (1 W+D 320 envelope converter processes 21,000
units an hour). Cenveo’s 6.26x 5-year fixed asset turnover compares favorably with
RR Donnelly’s 6.71x and Quad/Graphics 2.34x. Only 23% of Cenveo’s 7,300
employees are unionized, which gives them a degree of operational flexibility.
Products
Envelope: Cenveo operates 22 envelope manufacturing and sales facilities, all based
in the US. This manufacturing process consists of “converting” rolls of paper into
envelopes using die-cutting, folding, and gluing. Its Commercial Envelope Group
handles specialized B2B envelope production, while its ‘Quality Park’ brand sells
specialty and stock envelopes through wholesalers, independent dealers and office
product superstores. These operations run hand-in-hand with Cenveo’s Mailing
PRESENTATION TO THE ALLIANZ SE HIGH YIELD GROUP
10
Services division, which constructs direct-mail campaigns. These include standard
promotional mailers as well as invoices and billing statements. Key consumers
include the finance/insurance and retail industries.
Print: This segment produces car brochures, journals/books/magazines,
advertising displays, corporate identity/marketing materials and directories. With
16 manufacturing and sales facilities in the US, Cenveo’s commercial printing
process includes electronic prepress, direct-to-plate technology, high-quality color
printing (on web or sheet-fed presses, depending on the volume and quality you
need), and digital printing. This segment caters primarily to the consumer product,
automotive, travel and leisure and telecommunications industries.
Label: The label segment produces custom labels for pharmacies, consumer
product, and food/beverage companies. It specializes in end-to-end production of
custom, overnight packaging, and pressure-sensitive prescription labels. Its ‘Rx
Technology’ brand is the strongest in the pharmacy segment and its ‘Nashua’ brand
is a popular manufacturer of entertainment tickets. The segment has 8
manufacturing and sales facilities and labels are sold directly via the Cenveo
website/sales team or through extensive distributor channels.
Auxiliary: Cenveo also offers services that complement the 3 segments: Fulfillment
software and warehousing/distribution capacity (5 US facilities) offer clients the
ability to input orders automatically and take delivery within days while avoiding
inventory build-up. The Creative Services Group (4 facilities in the US, 4 in India, and
1 in the UK) designs direct-mail and commercial printing campaigns, services
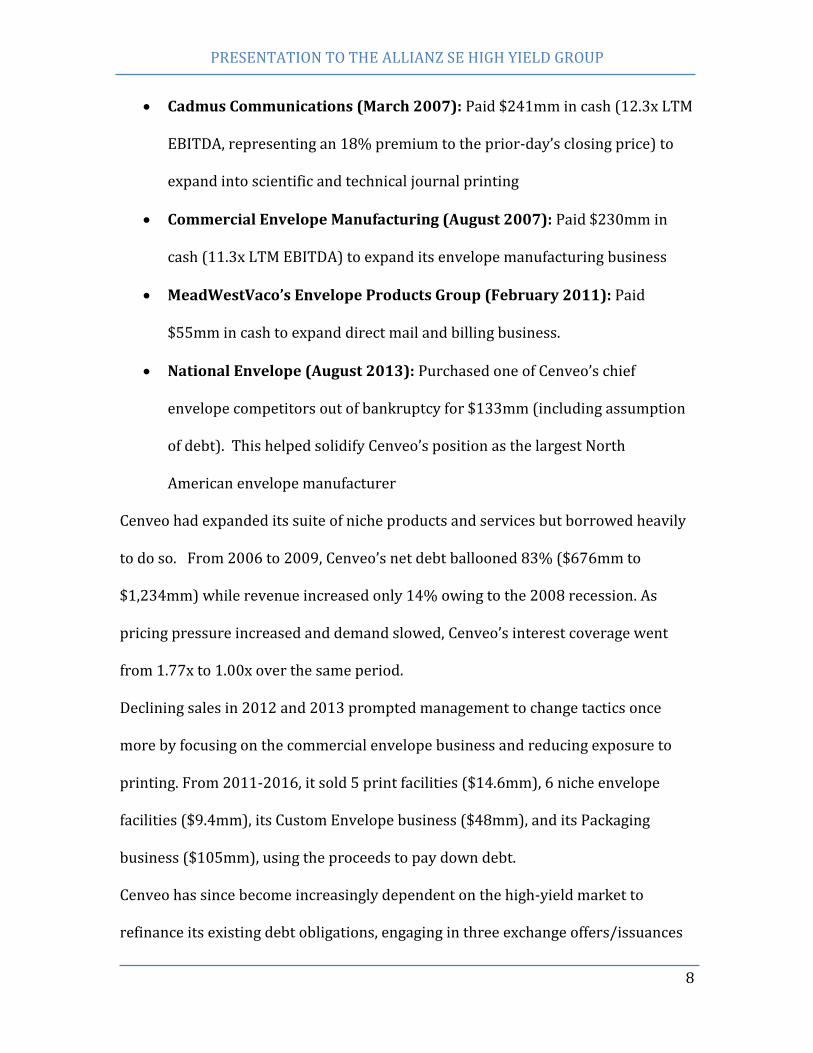
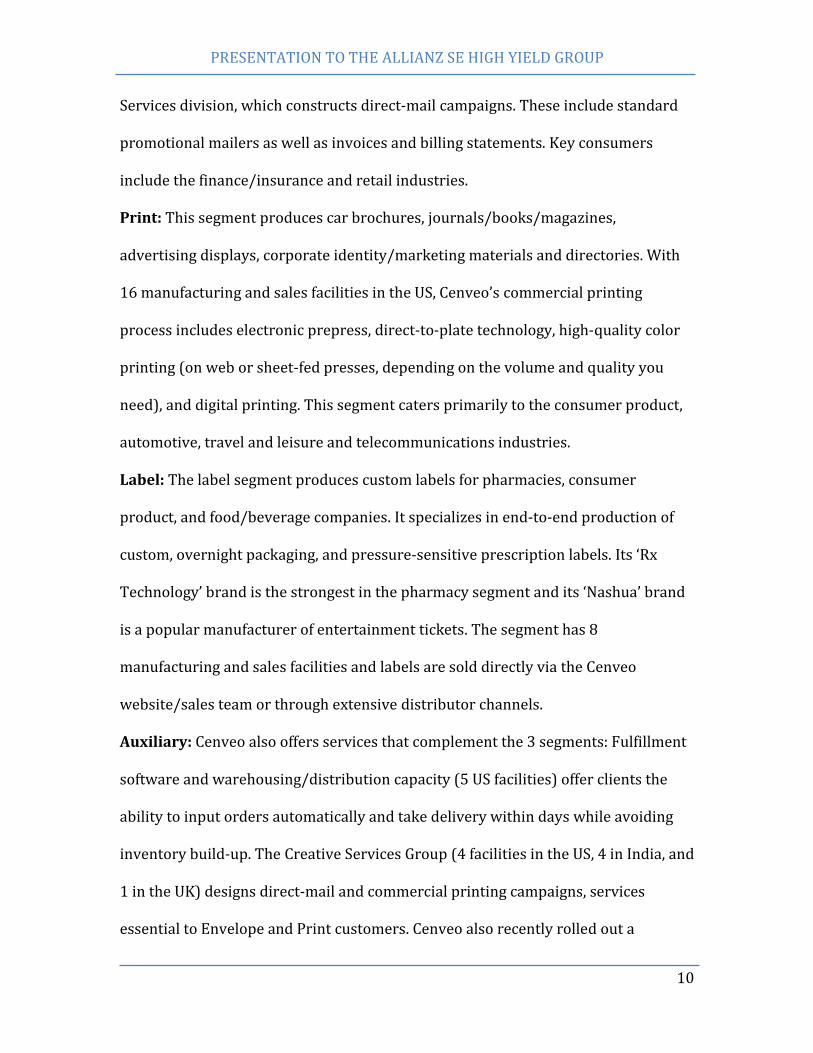
essential to Envelope and Print customers. Cenveo also recently rolled out a
PRESENTATION TO THE ALLIANZ SE HIGH YIELD GROUP
11
platform called ‘Kadena’, which is software that allows clients to design and archive
marketing content (both digital and print), manage its production and distribution,
and review campaign analytics.
Management
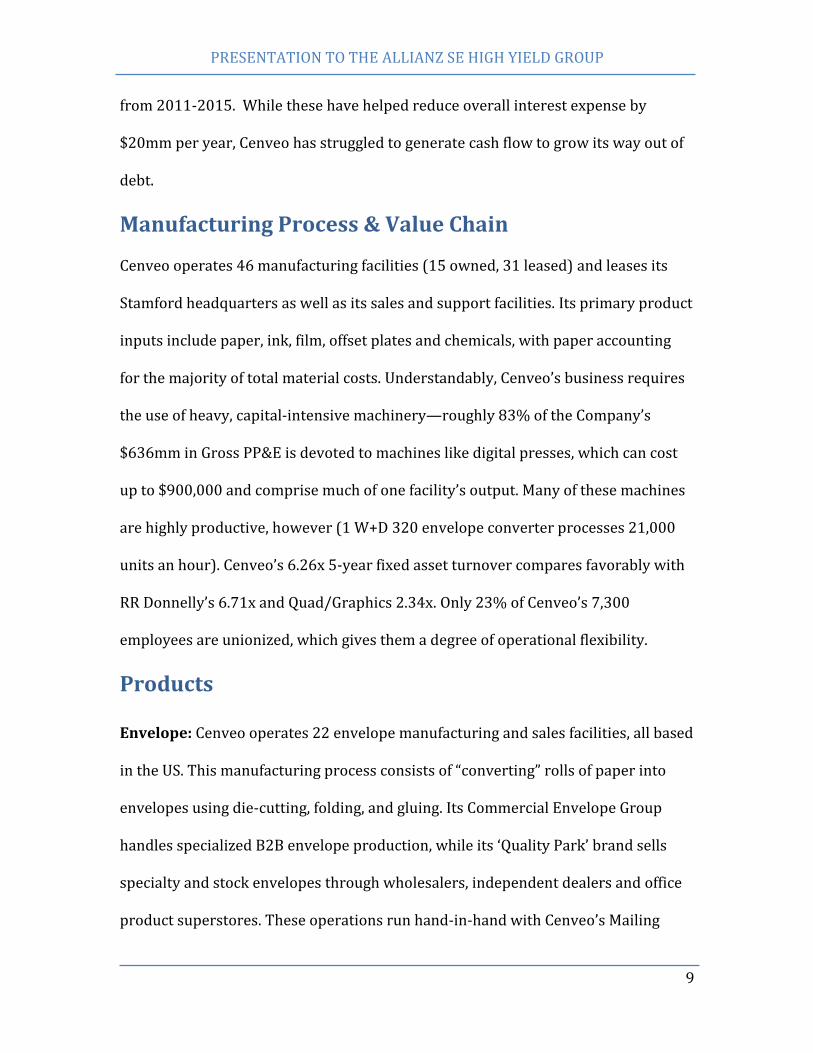
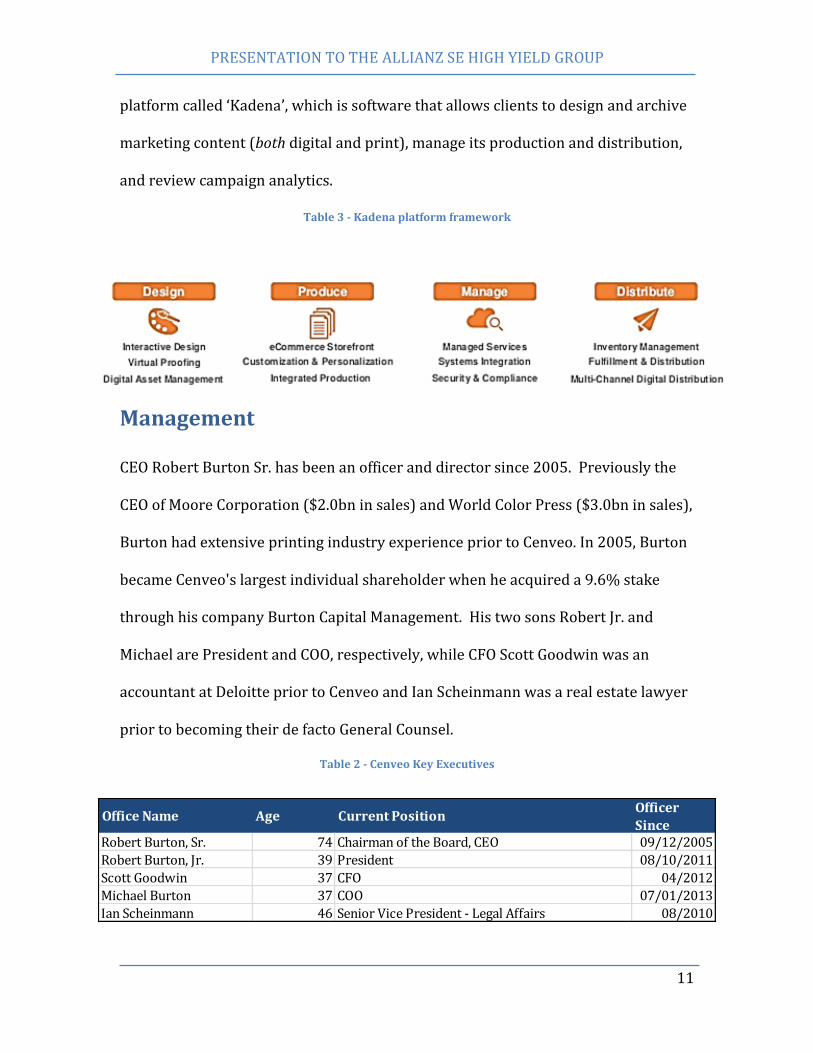
CEO Robert Burton Sr. has been an officer and director since 2005. Previously the
CEO of Moore Corporation ($2.0bn in sales) and World Color Press ($3.0bn in sales),
Burton had extensive printing industry experience prior to Cenveo. In 2005, Burton
became Cenveo's largest individual shareholder when he acquired a 9.6% stake
through his company Burton Capital Management. His two sons Robert Jr. and
Michael are President and COO, respectively, while CFO Scott Goodwin was an
accountant at Deloitte prior to Cenveo and Ian Scheinmann was a real estate lawyer
prior to becoming their de facto General Counsel.
Table 2 - Cenveo Key Executives
Table 3 - Kadena platform framework
Robert Burton, Sr. 74 Chairman of the Board, CEO 09/12/2005
Robert Burton, Jr. 39 President 08/10/2011
Scott Goodwin 37 CFO 04/2012
Michael Burton 37 COO 07/01/2013
Ian Scheinmann 46 Senior Vice President - Legal Affairs 08/2010
Office Name Age Current PositionOfficer
Since
PRESENTATION TO THE ALLIANZ SE HIGH YIELD GROUP
12
The Cenveo Board is composed of three independent directors and Burtons Sr. and
Jr. Gerald Armstrong is a former banker specializing in print finance, Dr. Mark
Griffin is an educator specializing in learning disabilities, and Dr. Susan Herbst is the
president of the University of Connecticut, where Cenveo is based.
While it requires a supermajority for mergers (2/3rds), Cenveo’s board is
remarkably shareholder-friendly. There is no poison pill, classified board or super-
voting requirements for the removal of board members; it has a 1.25/10 FactSet
Bulletproof rating for takeover defenses, which is lax compared to the 3.19 rating
for the Russell 3000.
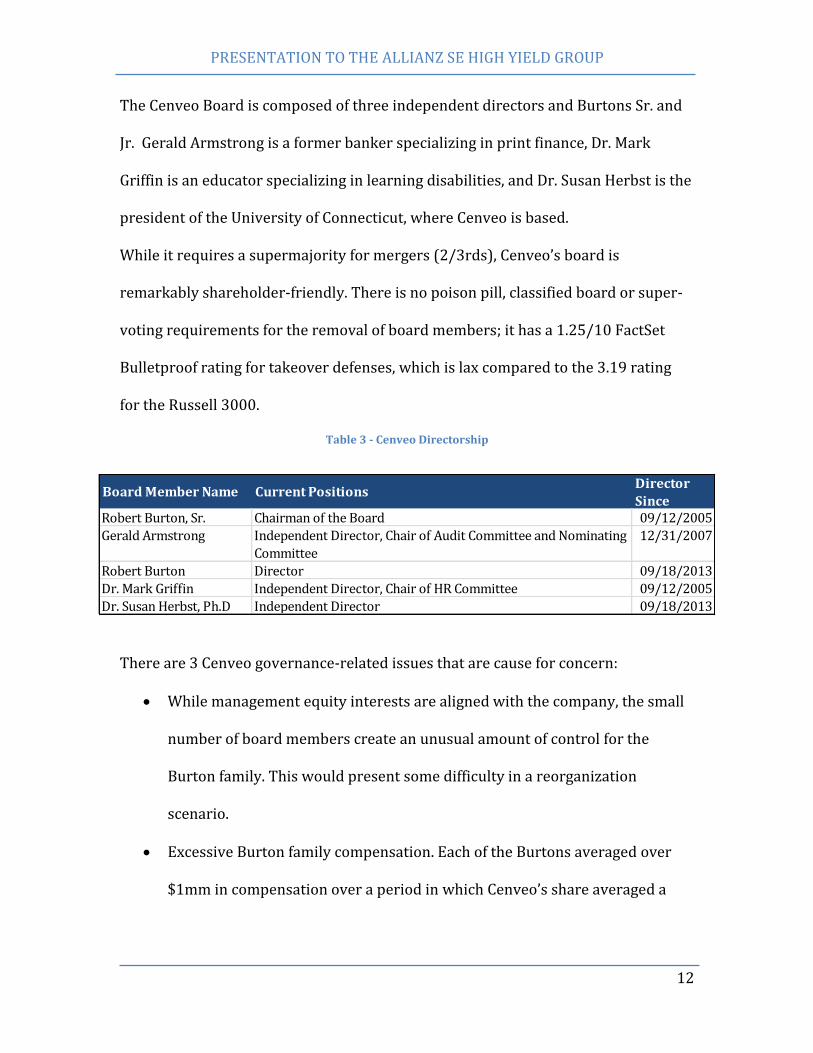
Table 3 - Cenveo Directorship
There are 3 Cenveo governance-related issues that are cause for concern:
While management equity interests are aligned with the company, the small
number of board members create an unusual amount of control for the
Burton family. This would present some difficulty in a reorganization
scenario.
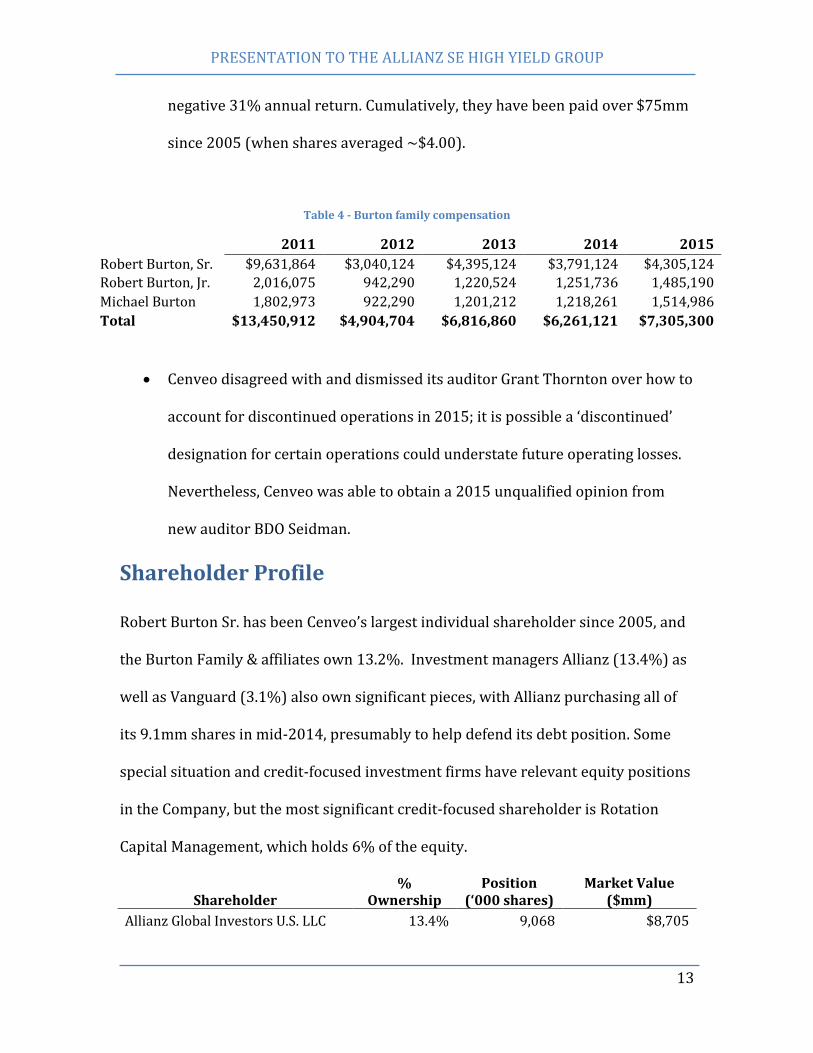
Excessive Burton family compensation. Each of the Burtons averaged over
$1mm in compensation over a period in which Cenveo’s share averaged a
Robert Burton, Sr. Chairman of the Board 09/12/2005
Gerald Armstrong Independent Director, Chair of Audit Committee and Nominating
Committee
12/31/2007
Robert Burton Director 09/18/2013
Dr. Mark Griffin Independent Director, Chair of HR Committee 09/12/2005
Dr. Susan Herbst, Ph.D Independent Director 09/18/2013
Current PositionsDirector
SinceBoard Member Name
PRESENTATION TO THE ALLIANZ SE HIGH YIELD GROUP
13
negative 31% annual return. Cumulatively, they have been paid over $75mm
since 2005 (when shares averaged ~$4.00).
Table 4 - Burton family compensation
2011 2012 2013 2014 2015
Robert Burton, Sr. $9,631,864 $3,040,124 $4,395,124 $3,791,124 $4,305,124
Robert Burton, Jr. 2,016,075 942,290 1,220,524 1,251,736 1,485,190
Michael Burton 1,802,973 922,290 1,201,212 1,218,261 1,514,986
Total $13,450,912 $4,904,704 $6,816,860 $6,261,121 $7,305,300
Cenveo disagreed with and dismissed its auditor Grant Thornton over how to
account for discontinued operations in 2015; it is possible a ‘discontinued’
designation for certain operations could understate future operating losses.
Nevertheless, Cenveo was able to obtain a 2015 unqualified opinion from
new auditor BDO Seidman.
Shareholder Profile
Robert Burton Sr. has been Cenveo’s largest individual shareholder since 2005, and
the Burton Family & affiliates own 13.2%. Investment managers Allianz (13.4%) as
well as Vanguard (3.1%) also own significant pieces, with Allianz purchasing all of
its 9.1mm shares in mid-2014, presumably to help defend its debt position. Some
special situation and credit-focused investment firms have relevant equity positions
in the Company, but the most significant credit-focused shareholder is Rotation
Capital Management, which holds 6% of the equity.
Shareholder %
Ownership Position
(‘000 shares) Market Value
($mm)
Allianz Global Investors U.S. LLC 13.4% 9,068 $8,705
PRESENTATION TO THE ALLIANZ SE HIGH YIELD GROUP
14
BURTON ROBERT G SR 11.1% 7,553 7,251
Rotation Capital Management LP 6.1% 4,138 3,973
Private Management Group, Inc. 5.4% 3,651 3,505
Zelman Capital LLC 4.6% 3,126 3,001
Wallace Capital Management, Inc. 4.6% 3,117 2,993
Boothbay Fund Management LLC 3.5% 2,348 2,254
The Vanguard Group, Inc. 3.1% 2,103 2,019
BlackRock Fund Advisors 2.9% 1,988 1,908
Ardsley Advisory Partners 2.2% 1,500 1,440
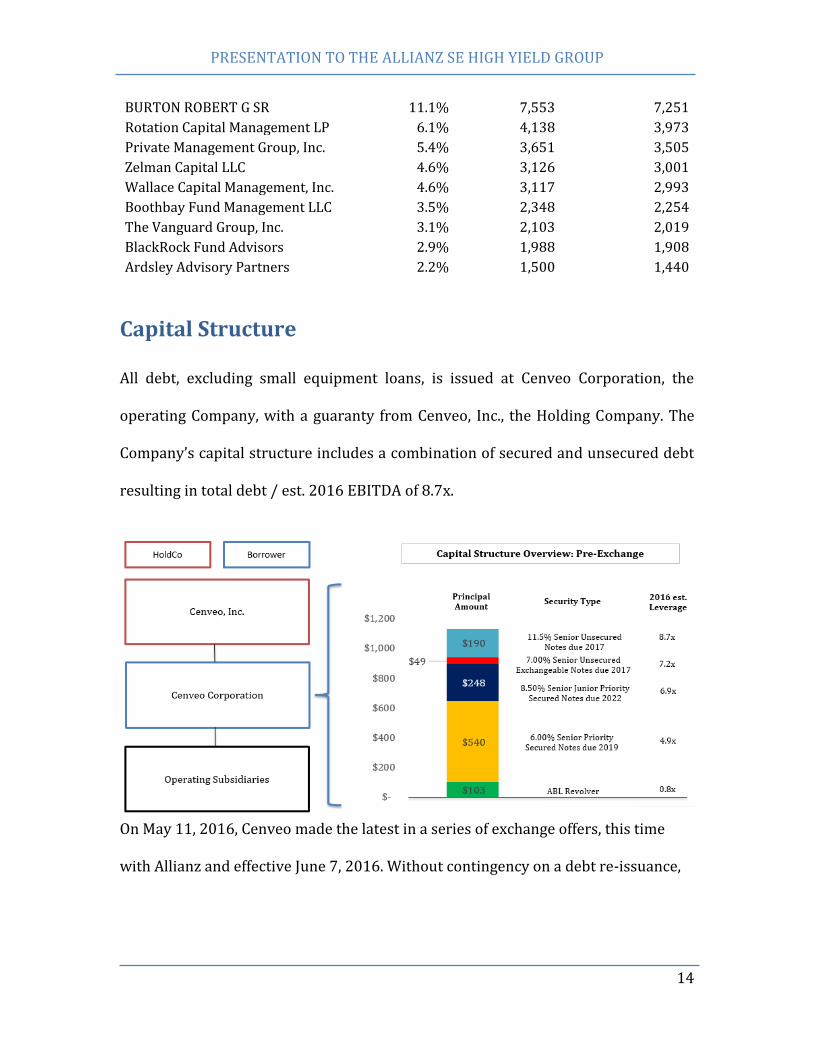
Capital Structure
All debt, excluding small equipment loans, is issued at Cenveo Corporation, the
operating Company, with a guaranty from Cenveo, Inc., the Holding Company. The
Company’s capital structure includes a combination of secured and unsecured debt
resulting in total debt / est. 2016 EBITDA of 8.7x.
On May 11, 2016, Cenveo made the latest in a series of exchange offers, this time
with Allianz and effective June 7, 2016. Without contingency on a debt re-issuance,
PRESENTATION TO THE ALLIANZ SE HIGH YIELD GROUP
15
we assume (as do Cenveo analysts) this exchange will take effect and have modeled
our Plan of Reorganization following this assumption.
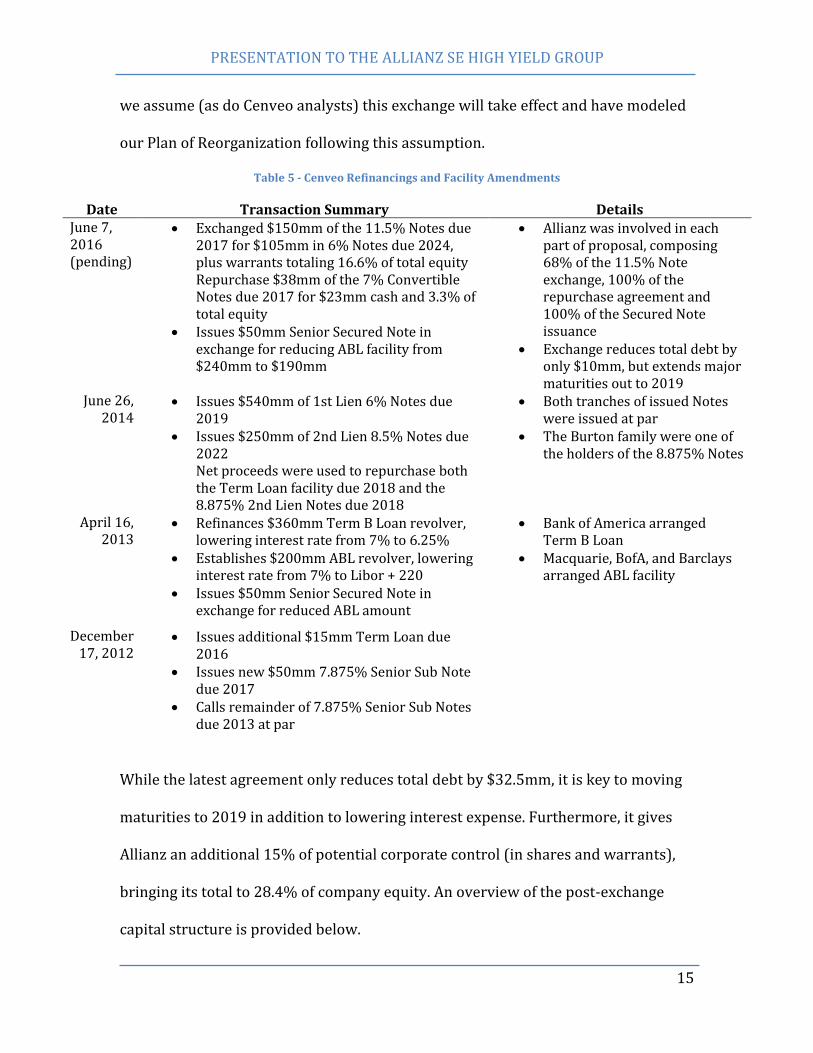
Table 5 - Cenveo Refinancings and Facility Amendments
Date Transaction Summary Details June 7, 2016 (pending)
Exchanged $150mm of the 11.5% Notes due 2017 for $105mm in 6% Notes due 2024, plus warrants totaling 16.6% of total equity Repurchase $38mm of the 7% Convertible Notes due 2017 for $23mm cash and 3.3% of total equity
Issues $50mm Senior Secured Note in exchange for reducing ABL facility from $240mm to $190mm
Allianz was involved in each part of proposal, composing 68% of the 11.5% Note exchange, 100% of the repurchase agreement and 100% of the Secured Note issuance
Exchange reduces total debt by only $10mm, but extends major maturities out to 2019
June 26, 2014
Issues $540mm of 1st Lien 6% Notes due 2019
Issues $250mm of 2nd Lien 8.5% Notes due 2022 Net proceeds were used to repurchase both the Term Loan facility due 2018 and the 8.875% 2nd Lien Notes due 2018
Both tranches of issued Notes were issued at par
The Burton family were one of the holders of the 8.875% Notes
April 16, 2013
Refinances $360mm Term B Loan revolver, lowering interest rate from 7% to 6.25%
Establishes $200mm ABL revolver, lowering interest rate from 7% to Libor + 220
Issues $50mm Senior Secured Note in exchange for reduced ABL amount
Bank of America arranged Term B Loan
Macquarie, BofA, and Barclays arranged ABL facility
December 17, 2012
Issues additional $15mm Term Loan due 2016
Issues new $50mm 7.875% Senior Sub Note due 2017
Calls remainder of 7.875% Senior Sub Notes due 2013 at par
While the latest agreement only reduces total debt by $32.5mm, it is key to moving
maturities to 2019 in addition to lowering interest expense. Furthermore, it gives
Allianz an additional 15% of potential corporate control (in shares and warrants),
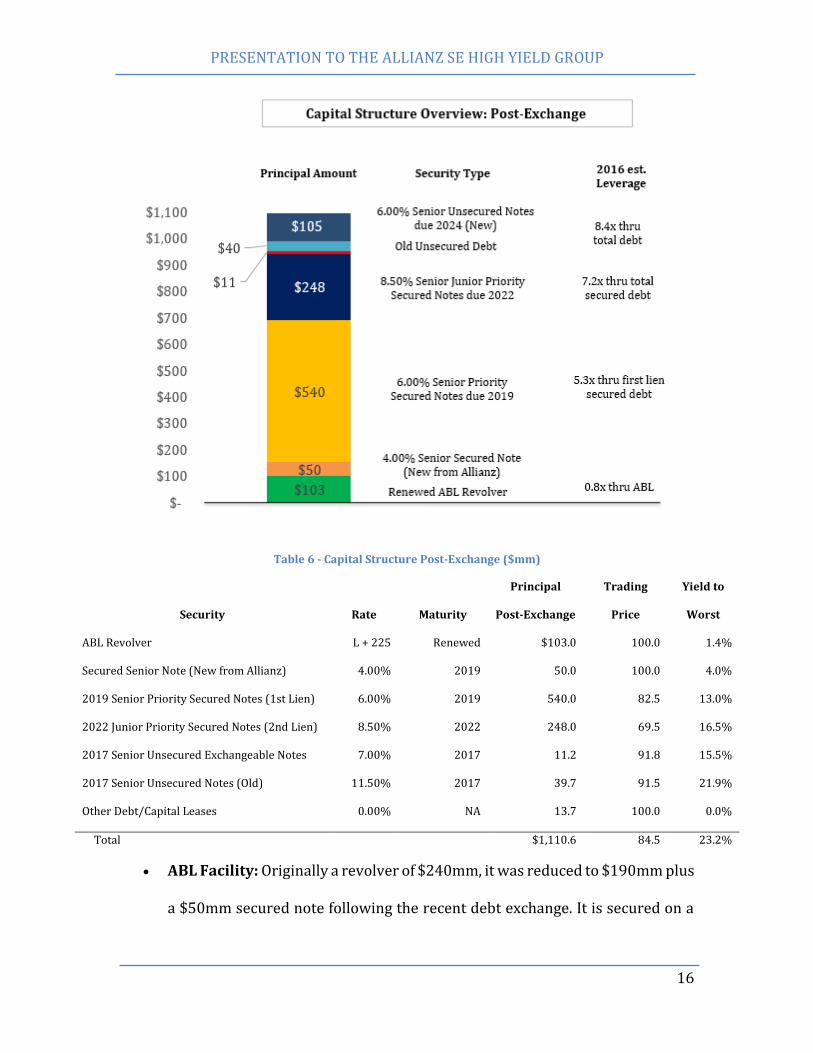
bringing its total to 28.4% of company equity. An overview of the post-exchange
capital structure is provided below.
PRESENTATION TO THE ALLIANZ SE HIGH YIELD GROUP
16
Table 6 - Capital Structure Post-Exchange ($mm)
Security Rate Maturity
Principal
Post-Exchange
Trading
Price
Yield to
Worst
ABL Revolver L + 225 Renewed $103.0 100.0 1.4%
Secured Senior Note (New from Allianz) 4.00% 2019 50.0 100.0 4.0%
2019 Senior Priority Secured Notes (1st Lien) 6.00% 2019 540.0 82.5 13.0%
2022 Junior Priority Secured Notes (2nd Lien) 8.50% 2022 248.0 69.5 16.5%
2017 Senior Unsecured Exchangeable Notes 7.00% 2017 11.2 91.8 15.5%
2017 Senior Unsecured Notes (Old) 11.50% 2017 39.7 91.5 21.9%
Other Debt/Capital Leases 0.00% NA 13.7 100.0 0.0%
Total $1,110.6 84.5 23.2%
ABL Facility: Originally a revolver of $240mm, it was reduced to $190mm plus
a $50mm secured note following the recent debt exchange. It is secured on a
PRESENTATION TO THE ALLIANZ SE HIGH YIELD GROUP
17
first priority on all Cenveo assets. The syndicate includes Bank of America,
Macquarie, Barclays, GE Capital and Wells Fargo.
Senior Secured Note: Issued by Allianz as part of the agreement to reduce the
ABL facility. Ranked junior to the 1st Lien Notes with respect to the Notes
collateral but senior to the 1st Lien with respect to ABL collateral.
2019 Senior Priority Secured Notes (1st Lien): These are rated Caa1/B- and
secured on a 1st Lien basis by both the parent and subsidiaries of Cenveo. Key
covenants include a restriction on sale of assets (the lien transfers), limit on
further indebtedness (unless it can meet a fixed-charge ratio of at least 2:1—
Cenveo will be at 1.05:1 in 2016), and change of control. Holders include
Allianz (5%), Aberdeen (5%), Fidelity (4%), Unicredit (3%), SEI, State Street,
and Western and Southern (all with 2%).
2022 Junior Priority Secured Notes (2nd Lien): Rated Caa3/CCC-, largely the
same covenants and collateral as the 1st Lien. Holders include Allianz (13%),
Northeast Investors (10%), JPMorgan (5%), SEI (4.7%), Advent, Vertex and
Goldman (all with 1%). Both the 1st and 2nd Lien groups have retained
respective financial and legal counsel.
2017 Senior Unsecured Notes: Allianz formerly held 54% of these, and
together with 2 other holders, a total of 79% were exchanged for the 2024
Notes, leaving the rest with light covenants except for a restriction on asset
sales (unless it’s for at least 75% cash). Ranked pari passu with other
unsecured debt.
PRESENTATION TO THE ALLIANZ SE HIGH YIELD GROUP
18
2017 Senior Unsecured Exchangeable Notes: Convertible at $4.41 per
share, these are covenant light. 77% of these (Allianz’s stake) were
repurchased by Cenveo at a 40% discount. Also pari passu with unsecured
debt.
2024 Senior Unsecured Notes: With the same covenants as the 2017
Unsecureds, Allianz and two holders have 97% outstanding.
Leverage & Solvency: The Company’s 2016E ABL, secured, and total leverage will be
an uncomfortable 0.8x, 7.2x, and 8.4x. Based on a fully-diluted market capitalization
of $66mm as of May 31, 2016, Cenveo’s enterprise value is 8.7x EBITDA, which
suggests a debt-to-value at a bankruptcy-level 98%. An Altman Z-Score of 0.8
supports the bankruptcy prediction as well.
Recent Financial Performance
Cenveo reported weaker sales in 2015 (-10.6%) due to the divestiture of its
packaging business and sales slowdowns in its envelope and label segments. That
said, operating margin widened 2.6%; COGS narrowed by 1.3% and SG&A by 0.5%,
demonstrating management’s focus on cost minimization. Interest expense also
declined by $6mm as a result of debt retirement and exchanges. On a same-segment
basis, revenue was down only 1.1%, with EBITDA up 25.6% due to cost-cutting
particularly in the Envelope segment. Management maintained this margin
improvement was due to faster-than-expected integration of the National Envelope
acquisition (they closed redundant facilities in Jacksonville and Ohio) as well as
investments in more efficient labeling machinery.

PRESENTATION TO THE ALLIANZ SE HIGH YIELD GROUP
19
Cenveo 2012A 2013A 2014A 2015A
Sales $1,798 $1,778 $1,949 $1,742
Sales Growth (5.8%) (1.1%) 9.6% (10.6%)
COGS excluding D&A as % of Sales 78.4% 80.7% 82.2% 80.9%
SG&A Margin 10.4% 11.6% 11.2% 10.7%
EBIT (Operating Income) 112 29 44 84
Net Income (Loss) (80) (69) (84) (31)
Adjusted EBITDA 187 115 130 142
% Growth (12.3%) (38.3%) 13.0% 9.3%
D&A 62 60 64 50
CapEx 21 29 37 26
Segment Financial Analysis
While the Envelope, Print, and Label segments usually operate out of separate
manufacturing facilities, the company benefits from cross-selling synergies, as
evident by the 130% rise in intercompany sales to $28.3mm from 2013-2015. This
was particularly evident in Print (from $4.9mm to $17.6mm), which provides the
direct-mail inserts to Envelope clients. Additionally, Cenveo benefits from cost
synergies on raw materials supply as well as final product distribution—it
frequently ships multiple products across segments to the same customers.
Envelope: The segment typically accounts for 40% of the company’s assets and
33% of its capital expenditure. Historically, Envelope experiences seasonality with a
higher percentage of products sold during Q3 and Q4, primarily related to back-to-
school campaigns and holiday purchases.
Envelope 2013A 2014A 2015A
Net Sales 750 930 909
Net Operating Income 40 30 66
Net Operating Margin 5.3% 3.2% 7.3%
PRESENTATION TO THE ALLIANZ SE HIGH YIELD GROUP
20
Restructuring & Other Charges 5 14 4
Depreciation & Amortization 16 20 20
Capital Expenditures 7 17 7
Total Assets 450 445
% of Total Sales 42.2% 47.7% 52.2%
% of Total Assets 38.8% 41.2%
EBITDA 56 49 87
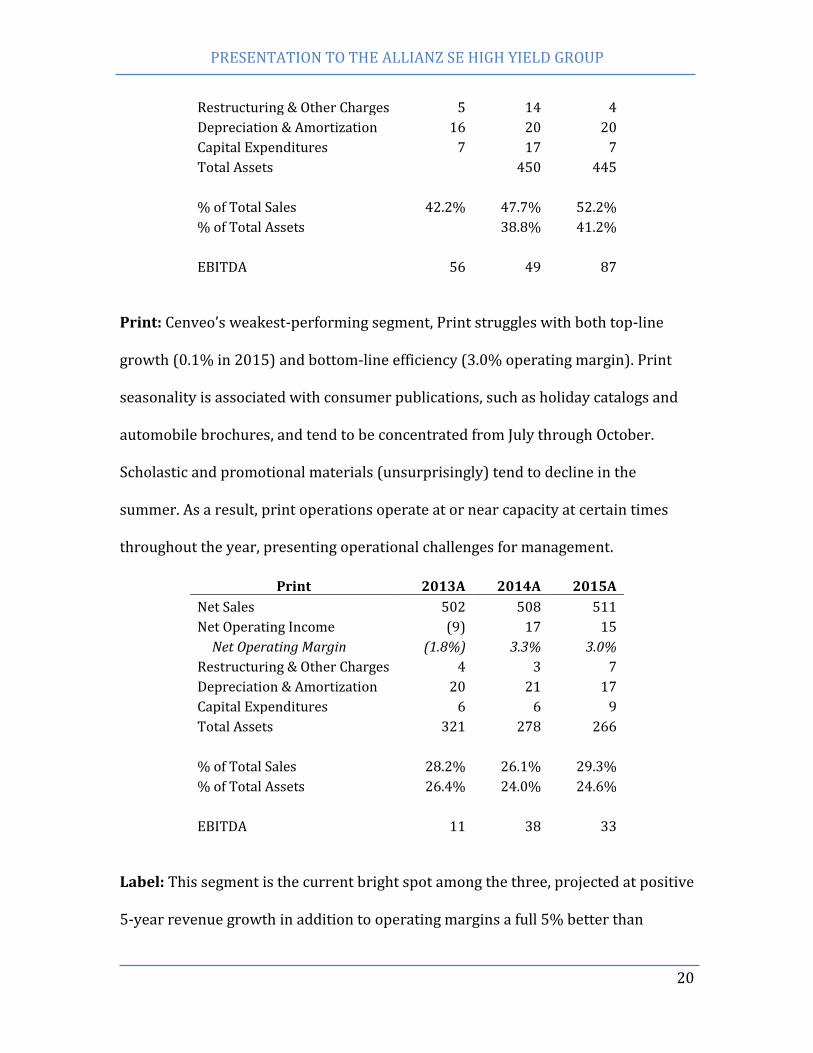
Print: Cenveo’s weakest-performing segment, Print struggles with both top-line
growth (0.1% in 2015) and bottom-line efficiency (3.0% operating margin). Print
seasonality is associated with consumer publications, such as holiday catalogs and
automobile brochures, and tend to be concentrated from July through October.
Scholastic and promotional materials (unsurprisingly) tend to decline in the
summer. As a result, print operations operate at or near capacity at certain times
throughout the year, presenting operational challenges for management.
Print 2013A 2014A 2015A
Net Sales 502 508 511
Net Operating Income (9) 17 15
Net Operating Margin (1.8%) 3.3% 3.0%
Restructuring & Other Charges 4 3 7
Depreciation & Amortization 20 21 17
Capital Expenditures 6 6 9
Total Assets 321 278 266
% of Total Sales 28.2% 26.1% 29.3%
% of Total Assets 26.4% 24.0% 24.6%
EBITDA 11 38 33
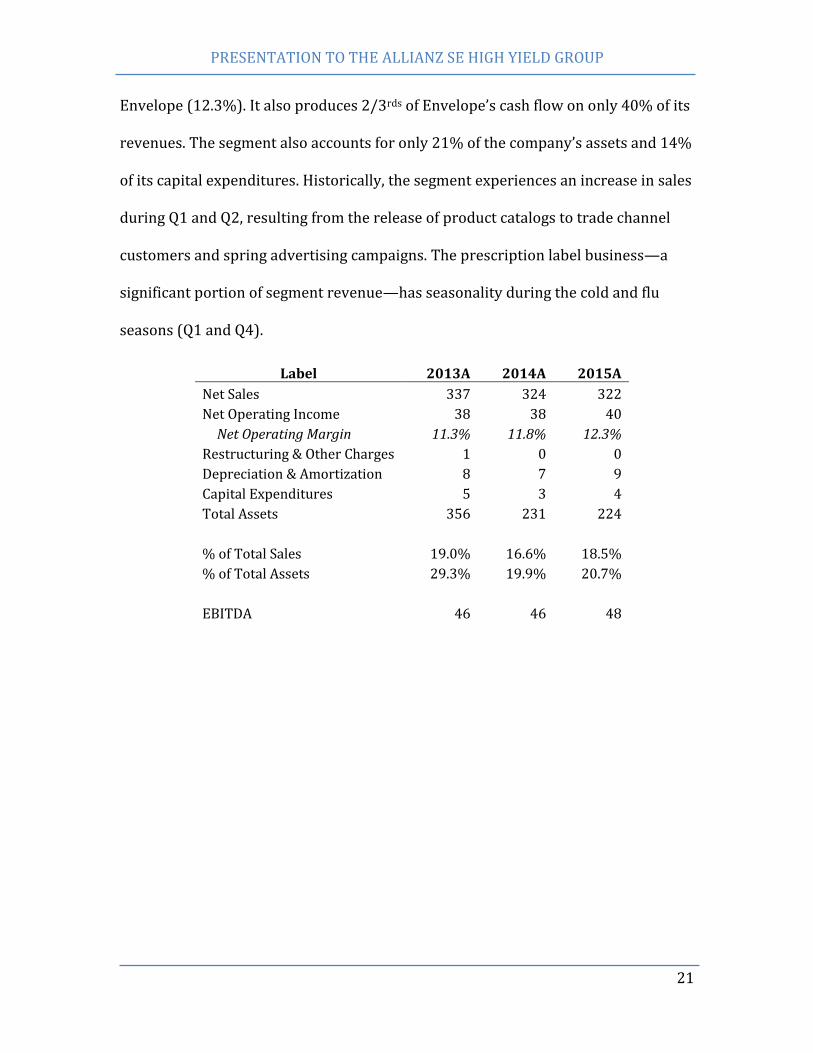
Label: This segment is the current bright spot among the three, projected at positive
5-year revenue growth in addition to operating margins a full 5% better than
PRESENTATION TO THE ALLIANZ SE HIGH YIELD GROUP
21
Envelope (12.3%). It also produces 2/3rds of Envelope’s cash flow on only 40% of its
revenues. The segment also accounts for only 21% of the company’s assets and 14%
of its capital expenditures. Historically, the segment experiences an increase in sales
during Q1 and Q2, resulting from the release of product catalogs to trade channel
customers and spring advertising campaigns. The prescription label business—a
significant portion of segment revenue—has seasonality during the cold and flu
seasons (Q1 and Q4).
Label 2013A 2014A 2015A
Net Sales 337 324 322
Net Operating Income 38 38 40
Net Operating Margin 11.3% 11.8% 12.3%
Restructuring & Other Charges 1 0 0
Depreciation & Amortization 8 7 9
Capital Expenditures 5 3 4
Total Assets 356 231 224
% of Total Sales 19.0% 16.6% 18.5%
% of Total Assets 29.3% 19.9% 20.7%
EBITDA 46 46 48
PRESENTATION TO THE ALLIANZ SE HIGH YIELD GROUP
22
Industry
Market Trends
Cenveo’s three segments traditionally fall within the following industries: Office
Stationery Manufacturing (or OSM, encompassing Envelopes), Print, and Packaging
& Labelling (PL).
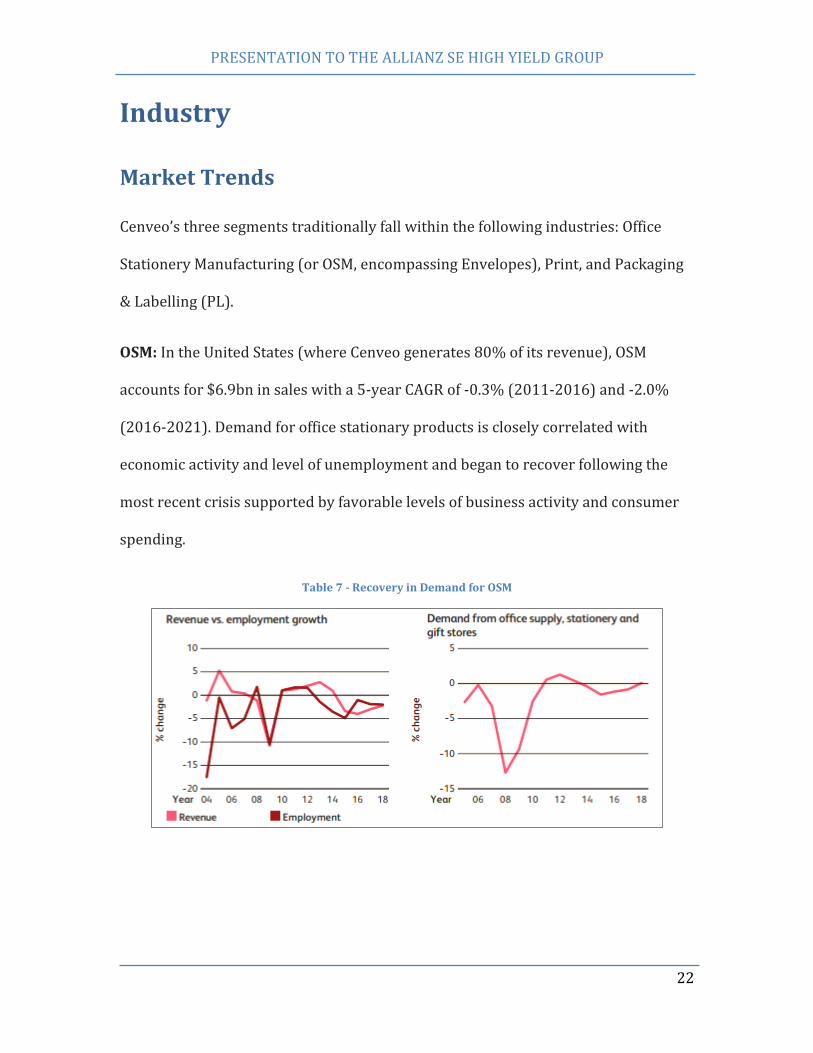
OSM: In the United States (where Cenveo generates 80% of its revenue), OSM
accounts for $6.9bn in sales with a 5-year CAGR of -0.3% (2011-2016) and -2.0%
(2016-2021). Demand for office stationary products is closely correlated with
economic activity and level of unemployment and began to recover following the
most recent crisis supported by favorable levels of business activity and consumer
spending.
Table 7 - Recovery in Demand for OSM
PRESENTATION TO THE ALLIANZ SE HIGH YIELD GROUP
23
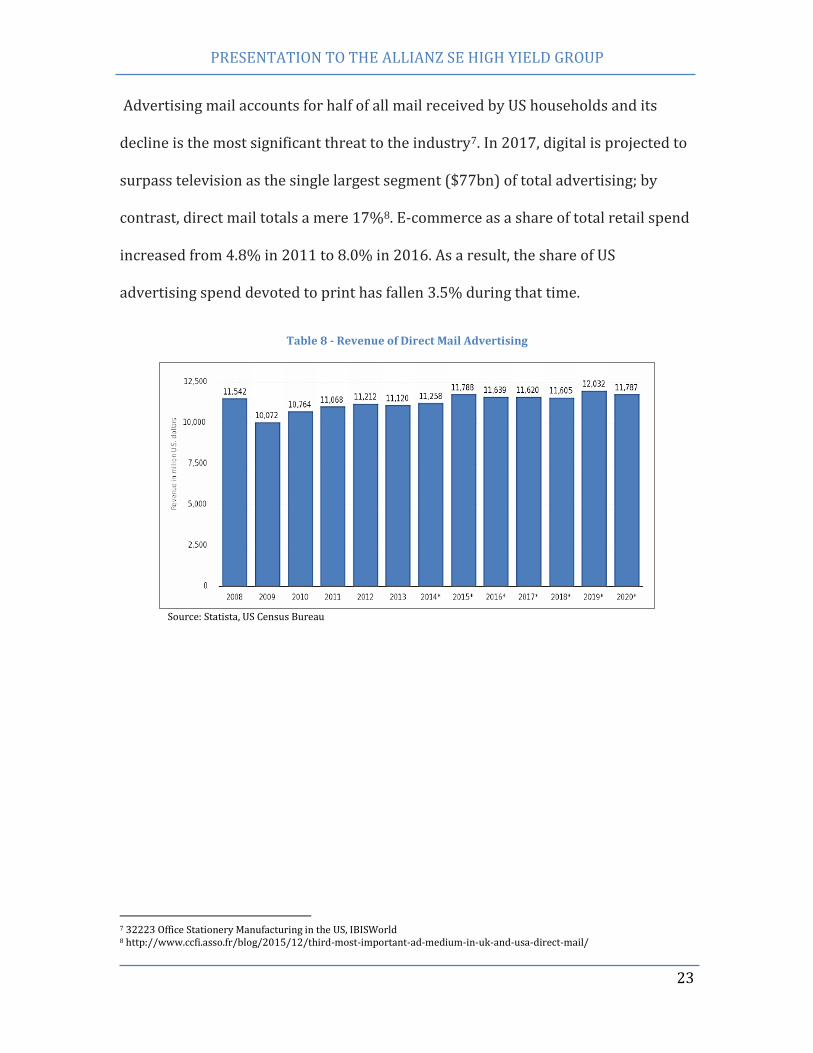
Advertising mail accounts for half of all mail received by US households and its
decline is the most significant threat to the industry7. In 2017, digital is projected to
surpass television as the single largest segment ($77bn) of total advertising; by
contrast, direct mail totals a mere 17%8. E-commerce as a share of total retail spend
increased from 4.8% in 2011 to 8.0% in 2016. As a result, the share of US
advertising spend devoted to print has fallen 3.5% during that time.
Table 8 - Revenue of Direct Mail Advertising
Source: Statista, US Census Bureau
7 32223 Office Stationery Manufacturing in the US, IBISWorld 8 http://www.ccfi.asso.fr/blog/2015/12/third-most-important-ad-medium-in-uk-and-usa-direct-mail/
PRESENTATION TO THE ALLIANZ SE HIGH YIELD GROUP
24
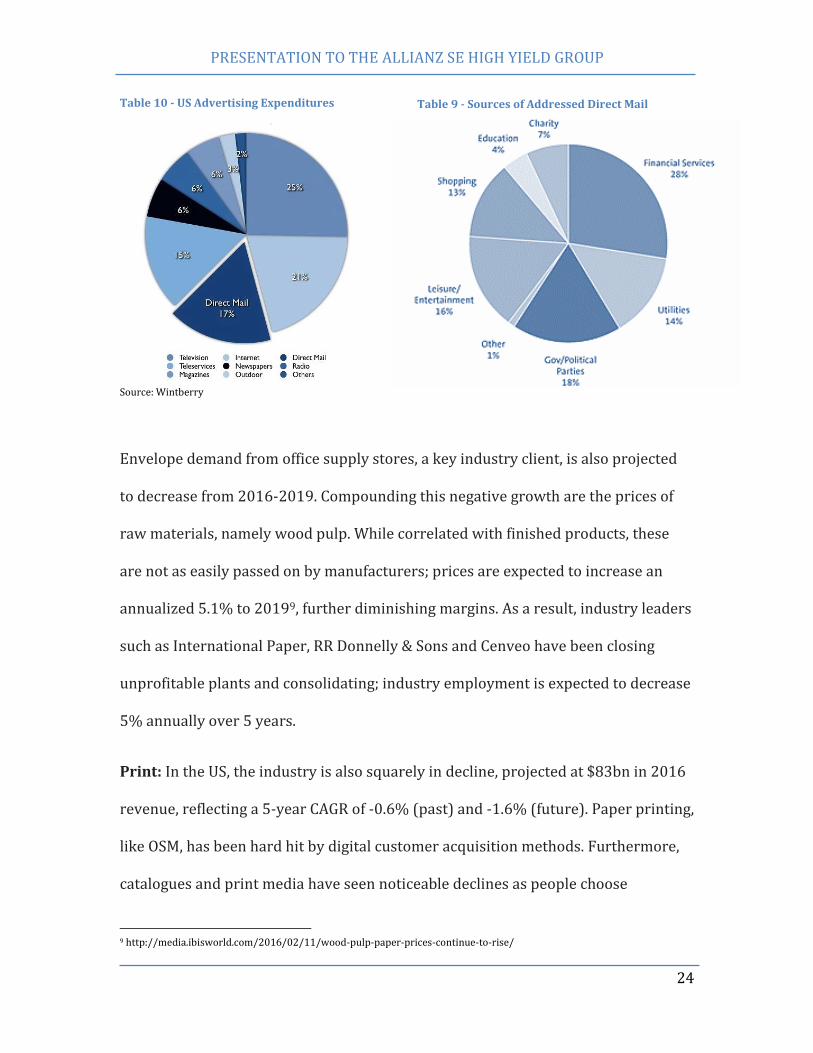
Table 10 - US Advertising Expenditures
Source: Wintberry
Envelope demand from office supply stores, a key industry client, is also projected
to decrease from 2016-2019. Compounding this negative growth are the prices of
raw materials, namely wood pulp. While correlated with finished products, these
are not as easily passed on by manufacturers; prices are expected to increase an
annualized 5.1% to 20199, further diminishing margins. As a result, industry leaders
such as International Paper, RR Donnelly & Sons and Cenveo have been closing
unprofitable plants and consolidating; industry employment is expected to decrease
5% annually over 5 years.
Print: In the US, the industry is also squarely in decline, projected at $83bn in 2016
revenue, reflecting a 5-year CAGR of -0.6% (past) and -1.6% (future). Paper printing,
like OSM, has been hard hit by digital customer acquisition methods. Furthermore,
catalogues and print media have seen noticeable declines as people choose
9 http://media.ibisworld.com/2016/02/11/wood-pulp-paper-prices-continue-to-rise/
Table 9 - Sources of Addressed Direct Mail
PRESENTATION TO THE ALLIANZ SE HIGH YIELD GROUP
25
paperless options in a nod to conservation. The sudden demand vacuum has left
excess capacity among the top printers (although their 76% utilization remains
above the 71% manufacturing average10) and resulted in prices averaging an
anemic 0.5% CAGR over the last 5 years.11
To counter these headwinds, printers are attempting to move down the supply
chain to creative and inventory services. Cenveo’s aforementioned Kadena is an
example of this trend, recently signing a 5-year deal to manage National Register
Publishing’s data products (contact lists and museum/financial directories)12;
Cenveo doesn’t release the product’s profitability information, however.
One lone tailwind that may see Cenveo pick up additional clients is the increasing
margin strain affecting newspaper and book publishers. Many of these may be
persuaded to forego the additional investment and outsource their printing needs to
commercial printers such as Cenveo.
PL: PL, unlike OSM and Print, follows consumer purchasing trends, especially in
North America. These have been favorable as of late as North American
consumption recovers from the 2008 recession. The pharmaceutical, food, and
military markets remain strong and annual growth in the $7.4bn US industry has
been 3.1% (2011-2016) and projected at 1.4% (2016-2021)13. Operations have
benefited from the technology boom as processes, especially in labeling, have
10 ISM Q4 2015 Report, U.S. Census Bureau 11 IBISWorld, Printing in the US Industry report, 2016. Bureau of Labor Statistics 12 http://www.prnewswire.com/news-releases/cenveo-announces-five-year-partnership-with-national-register-publishing-300228964.html 13 56191 Packaging & Labeling services in the US, IBISWorld
PRESENTATION TO THE ALLIANZ SE HIGH YIELD GROUP
26
become more automated. Such processes often require outsourcing to PL firms in an
arrangement called contract packaging, which is used by cosmetic and
pharmaceutical companies. The high level of automation leads to lower labor costs.
Larger producers do have scale advantages, however label capital intensity remains
below the overall economy and barriers to entry are low. Population trends and
increased pharmaceutical regulation have also worked in the industry’s favor.
Competitive Landscape
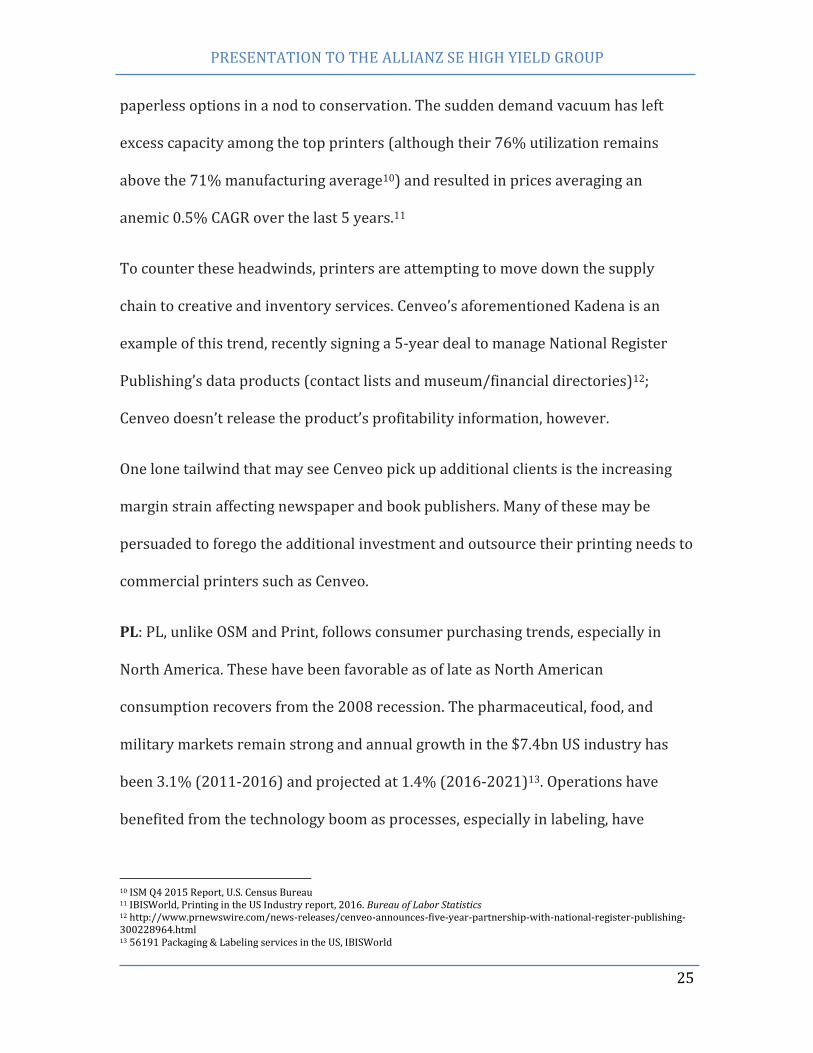
OSM: Cenveo generates the bulk of its revenue from its Envelope segment, the
largest operation in North America. Its Commercial Envelope Group produces 25%
of envelopes worldwide14 and controls more than 40% of the North American
envelope market15. Competition is fierce, yet capital intensity limits the number of
firms to ~500, with the top 4 controlling 50.7% of the market. Due to the industry’s
maturity, more and more production is occurring overseas, as companies such as
14 http://www.cenveo.com/Products-Services/Envelopes 15 2015 Annual Report, page 5
Figure 3 - OSM has undergone consolidation
International Paper, 27.2%
Cenveo, 12.6%
RR Donnelly & Sons, 5.5% ACCO, 5.4%
Other, 49.3%
PRESENTATION TO THE ALLIANZ SE HIGH YIELD GROUP
27
International Paper look for growth and lower costs in Brazil and China. The
appreciation of the dollar has hurt exports, however.
Cenveo’s biggest Envelope competitors are RR Donnelly, ACCO, Supremex, and
International Paper. RR Donnelly in particular is structured quite similarly to
Cenveo, with both OSM and Commercial Print operations. However, RR Donnelly is
splitting into 3 separate businesses to free up higher-growth divisions; a restrictive
capital structure and debt covenants limit Cenveo’s annual capital expenditure to
$45mm. Its competitors haven’t pulled back, though: ACCO acquired
MeadWestvaco’s Office Products division (2012, $860mm) and RR Donnelly
acquired Esselte’s North American operations (2014, $97mm).
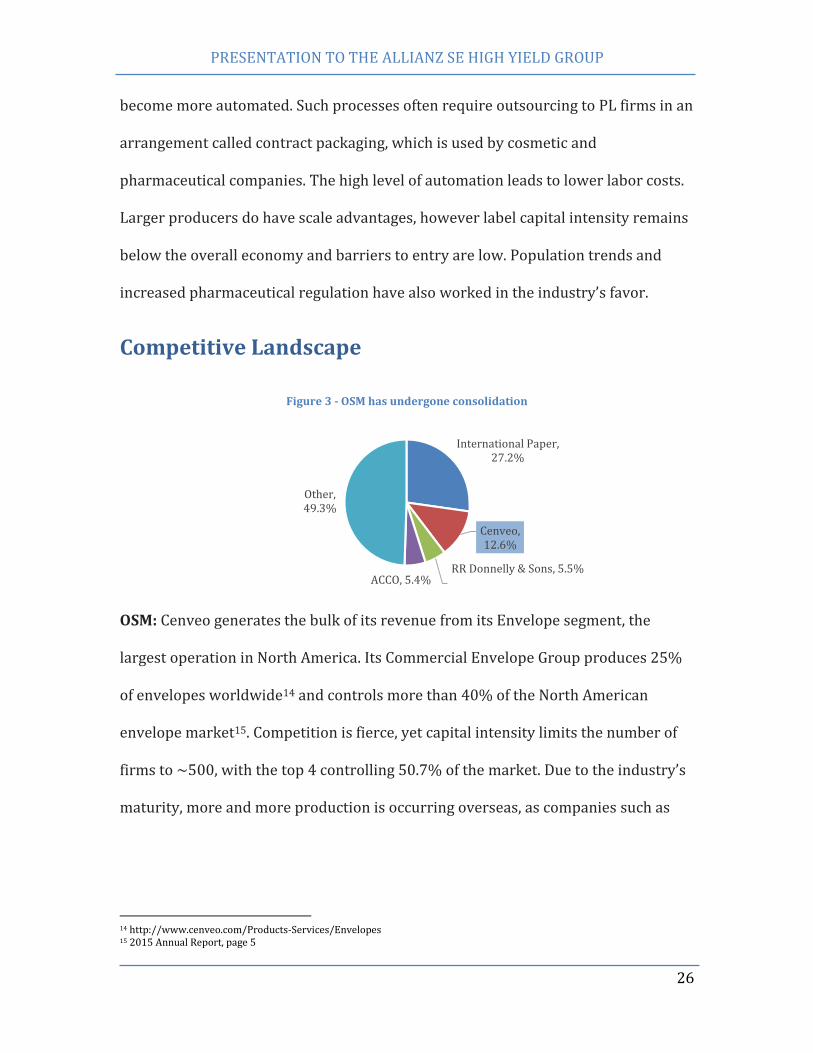
Commercial Printing: Since print client service generally occurs within a 100- to
300-mile radius, U.S. competition is fragmented and intense. In 2016, there were an
estimated 49,000 printers (mostly private) generating $3.5mm in average revenue.
Cenveo is the third-largest16 US-based provider of print and related services, trailing
the aforementioned R.R. Donnelly & Sons and Quad-Graphics, which specializes in
catalogue and magazine printing. Other competitors include Ennis, which
16 IBISWorld, Printing Impressions trade magazine
R.R. Donnelly & Sons, 7.7%
Quad/Graphics, 4.3%
Deluxe, 1.3%
Cenveo, 0.6%
Other, 86.1%
Table 11 - Commercial Printing Market Share
PRESENTATION TO THE ALLIANZ SE HIGH YIELD GROUP
28
specializes in advertising and business forms, and Deluxe, which controls over 50%
of the U.S. check-printing market.17
Fragmentation has led to an uptick in M&A: RR Donnelly acquired Consolidated
Graphics (2014, $620mm)18 to bolster print market share and Quad/Graphics
acquired Brown Printing (2014, $100mm)19 to expand its magazine capabilities.
PL: Cenveo’s decision to sell its packaging business to WestRock (2016, $105mm)
was a conscious pivot out of the packaging component of PL. The Company remains,
however, the largest North American pharmacy prescription label manufacturer.
PL’s main player is packaging giant Sonoco, which controls 21.1% of the market.
Other competitors include Berkeley (cosmetic packaging) and Aldelano (display.
While industry experts expect consolidation in the label space, there hasn’t been
much significant activity other than CCL’s acquisitions of Worldmark (2015,
$191mm) and Avery Dennison OCP (2013, $500mm) and Sonoco’s acquisition of
Tegrant (2011, $550mm).
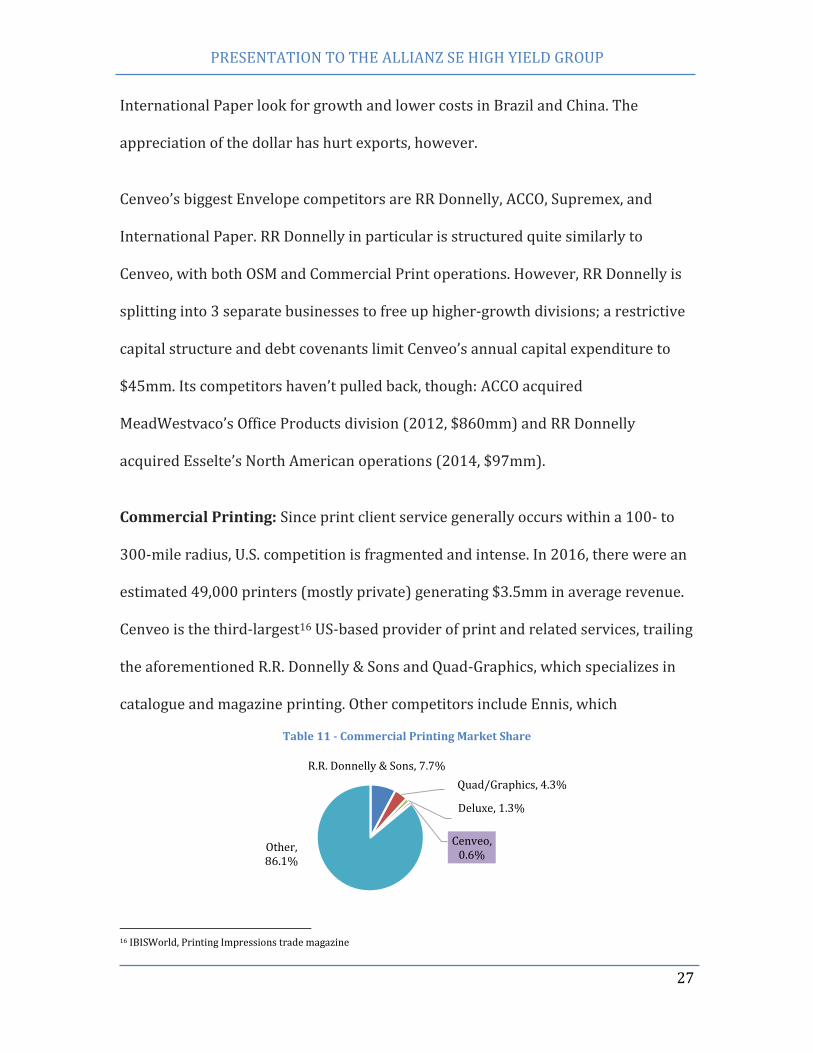
Table 12 - Cenveo is in more dire straits than its competitors
Revenues
($mm) Sales
Growth
Free Cash Flow
($mm) EBITDA Margin
Debt as %
of Assets Debt /
EBITDA
Cenveo $1,742 (10.6%) $6.3 8.4% 111.9% 8.7x
RR Donnelly & Sons $11,257 (3.0%) $444.4 10.3% 47.0% 2.9x
Quad/Graphics $4,731 (2.7%) $215.1 11.1% 47.6% 2.6x
International Paper $22,365 (5.3%) $1,093.0 10.9% 30.5% 2.5x
ACCO $1,510 (10.6%) $143.6 1.4% 36.9% 3.5x
Deluxe $1,773 5.9% $264.7 25.6% 34.2% 1.4x
Ennis $569 (1.9%) $32.6 11.4% 10.2% 2.9x
17 https://archive.org/stream/deluxessolventfr00mass/deluxessolventfr00mass_djvu.txt, Commonwealth of Massachusetts 18 http://www.piworld.com/article/rr-donnelley-acquire-consolidated-graphics-620-million-plus-debt/ 19 http://investors.qg.com/phoenix.zhtml?c=231687&p=irol-newsArticle&ID=1916134
PRESENTATION TO THE ALLIANZ SE HIGH YIELD GROUP
29
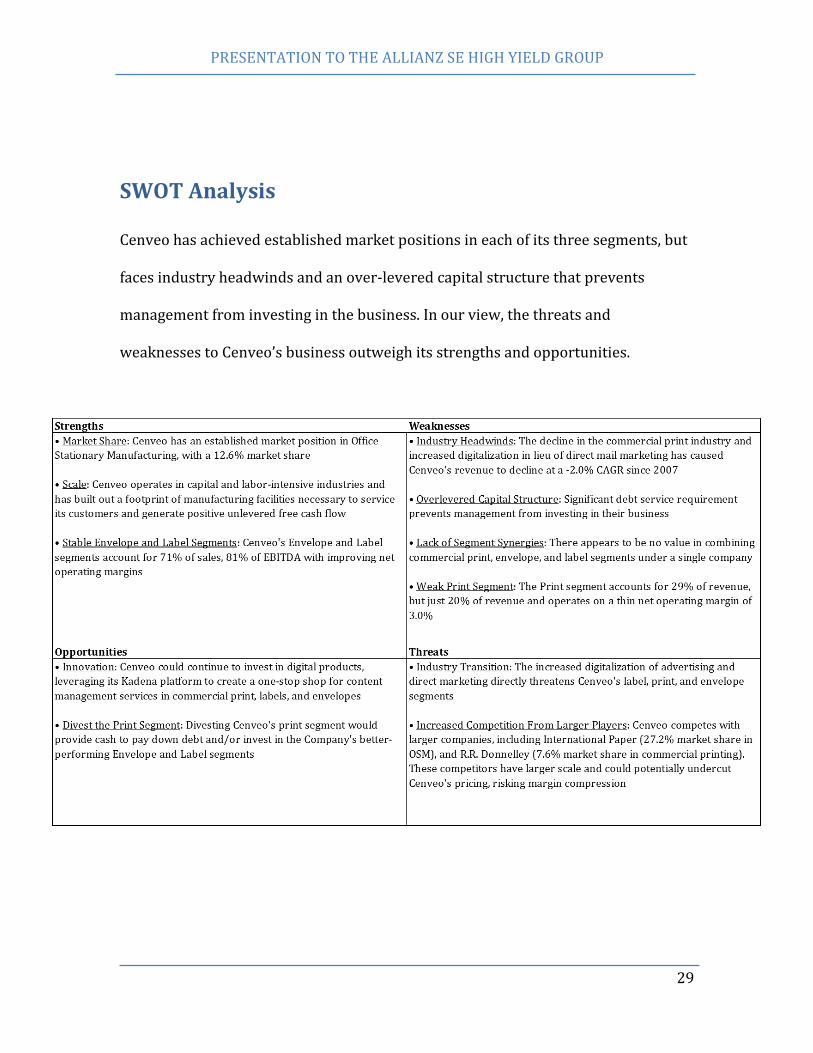
SWOT Analysis
Cenveo has achieved established market positions in each of its three segments, but
faces industry headwinds and an over-levered capital structure that prevents
management from investing in the business. In our view, the threats and
weaknesses to Cenveo’s business outweigh its strengths and opportunities.
PRESENTATION TO THE ALLIANZ SE HIGH YIELD GROUP
30
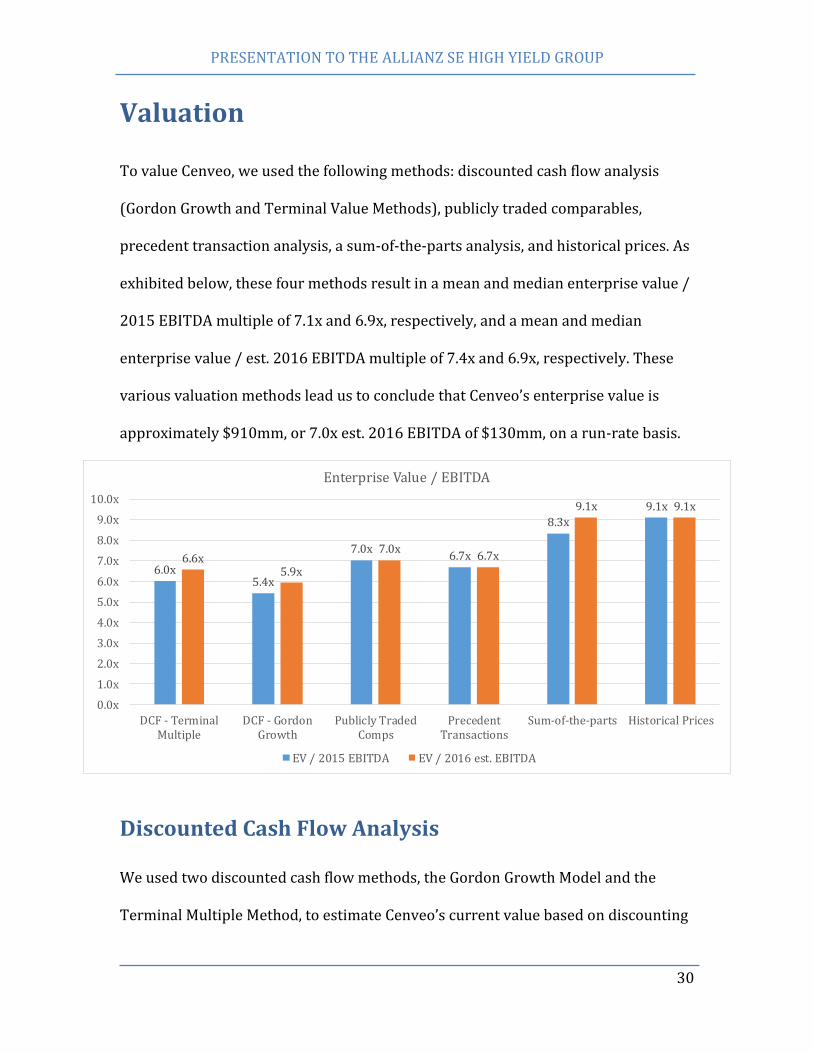
Valuation
To value Cenveo, we used the following methods: discounted cash flow analysis
(Gordon Growth and Terminal Value Methods), publicly traded comparables,
precedent transaction analysis, a sum-of-the-parts analysis, and historical prices. As
exhibited below, these four methods result in a mean and median enterprise value /
2015 EBITDA multiple of 7.1x and 6.9x, respectively, and a mean and median
enterprise value / est. 2016 EBITDA multiple of 7.4x and 6.9x, respectively. These
various valuation methods lead us to conclude that Cenveo’s enterprise value is
approximately $910mm, or 7.0x est. 2016 EBITDA of $130mm, on a run-rate basis.
Discounted Cash Flow Analysis
We used two discounted cash flow methods, the Gordon Growth Model and the
Terminal Multiple Method, to estimate Cenveo’s current value based on discounting
6.0x5.4x
7.0x6.7x
8.3x
9.1x
6.6x5.9x
7.0x6.7x
9.1x 9.1x
0.0x
1.0x
2.0x
3.0x
4.0x
5.0x
6.0x
7.0x
8.0x
9.0x
10.0x
DCF - TerminalMultiple
DCF - GordonGrowth
Publicly TradedComps
PrecedentTransactions
Sum-of-the-parts Historical Prices
Enterprise Value / EBITDA
EV / 2015 EBITDA EV / 2016 est. EBITDA
PRESENTATION TO THE ALLIANZ SE HIGH YIELD GROUP
31
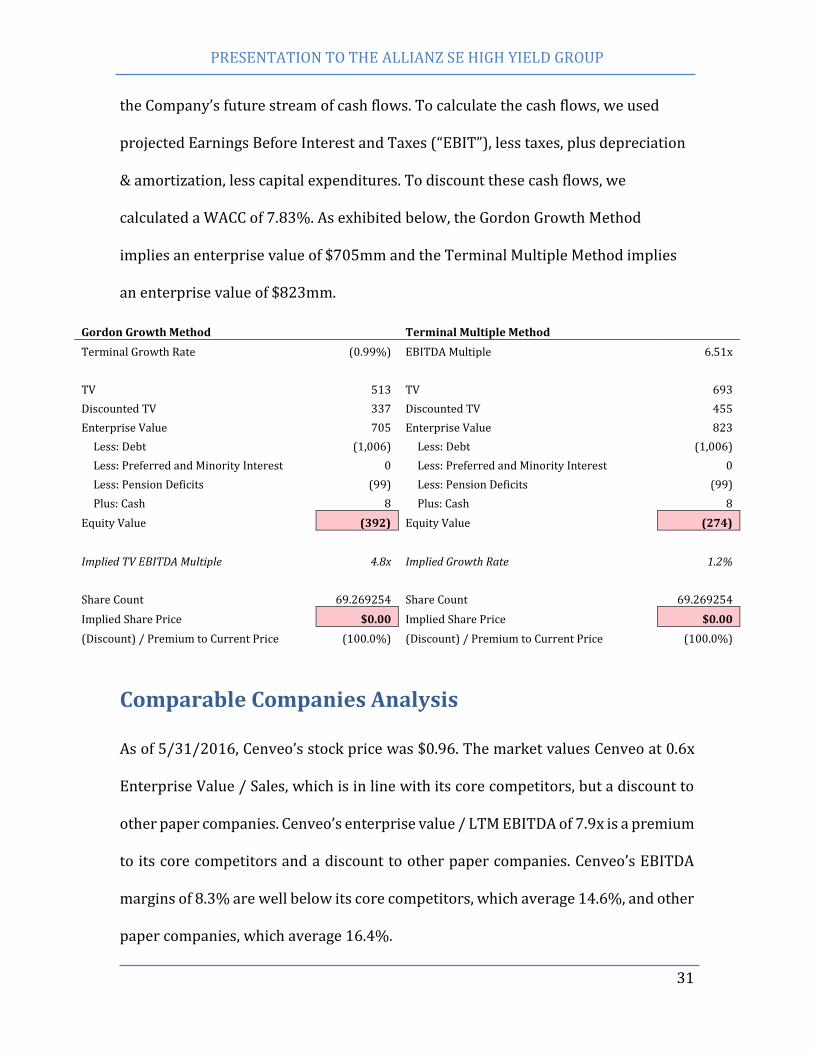
the Company’s future stream of cash flows. To calculate the cash flows, we used
projected Earnings Before Interest and Taxes (“EBIT”), less taxes, plus depreciation
& amortization, less capital expenditures. To discount these cash flows, we
calculated a WACC of 7.83%. As exhibited below, the Gordon Growth Method
implies an enterprise value of $705mm and the Terminal Multiple Method implies
an enterprise value of $823mm.
Gordon Growth Method Terminal Multiple Method
Terminal Growth Rate (0.99%) EBITDA Multiple 6.51x
TV 513 TV 693
Discounted TV 337 Discounted TV 455
Enterprise Value 705 Enterprise Value 823
Less: Debt (1,006) Less: Debt (1,006)
Less: Preferred and Minority Interest 0 Less: Preferred and Minority Interest 0
Less: Pension Deficits (99) Less: Pension Deficits (99)
Plus: Cash 8 Plus: Cash 8
Equity Value (392) Equity Value (274)
Implied TV EBITDA Multiple 4.8x Implied Growth Rate 1.2%
Share Count 69.269254 Share Count 69.269254
Implied Share Price $0.00 Implied Share Price $0.00
(Discount) / Premium to Current Price (100.0%) (Discount) / Premium to Current Price (100.0%)
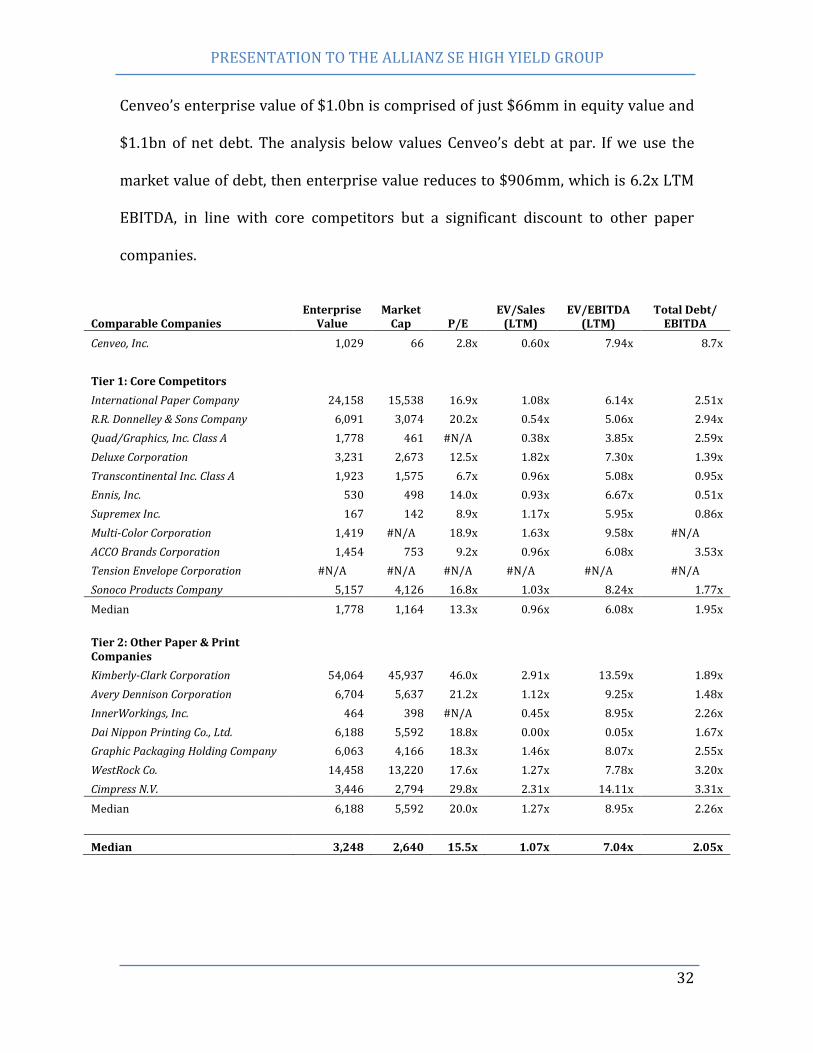
Comparable Companies Analysis
As of 5/31/2016, Cenveo’s stock price was $0.96. The market values Cenveo at 0.6x
Enterprise Value / Sales, which is in line with its core competitors, but a discount to
other paper companies. Cenveo’s enterprise value / LTM EBITDA of 7.9x is a premium
to its core competitors and a discount to other paper companies. Cenveo’s EBITDA
margins of 8.3% are well below its core competitors, which average 14.6%, and other
paper companies, which average 16.4%.
PRESENTATION TO THE ALLIANZ SE HIGH YIELD GROUP
32
Cenveo’s enterprise value of $1.0bn is comprised of just $66mm in equity value and
$1.1bn of net debt. The analysis below values Cenveo’s debt at par. If we use the
market value of debt, then enterprise value reduces to $906mm, which is 6.2x LTM
EBITDA, in line with core competitors but a significant discount to other paper
companies.
Comparable Companies Enterprise
Value Market
Cap P/E EV/Sales
(LTM) EV/EBITDA
(LTM) Total Debt/
EBITDA
Cenveo, Inc. 1,029 66 2.8x 0.60x 7.94x 8.7x
Tier 1: Core Competitors
International Paper Company 24,158 15,538 16.9x 1.08x 6.14x 2.51x
R.R. Donnelley & Sons Company 6,091 3,074 20.2x 0.54x 5.06x 2.94x
Quad/Graphics, Inc. Class A 1,778 461 #N/A 0.38x 3.85x 2.59x
Deluxe Corporation 3,231 2,673 12.5x 1.82x 7.30x 1.39x
Transcontinental Inc. Class A 1,923 1,575 6.7x 0.96x 5.08x 0.95x
Ennis, Inc. 530 498 14.0x 0.93x 6.67x 0.51x
Supremex Inc. 167 142 8.9x 1.17x 5.95x 0.86x
Multi-Color Corporation 1,419 #N/A 18.9x 1.63x 9.58x #N/A
ACCO Brands Corporation 1,454 753 9.2x 0.96x 6.08x 3.53x
Tension Envelope Corporation #N/A #N/A #N/A #N/A #N/A #N/A
Sonoco Products Company 5,157 4,126 16.8x 1.03x 8.24x 1.77x
Median 1,778 1,164 13.3x 0.96x 6.08x 1.95x
Tier 2: Other Paper & Print Companies
Kimberly-Clark Corporation 54,064 45,937 46.0x 2.91x 13.59x 1.89x
Avery Dennison Corporation 6,704 5,637 21.2x 1.12x 9.25x 1.48x
InnerWorkings, Inc. 464 398 #N/A 0.45x 8.95x 2.26x
Dai Nippon Printing Co., Ltd. 6,188 5,592 18.8x 0.00x 0.05x 1.67x
Graphic Packaging Holding Company 6,063 4,166 18.3x 1.46x 8.07x 2.55x
WestRock Co. 14,458 13,220 17.6x 1.27x 7.78x 3.20x
Cimpress N.V. 3,446 2,794 29.8x 2.31x 14.11x 3.31x
Median 6,188 5,592 20.0x 1.27x 8.95x 2.26x
Median 3,248 2,640 15.5x 1.07x 7.04x 2.05x
PRESENTATION TO THE ALLIANZ SE HIGH YIELD GROUP
33
Publicly traded comparables suggest that Cenveo, as a going concern, should be
valued at 7.0x enterprise value / est. 2016 EBITDA, or $910mm.
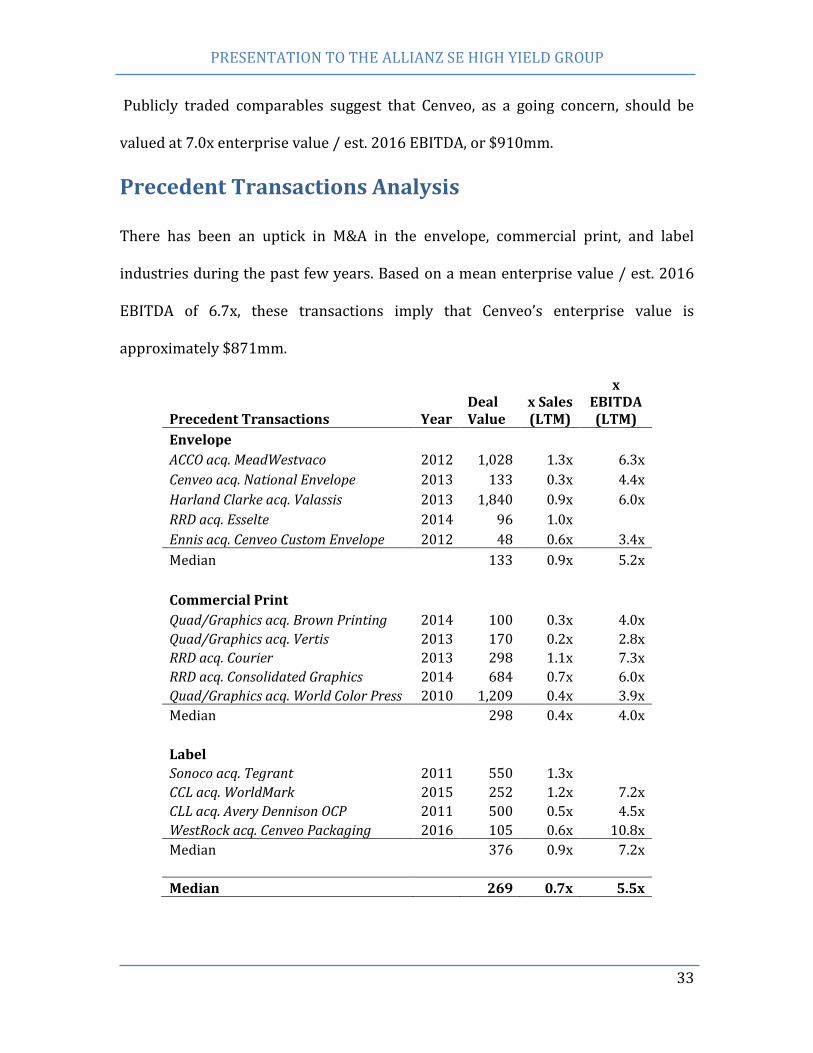
Precedent Transactions Analysis
There has been an uptick in M&A in the envelope, commercial print, and label
industries during the past few years. Based on a mean enterprise value / est. 2016
EBITDA of 6.7x, these transactions imply that Cenveo’s enterprise value is
approximately $871mm.
Precedent Transactions Year Deal Value
x Sales (LTM)
x EBITDA (LTM)
Envelope
ACCO acq. MeadWestvaco 2012 1,028 1.3x 6.3x
Cenveo acq. National Envelope 2013 133 0.3x 4.4x
Harland Clarke acq. Valassis 2013 1,840 0.9x 6.0x
RRD acq. Esselte 2014 96 1.0x
Ennis acq. Cenveo Custom Envelope 2012 48 0.6x 3.4x
Median 133 0.9x 5.2x
Commercial Print
Quad/Graphics acq. Brown Printing 2014 100 0.3x 4.0x
Quad/Graphics acq. Vertis 2013 170 0.2x 2.8x
RRD acq. Courier 2013 298 1.1x 7.3x
RRD acq. Consolidated Graphics 2014 684 0.7x 6.0x
Quad/Graphics acq. World Color Press 2010 1,209 0.4x 3.9x
Median 298 0.4x 4.0x
Label
Sonoco acq. Tegrant 2011 550 1.3x
CCL acq. WorldMark 2015 252 1.2x 7.2x
CLL acq. Avery Dennison OCP 2011 500 0.5x 4.5x
WestRock acq. Cenveo Packaging 2016 105 0.6x 10.8x
Median 376 0.9x 7.2x
Median 269 0.7x 5.5x
PRESENTATION TO THE ALLIANZ SE HIGH YIELD GROUP
34
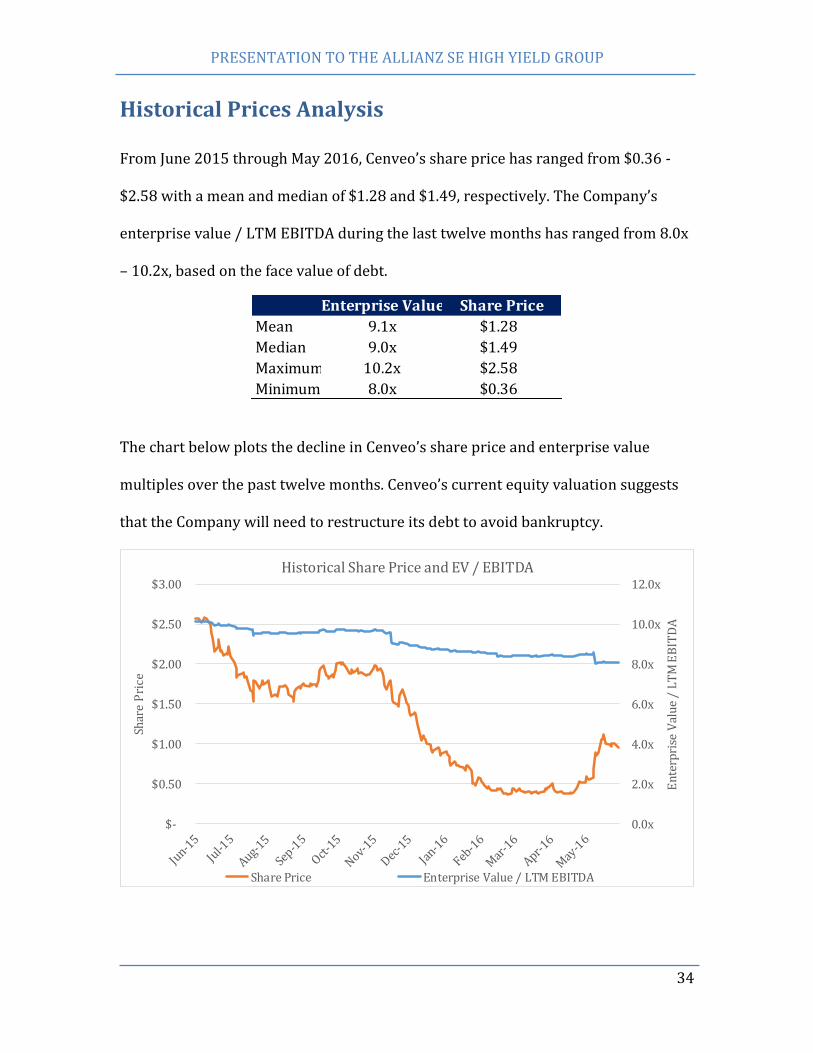
Historical Prices Analysis
From June 2015 through May 2016, Cenveo’s share price has ranged from $0.36 -
$2.58 with a mean and median of $1.28 and $1.49, respectively. The Company’s
enterprise value / LTM EBITDA during the last twelve months has ranged from 8.0x
– 10.2x, based on the face value of debt.
The chart below plots the decline in Cenveo’s share price and enterprise value
multiples over the past twelve months. Cenveo’s current equity valuation suggests
that the Company will need to restructure its debt to avoid bankruptcy.
0.0x
2.0x
4.0x
6.0x
8.0x
10.0x
12.0x
$-
$0.50
$1.00
$1.50
$2.00
$2.50
$3.00
En
terp
rise
Val
ue
/ L
TM
EB
ITD
A
Shar
e P
rice
Historical Share Price and EV / EBITDA
Share Price Enterprise Value / LTM EBITDA
Enterprise Value Share Price
Mean 9.1x $1.28
Median 9.0x $1.49
Maximum 10.2x $2.58
Minimum 8.0x $0.36
PRESENTATION TO THE ALLIANZ SE HIGH YIELD GROUP
35
Sum-of-the-Parts Analysis
Cenveo operates three distinct segments: envelope, commercial print, and label, each
with their own intrinsic value. Therefore, we thought it useful to conduct a sum-of-
the-parts analysis on each segment. We valued the envelope segment at 6.1x
enterprise value / EBITDA and the label segment at 8.9x enterprise value / EBITDA.
We recommend divesting the commercial print segment, which we believe would
yield a sale price of $146mm, or 4.9x estimated 2016 commercial print segment
EBITDA of $30mm. Adding up the value of each segment yields an implied enterprise
value of $1.2bn, or 9.1x enterprise value / est. 2016 EBITDA.
PRESENTATION TO THE ALLIANZ SE HIGH YIELD GROUP
36
Plan of Reorganization
Key Challenges to Financial Restructuring While Allianz is invested throughout the capital structure,20 some its largest
positions are in second lien and unsecured debt. We believe that liquidation under
Chapter 11 would significantly jeopardize Allianz’s more-junior positions. Allianz
would be better able to negotiate more equity for its junior debt by leveraging its
current investment in Cenveo rather than negotiating with senior creditors during
bankruptcy.
First Lien Creditors - Allianz’s loan-to-own strategy must address the
conflict that often arises between senior creditors, who may be more inclined
to impose liquidation, and junior creditors, who hope to receive equity in the
restructured company. In Cenveo’s case, first lien creditors have significant
bargaining power because they are covered in a liquidation scenario based
on our valuation in addition to holding the nearest maturity. With significant
concentrations of second lien and unsecured notes, Allianz would likely cede
any influence it had over the reorganization process to the first lien holders
in a Chapter 11 scenario.21
Second Lien Creditors – Allianz must convince the remaining second lien
creditors who may believe that they will receive a better package in Chapter
20 Its $50mm Secured Note is classified as an ABL 21 Academic research shows that, for companies reorganizing in bankruptcy, senior creditors exhibit “pervasive” control through the reorganization process with equity-holders and managers exerting little to no leverage. However, the “zone of insolvency” theory has been recently by Delaware Chancery courts. Cenveo is incorporated in Colorado. “Creditor Control and Conflict in Chapter 11”, Kenneth Ayotte and Edward Morrison, 2009
PRESENTATION TO THE ALLIANZ SE HIGH YIELD GROUP
37
11, especially if they become the fulcrum security. In bankruptcy, second lien
holders will not be inclined to distribute a significant amount of equity to
creditors holding unsecured debt, of which Allianz owns ~$72mm.
Cenveo Management/Board - The Burton family still has significant control
over Cenveo operations, including whether to sell existing business lines or
how best to pay back its creditors. They also present legal risks to Allianz.
Holders of distressed debt acquired in the open market are increasingly
becoming the target of litigation for fraudulent transfer/preference claims,
recharacterization of debt to equity, equitable subordination and breach of
fiduciary duty22.
Board Control
Key to any reorganization will be Allianz’s ability to influence the process,
potentially contrary to the wishes of the current Burton-controlled board. It is thus
essential that Allianz seek control in 2 ways:
1.
a. Ally with creditors that have significant equity stakes. Hedge fund
Rotation Capital Management is an example of such a holder, with
6.1% equity. These creditors likely wish to see a swift and sustainable
resolution to debt issues, which is one of the reasons they may have
purchased an equity stake in the first place. They are also likely to
22 The pending bankruptcy of The Dolan Company in Delaware demonstrates how an equity committee can hold up the process by claiming the “excessive fees,” “reduced availability,” “management control” and “lender coercion” on the part of creditors. http://www.natlawreview.com/article/attacks-loan-to-own-strategies-continue
PRESENTATION TO THE ALLIANZ SE HIGH YIELD GROUP
38
have purchased their position below par, which would make them
more likely to agree to a quick, painless restructuring to ensure
profitable exit.
b. Exercise its warrants and purchase equity on the open market. With
warrants struck at approximately $0.50 above market price, it would
cost Allianz an additional $4.3mm to achieve its 28.4% stake. That
plus Rotation’s portion leaves ~14% equity to achieve a majority
equity position, which can be had at a minimal cost given recent stock
declines.
2. Given Allianz’s past cordial relationship with the Burtons (as demonstrated
by its most recent debt exchange), we believe a more likely scenario is a
Burton family more amenable to Allianz recommendations as they recognize
the inevitable restructuring. In return, Allianz can offer a minimal post-
restructuring portion of the equity (less than it would cost them in option
#1). Furthermore, our recommendation would likely pass the “business
judgment” test required by a board’s fiduciary standard.
Operational Improvements
Once Allianz board control is secure, there are 3 operational improvements to
achieve:
1. Management led by Robert Burton has focused on low-growth segments
(envelope, print) in an ‘empire-building’ strategy to achieve rational pricing
and economies of scale. This strategy has been haphazard at best: From
PRESENTATION TO THE ALLIANZ SE HIGH YIELD GROUP
39
2005-2011, Cenveo acquired 13 companies with a variety of brands and
niche products to “enhance our existing global packaging network” and
“expand our reach.23” The Company then turned around and sold those
businesses to “focus on core operations.” Burton also divested segments like
Custom Envelope to a competitor (Ennis) in 2012 only to rebuild virtually
the same group in-house from 2014-2016. In the meantime, Cenveo has
experienced no improved pricing power or margins and the stock has fallen
87%.
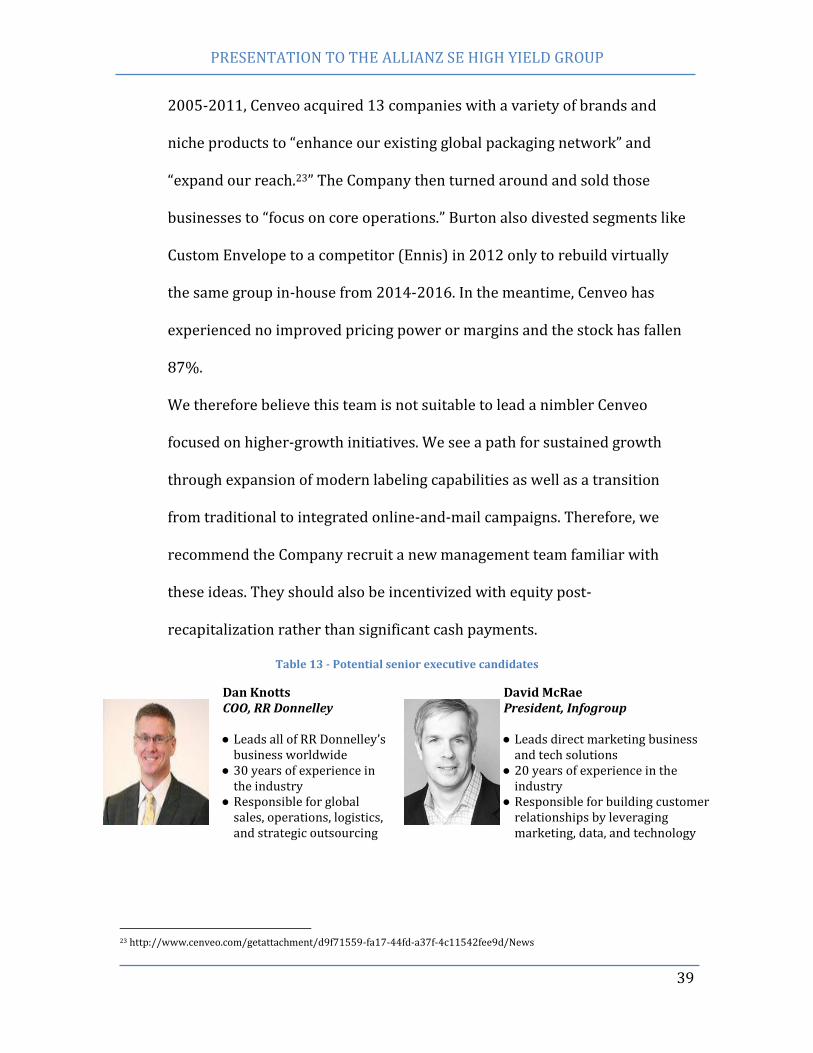
We therefore believe this team is not suitable to lead a nimbler Cenveo
focused on higher-growth initiatives. We see a path for sustained growth
through expansion of modern labeling capabilities as well as a transition
from traditional to integrated online-and-mail campaigns. Therefore, we
recommend the Company recruit a new management team familiar with
these ideas. They should also be incentivized with equity post-
recapitalization rather than significant cash payments.
Table 13 - Potential senior executive candidates
Dan Knotts COO, RR Donnelley ● Leads all of RR Donnelley’s
business worldwide ● 30 years of experience in
the industry ● Responsible for global
sales, operations, logistics, and strategic outsourcing
David McRae President, Infogroup ● Leads direct marketing business
and tech solutions ● 20 years of experience in the
industry ● Responsible for building customer
relationships by leveraging marketing, data, and technology
23 http://www.cenveo.com/getattachment/d9f71559-fa17-44fd-a37f-4c11542fee9d/News
PRESENTATION TO THE ALLIANZ SE HIGH YIELD GROUP
40
2. Kadena, Cenveo’s fledgling online content-management platform, is currently
used by printing clients such as National Register Publishing to manage their
product design and manufacture. We believe Kadena can be used more
effectively to control entire marketing campaigns. We recommend Cenveo
cross-sell clients on using the platform to combine their existing social media
efforts with direct-mail to create multiple points of contact with customers.
For example, a client like American Airlines would find Kadena particularly
well-suited to monitor credit card customer leads through social media
mileage incentives and then follow up with a direct-mail application
individually tailored to the customer’s travel profile.
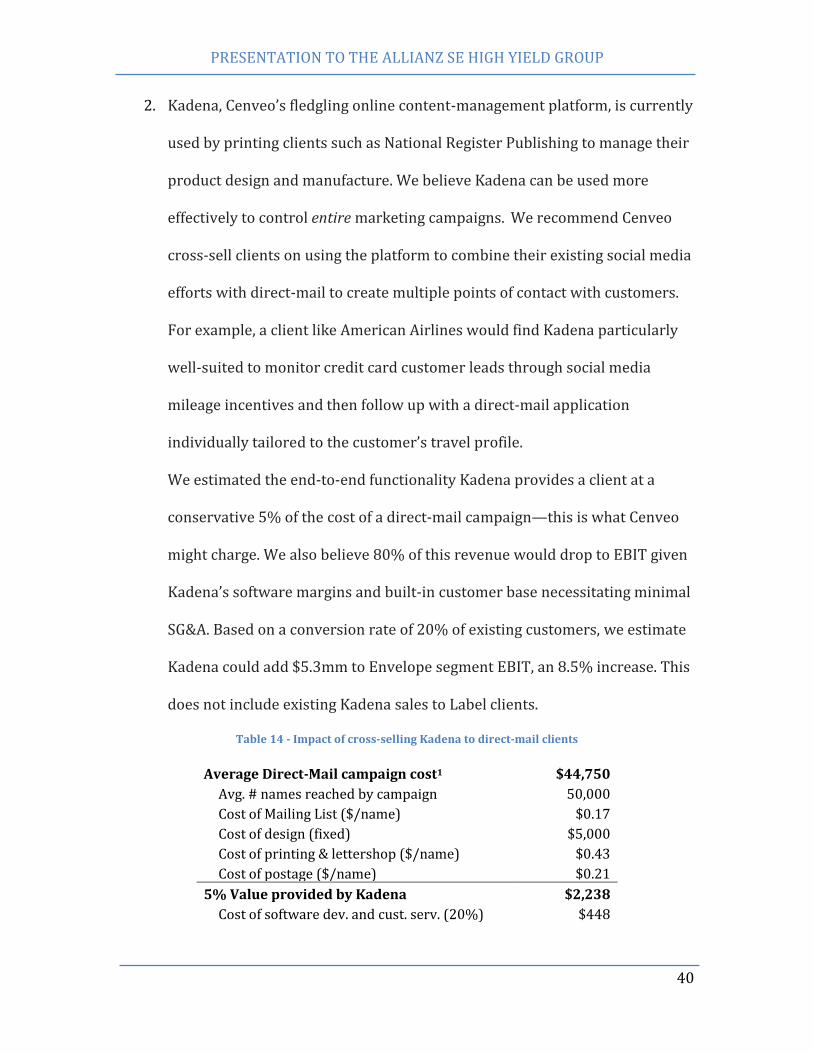
We estimated the end-to-end functionality Kadena provides a client at a
conservative 5% of the cost of a direct-mail campaign—this is what Cenveo
might charge. We also believe 80% of this revenue would drop to EBIT given
Kadena’s software margins and built-in customer base necessitating minimal
SG&A. Based on a conversion rate of 20% of existing customers, we estimate
Kadena could add $5.3mm to Envelope segment EBIT, an 8.5% increase. This
does not include existing Kadena sales to Label clients.
Table 14 - Impact of cross-selling Kadena to direct-mail clients
Average Direct-Mail campaign cost1 $44,750
Avg. # names reached by campaign 50,000
Cost of Mailing List ($/name) $0.17
Cost of design (fixed) $5,000
Cost of printing & lettershop ($/name) $0.43
Cost of postage ($/name) $0.21
5% Value provided by Kadena $2,238
Cost of software dev. and cust. serv. (20%) $448
PRESENTATION TO THE ALLIANZ SE HIGH YIELD GROUP
41
Cenveo Direct-Mail contract jobs (2016E) 14,933
# Kadena jobs (20% conversion) 2,987
Kadena Contribution $5,346,000
1: David R. Yale, Direct Marketer: "ControlBeaters" estimates)
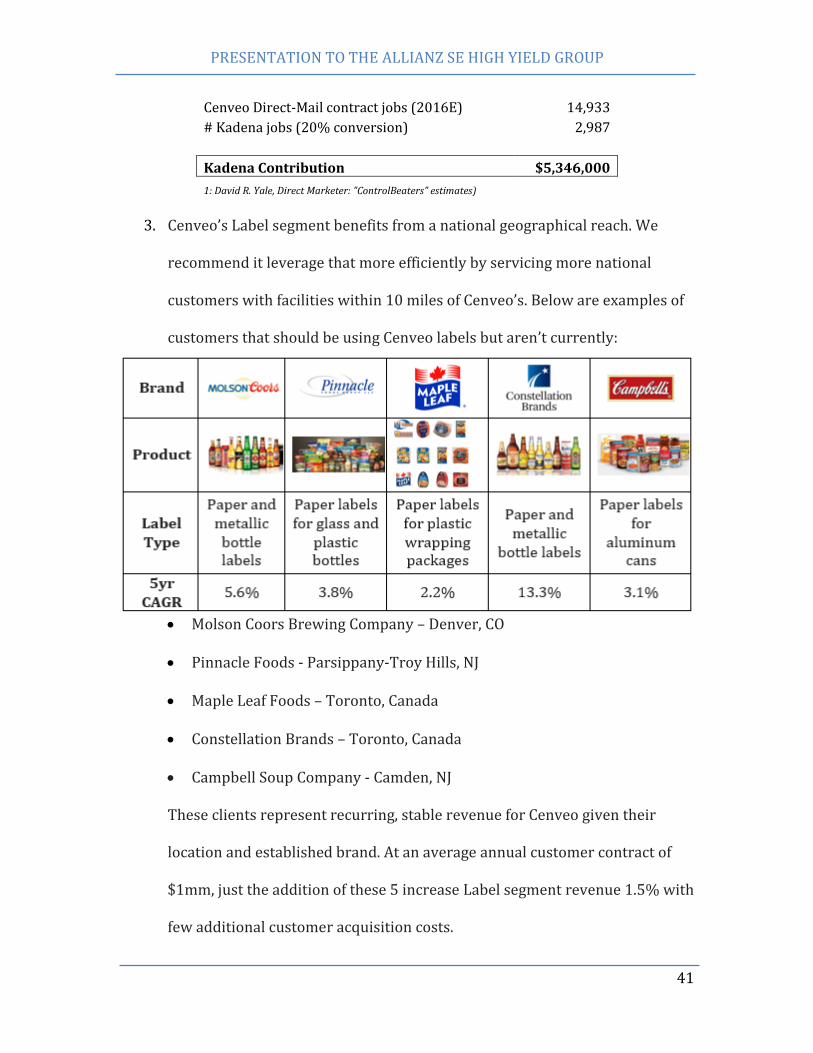
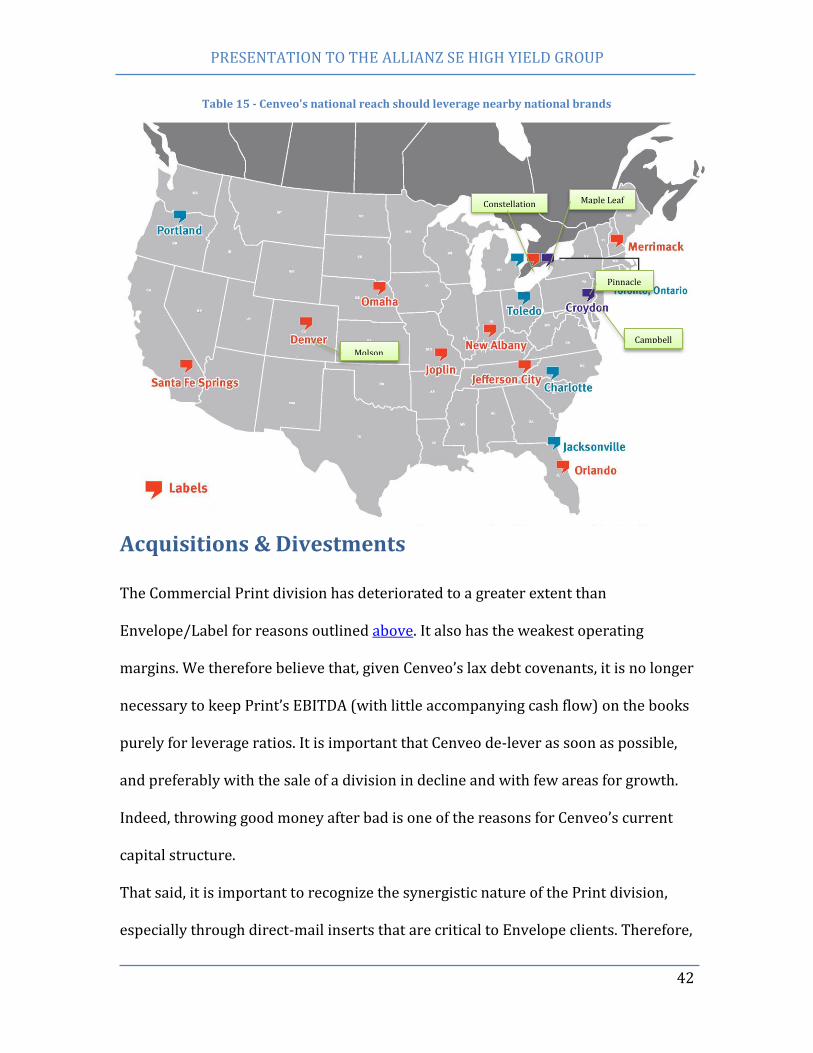
3. Cenveo’s Label segment benefits from a national geographical reach. We
recommend it leverage that more efficiently by servicing more national
customers with facilities within 10 miles of Cenveo’s. Below are examples of
customers that should be using Cenveo labels but aren’t currently:
Molson Coors Brewing Company – Denver, CO
Pinnacle Foods - Parsippany-Troy Hills, NJ
Maple Leaf Foods – Toronto, Canada
Constellation Brands – Toronto, Canada
Campbell Soup Company - Camden, NJ
These clients represent recurring, stable revenue for Cenveo given their
location and established brand. At an average annual customer contract of
$1mm, just the addition of these 5 increase Label segment revenue 1.5% with
few additional customer acquisition costs.
PRESENTATION TO THE ALLIANZ SE HIGH YIELD GROUP
42
Acquisitions & Divestments
The Commercial Print division has deteriorated to a greater extent than
Envelope/Label for reasons outlined above. It also has the weakest operating
margins. We therefore believe that, given Cenveo’s lax debt covenants, it is no longer
necessary to keep Print’s EBITDA (with little accompanying cash flow) on the books
purely for leverage ratios. It is important that Cenveo de-lever as soon as possible,
and preferably with the sale of a division in decline and with few areas for growth.
Indeed, throwing good money after bad is one of the reasons for Cenveo’s current
capital structure.
That said, it is important to recognize the synergistic nature of the Print division,
especially through direct-mail inserts that are critical to Envelope clients. Therefore,
Table 15 - Cenveo's national reach should leverage nearby national brands
Molson
Pinnacle
Maple Leaf Constellation
Campbell
PRESENTATION TO THE ALLIANZ SE HIGH YIELD GROUP
43
we recommend merging those direct-mail capabilities into Envelope prior to a
sale.24
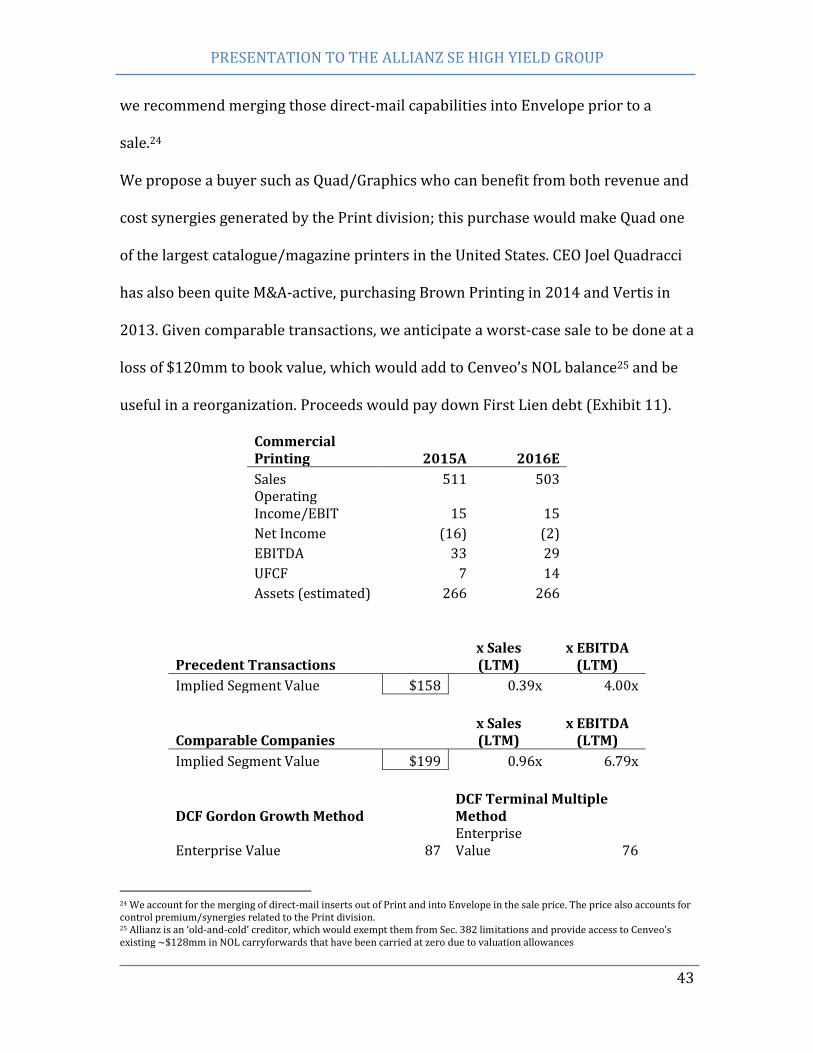
We propose a buyer such as Quad/Graphics who can benefit from both revenue and
cost synergies generated by the Print division; this purchase would make Quad one
of the largest catalogue/magazine printers in the United States. CEO Joel Quadracci
has also been quite M&A-active, purchasing Brown Printing in 2014 and Vertis in
2013. Given comparable transactions, we anticipate a worst-case sale to be done at a
loss of $120mm to book value, which would add to Cenveo’s NOL balance25 and be
useful in a reorganization. Proceeds would pay down First Lien debt (Exhibit 11).
Commercial Printing 2015A 2016E
Sales 511 503 Operating Income/EBIT 15 15
Net Income (16) (2)
EBITDA 33 29
UFCF 7 14
Assets (estimated) 266 266
Precedent Transactions x Sales (LTM)
x EBITDA (LTM)
Implied Segment Value $158 0.39x 4.00x
Comparable Companies x Sales (LTM)
x EBITDA (LTM)
Implied Segment Value $199 0.96x 6.79x
DCF Gordon Growth Method DCF Terminal Multiple Method
Enterprise Value 87 Enterprise Value 76
24 We account for the merging of direct-mail inserts out of Print and into Envelope in the sale price. The price also accounts for control premium/synergies related to the Print division. 25 Allianz is an ‘old-and-cold’ creditor, which would exempt them from Sec. 382 limitations and provide access to Cenveo’s existing ~$128mm in NOL carryforwards that have been carried at zero due to valuation allowances
PRESENTATION TO THE ALLIANZ SE HIGH YIELD GROUP
44
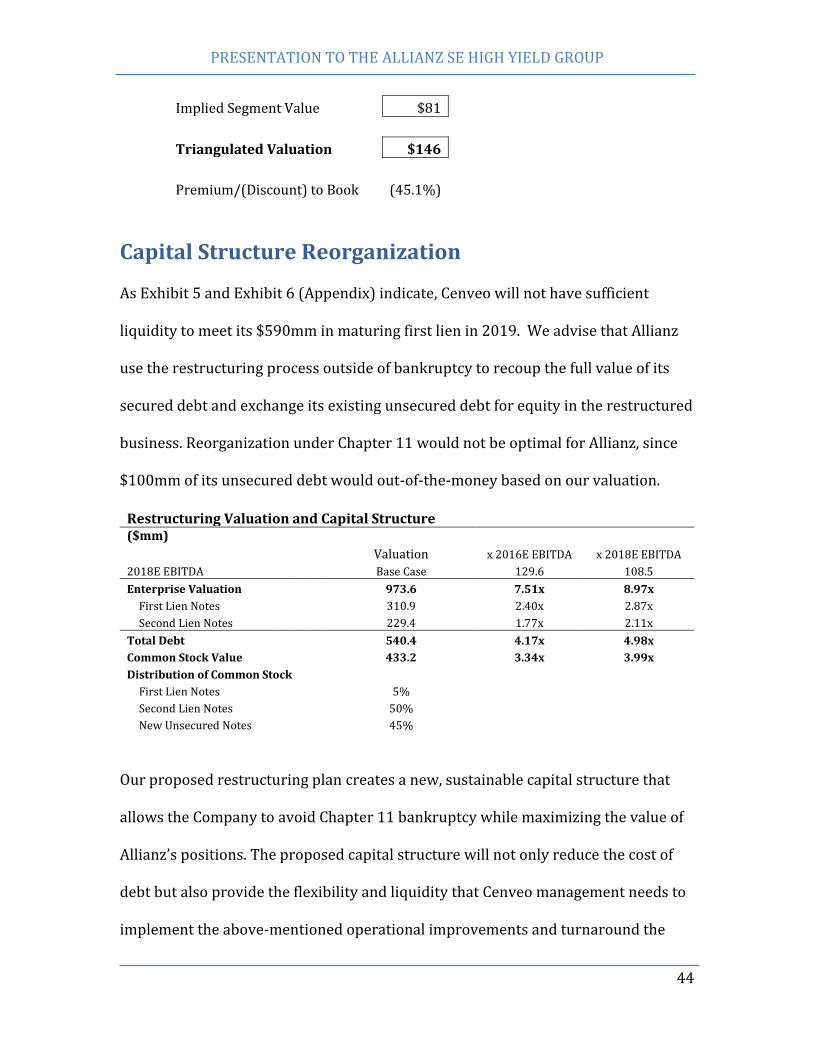
Implied Segment Value $81
Triangulated Valuation $146
Premium/(Discount) to Book (45.1%)
Capital Structure Reorganization As Exhibit 5 and Exhibit 6 (Appendix) indicate, Cenveo will not have sufficient
liquidity to meet its $590mm in maturing first lien in 2019. We advise that Allianz
use the restructuring process outside of bankruptcy to recoup the full value of its
secured debt and exchange its existing unsecured debt for equity in the restructured
business. Reorganization under Chapter 11 would not be optimal for Allianz, since
$100mm of its unsecured debt would out-of-the-money based on our valuation.
Restructuring Valuation and Capital Structure ($mm)
Valuation x 2016E EBITDA x 2018E EBITDA
2018E EBITDA Base Case 129.6 108.5
Enterprise Valuation 973.6 7.51x 8.97x
First Lien Notes 310.9 2.40x 2.87x
Second Lien Notes 229.4 1.77x 2.11x
Total Debt 540.4 4.17x 4.98x
Common Stock Value 433.2 3.34x 3.99x
Distribution of Common Stock
First Lien Notes 5%
Second Lien Notes 50%
New Unsecured Notes 45%
Our proposed restructuring plan creates a new, sustainable capital structure that
allows the Company to avoid Chapter 11 bankruptcy while maximizing the value of
Allianz’s positions. The proposed capital structure will not only reduce the cost of
debt but also provide the flexibility and liquidity that Cenveo management needs to
implement the above-mentioned operational improvements and turnaround the
PRESENTATION TO THE ALLIANZ SE HIGH YIELD GROUP
45
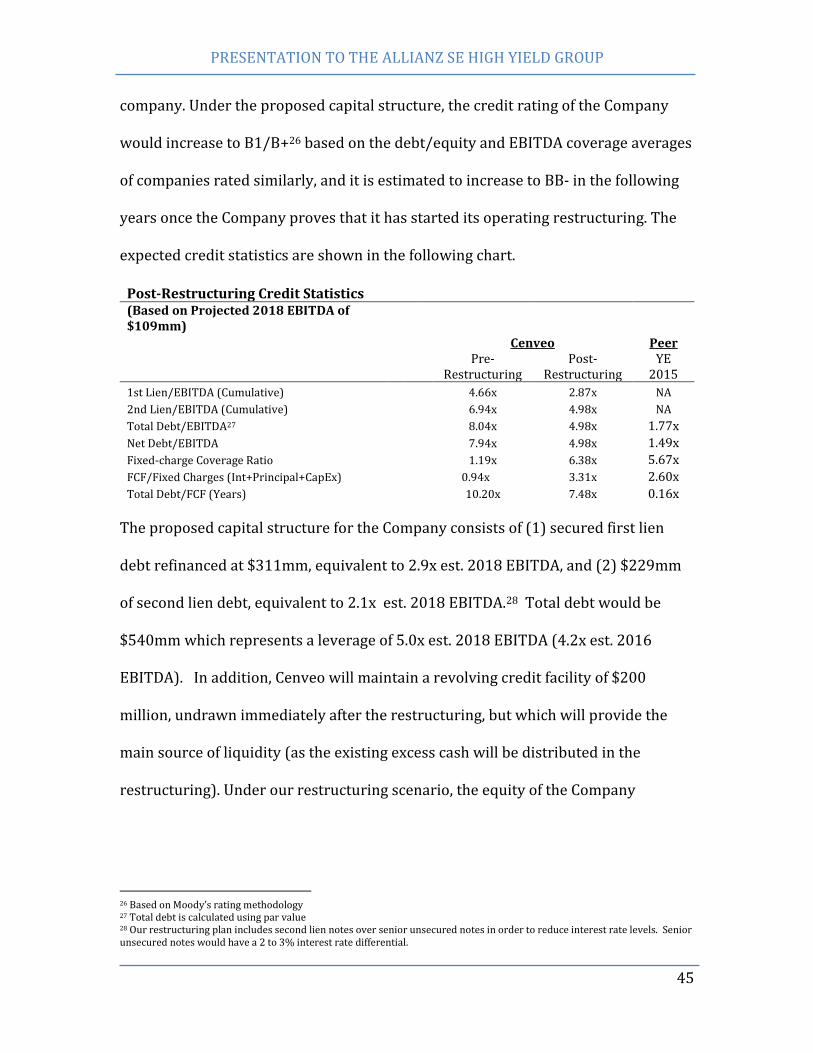
company. Under the proposed capital structure, the credit rating of the Company
would increase to B1/B+26 based on the debt/equity and EBITDA coverage averages
of companies rated similarly, and it is estimated to increase to BB- in the following
years once the Company proves that it has started its operating restructuring. The
expected credit statistics are shown in the following chart.
Post-Restructuring Credit Statistics (Based on Projected 2018 EBITDA of $109mm)
Cenveo Peer
Pre-
Restructuring Post-
Restructuring YE
2015
1st Lien/EBITDA (Cumulative) 4.66x 2.87x NA
2nd Lien/EBITDA (Cumulative) 6.94x 4.98x NA
Total Debt/EBITDA27 8.04x 4.98x 1.77x
Net Debt/EBITDA 7.94x 4.98x 1.49x
Fixed-charge Coverage Ratio 1.19x 6.38x 5.67x
FCF/Fixed Charges (Int+Principal+CapEx) 0.94x 3.31x 2.60x
Total Debt/FCF (Years) 10.20x 7.48x 0.16x
The proposed capital structure for the Company consists of (1) secured first lien
debt refinanced at $311mm, equivalent to 2.9x est. 2018 EBITDA, and (2) $229mm
of second lien debt, equivalent to 2.1x est. 2018 EBITDA.28 Total debt would be
$540mm which represents a leverage of 5.0x est. 2018 EBITDA (4.2x est. 2016
EBITDA). In addition, Cenveo will maintain a revolving credit facility of $200
million, undrawn immediately after the restructuring, but which will provide the
main source of liquidity (as the existing excess cash will be distributed in the
restructuring). Under our restructuring scenario, the equity of the Company
26 Based on Moody’s rating methodology 27 Total debt is calculated using par value 28 Our restructuring plan includes second lien notes over senior unsecured notes in order to reduce interest rate levels. Senior unsecured notes would have a 2 to 3% interest rate differential.
PRESENTATION TO THE ALLIANZ SE HIGH YIELD GROUP
46
following the capital structure restructuring would be $433mm, which represents
45% of the estimated enterprise value.
We estimated a restructuring enterprise valuation of $974mm (Exhibit 8) using an
est. 2018 sum-of-the-parts valuation. Our valuation indicates that first lien
creditors would be fully covered in Chapter 11. As a result, a restructuring scenario
that avoids Chapter 11 has to include at least a 100% recovery rate for first lien
creditors. Allianz would use its control to require Cenveo to pay down as much debt
as possible using excess free cash flow and the sale of the print business.
Restructuring would likely occur at the end of 2018 or early 2019, giving Cenveo
over 2 years to implement operational improvements and reduce its debt burden.
Over this period, we estimate that Cenveo can generate between $108mm and
$337mm in cash flow from 2016 to year-end 2018 that can be used to reduce first
lien principal. These steps would lower overall leverage and be sufficient for first
lien creditors to extend their 2019 maturities.
In a base case scenario, the remaining $311mm in first lien debt would be rolled
over to a later maturity date. The refinanced notes would include stronger
covenants intended to strengthen the claim of first lien lenders, including a cash
sweep clause guarantying the distribution of any excess cash as a prepayment of the
debt. The restructured balance sheet would also include $229mm in new second
lien notes with an estimated interest rate in the area of 6.0%. Overall, the blended
interest rate would be close to 5.8%, in line with peers and B1/B+ rated companies.
The above credit statistic table shows that the Company is able to cover its debt cost
and that the proposed capital structure is sustainable. Free cash flow to fixed
PRESENTATION TO THE ALLIANZ SE HIGH YIELD GROUP
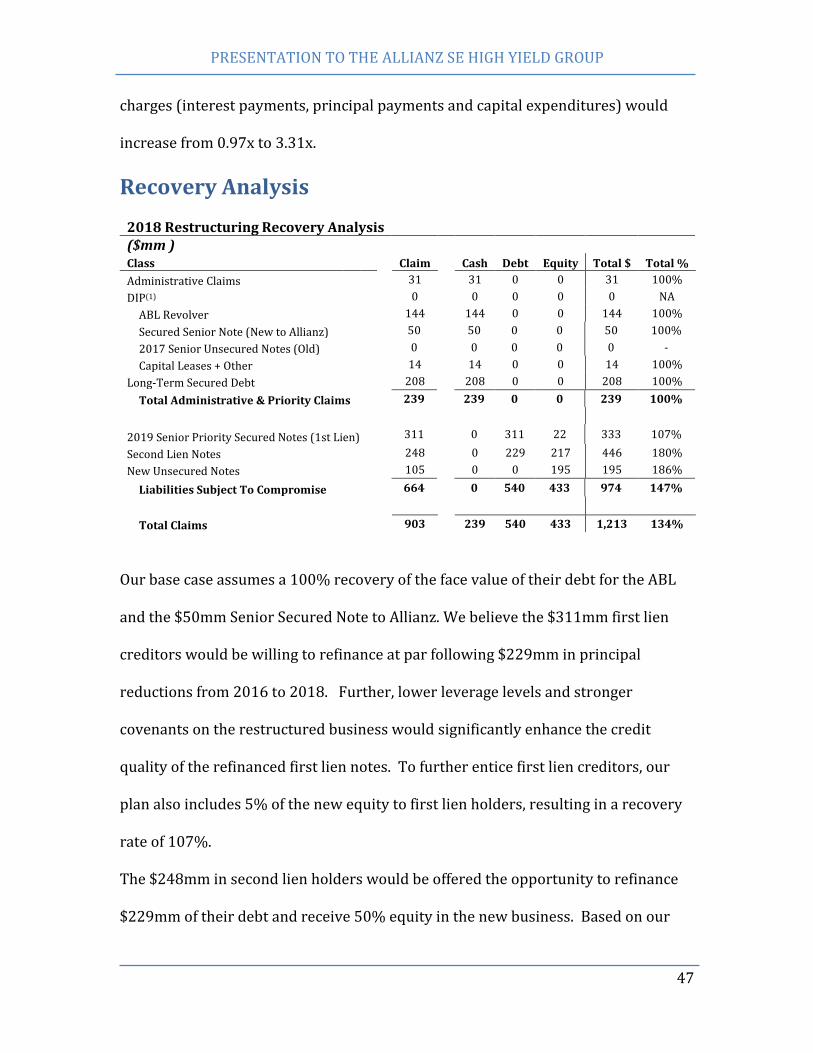
47
charges (interest payments, principal payments and capital expenditures) would
increase from 0.97x to 3.31x.
Recovery Analysis
2018 Restructuring Recovery Analysis
($mm )
Class Claim Cash Debt Equity Total $ Total %
Administrative Claims 31 31 0 0 31 100%
DIP(1) 0 0 0 0 0 NA
ABL Revolver 144 144 0 0 144 100%
Secured Senior Note (New to Allianz) 50 50 0 0 50 100%
2017 Senior Unsecured Notes (Old) 0 0 0 0 0 -
Capital Leases + Other 14 14 0 0 14 100%
Long-Term Secured Debt 208 208 0 0 208 100%
Total Administrative & Priority Claims 239 239 0 0 239 100%
2019 Senior Priority Secured Notes (1st Lien) 311 0 311 22 333 107%
Second Lien Notes 248 0 229 217 446 180%
New Unsecured Notes 105 0 0 195 195 186%
Liabilities Subject To Compromise 664 0 540 433 974 147%
Total Claims 903 239 540 433 1,213 134%
Our base case assumes a 100% recovery of the face value of their debt for the ABL
and the $50mm Senior Secured Note to Allianz. We believe the $311mm first lien
creditors would be willing to refinance at par following $229mm in principal
reductions from 2016 to 2018. Further, lower leverage levels and stronger
covenants on the restructured business would significantly enhance the credit
quality of the refinanced first lien notes. To further entice first lien creditors, our
plan also includes 5% of the new equity to first lien holders, resulting in a recovery
rate of 107%.
The $248mm in second lien holders would be offered the opportunity to refinance
$229mm of their debt and receive 50% equity in the new business. Based on our
PRESENTATION TO THE ALLIANZ SE HIGH YIELD GROUP
48
valuation this amounts a 180% recovery rate, which is a significant improvement
from the exchange offer Cenveo’s unsecured lenders agreed to in May 2017.
Allocating a portion of the equity is designed to sweeten the proposal and encourage
them to vote in favor of the plan. Our analysis shows that second lien creditors
would be significantly impaired in a liquidation scenario.29 Also, recent
bankruptcies also show that junior creditors are unlikely to recover all of their debt
through Chapter 11 reorganization.30 With these examples in mind, we believe
second lien creditors will vote in favor of the plan.
Allianz holds 68% of the unsecured credit and would agree to receive equity in the
plan. Unsecured creditors receive $195mm of equity value, nearly double the face
value of their debt, which represents 45% of the equity of the new company. Given
that unsecured debt traded below 50% prior to the 2016 exchange, we believe these
creditors would accept an offer of all equity that achieves full recovery of their debt.
Further, the unsecured creditors would be the first to be hit in a bankruptcy
scenario. We believe that the unsecured creditors would vote favorable to the plan.
The company that emerges from this restructuring would carry a much healthier
leverage level. At year-end 2016, Cenveo’s net debt to EBITDA is 8.7x. After this
restructuring plan, the leverage level falls to 4.9x est. 2018 EBITDA. While this post-
restructuring leverage level is on the high-side, many of Cenveo’s peers are highly
levered, including RR Donnelly (3.8x) and International Paper (4.1x).
29 Using National Envelope’s bankruptcy as a proxy, we calculated a liquidation value between $500mm and $680mm. Assuming there is $550mm in senior claims at bankruptcy, second lien lenders could at most hope to receive $130mm, representing a recovery rate of 53%. 30 In Verso Paper’s 2016 bankruptcy reorganization plan, creditors below the first lien notes received a combined 2.85% of the equity, well below the face value of their debt.
PRESENTATION TO THE ALLIANZ SE HIGH YIELD GROUP
49
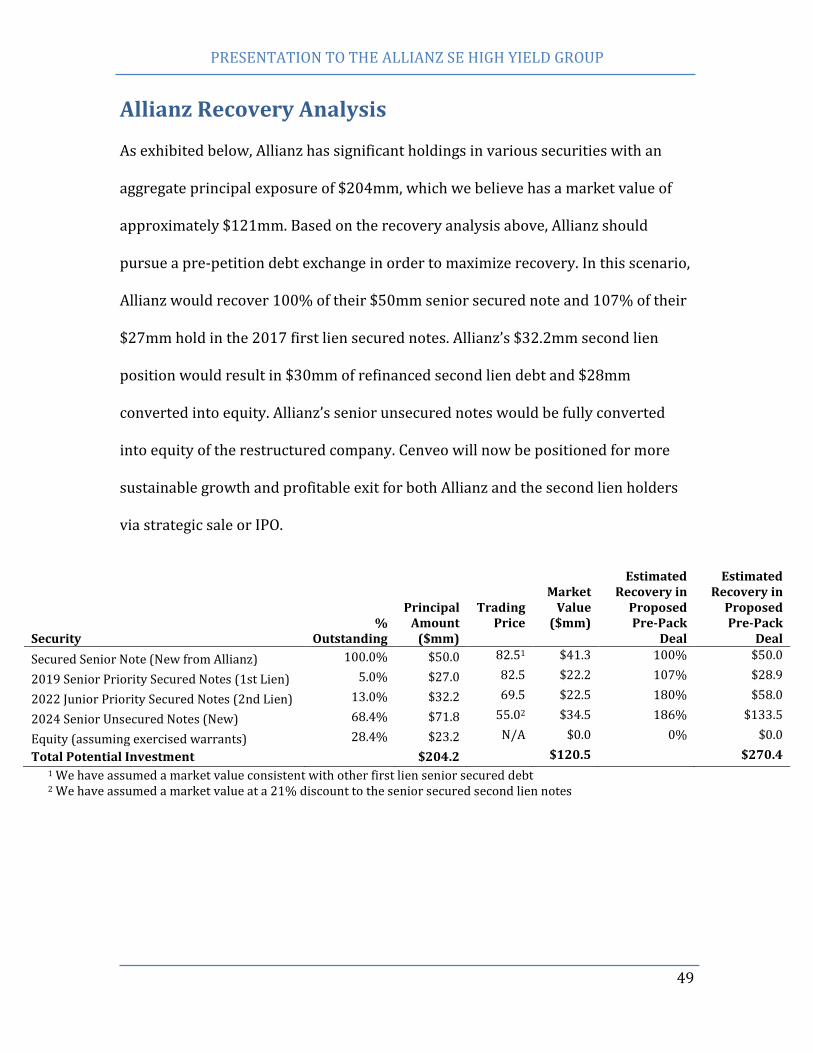
Allianz Recovery Analysis As exhibited below, Allianz has significant holdings in various securities with an
aggregate principal exposure of $204mm, which we believe has a market value of
approximately $121mm. Based on the recovery analysis above, Allianz should
pursue a pre-petition debt exchange in order to maximize recovery. In this scenario,
Allianz would recover 100% of their $50mm senior secured note and 107% of their
$27mm hold in the 2017 first lien secured notes. Allianz’s $32.2mm second lien
position would result in $30mm of refinanced second lien debt and $28mm
converted into equity. Allianz’s senior unsecured notes would be fully converted
into equity of the restructured company. Cenveo will now be positioned for more
sustainable growth and profitable exit for both Allianz and the second lien holders
via strategic sale or IPO.
Security %
Outstanding
Principal Amount
($mm)
Trading Price
Market Value
($mm)
Estimated
Recovery in Proposed Pre-Pack
Deal
Estimated
Recovery in Proposed Pre-Pack
Deal
Secured Senior Note (New from Allianz) 100.0% $50.0 82.51 $41.3 100% $50.0
2019 Senior Priority Secured Notes (1st Lien) 5.0% $27.0 82.5 $22.2 107% $28.9
2022 Junior Priority Secured Notes (2nd Lien) 13.0% $32.2 69.5 $22.5 180% $58.0
2024 Senior Unsecured Notes (New) 68.4% $71.8 55.02 $34.5 186% $133.5
Equity (assuming exercised warrants) 28.4% $23.2 N/A $0.0 0% $0.0
Total Potential Investment $204.2 $120.5 $270.4
1 We have assumed a market value consistent with other first lien senior secured debt 2 We have assumed a market value at a 21% discount to the senior secured second lien notes
PRESENTATION TO THE ALLIANZ SE HIGH YIELD GROUP
50
Appendix
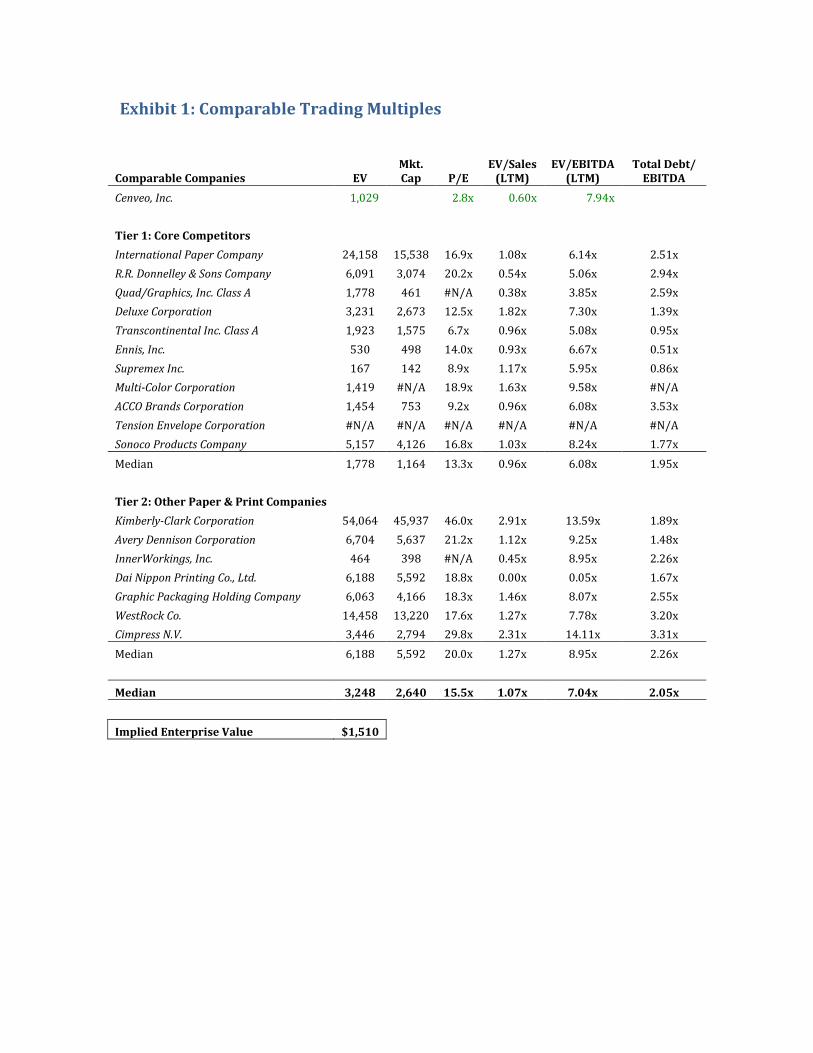
Exhibit 1: Comparable Trading Multiples
Comparable Companies EV Mkt. Cap P/E
EV/Sales (LTM)
EV/EBITDA (LTM)
Total Debt/ EBITDA
Cenveo, Inc. 1,029 2.8x 0.60x 7.94x
Tier 1: Core Competitors
International Paper Company 24,158 15,538 16.9x 1.08x 6.14x 2.51x
R.R. Donnelley & Sons Company 6,091 3,074 20.2x 0.54x 5.06x 2.94x
Quad/Graphics, Inc. Class A 1,778 461 #N/A 0.38x 3.85x 2.59x
Deluxe Corporation 3,231 2,673 12.5x 1.82x 7.30x 1.39x
Transcontinental Inc. Class A 1,923 1,575 6.7x 0.96x 5.08x 0.95x
Ennis, Inc. 530 498 14.0x 0.93x 6.67x 0.51x
Supremex Inc. 167 142 8.9x 1.17x 5.95x 0.86x
Multi-Color Corporation 1,419 #N/A 18.9x 1.63x 9.58x #N/A
ACCO Brands Corporation 1,454 753 9.2x 0.96x 6.08x 3.53x
Tension Envelope Corporation #N/A #N/A #N/A #N/A #N/A #N/A
Sonoco Products Company 5,157 4,126 16.8x 1.03x 8.24x 1.77x
Median 1,778 1,164 13.3x 0.96x 6.08x 1.95x
Tier 2: Other Paper & Print Companies
Kimberly-Clark Corporation 54,064 45,937 46.0x 2.91x 13.59x 1.89x
Avery Dennison Corporation 6,704 5,637 21.2x 1.12x 9.25x 1.48x
InnerWorkings, Inc. 464 398 #N/A 0.45x 8.95x 2.26x
Dai Nippon Printing Co., Ltd. 6,188 5,592 18.8x 0.00x 0.05x 1.67x
Graphic Packaging Holding Company 6,063 4,166 18.3x 1.46x 8.07x 2.55x
WestRock Co. 14,458 13,220 17.6x 1.27x 7.78x 3.20x
Cimpress N.V. 3,446 2,794 29.8x 2.31x 14.11x 3.31x
Median 6,188 5,592 20.0x 1.27x 8.95x 2.26x
Median 3,248 2,640 15.5x 1.07x 7.04x 2.05x
Implied Enterprise Value $1,510
PRESENTATION TO THE ALLIANZ SE HIGH YIELD GROUP
1
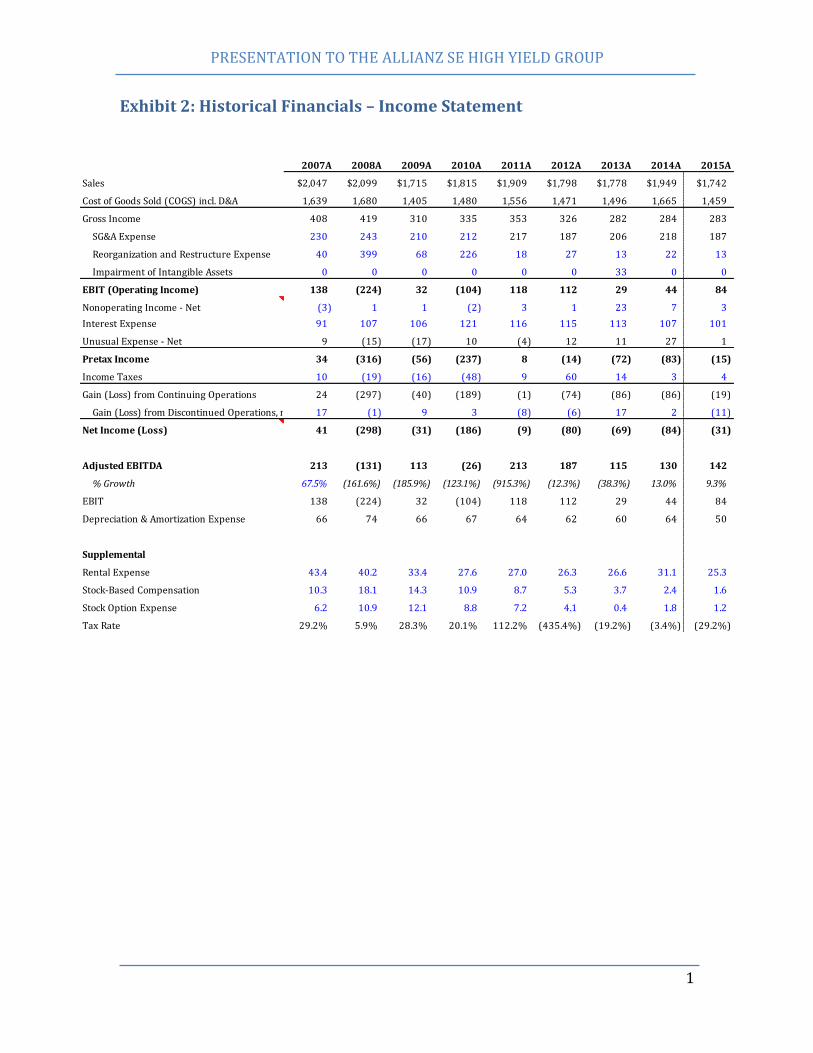
Exhibit 2: Historical Financials – Income Statement
2007A 2008A 2009A 2010A 2011A 2012A 2013A 2014A 2015A
Sales $2,047 $2,099 $1,715 $1,815 $1,909 $1,798 $1,778 $1,949 $1,742
Cost of Goods Sold (COGS) incl. D&A 1,639 1,680 1,405 1,480 1,556 1,471 1,496 1,665 1,459
Gross Income 408 419 310 335 353 326 282 284 283
SG&A Expense 230 243 210 212 217 187 206 218 187
Reorganization and Restructure Expense 40 399 68 226 18 27 13 22 13
Impairment of Intangible Assets 0 0 0 0 0 0 33 0 0
EBIT (Operating Income) 138 (224) 32 (104) 118 112 29 44 84
Nonoperating Income - Net (3) 1 1 (2) 3 1 23 7 3
Interest Expense 91 107 106 121 116 115 113 107 101
Unusual Expense - Net 9 (15) (17) 10 (4) 12 11 27 1
Pretax Income 34 (316) (56) (237) 8 (14) (72) (83) (15)
Income Taxes 10 (19) (16) (48) 9 60 14 3 4
Gain (Loss) from Continuing Operations 24 (297) (40) (189) (1) (74) (86) (86) (19)
Gain (Loss) from Discontinued Operations, net of tax17 (1) 9 3 (8) (6) 17 2 (11)
Net Income (Loss) 41 (298) (31) (186) (9) (80) (69) (84) (31)
Adjusted EBITDA 213 (131) 113 (26) 213 187 115 130 142
% Growth 67.5% (161.6%) (185.9%) (123.1%) (915.3%) (12.3%) (38.3%) 13.0% 9.3%
EBIT 138 (224) 32 (104) 118 112 29 44 84
Depreciation & Amortization Expense 66 74 66 67 64 62 60 64 50
Supplemental
Rental Expense 43.4 40.2 33.4 27.6 27.0 26.3 26.6 31.1 25.3
Stock-Based Compensation 10.3 18.1 14.3 10.9 8.7 5.3 3.7 2.4 1.6
Stock Option Expense 6.2 10.9 12.1 8.8 7.2 4.1 0.4 1.8 1.2
Tax Rate 29.2% 5.9% 28.3% 20.1% 112.2% (435.4%) (19.2%) (3.4%) (29.2%)
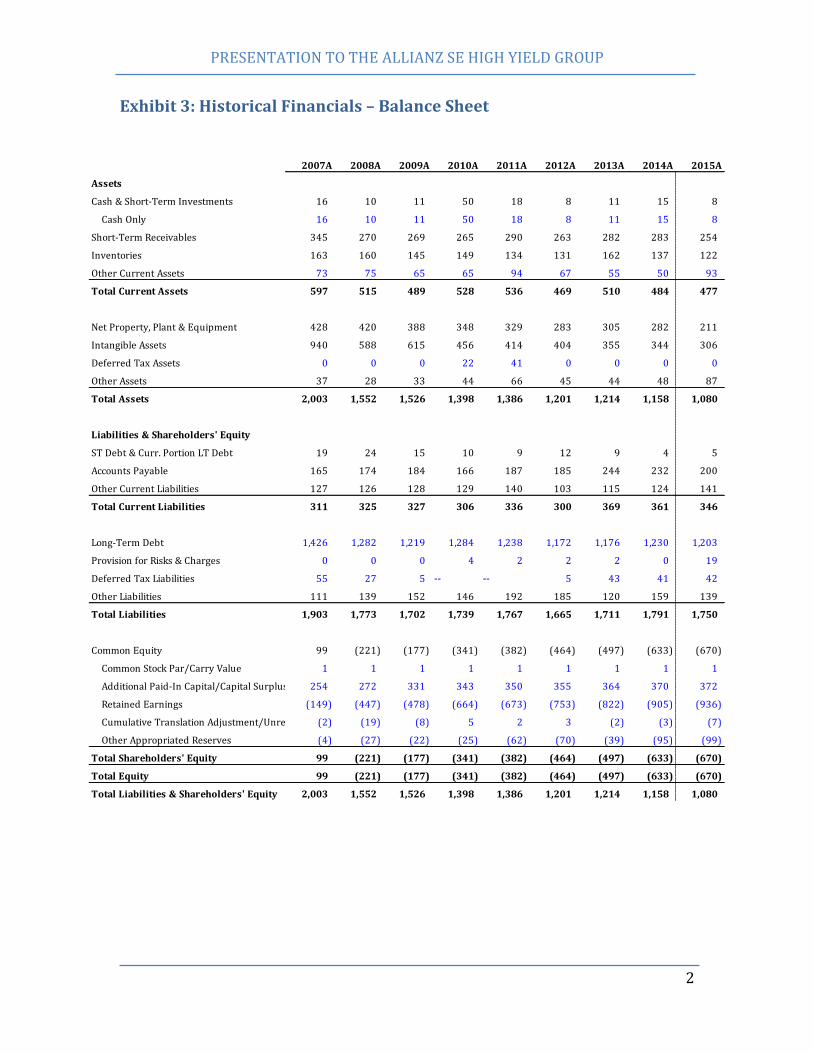
PRESENTATION TO THE ALLIANZ SE HIGH YIELD GROUP
2
Exhibit 3: Historical Financials – Balance Sheet
2007A 2008A 2009A 2010A 2011A 2012A 2013A 2014A 2015A
Assets
Cash & Short-Term Investments 16 10 11 50 18 8 11 15 8
Cash Only 16 10 11 50 18 8 11 15 8
Short-Term Receivables 345 270 269 265 290 263 282 283 254
Inventories 163 160 145 149 134 131 162 137 122
Other Current Assets 73 75 65 65 94 67 55 50 93
Total Current Assets 597 515 489 528 536 469 510 484 477
Net Property, Plant & Equipment 428 420 388 348 329 283 305 282 211
Intangible Assets 940 588 615 456 414 404 355 344 306
Deferred Tax Assets 0 0 0 22 41 0 0 0 0
Other Assets 37 28 33 44 66 45 44 48 87
Total Assets 2,003 1,552 1,526 1,398 1,386 1,201 1,214 1,158 1,080
Liabilities & Shareholders' Equity
ST Debt & Curr. Portion LT Debt 19 24 15 10 9 12 9 4 5
Accounts Payable 165 174 184 166 187 185 244 232 200
Other Current Liabilities 127 126 128 129 140 103 115 124 141
Total Current Liabilities 311 325 327 306 336 300 369 361 346
Long-Term Debt 1,426 1,282 1,219 1,284 1,238 1,172 1,176 1,230 1,203
Provision for Risks & Charges 0 0 0 4 2 2 2 0 19
Deferred Tax Liabilities 55 27 5 -- -- 5 43 41 42
Other Liabilities 111 139 152 146 192 185 120 159 139
Total Liabilities 1,903 1,773 1,702 1,739 1,767 1,665 1,711 1,791 1,750
Common Equity 99 (221) (177) (341) (382) (464) (497) (633) (670)
Common Stock Par/Carry Value 1 1 1 1 1 1 1 1 1
Additional Paid-In Capital/Capital Surplus 254 272 331 343 350 355 364 370 372
Retained Earnings (149) (447) (478) (664) (673) (753) (822) (905) (936)
Cumulative Translation Adjustment/Unrealized For. Exch. Gain(2) (19) (8) 5 2 3 (2) (3) (7)
Other Appropriated Reserves (4) (27) (22) (25) (62) (70) (39) (95) (99)
Total Shareholders' Equity 99 (221) (177) (341) (382) (464) (497) (633) (670)
Total Equity 99 (221) (177) (341) (382) (464) (497) (633) (670)
Total Liabilities & Shareholders' Equity 2,003 1,552 1,526 1,398 1,386 1,201 1,214 1,158 1,080
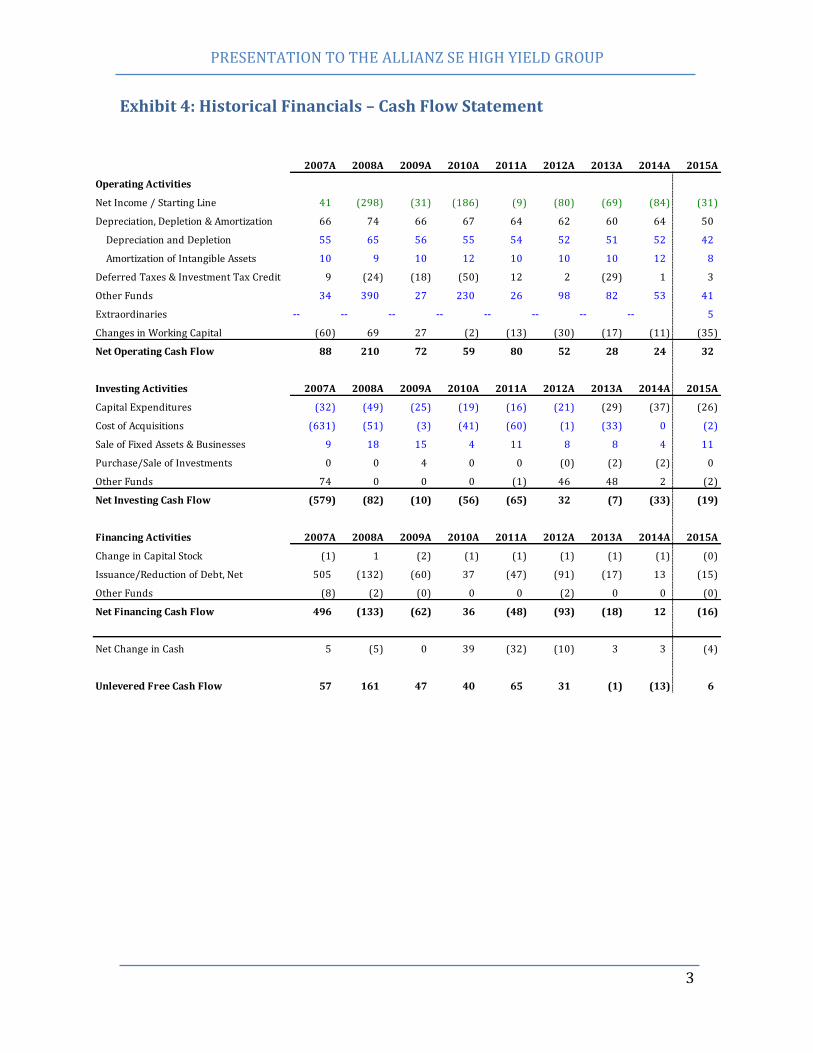
PRESENTATION TO THE ALLIANZ SE HIGH YIELD GROUP
3
Exhibit 4: Historical Financials – Cash Flow Statement
2007A 2008A 2009A 2010A 2011A 2012A 2013A 2014A 2015A
Operating Activities
Net Income / Starting Line 41 (298) (31) (186) (9) (80) (69) (84) (31)
Depreciation, Depletion & Amortization 66 74 66 67 64 62 60 64 50
Depreciation and Depletion 55 65 56 55 54 52 51 52 42
Amortization of Intangible Assets 10 9 10 12 10 10 10 12 8
Deferred Taxes & Investment Tax Credit 9 (24) (18) (50) 12 2 (29) 1 3
Other Funds 34 390 27 230 26 98 82 53 41
Extraordinaries -- -- -- -- -- -- -- -- 5
Changes in Working Capital (60) 69 27 (2) (13) (30) (17) (11) (35)
Net Operating Cash Flow 88 210 72 59 80 52 28 24 32
Investing Activities 2007A 2008A 2009A 2010A 2011A 2012A 2013A 2014A 2015A
Capital Expenditures (32) (49) (25) (19) (16) (21) (29) (37) (26)
Cost of Acquisitions (631) (51) (3) (41) (60) (1) (33) 0 (2)
Sale of Fixed Assets & Businesses 9 18 15 4 11 8 8 4 11
Purchase/Sale of Investments 0 0 4 0 0 (0) (2) (2) 0
Other Funds 74 0 0 0 (1) 46 48 2 (2)
Net Investing Cash Flow (579) (82) (10) (56) (65) 32 (7) (33) (19)
Financing Activities 2007A 2008A 2009A 2010A 2011A 2012A 2013A 2014A 2015A
Change in Capital Stock (1) 1 (2) (1) (1) (1) (1) (1) (0)
Issuance/Reduction of Debt, Net 505 (132) (60) 37 (47) (91) (17) 13 (15)
Other Funds (8) (2) (0) 0 0 (2) 0 0 (0)
Net Financing Cash Flow 496 (133) (62) 36 (48) (93) (18) 12 (16)
Net Change in Cash 5 (5) 0 39 (32) (10) 3 3 (4)
Unlevered Free Cash Flow 57 161 47 40 65 31 (1) (13) 6
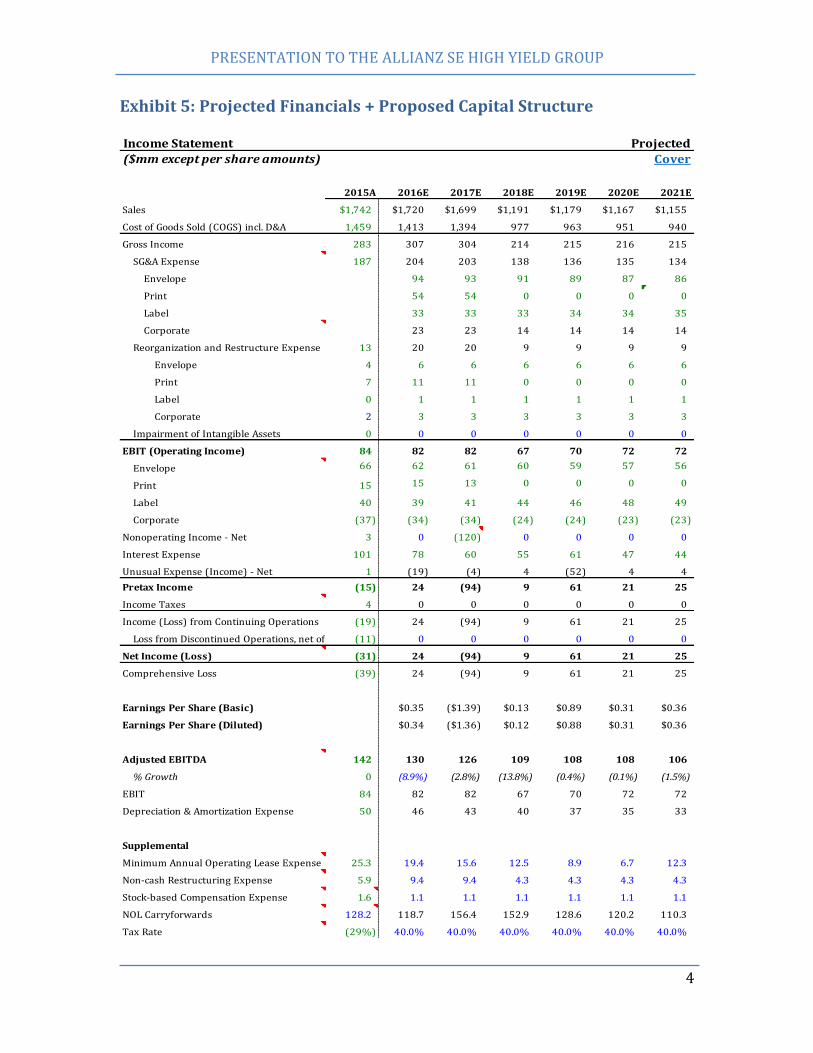
PRESENTATION TO THE ALLIANZ SE HIGH YIELD GROUP
4
Exhibit 5: Projected Financials + Proposed Capital Structure
Income Statement Projected
($mm except per share amounts) Cover
2015A 2016E 2017E 2018E 2019E 2020E 2021E
Sales $1,742 $1,720 $1,699 $1,191 $1,179 $1,167 $1,155
Cost of Goods Sold (COGS) incl. D&A 1,459 1,413 1,394 977 963 951 940
Gross Income 283 307 304 214 215 216 215
SG&A Expense 187 204 203 138 136 135 134
Envelope 94 93 91 89 87 86
Print 54 54 0 0 0 0
Label 33 33 33 34 34 35
Corporate 23 23 14 14 14 14
Reorganization and Restructure Expense 13 20 20 9 9 9 9
Envelope 4 6 6 6 6 6 6
Print 7 11 11 0 0 0 0
Label 0 1 1 1 1 1 1
Corporate 2 3 3 3 3 3 3
Impairment of Intangible Assets 0 0 0 0 0 0 0
EBIT (Operating Income) 84 82 82 67 70 72 72
Envelope 66 62 61 60 59 57 56
Print 15 15 13 0 0 0 0
Label 40 39 41 44 46 48 49
Corporate (37) (34) (34) (24) (24) (23) (23)
Nonoperating Income - Net 3 0 (120) 0 0 0 0
Interest Expense 101 78 60 55 61 47 44
Unusual Expense (Income) - Net 1 (19) (4) 4 (52) 4 4
Pretax Income (15) 24 (94) 9 61 21 25
Income Taxes 4 0 0 0 0 0 0
Income (Loss) from Continuing Operations (19) 24 (94) 9 61 21 25
Loss from Discontinued Operations, net of tax (11) 0 0 0 0 0 0
Net Income (Loss) (31) 24 (94) 9 61 21 25
Comprehensive Loss (39) 24 (94) 9 61 21 25
Earnings Per Share (Basic) $0.35 ($1.39) $0.13 $0.89 $0.31 $0.36
Earnings Per Share (Diluted) $0.34 ($1.36) $0.12 $0.88 $0.31 $0.36
Adjusted EBITDA 142 130 126 109 108 108 106
% Growth 0 (8.9%) (2.8%) (13.8%) (0.4%) (0.1%) (1.5%)
EBIT 84 82 82 67 70 72 72
Depreciation & Amortization Expense 50 46 43 40 37 35 33
Supplemental
Minimum Annual Operating Lease Expense 25.3 19.4 15.6 12.5 8.9 6.7 12.3
Non-cash Restructuring Expense 5.9 9.4 9.4 4.3 4.3 4.3 4.3
Stock-based Compensation Expense 1.6 1.1 1.1 1.1 1.1 1.1 1.1
NOL Carryforwards 128.2 118.7 156.4 152.9 128.6 120.2 110.3
Tax Rate (29%) 40.0% 40.0% 40.0% 40.0% 40.0% 40.0%
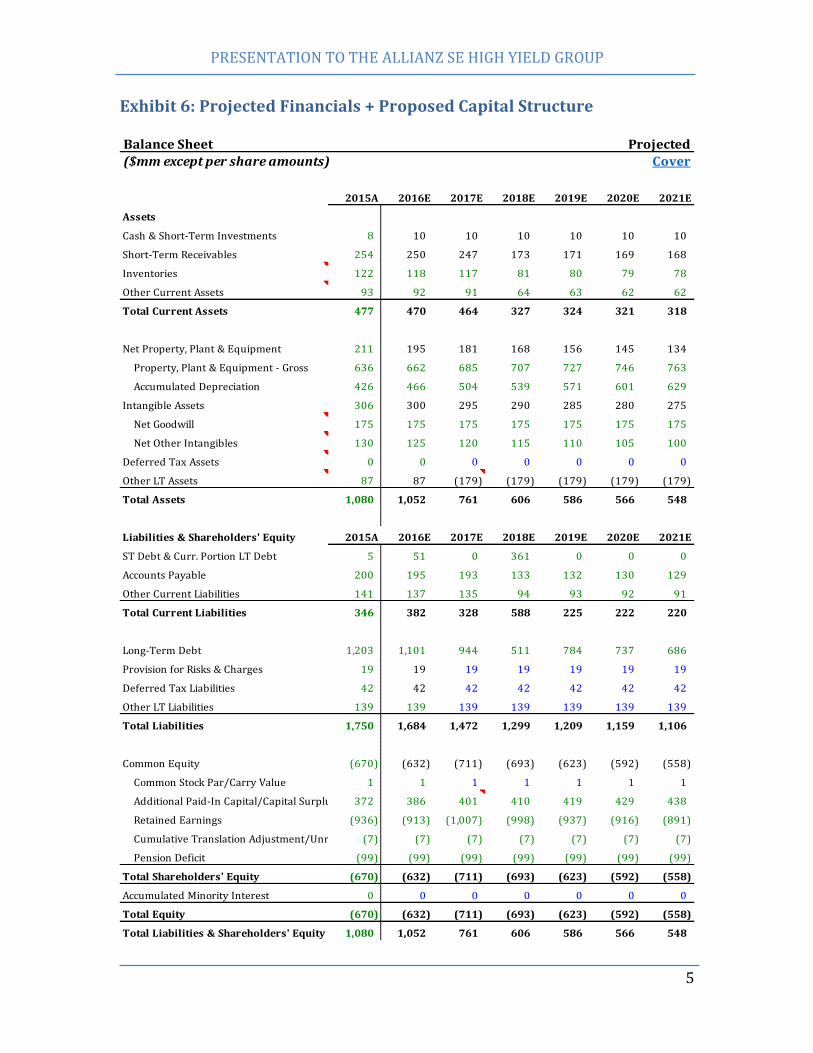
PRESENTATION TO THE ALLIANZ SE HIGH YIELD GROUP
5
Exhibit 6: Projected Financials + Proposed Capital Structure
Balance Sheet Projected
($mm except per share amounts) Cover
2015A 2016E 2017E 2018E 2019E 2020E 2021E
Assets
Cash & Short-Term Investments 8 10 10 10 10 10 10
Short-Term Receivables 254 250 247 173 171 169 168
Inventories 122 118 117 81 80 79 78
Other Current Assets 93 92 91 64 63 62 62
Total Current Assets 477 470 464 327 324 321 318
Net Property, Plant & Equipment 211 195 181 168 156 145 134
Property, Plant & Equipment - Gross 636 662 685 707 727 746 763
Accumulated Depreciation 426 466 504 539 571 601 629
Intangible Assets 306 300 295 290 285 280 275
Net Goodwill 175 175 175 175 175 175 175
Net Other Intangibles 130 125 120 115 110 105 100
Deferred Tax Assets 0 0 0 0 0 0 0
Other LT Assets 87 87 (179) (179) (179) (179) (179)
Total Assets 1,080 1,052 761 606 586 566 548
Liabilities & Shareholders' Equity 2015A 2016E 2017E 2018E 2019E 2020E 2021E
ST Debt & Curr. Portion LT Debt 5 51 0 361 0 0 0
Accounts Payable 200 195 193 133 132 130 129
Other Current Liabilities 141 137 135 94 93 92 91
Total Current Liabilities 346 382 328 588 225 222 220
Long-Term Debt 1,203 1,101 944 511 784 737 686
Provision for Risks & Charges 19 19 19 19 19 19 19
Deferred Tax Liabilities 42 42 42 42 42 42 42
Other LT Liabilities 139 139 139 139 139 139 139
Total Liabilities 1,750 1,684 1,472 1,299 1,209 1,159 1,106
Common Equity (670) (632) (711) (693) (623) (592) (558)
Common Stock Par/Carry Value 1 1 1 1 1 1 1
Additional Paid-In Capital/Capital Surplus 372 386 401 410 419 429 438
Retained Earnings (936) (913) (1,007) (998) (937) (916) (891)
Cumulative Translation Adjustment/Unrealized For. Exch. Gain(7) (7) (7) (7) (7) (7) (7)
Pension Deficit (99) (99) (99) (99) (99) (99) (99)
Total Shareholders' Equity (670) (632) (711) (693) (623) (592) (558)
Accumulated Minority Interest 0 0 0 0 0 0 0
Total Equity (670) (632) (711) (693) (623) (592) (558)
Total Liabilities & Shareholders' Equity 1,080 1,052 761 606 586 566 548
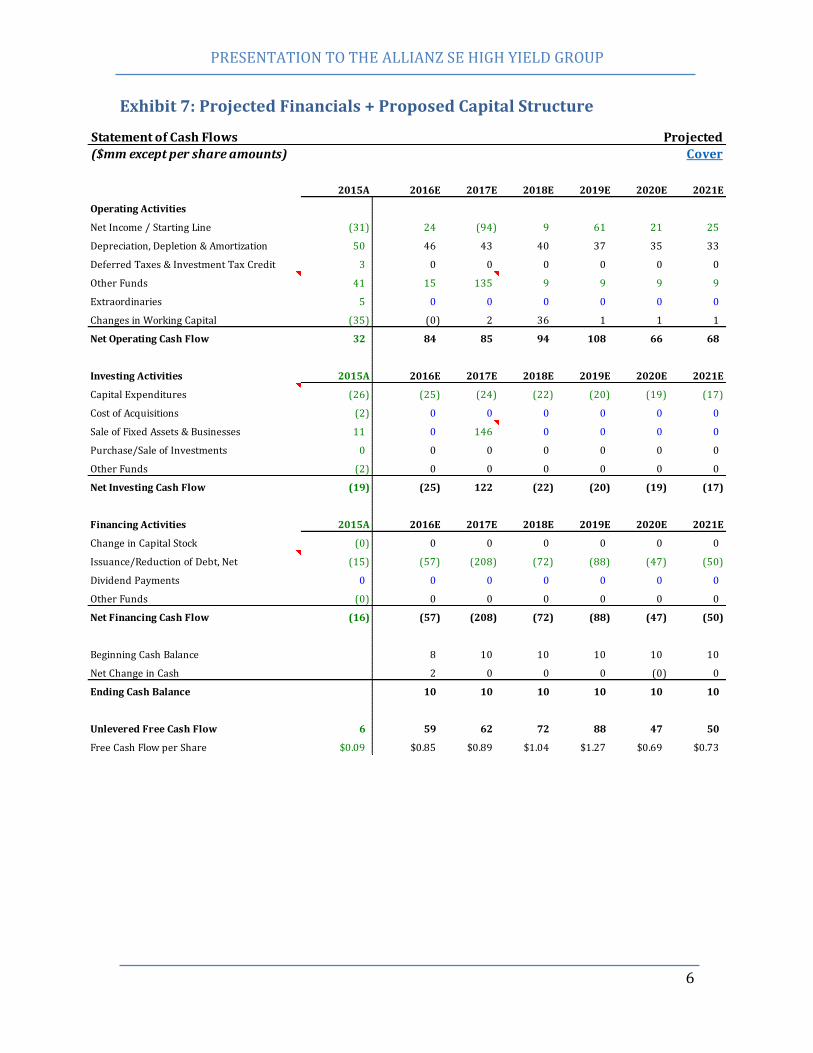
PRESENTATION TO THE ALLIANZ SE HIGH YIELD GROUP
6
Exhibit 7: Projected Financials + Proposed Capital Structure
Statement of Cash Flows Projected
($mm except per share amounts) Cover
2015A 2016E 2017E 2018E 2019E 2020E 2021E
Operating Activities
Net Income / Starting Line (31) 24 (94) 9 61 21 25
Depreciation, Depletion & Amortization 50 46 43 40 37 35 33
Deferred Taxes & Investment Tax Credit 3 0 0 0 0 0 0
Other Funds 41 15 135 9 9 9 9
Extraordinaries 5 0 0 0 0 0 0
Changes in Working Capital (35) (0) 2 36 1 1 1
Net Operating Cash Flow 32 84 85 94 108 66 68
Investing Activities 2015A 2016E 2017E 2018E 2019E 2020E 2021E
Capital Expenditures (26) (25) (24) (22) (20) (19) (17)
Cost of Acquisitions (2) 0 0 0 0 0 0
Sale of Fixed Assets & Businesses 11 0 146 0 0 0 0
Purchase/Sale of Investments 0 0 0 0 0 0 0
Other Funds (2) 0 0 0 0 0 0
Net Investing Cash Flow (19) (25) 122 (22) (20) (19) (17)
Financing Activities 2015A 2016E 2017E 2018E 2019E 2020E 2021E
Change in Capital Stock (0) 0 0 0 0 0 0
Issuance/Reduction of Debt, Net (15) (57) (208) (72) (88) (47) (50)
Dividend Payments 0 0 0 0 0 0 0
Other Funds (0) 0 0 0 0 0 0
Net Financing Cash Flow (16) (57) (208) (72) (88) (47) (50)
Beginning Cash Balance 8 10 10 10 10 10
Net Change in Cash 2 0 0 0 (0) 0
Ending Cash Balance 10 10 10 10 10 10
Unlevered Free Cash Flow 6 59 62 72 88 47 50
Free Cash Flow per Share $0.09 $0.85 $0.89 $1.04 $1.27 $0.69 $0.73
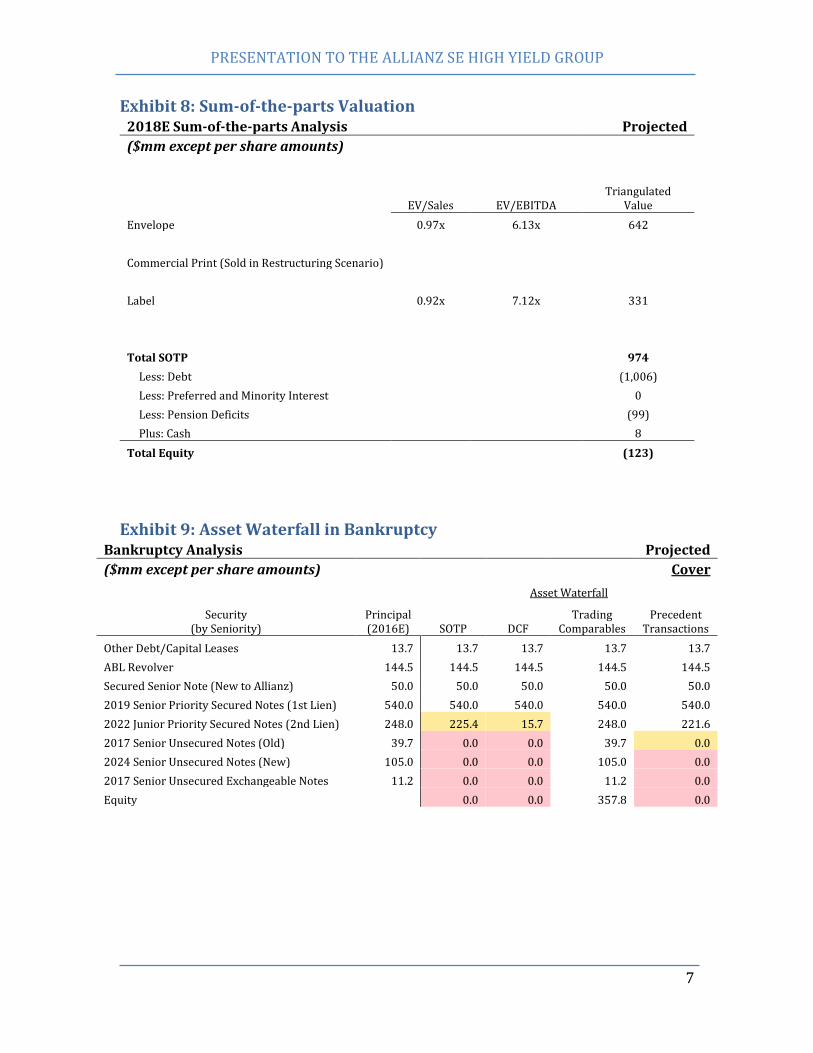
PRESENTATION TO THE ALLIANZ SE HIGH YIELD GROUP
7
Exhibit 8: Sum-of-the-parts Valuation 2018E Sum-of-the-parts Analysis Projected
($mm except per share amounts) Cover
EV/Sales EV/EBITDA Triangulated
Value
Envelope 0.97x 6.13x 642
Commercial Print (Sold in Restructuring Scenario)
Label 0.92x 7.12x 331
Total SOTP 974
Less: Debt (1,006)
Less: Preferred and Minority Interest 0
Less: Pension Deficits (99)
Plus: Cash 8
Total Equity (123)
Exhibit 9: Asset Waterfall in Bankruptcy Bankruptcy Analysis Projected
($mm except per share amounts) Cover
Asset Waterfall
Security (by Seniority)
Principal (2016E) SOTP DCF
Trading Comparables
Precedent Transactions
Other Debt/Capital Leases 13.7 13.7 13.7 13.7 13.7
ABL Revolver 144.5 144.5 144.5 144.5 144.5
Secured Senior Note (New to Allianz) 50.0 50.0 50.0 50.0 50.0
2019 Senior Priority Secured Notes (1st Lien) 540.0 540.0 540.0 540.0 540.0
2022 Junior Priority Secured Notes (2nd Lien) 248.0 225.4 15.7 248.0 221.6
2017 Senior Unsecured Notes (Old) 39.7 0.0 0.0 39.7 0.0
2024 Senior Unsecured Notes (New) 105.0 0.0 0.0 105.0 0.0
2017 Senior Unsecured Exchangeable Notes 11.2 0.0 0.0 11.2 0.0
Equity 0.0 0.0 357.8 0.0
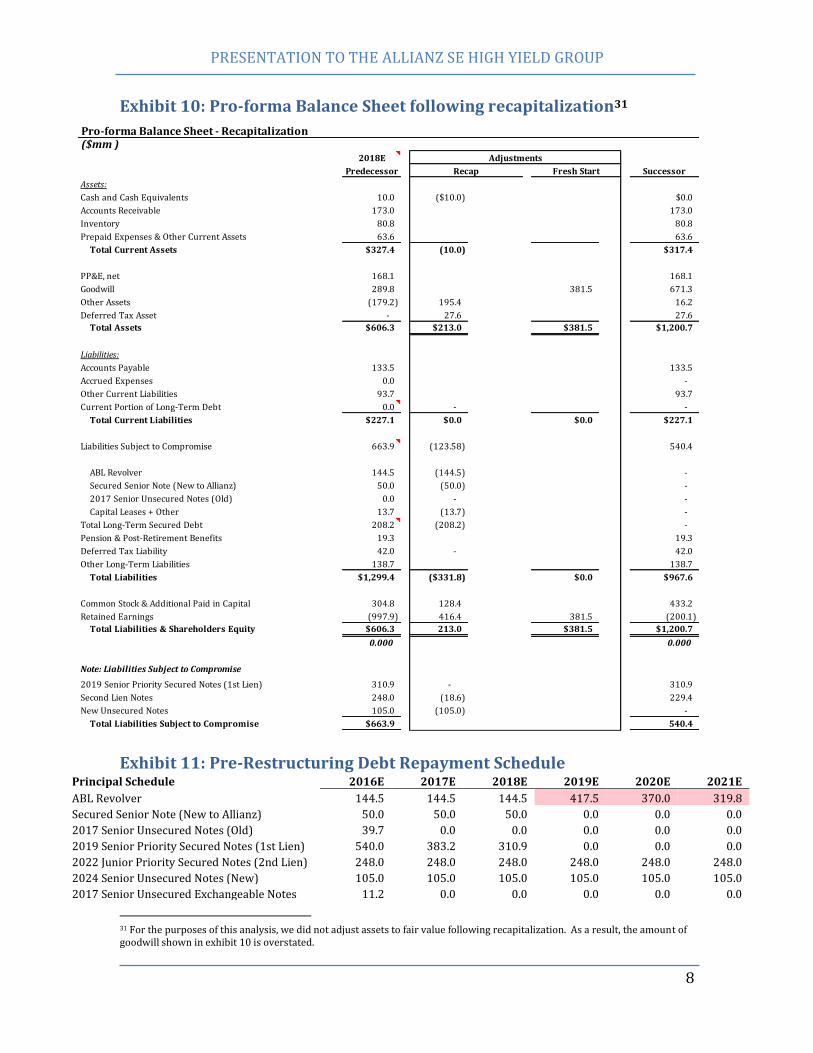
PRESENTATION TO THE ALLIANZ SE HIGH YIELD GROUP
8
Exhibit 10: Pro-forma Balance Sheet following recapitalization31
Exhibit 11: Pre-Restructuring Debt Repayment Schedule Principal Schedule 2016E 2017E 2018E 2019E 2020E 2021E
ABL Revolver 144.5 144.5 144.5 417.5 370.0 319.8
Secured Senior Note (New to Allianz) 50.0 50.0 50.0 0.0 0.0 0.0
2017 Senior Unsecured Notes (Old) 39.7 0.0 0.0 0.0 0.0 0.0
2019 Senior Priority Secured Notes (1st Lien) 540.0 383.2 310.9 0.0 0.0 0.0
2022 Junior Priority Secured Notes (2nd Lien) 248.0 248.0 248.0 248.0 248.0 248.0
2024 Senior Unsecured Notes (New) 105.0 105.0 105.0 105.0 105.0 105.0
2017 Senior Unsecured Exchangeable Notes 11.2 0.0 0.0 0.0 0.0 0.0
31 For the purposes of this analysis, we did not adjust assets to fair value following recapitalization. As a result, the amount of goodwill shown in exhibit 10 is overstated.
Pro-forma Balance Sheet - Recapitalization RECAP DRIVERS
($mm )2018E Adjustments VALUATION AND RECOVERY
Predecessor Recap Fresh Start Successor
Assets:
Cash and Cash Equivalents 10.0 ($10.0) $0.0
Accounts Receivable 173.0 173.0
Inventory 80.8 80.8
Prepaid Expenses & Other Current Assets 63.6 63.6
Total Current Assets $327.4 (10.0) $317.4
PP&E, net 168.1 168.1
Goodwill 289.8 381.5 671.3
Other Assets (179.2) 195.4 16.2
Deferred Tax Asset - 27.6 27.6
Total Assets $606.3 $213.0 $381.5 $1,200.7
Liabilities:
Accounts Payable 133.5 133.5
Accrued Expenses 0.0 -
Other Current Liabilities 93.7 93.7
Current Portion of Long-Term Debt 0.0 - -
Total Current Liabilities $227.1 $0.0 $0.0 $227.1
Liabilities Subject to Compromise 663.9 (123.58) 540.4
ABL Revolver 144.5 (144.5) -
Secured Senior Note (New to Allianz) 50.0 (50.0) -
2017 Senior Unsecured Notes (Old) 0.0 - -
Capital Leases + Other 13.7 (13.7) -
Total Long-Term Secured Debt 208.2 (208.2) -
Pension & Post-Retirement Benefits 19.3 19.3
Deferred Tax Liability 42.0 - 42.0
Other Long-Term Liabilities 138.7 138.7
Total Liabilities $1,299.4 ($331.8) $0.0 $967.6
Common Stock & Additional Paid in Capital 304.8 128.4 433.2
Retained Earnings (997.9) 416.4 381.5 (200.1)
Total Liabilities & Shareholders Equity $606.3 213.0 $381.5 $1,200.7
0.000 0.0000 0.0000 0.000
Note: Liabilities Subject to Compromise
2019 Senior Priority Secured Notes (1st Lien) 310.9 - 310.9
Second Lien Notes 248.0 (18.6) 229.4
New Unsecured Notes 105.0 (105.0) -
Total Liabilities Subject to Compromise $663.9 540.4
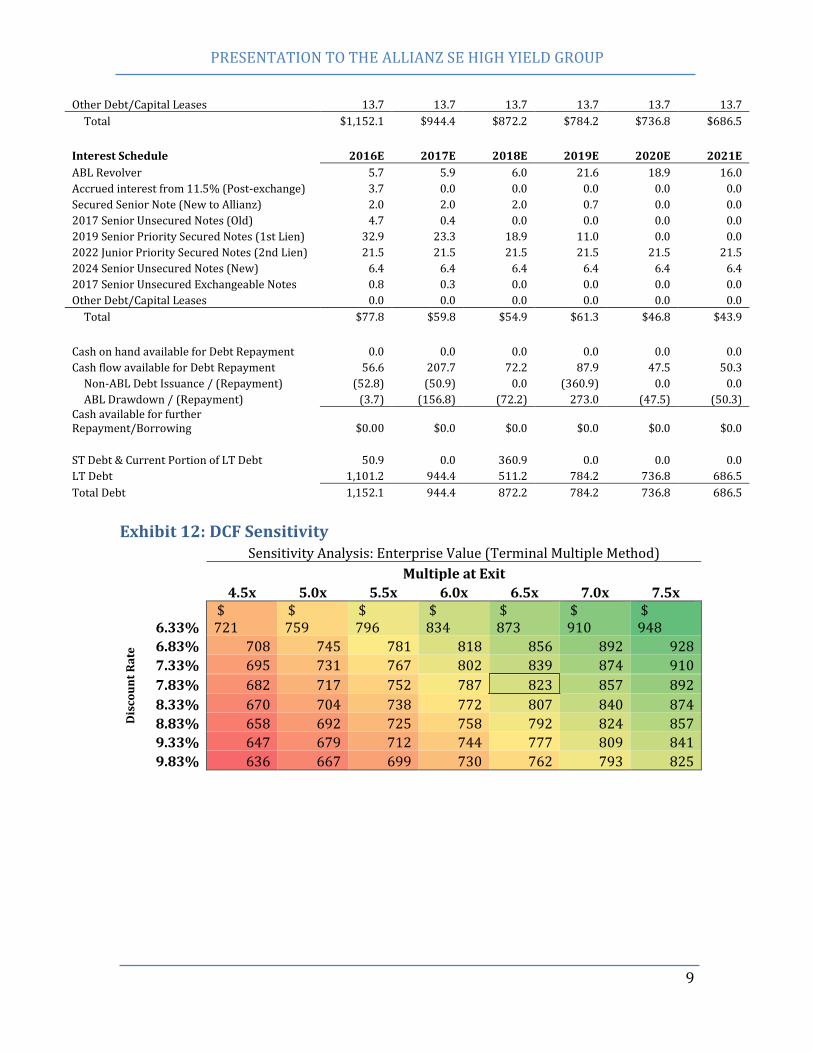
PRESENTATION TO THE ALLIANZ SE HIGH YIELD GROUP
9
Other Debt/Capital Leases 13.7 13.7 13.7 13.7 13.7 13.7
Total $1,152.1 $944.4 $872.2 $784.2 $736.8 $686.5
Interest Schedule 2016E 2017E 2018E 2019E 2020E 2021E
ABL Revolver 5.7 5.9 6.0 21.6 18.9 16.0
Accrued interest from 11.5% (Post-exchange) 3.7 0.0 0.0 0.0 0.0 0.0
Secured Senior Note (New to Allianz) 2.0 2.0 2.0 0.7 0.0 0.0
2017 Senior Unsecured Notes (Old) 4.7 0.4 0.0 0.0 0.0 0.0
2019 Senior Priority Secured Notes (1st Lien) 32.9 23.3 18.9 11.0 0.0 0.0
2022 Junior Priority Secured Notes (2nd Lien) 21.5 21.5 21.5 21.5 21.5 21.5
2024 Senior Unsecured Notes (New) 6.4 6.4 6.4 6.4 6.4 6.4
2017 Senior Unsecured Exchangeable Notes 0.8 0.3 0.0 0.0 0.0 0.0
Other Debt/Capital Leases 0.0 0.0 0.0 0.0 0.0 0.0
Total $77.8 $59.8 $54.9 $61.3 $46.8 $43.9
Cash on hand available for Debt Repayment 0.0 0.0 0.0 0.0 0.0 0.0
Cash flow available for Debt Repayment 56.6 207.7 72.2 87.9 47.5 50.3
Non-ABL Debt Issuance / (Repayment) (52.8) (50.9) 0.0 (360.9) 0.0 0.0
ABL Drawdown / (Repayment) (3.7) (156.8) (72.2) 273.0 (47.5) (50.3) Cash available for further Repayment/Borrowing $0.00 $0.0 $0.0 $0.0 $0.0 $0.0
ST Debt & Current Portion of LT Debt 50.9 0.0 360.9 0.0 0.0 0.0
LT Debt 1,101.2 944.4 511.2 784.2 736.8 686.5
Total Debt 1,152.1 944.4 872.2 784.2 736.8 686.5
Exhibit 12: DCF Sensitivity Sensitivity Analysis: Enterprise Value (Terminal Multiple Method)
Multiple at Exit
823 4.5x 5.0x 5.5x 6.0x 6.5x 7.0x 7.5x
Dis
cou
nt
Ra
te
6.33% $ 721
$ 759
$ 796
$ 834
$ 873
$ 910
$ 948
6.83% 708 745 781 818 856 892 928
7.33% 695 731 767 802 839 874 910
7.83% 682 717 752 787 823 857 892
8.33% 670 704 738 772 807 840 874
8.83% 658 692 725 758 792 824 857
9.33% 647 679 712 744 777 809 841
9.83% 636 667 699 730 762 793 825


