Price Control Separation Methodology Statement 2016

1
Table of Contents
1. Introduction 3 1.1 Purpose 3 1.2 Scope 3 1.3 Governance 3
2. Operating Systems and Structure 5 2.1 Systems 5 2.2 Operating Structure 5 2.3 Outsourced contracts 6
3. Guidance 6 3.1 Regulatory Accounting Guidelines (RAG) 6
4. Changes to methodology 8
5. Operating expenses - allocation assumptions 8 5.1 Wholesale 8 5.2 Retail 9 5.3 Household (HH) and non-household Retail 11 5.4 Allocation of costs to HH/NHH 11 5.5 Allocation of Household costs by customer type 13 5.6 Billing and collection 13
6. Group Services expenditure 14
7. Capex – allocation assumptions 16
8. Year on year comparison of operating expenditure 17 8.1 Wholesale water 17 8.2 Wholesale wastewater 18 8.3 Retail 19

2
Figures & Tables
Figure 1 - Governance Process ....................................................................................................................................... 4 Figure 2 - Operating Companies ...................................................................................................................................... 5
Table 1- Outsourced Contracts ........................................................................................................................................ 6 Table 2 - Changes to Methodology .................................................................................................................................. 8 Table 3 – Wholesale opex allocation bases ..................................................................................................................... 8 Table 4 - Retail activities by expense ............................................................................................................................. 10 Table 5 – Retail opex allocation bases ........................................................................................................................... 11 Table 6 - Household / Non-household allocation ............................................................................................................ 12 Table 7 - Group Services ............................................................................................................................................... 15 Table 8 - Wholesale Water Opex ................................................................................................................................... 17 Table 9 - Wholesale Wastewater Opex .......................................................................................................................... 18 Table 10 - Retail Opex –Household ............................................................................................................................... 19 Table 11 - Retail Opex –Non-Household........................................................................................................................ 20

3
1. Introduction
1.1 Purpose The purpose of this document is to explain the systems, processes and allocation methods used to populate the following tables in the Annual Performance Report (APR): Section 2: Price review and other segmental reporting:
2B – Totex analysis – wholesale water and wastewater;
2C – Operating cost analysis - Retail; and
2D – Historic cost analysis of fixed assets – wholesale and retail These are referred to as the ‘Section 2 tables’ throughout this document and are in line with Regulatory Accounting Guidelines (RAG), RAG 3.08. This methodology statement should be read in conjunction with the APR for the year ended 31 March 2016.
1.2 Scope This document relates to Thames Water Utilities Limited appointed business only, and should be read in conjunction with the following guidance:
RAG 2.05 ‘Guideline for the classification of costs across the price controls’;
RAG 4.05 ‘Guideline for the table definitions for the annual performance report’; and
Information notice (‘IN’) 15/01 Future company performance reporting and assurance, issued 11 February 2015 documenting regulatory reporting requirements for 1 April 2015-16 onwards; and
IN 15/18 Expectations for company annual performance reporting 2015-16; issued December 2015; and
IN 16/03 Expectations for companies demonstrating long term financial resilience; issued March 2016.
1.3 Governance We have a robust governance framework around the production of the APR, including Section 2 tables. This framework supports our commitment to our customers and stakeholders to publish information that is accurate, reliable and transparent. The specific governance processes that accompany the production of Section 2 tables are outlined below:

4
Figure 1 - Governance Process
The APR for the year ended 31 March 2016 can be found on our website [www.thameswater.co.uk/results].
Step 1
• Regulatory Reporting Team provides the business with RAG training, specifically how to populate Section 2 tables
• Table templates are sent out to business areas for population at year end
• Thames Water recording systems are set up and structured so as to capture cost centre codes that then allow information to flow up to popultae the tables
Step 2
• Section 2 tables are prepared by the information providers and Information Integrity Declaration (IID) forms signed
Step 3
• Review of table information performed by the following, as evidenced by signed IID forms:
• manager/reviewer, the business area co-ordinator, the accountable senior manager/director, the Opco Managing Director and CFO; against expectations and prior year (where applicable)
• also reviewed by the Regulatory Reporting Team, Group Financial Controller, and Group Chief Financial Officer
Step 4
• Section 2 tables are audited by external assurance provider
Step 5
• The regulatory accounts, which include the Section 2 tables, are approved by the Board
Step 6
• The external auditor provides an independent opinion on Section 2 in line with the audit opinion format set by Ofwat
5
2. Operating Systems and Structure
2.1 Systems There are two key systems used in the population of Section 2 tables:
SAP; the primary financial accounting and management tool used by the business and is the source of the data used in Anaplan
Anaplan; (implemented in 2015) is the system used for allocating operating expenditure (opex) to the upstream service level1
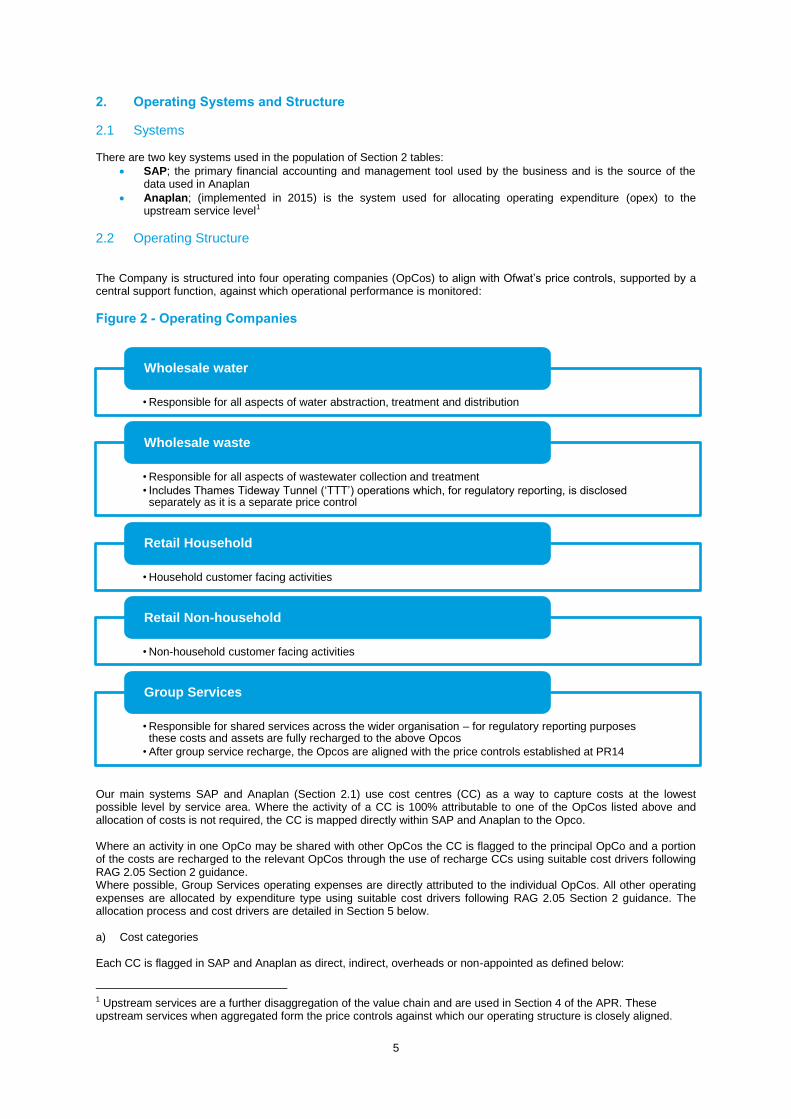
2.2 Operating Structure The Company is structured into four operating companies (OpCos) to align with Ofwat’s price controls, supported by a central support function, against which operational performance is monitored:
Figure 2 - Operating Companies
Our main systems SAP and Anaplan (Section 2.1) use cost centres (CC) as a way to capture costs at the lowest possible level by service area. Where the activity of a CC is 100% attributable to one of the OpCos listed above and allocation of costs is not required, the CC is mapped directly within SAP and Anaplan to the Opco. Where an activity in one OpCo may be shared with other OpCos the CC is flagged to the principal OpCo and a portion of the costs are recharged to the relevant OpCos through the use of recharge CCs using suitable cost drivers following RAG 2.05 Section 2 guidance. Where possible, Group Services operating expenses are directly attributed to the individual OpCos. All other operating expenses are allocated by expenditure type using suitable cost drivers following RAG 2.05 Section 2 guidance. The allocation process and cost drivers are detailed in Section 5 below. a) Cost categories Each CC is flagged in SAP and Anaplan as direct, indirect, overheads or non-appointed as defined below:
1 Upstream services are a further disaggregation of the value chain and are used in Section 4 of the APR. These upstream services when aggregated form the price controls against which our operating structure is closely aligned.
• Responsible for all aspects of water abstraction, treatment and distribution
Wholesale water
• Responsible for all aspects of wastewater collection and treatment
• Includes Thames Tideway Tunnel (‘TTT’) operations which, for regulatory reporting, is disclosed separately as it is a separate price control
Wholesale waste
• Household customer facing activities
Retail Household
• Non-household customer facing activities
Retail Non-household
• Responsible for shared services across the wider organisation – for regulatory reporting purposes these costs and assets are fully recharged to the above Opcos
• After group service recharge, the Opcos are aligned with the price controls established at PR14
Group Services
6
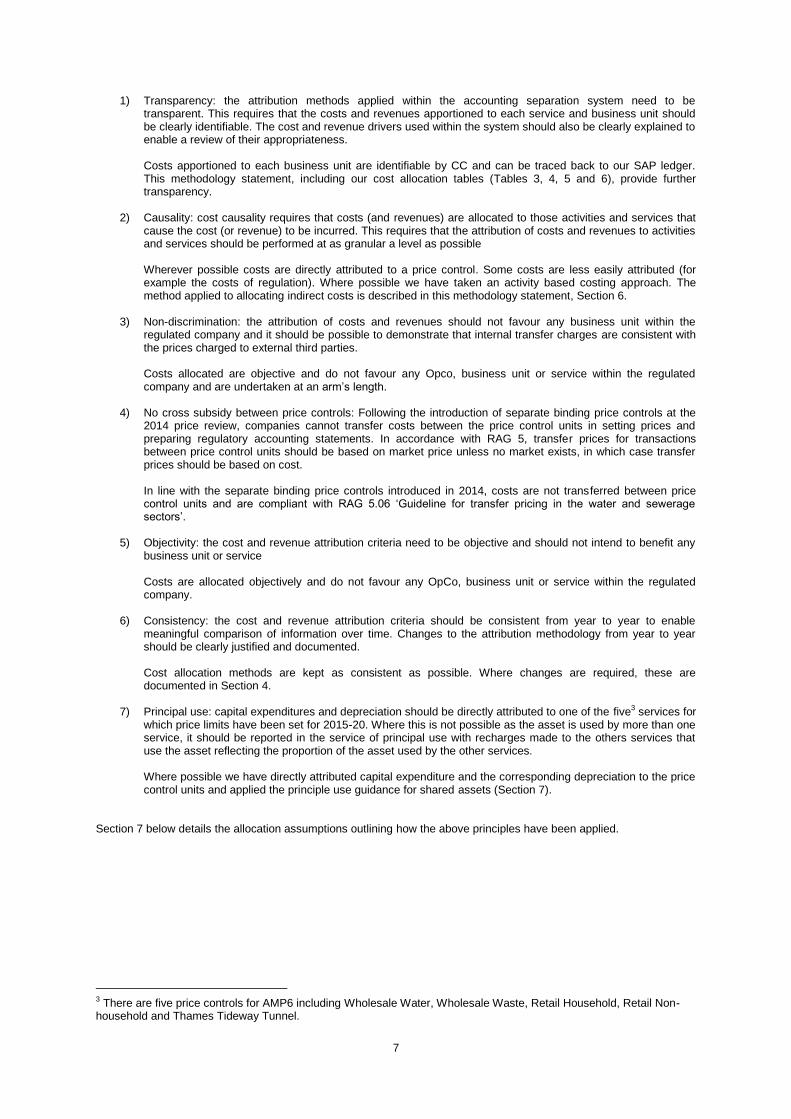
Direct costs are defined as costs which can be clearly traced to a cost object. A cost object can be a product, contract, project or site. For example, the employment costs of a Site Manager associated with his/her site, chemicals, site maintenance and power.
Indirect Costs are defined as costs which cannot be traced directly to one cost object or activity. For example, the employment costs of a Regional Manager who has several sites under his/her remit that relate to the Business Unit.
Overhead costs are defined as costs not directly related to the operational element of the Operating company. For example; Head Office costs, Senior Managerial costs, and administration.
Non-appointed costs are those incurred in the delivery of our non-appointed services such as billing commissions, rental income from non-appointed assets, property searches and others as defined in RAG 4.05.
b) Expense line items In Anaplan general ledger account codes are further grouped into the operating expense line items in the RAG 3.08 Proforma tables 2B and 2C.
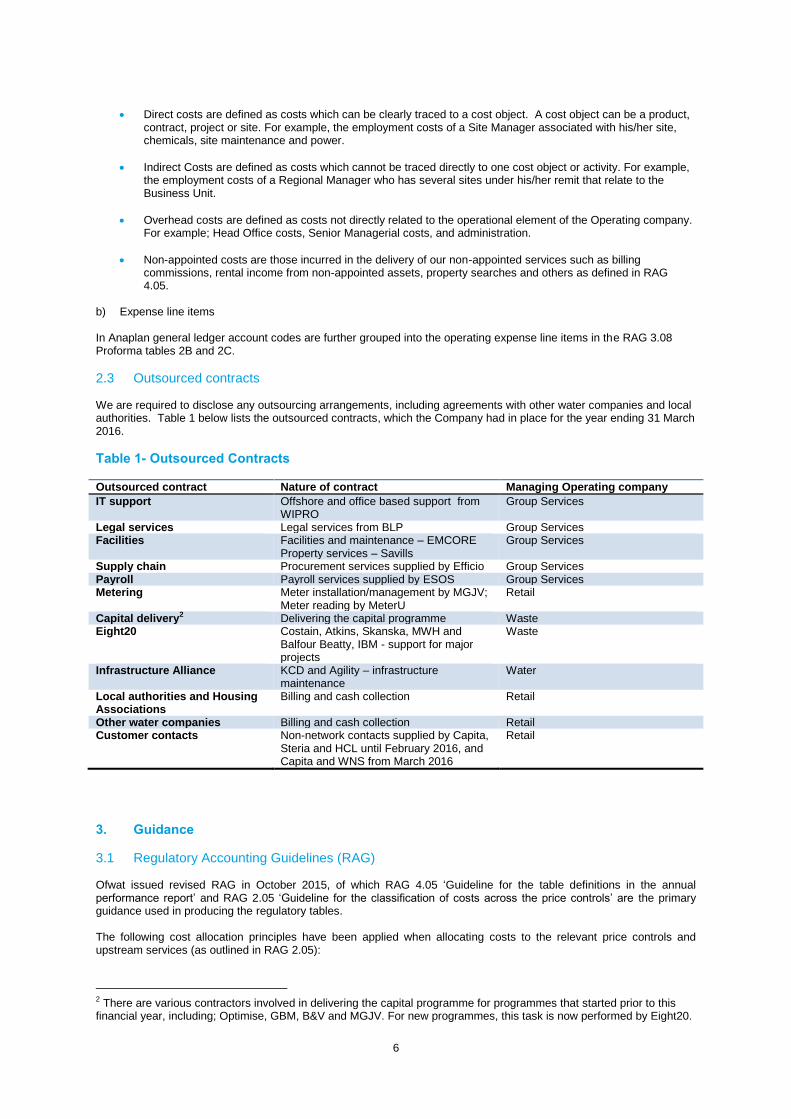
2.3 Outsourced contracts We are required to disclose any outsourcing arrangements, including agreements with other water companies and local authorities. Table 1 below lists the outsourced contracts, which the Company had in place for the year ending 31 March 2016.
Table 1- Outsourced Contracts
Outsourced contract Nature of contract Managing Operating company
IT support Offshore and office based support from WIPRO
Group Services
Legal services Legal services from BLP Group Services Facilities Facilities and maintenance – EMCORE
Property services – Savills Group Services
Supply chain Procurement services supplied by Efficio Group Services Payroll Payroll services supplied by ESOS Group Services Metering Meter installation/management by MGJV;
Meter reading by MeterU Retail
Capital delivery2 Delivering the capital programme Waste Eight20 Costain, Atkins, Skanska, MWH and
Balfour Beatty, IBM - support for major projects
Waste
Infrastructure Alliance KCD and Agility – infrastructure maintenance
Water
Local authorities and Housing Associations
Billing and cash collection Retail
Other water companies Billing and cash collection Retail Customer contacts Non-network contacts supplied by Capita,
Steria and HCL until February 2016, and Capita and WNS from March 2016
Retail
3. Guidance
3.1 Regulatory Accounting Guidelines (RAG) Ofwat issued revised RAG in October 2015, of which RAG 4.05 ‘Guideline for the table definitions in the annual performance report’ and RAG 2.05 ‘Guideline for the classification of costs across the price controls’ are the primary guidance used in producing the regulatory tables. The following cost allocation principles have been applied when allocating costs to the relevant price controls and upstream services (as outlined in RAG 2.05):
2 There are various contractors involved in delivering the capital programme for programmes that started prior to this financial year, including; Optimise, GBM, B&V and MGJV. For new programmes, this task is now performed by Eight20.
7
1) Transparency: the attribution methods applied within the accounting separation system need to be transparent. This requires that the costs and revenues apportioned to each service and business unit should be clearly identifiable. The cost and revenue drivers used within the system should also be clearly explained to enable a review of their appropriateness.
Costs apportioned to each business unit are identifiable by CC and can be traced back to our SAP ledger. This methodology statement, including our cost allocation tables (Tables 3, 4, 5 and 6), provide further transparency.
2) Causality: cost causality requires that costs (and revenues) are allocated to those activities and services that
cause the cost (or revenue) to be incurred. This requires that the attribution of costs and revenues to activities and services should be performed at as granular a level as possible
Wherever possible costs are directly attributed to a price control. Some costs are less easily attributed (for example the costs of regulation). Where possible we have taken an activity based costing approach. The method applied to allocating indirect costs is described in this methodology statement, Section 6.
3) Non-discrimination: the attribution of costs and revenues should not favour any business unit within the
regulated company and it should be possible to demonstrate that internal transfer charges are consistent with the prices charged to external third parties.
Costs allocated are objective and do not favour any Opco, business unit or service within the regulated company and are undertaken at an arm’s length.
4) No cross subsidy between price controls: Following the introduction of separate binding price controls at the
2014 price review, companies cannot transfer costs between the price control units in setting prices and preparing regulatory accounting statements. In accordance with RAG 5, transfer prices for transactions between price control units should be based on market price unless no market exists, in which case transfer prices should be based on cost.
In line with the separate binding price controls introduced in 2014, costs are not transferred between price control units and are compliant with RAG 5.06 ‘Guideline for transfer pricing in the water and sewerage sectors’.
5) Objectivity: the cost and revenue attribution criteria need to be objective and should not intend to benefit any
business unit or service
Costs are allocated objectively and do not favour any OpCo, business unit or service within the regulated company.
6) Consistency: the cost and revenue attribution criteria should be consistent from year to year to enable
meaningful comparison of information over time. Changes to the attribution methodology from year to year should be clearly justified and documented.
Cost allocation methods are kept as consistent as possible. Where changes are required, these are documented in Section 4.
7) Principal use: capital expenditures and depreciation should be directly attributed to one of the five3 services for which price limits have been set for 2015-20. Where this is not possible as the asset is used by more than one service, it should be reported in the service of principal use with recharges made to the others services that use the asset reflecting the proportion of the asset used by the other services. Where possible we have directly attributed capital expenditure and the corresponding depreciation to the price control units and applied the principle use guidance for shared assets (Section 7).
Section 7 below details the allocation assumptions outlining how the above principles have been applied.
3 There are five price controls for AMP6 including Wholesale Water, Wholesale Waste, Retail Household, Retail Non-household and Thames Tideway Tunnel.

8
4. Changes to methodology As a result of management review and to align more closely with RAG 2.05, the cost drivers for the following costs have changed from prior year:
Table 2 - Changes to Methodology
Expenditure line Cost driver 2015/16 Cost driver 2014/15
General and Support (“G&S”) External affairs (excluding Customer Assistance Fund)
FTE Direct costs
G&S Health & safety FTE Direct employment costs
G&S Legal (excluding cases which can be directly attributed)
FTE Direct costs
G&S IT FTE Direct costs Local authority rates (Wastewater – sewage and sludge works)
Non-infrastructure gross modern equivalent asset value (GMEAV) in line with Ofwat guidance
FTE or floor space
Cumulo4 rates (Water) Total gross modern equivalent asset value (GMEAV) in line with Ofwat guidance
FTE or floor space
5. Operating expenses - allocation assumptions The following sections describe the allocation assumptions used in the production of the operating expense line items of table 2B reported in the APR. Recharges between OpCos are allocated using the cost drivers described in tables 3, 4, 5 and 6 below.
5.1 Wholesale The following tables set out by line item the basis of allocations used to populate the Section 2 tables.
Table 3 – Wholesale opex allocation bases
Expenditure line Allocation basis Cost driver
Power Direct N/A Income treated as negative expenditure 5 (Waste only)
Direct N/A
Service charges/discharge consents
Direct N/A
Bulk supply /Bulk discharge Direct N/A Other operating expenditure: Employment costs Direct N/A Hired and contracted Direct N/A Materials and consumables Direct N/A Other direct costs Direct (primarily operational contract
costs) N/A
General and support (G&S) Direct for Water/Waste overheads; for Group Services G&S allocations see Section 6
See Section 6
Scientific services Direct N/A Other business activities Regulatory costs – per Final
Determination Allocated 4/9th each to Waste and Water. 1/9th Retail, in line with Final Determination
Local authority rates Direct for operational sites; allocated for central sites, for example head office
Gross modern equivalent asset value (GMEAV) in line with Ofwat guidance
Cumulo rates (included in local authority rates) (Water only)
Direct Total gross modern equivalent asset value (GMEAV) in line with Ofwat guidance
4 Cumulo rates are business rates paid on water network assets with a rateable value, similar to other business rates 5 Income treated as negative expenditure; includes income from sludge cake sales and Renewable Obligation
Certificates (ROC), levy exemption certificates and the national grid reserve, in line with guidance provided in RAG 4.05.
9
Expenditure line Allocation basis Cost driver
Third party services Direct N/A
5.2 Retail The Retail OpCo reports the customer facing costs of water and waste services. These are reported in APR table 2C. 5.2.1 Allocation of CCs to retail activities The allocation of operating expenditure between Retail household (‘HH’) and Retail Non-household (‘NHH’) is an automated process through the Anaplan regulatory model. The following sections provide the basis for the production of APR table 2C.

10
Table 4 - Retail activities by expense
The majority of costs reported within table 2C are directly attributable and reported within the Retail OpCo. The ‘Recharged from Wholesale’ line in table 4 above shows those direct costs which are not managed by the Retail OpCo and are recharged from Wholesale OpCos following classification guidance in RAG 2.05.
Bill
ing
Pay
men
t, r
emit
tan
ce a
nd
cas
h
han
dlin
g
Ch
arit
able
Tru
st d
on
atio
ns
Vu
lner
able
cu
sto
mer
sch
emes
No
n-n
etw
ork
cu
sto
mer
enq
uir
ies
& c
om
pla
ints
Net
wo
rk c
ust
om
er e
nq
uir
ies
and
co
mp
lain
ts
Inve
stig
ato
ry/f
irst
tim
e vi
sits
to c
ust
om
ers
Oth
er c
ust
om
er s
ervi
ces
Revenue Contact Centre Agents
Based on average Full Time Equivalent
(“FTE”) requirements for Work
Baskets/Work streams as per Agents
Workload Planning (Long Term Plan)
Operational Contact Centre
Agents
Specific to Network /Operational Enquiries
& Complaints
Operational contact centreSpecific to Network /Operational Enquiries
& Complaints
Office agentsPro-rata to FTE split between Revenue and
Operational Contact Centre
Outsourced Office Agents
Based on Analysis of Calls Taken, and
Work streams / Workbaskets for
Outsource providers.
Mail house Based on volumes of type of bills/mail
Key Accounts (all NHH)Based on Managers Activity Summary for
key accounts agents
Head of Revenue Based on FTE allocation relating to
Manager's roles/duties
Revenue Agents (debt recovery) Specific to Debt Management
Cash & Debt Staff & Other
Operating costs
Specific to Payment Handling & Debt
Management, allocation based on
managers FTE assessment.
Cash & Debt - Payment
CommissionsSpecific to Payment Handling
Cash & Debt - DCA commissions Specific to Debt Management
Cash & Debt - Charitable
DonationsSpecific to Charitable Donations
Cash & Debt - LA/HA
Commissions (all HH)
Management judgement based on TW
relative costs for the activities covered, and
historical discussions with LA/HA's.
Finance General & Support
Other General & Support
Meter reading Specific to meter reading
Sales Investigation Specific to Sales Investigation
Cash & Debt - Office Services Specific to Debt Management
WOC Bad Debt Specific to Doubtful Debts
WOC Commissions
Allocation across activities covered by
WOCs pro-rata to their Retail Costs
submissions
Bad Debt Provision & Excess
CreditsSpecific to Doubtful Debts
Customer Insight & Resolution -
RCC
Specific to Non-Network Customer
Enquiries & Complaints
Customer Insight & Resolution
Ops
Specific to Network Customer Enquiries &
Complaints, including GSS payments
allocated to other operating expenditure
Customer experience and
engagement - Staff costs
Based on Managers assessment of FTE's
supporting customer non-network and
network activities
Customer experience and
engagement - Non-Staff costs
Specific costs relating to customer non-
network, network activities and billing with
some costs shared across these activities
(based on managers assessment)
Brand Team Based on Managers assessment of FTE's
Digital Communications Based on Managers assessment of FTE's
Affordability Specific to Vulnerable Grps
Regulation General and support cost
IT & Change -Transformation General and support cost
Senior Management Team General and support cost
Water Efficiency (Retail) Specific to Water Efficiency
Developer Services Specific to Developer services
Recharged from Wholesale Various
Customer Assuistance Fund Specific to Vulnerable Grps
Retail
activities by cost centreBasis of allocation
Deb
t m
anag
emen
t
Do
ub
tfu
l deb
ts
Met
er r
ead
ing
Dis
con
nec
tio
ns
and
reco
nn
ecti
on
s
Dem
and
-sid
e w
ater
eff
icie
ncy
init
iati
ves
Cu
sto
mer
sid
e le
aks
Oth
er d
irec
t co
sts
Customer services
Ser
vice
s to
dev
elo
per
s

11
Table 5 – Retail opex allocation bases
Expenditure line Allocation basis Cost driver
Services to developers – managed by the Wholesale OpCos, the cost of supporting developers in administration function is recharged to Retail
Direct
n/a
Investigatory / first time visits where it is found that it is not a network issue – this cost is managed by the Wholesale team
Direct
n/a
Doubtful debts – wholesale only if relate to wholesale revenue eg bulk supplies
Direct
n/a
Demand side water efficiency - recharged to Retail unless spend incurred to meet Wholesale outcome
Direct
n/a
Disconnections / Reconnections - administration recharged to Retail Direct
n/a
Customer side leakage – recharged to Retail unless spend incurred to meet Wholesale outcome
Direct
n/a
Other direct costs Direct n/a Other business activities – regulation costs Per Final Determination Allocate1/9th to
Retail General and support costs Direct for Retail
overheads; for Group Services G&S allocations see Section 6 below
See Section 6
5.3 Household (HH) and non-household Retail 5.3.1 Definition of household and non-household properties The Companies allocation of costs into HH and NHH is compliant with the definitions below as stated in RAG 2.05. Households: These are properties used as single domestic dwellings (normally occupied), receiving water for domestic purposes which are not factories, offices or commercial premises. These include cases where a single aggregate bill is issued to cover separate dwellings having individual standing charges. (In some instances the standing charge may be zero). The number of dwellings attracting an individual standing charge and not the number of bills should be counted. Exclude mixed/commercial properties and multiple HH properties, e.g. blocks of flats having only one standing charge. Examples of households:
typical family dwelling, i.e. terraced, semi-detached, detached house or flat having individual standing charges; or
Local authority family dwellings which each have individual standing charges but may be included in an aggregate water bill.
Non-households: These are properties receiving water for domestic purposes, but which are not occupied as domestic premises, or where domestic dwellings are combined with other properties, or where properties have multiple occupations, but have only one standing charge. The number of bills should be counted in this case. Examples of non-households:
industrial/commercial properties (e.g. institutions, farms, public houses, offices);
combined premises with a single standing charge, such as a flat above a shop; or
block of flats, or caravan site (consisting of multiple dwellings), but only having one standing charge. These must be counted as one NHH property.
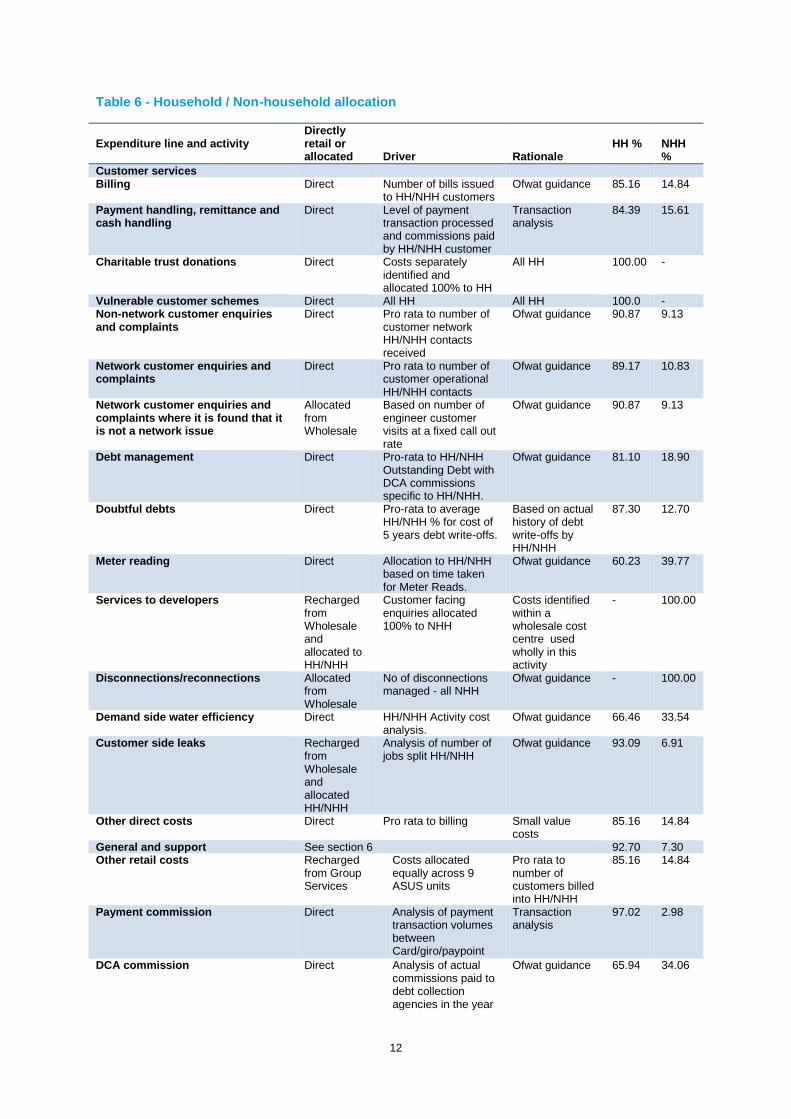
5.4 Allocation of costs to HH/NHH Table 6 below details for each activity the methodology used to allocate costs to HH and NHH cost driver and the rationale used. This table also provides the percentage allocation for each activity to HH/NHH.
12
Table 6 - Household / Non-household allocation
Expenditure line and activity
Directly retail or allocated
Driver
Rationale
HH %
NHH %
Customer services Billing Direct Number of bills issued
to HH/NHH customers Ofwat guidance 85.16
14.84
Payment handling, remittance and cash handling
Direct Level of payment transaction processed and commissions paid by HH/NHH customer
Transaction analysis
84.39 15.61
Charitable trust donations Direct Costs separately identified and allocated 100% to HH
All HH 100.00 -
Vulnerable customer schemes Direct All HH All HH 100.0 - Non-network customer enquiries and complaints
Direct Pro rata to number of customer network HH/NHH contacts received
Ofwat guidance 90.87 9.13
Network customer enquiries and complaints
Direct Pro rata to number of customer operational HH/NHH contacts
Ofwat guidance 89.17 10.83
Network customer enquiries and complaints where it is found that it is not a network issue
Allocated from Wholesale
Based on number of engineer customer visits at a fixed call out rate
Ofwat guidance 90.87 9.13
Debt management Direct Pro-rata to HH/NHH Outstanding Debt with DCA commissions specific to HH/NHH.
Ofwat guidance 81.10 18.90
Doubtful debts Direct Pro-rata to average HH/NHH % for cost of 5 years debt write-offs.
Based on actual history of debt write-offs by HH/NHH
87.30 12.70
Meter reading Direct Allocation to HH/NHH based on time taken for Meter Reads.
Ofwat guidance 60.23 39.77
Services to developers Recharged from Wholesale and allocated to HH/NHH
Customer facing enquiries allocated 100% to NHH
Costs identified within a wholesale cost centre used wholly in this activity
- 100.00
Disconnections/reconnections Allocated from Wholesale
No of disconnections managed - all NHH
Ofwat guidance - 100.00
Demand side water efficiency Direct HH/NHH Activity cost analysis.
Ofwat guidance 66.46 33.54
Customer side leaks Recharged from Wholesale and allocated HH/NHH
Analysis of number of jobs split HH/NHH
Ofwat guidance 93.09 6.91
Other direct costs Direct Pro rata to billing Small value costs
85.16 14.84
General and support See section 6 92.70 7.30 Other retail costs Recharged
from Group Services
Costs allocated equally across 9 ASUS units
Pro rata to number of customers billed into HH/NHH
85.16 14.84
Payment commission Direct Analysis of payment transaction volumes between Card/giro/paypoint
Transaction analysis
97.02 2.98
DCA commission Direct Analysis of actual commissions paid to debt collection agencies in the year
Ofwat guidance 65.94 34.06
13
Expenditure line and activity
Directly retail or allocated
Driver
Rationale
HH %
NHH %
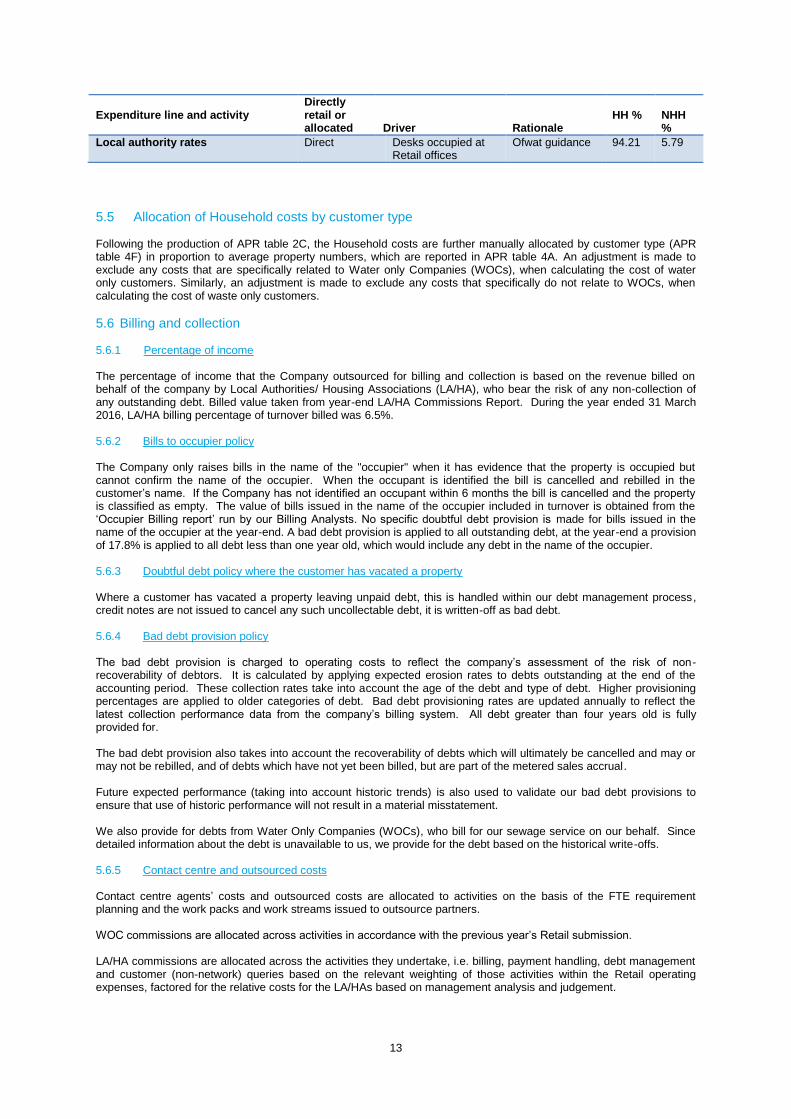
Local authority rates Direct Desks occupied at Retail offices
Ofwat guidance 94.21 5.79
5.5 Allocation of Household costs by customer type Following the production of APR table 2C, the Household costs are further manually allocated by customer type (APR table 4F) in proportion to average property numbers, which are reported in APR table 4A. An adjustment is made to exclude any costs that are specifically related to Water only Companies (WOCs), when calculating the cost of water only customers. Similarly, an adjustment is made to exclude any costs that specifically do not relate to WOCs, when calculating the cost of waste only customers.
5.6 Billing and collection 5.6.1 Percentage of income The percentage of income that the Company outsourced for billing and collection is based on the revenue billed on behalf of the company by Local Authorities/ Housing Associations (LA/HA), who bear the risk of any non-collection of any outstanding debt. Billed value taken from year-end LA/HA Commissions Report. During the year ended 31 March 2016, LA/HA billing percentage of turnover billed was 6.5%. 5.6.2 Bills to occupier policy The Company only raises bills in the name of the "occupier" when it has evidence that the property is occupied but cannot confirm the name of the occupier. When the occupant is identified the bill is cancelled and rebilled in the customer’s name. If the Company has not identified an occupant within 6 months the bill is cancelled and the property is classified as empty. The value of bills issued in the name of the occupier included in turnover is obtained from the ‘Occupier Billing report’ run by our Billing Analysts. No specific doubtful debt provision is made for bills issued in the name of the occupier at the year-end. A bad debt provision is applied to all outstanding debt, at the year-end a provision of 17.8% is applied to all debt less than one year old, which would include any debt in the name of the occupier. 5.6.3 Doubtful debt policy where the customer has vacated a property Where a customer has vacated a property leaving unpaid debt, this is handled within our debt management process, credit notes are not issued to cancel any such uncollectable debt, it is written-off as bad debt. 5.6.4 Bad debt provision policy The bad debt provision is charged to operating costs to reflect the company’s assessment of the risk of non-recoverability of debtors. It is calculated by applying expected erosion rates to debts outstanding at the end of the accounting period. These collection rates take into account the age of the debt and type of debt. Higher provisioning percentages are applied to older categories of debt. Bad debt provisioning rates are updated annually to reflect the latest collection performance data from the company’s billing system. All debt greater than four years old is fully provided for. The bad debt provision also takes into account the recoverability of debts which will ultimately be cancelled and may or may not be rebilled, and of debts which have not yet been billed, but are part of the metered sales accrual. Future expected performance (taking into account historic trends) is also used to validate our bad debt provisions to ensure that use of historic performance will not result in a material misstatement. We also provide for debts from Water Only Companies (WOCs), who bill for our sewage service on our behalf. Since detailed information about the debt is unavailable to us, we provide for the debt based on the historical write-offs. 5.6.5 Contact centre and outsourced costs Contact centre agents’ costs and outsourced costs are allocated to activities on the basis of the FTE requirement planning and the work packs and work streams issued to outsource partners. WOC commissions are allocated across activities in accordance with the previous year’s Retail submission. LA/HA commissions are allocated across the activities they undertake, i.e. billing, payment handling, debt management and customer (non-network) queries based on the relevant weighting of those activities within the Retail operating expenses, factored for the relative costs for the LA/HAs based on management analysis and judgement.

14
5.6.6 Further assumptions The following assumptions have been applied consistently with the prior period. Doubtful debts split into HH/NHH are based on five year history of the debt write-offs. RAG 2.05 states that companies should directly attribute costs on a customer specific basis, however, our systems do not currently enable us to report on this basis. Demand side water efficiency initiatives within Retail refer to the Base Line Programme (“BSWE”) costs identified. Local authority rates are allocated to Retail based on office occupancy of the Retail OpCo for Walnut Court in Swindon, and Kemble Court in Reading where the Operations contact centre is based. These costs are shown within the Local authority rates caption in APR table 2C. Third party costs – there are no costs incurred within Retail that are classed as third party costs, therefore no costs have been reported within this line.
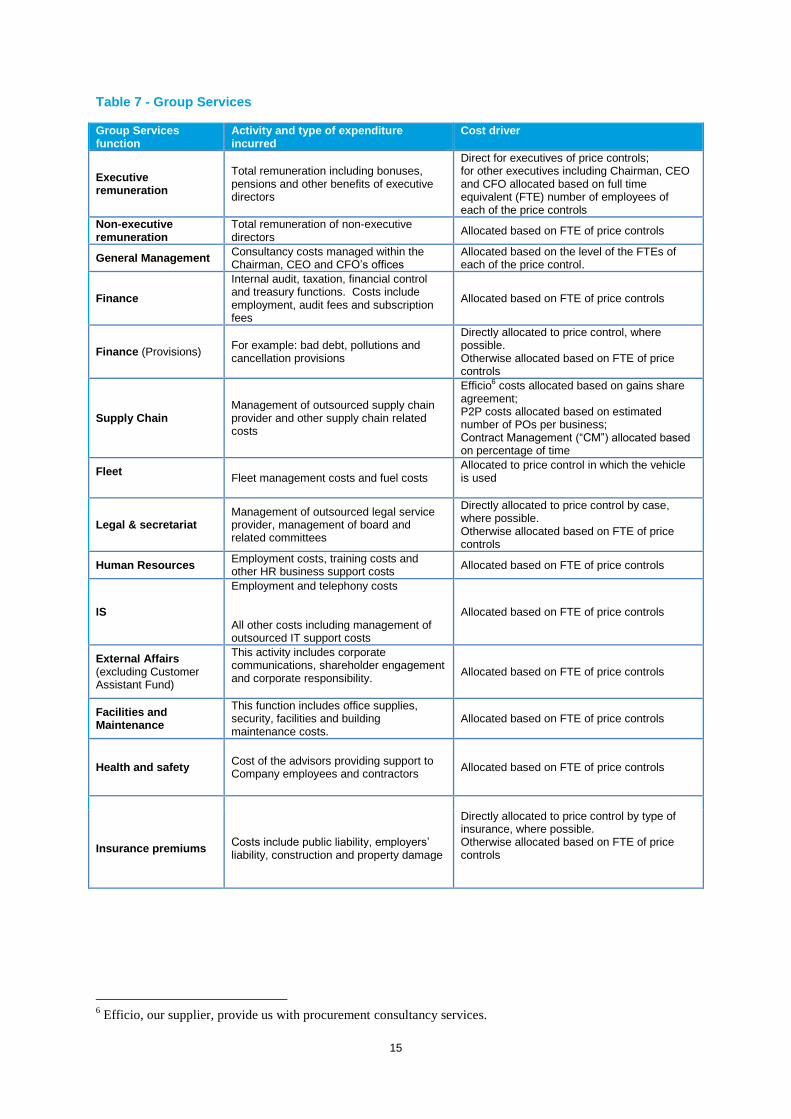
6. Group Services expenditure These costs reflect the support services functions within the company, which are detailed below in Table 7 with an explanation of cost driver used. All of these costs are classified as General and Support overheads (G&S).The costs allocated to the price controls are net of any recharges of costs that the Group Services functions provide to associate companies of the group and recharges to the non-appointed business of the Company. All Group Services costs are shown within the ‘Other operating expenditure’ line in APR table 2B; none are shown as direct expenditure. Management considers that the allocation assumptions and cost drivers used are appropriate and are compliant with the cost allocation principles contained in RAG 2.05.
15
Table 7 - Group Services
Group Services function
Activity and type of expenditure incurred
Cost driver
Executive remuneration
Total remuneration including bonuses, pensions and other benefits of executive directors
Direct for executives of price controls; for other executives including Chairman, CEO and CFO allocated based on full time equivalent (FTE) number of employees of each of the price controls
Non-executive remuneration
Total remuneration of non-executive directors
Allocated based on FTE of price controls
General Management Consultancy costs managed within the Chairman, CEO and CFO’s offices
Allocated based on the level of the FTEs of each of the price control.
Finance
Internal audit, taxation, financial control and treasury functions. Costs include employment, audit fees and subscription fees
Allocated based on FTE of price controls
Finance (Provisions) For example: bad debt, pollutions and cancellation provisions
Directly allocated to price control, where possible. Otherwise allocated based on FTE of price controls
Supply Chain Management of outsourced supply chain provider and other supply chain related costs
Efficio6 costs allocated based on gains share agreement; P2P costs allocated based on estimated number of POs per business; Contract Management (“CM”) allocated based on percentage of time
Fleet
Fleet management costs and fuel costs Allocated to price control in which the vehicle is used
Legal & secretariat Management of outsourced legal service provider, management of board and related committees
Directly allocated to price control by case, where possible. Otherwise allocated based on FTE of price controls
Human Resources Employment costs, training costs and other HR business support costs
Allocated based on FTE of price controls
IS
Employment and telephony costs All other costs including management of outsourced IT support costs
Allocated based on FTE of price controls
External Affairs (excluding Customer Assistant Fund)
This activity includes corporate communications, shareholder engagement and corporate responsibility.
Allocated based on FTE of price controls
Facilities and Maintenance
This function includes office supplies, security, facilities and building maintenance costs.
Allocated based on FTE of price controls
Health and safety Cost of the advisors providing support to Company employees and contractors
Allocated based on FTE of price controls
Insurance premiums Costs include public liability, employers’ liability, construction and property damage
Directly allocated to price control by type of insurance, where possible. Otherwise allocated based on FTE of price controls
6 Efficio, our supplier, provide us with procurement consultancy services.

16
7. Capex – allocation assumptions The following section describes the methodology used in the production of the capital expenditure lines in APR tables 2B to 2D. The methodology for producing the capital expenditure (‘capex’) lines and attributing spend across the price controls in tables 2B to 2D follows the guidance in RAG 2.05 Section 2.3. Historic cost fixed asset data is maintained in SAP. Every capital project is assigned a purpose code and every asset is assigned to an asset class. Our purpose code and asset class structures have been renewed for AMP6 to align more readily with the price control and Accounting Separation / Upstream Services level structure. The accounting class also identifies whether the asset is infrastructure or non-infrastructure and is used to split the capex line items in table 2B. Assets have a location code in SAP which can be used to determine eg Retail assets based at out separate Retail offices. Assets are classed as “Base” or “Enhancement” in SAP. Base capex is reported in the “Maintaining the long term capability of assets” line in table 2B and enhancement capex is reported in the “Other capital expenditure” line. The majority of assets and all operational assets can be assigned directly to a price control (or non-appointed). The assets that then remain unallocated comprise largely management & general (M&G) assets. Examples include Fleet and IT assets as well as office buildings on non-operational sites. Assets produced from these projects are reviewed manually in order to assign them to the most appropriate price control on a principal user basis in accordance with RAG 2.05. In some cases such assets are used by multiple price controls and so are deemed ‘shared use assets’. In accordance with RAG 4.05, such shared use assets have been wholly allocated in tables 2B and 2D to the price control of principal use, which in almost all cases for the Company is the wholesale wastewater price control. The main examples of such assets are, as per above, IT systems and office buildings on non-operational sites. In table 2D cost, depreciation and net book value are shown in the price control of principal use only. Likewise, in accordance with RAG 4.05 line item definitions, Retail depreciation is shown recorded in the price control of principal use. Where assets are used by more than one price control, a recharge is made from the principal user to the other price controls to reflect the usage of the asset. The recharge is calculated as an allocation of the depreciation charge. The cost driver and basis for the allocations follow the same basis as operating expenses allocations per Table 7 above. These recharges are reported in APR table 2A.
17
8. Year on year comparison of operating expenditure
8.1 Wholesale water
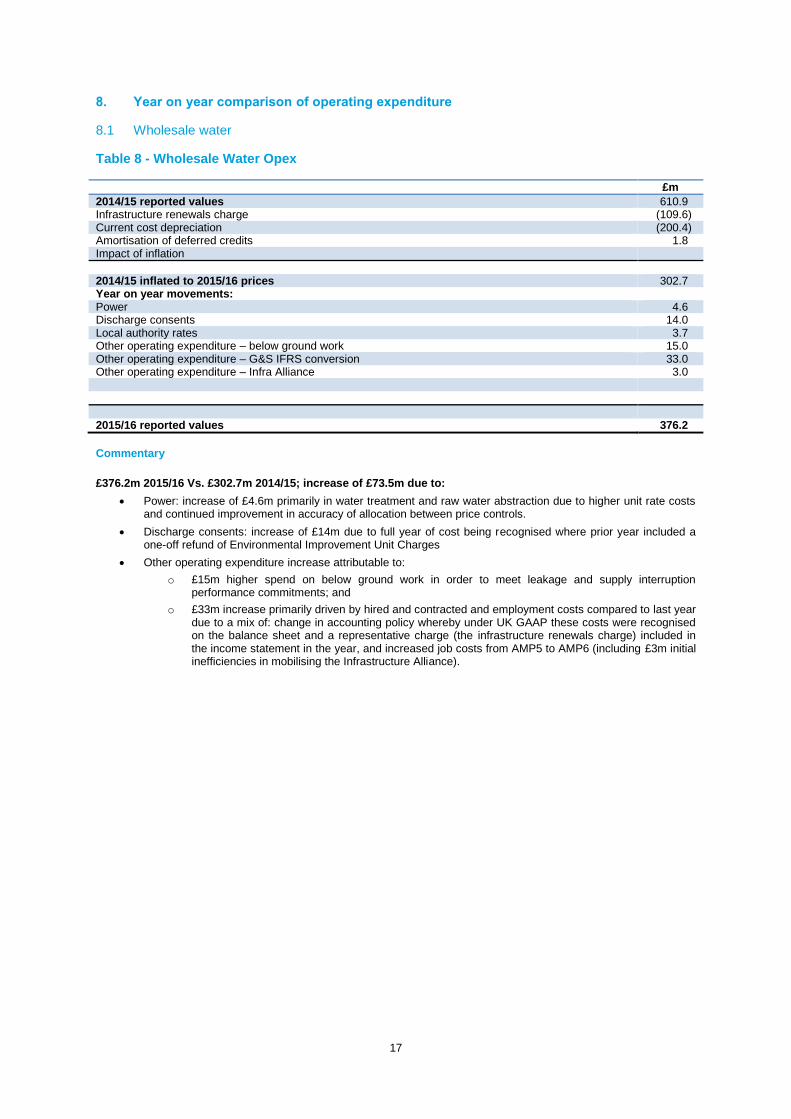
Table 8 - Wholesale Water Opex
£m
2014/15 reported values 610.9 Infrastructure renewals charge (109.6) Current cost depreciation (200.4) Amortisation of deferred credits 1.8 Impact of inflation
2014/15 inflated to 2015/16 prices 302.7 Year on year movements: Power 4.6 Discharge consents 14.0 Local authority rates 3.7 Other operating expenditure – below ground work 15.0 Other operating expenditure – G&S IFRS conversion 33.0 Other operating expenditure – Infra Alliance 3.0
2015/16 reported values 376.2
Commentary
£376.2m 2015/16 Vs. £302.7m 2014/15; increase of £73.5m due to:
Power: increase of £4.6m primarily in water treatment and raw water abstraction due to higher unit rate costs and continued improvement in accuracy of allocation between price controls.
Discharge consents: increase of £14m due to full year of cost being recognised where prior year included a one-off refund of Environmental Improvement Unit Charges
Other operating expenditure increase attributable to:
o £15m higher spend on below ground work in order to meet leakage and supply interruption performance commitments; and
o £33m increase primarily driven by hired and contracted and employment costs compared to last year due to a mix of: change in accounting policy whereby under UK GAAP these costs were recognised on the balance sheet and a representative charge (the infrastructure renewals charge) included in the income statement in the year, and increased job costs from AMP5 to AMP6 (including £3m initial inefficiencies in mobilising the Infrastructure Alliance).

18
8.2 Wholesale wastewater
Table 9 - Wholesale Wastewater Opex
£m
2014/15 reported values 652.9 Infrastructure renewals charge (48.9) Current cost depreciation (279.8) Amortisation of deferred credits 8.8 Impact of inflation
2014/15 inflated to 2015/16 prices 333.0 Year on year movements: Power (5.3) ROC income treated as negative expenditure (2.0) Other operating expenditure - IFRS conversion 61.0 Other operating expenditure – G&S IT costs 5.7
2015/16 reported values 392.4
Commentary
£392.4m 2015/16 Vs. £333.0 2014/15; increase of £59.4m due to:
Power: decrease of £5.3 due to benefit of self-generation with higher unit rate costs and continued improvement in accuracy of allocation between price controls.
Income treated as negative expenditure is Renewable obligation certificate (ROC) income which increased £2m;
Other operating expenditure; increase of £66.7m attributable to:
o £61m driven by IFRS conversion resulting in previously capitalised costs now being expensed; and
o General and Support (G&S) IT costs £5.7m increase relating to the AMP6 Transformation project.
19
8.3 Retail
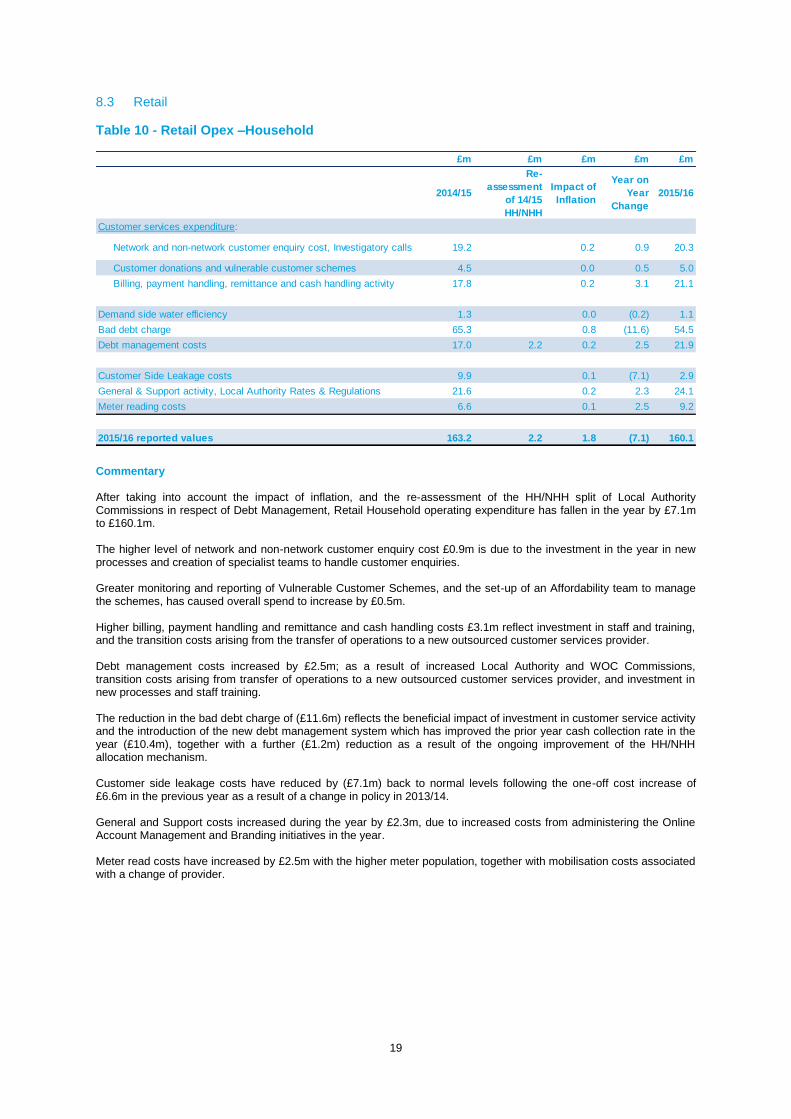
Table 10 - Retail Opex –Household
Commentary After taking into account the impact of inflation, and the re-assessment of the HH/NHH split of Local Authority Commissions in respect of Debt Management, Retail Household operating expenditure has fallen in the year by £7.1m to £160.1m. The higher level of network and non-network customer enquiry cost £0.9m is due to the investment in the year in new processes and creation of specialist teams to handle customer enquiries. Greater monitoring and reporting of Vulnerable Customer Schemes, and the set-up of an Affordability team to manage the schemes, has caused overall spend to increase by £0.5m. Higher billing, payment handling and remittance and cash handling costs £3.1m reflect investment in staff and training, and the transition costs arising from the transfer of operations to a new outsourced customer services provider. Debt management costs increased by £2.5m; as a result of increased Local Authority and WOC Commissions, transition costs arising from transfer of operations to a new outsourced customer services provider, and investment in new processes and staff training. The reduction in the bad debt charge of (£11.6m) reflects the beneficial impact of investment in customer service activity and the introduction of the new debt management system which has improved the prior year cash collection rate in the year (£10.4m), together with a further (£1.2m) reduction as a result of the ongoing improvement of the HH/NHH allocation mechanism. Customer side leakage costs have reduced by (£7.1m) back to normal levels following the one-off cost increase of £6.6m in the previous year as a result of a change in policy in 2013/14. General and Support costs increased during the year by £2.3m, due to increased costs from administering the Online Account Management and Branding initiatives in the year. Meter read costs have increased by £2.5m with the higher meter population, together with mobilisation costs associated with a change of provider.
£m £m £m £m £m
2014/15
Re-
assessment
of 14/15
HH/NHH
Impact of
Inflation
Year on
Year
Change
2015/16
Customer services expenditure:
Network and non-network customer enquiry cost, Investigatory calls 19.2 0.2 0.9 20.3
Customer donations and vulnerable customer schemes 4.5 0.0 0.5 5.0
Billing, payment handling, remittance and cash handling activity 17.8 0.2 3.1 21.1
Demand side water efficiency 1.3 0.0 (0.2) 1.1
Bad debt charge 65.3 0.8 (11.6) 54.5
Debt management costs 17.0 2.2 0.2 2.5 21.9
Customer Side Leakage costs 9.9 0.1 (7.1) 2.9
General & Support activity, Local Authority Rates & Regulations 21.6 0.2 2.3 24.1
Meter reading costs 6.6 0.1 2.5 9.2
2015/16 reported values 163.2 2.2 1.8 (7.1) 160.1

20
The following table details those cost included within other operating expenses:
Retail £m
Customer side leakage costs 2.9 General & support costs 23.4 Regulation costs 0.3 Demand side water efficiency costs 1.1
2015/16 reported values 27.7
Table 11 - Retail Opex –Non-Household
Commentary After taking into account the impact of inflation, and the re-assessment of the HH/NHH split of Local Authority Commissions in respect of Debt Management, Retail Non-Household operating expenditure has increased in the year by £4.9m to £27.7m. The transition of customer accounts from one of our partners into the company’s own systems has contributed to an increase in the bad debt charge of £2.7m as these are assimilated into the company’s own systems, together with a further £1.2m increase as a result of the ongoing improvement of the HH/NHH allocation mechanism. Debt Management costs increased by £1.3m reflecting the transition costs arising from transfer of operations to a new outsourced customer services provider. As a result of cash action plan activity to recover the cash collection deficit seen in the first 6 months of 2015/16, more debts were referred to the field stage of collection, which resulted in more commission spend than the previous year. Meter read costs have increased by £0.9m with the higher meter population, together with mobilisation costs associated with a change of provider. The following table details those cost included within other operating expenses:
£m £m £m £m £m
2014/15
Re-
assessment
of 14/15
HH/NHH
Impact of
Inflation
Year on
Year
Change
2015/16
Customer services expenditure:
Network and non-network customer enquiry cost, Investigatory
calls2.6 0.0 (0.8) 1.9
Customer donations and vulnerable customer schemes 0.0 0.0 0.0 0.0
Billing, payment handling, remittance and cash handling activity 2.7 0.0 0.3 3.0
Demand side water efficiency 0.1 0.0 0.5 0.6
Bad debt charge 6.4 0.1 3.9 10.4
Debt management costs 3.7 (2.2) 0.0 1.3 2.8
Services To Developers 1.6 0.0 (0.7) 0.9
Customer Side Leakage costs 0.1 0.0 0.1 0.2
General & Support activity, Local Authority Rates & Regulations 4.1 0.1 (0.6) 3.6
Meter reading costs 3.4 0.0 0.9 4.3
2015/16 reported values 24.7 (2.2) 0.3 4.9 27.7

21
Retail £m
Disconnections & Reconnections 0.1
Customer side leakage costs 0.2
General and support costs 3.5
Demand side water efficiency 0.6
Regulation costs 0.1
2015/16 reported values 4.5


