
Liuc Papers n. 254, Serie Economia e Impresa 65, ottobre 2012
1
PROBABLY NOT THE BEST LAGER IN THE
WORLD:
EFFECT OF BRANDS ON CONSUMERS’
PREFERENCES IN A BEER TASTING
EXPERIMENT*
Matteo Maria Galizzi,** Christian Garavaglia***
Abstract We investigate the role and impact of exposure to brands in consumers’ evaluations of lager beers, and explore its relation with exposure to intrinsic information. The first objective is to study the ability of young consumers to identify their preferred beer. The second is to explore the role played by brands, under two distinct perspectives: i) whether the effect of exposure to brands is either generalized or specific to preferred beers; ii) the ability of brands to induce perception of sensory characteristics. We propose a two-stage beer tasting experiment, exploiting information both on within-subject differences across different stages, and between-subjects differences across treatments. In each stage, participants’ evaluations for three beers was elicited using an incentive-compatible mechanism. The first stage was a blind tasting, while in the second stage beers were presented together with the bottles. Our main results are the following. Consumers seem unable to identify their preferred lager beer in a blind taste. Brands affect consumers’ evaluations: after brands are revealed, average evaluations change. Although they are stronger on most preferred brands, brand effects are generalized. Finally, extrinsic information on brands also affects and induces the description of sensorial perceptions of intrinsic characteristics of beers.
1. Introduction
Brands, logos and images are among the most influential aspects of products in driving
consumers’ purchasing decisions. Exposure to brands and images conveys to consumers the
most typical form of what is called “extrinsic information” on products: the “top-down”
information constituted by all features due to, or related with, the firm’s marketing strategies, as
opposed to “intrinsic information”, conveyed “bottom-up” by the physical and sensorial
characteristics directly perceived by consumers.
* Keywords: Experimental economics, Sensorial Analysis, Beer consumption, Consumer preferences.
JEL Classification: C91, D12, L66, M3 ** London School of Economics; Department of Social Policy, LSE Health, and Behavioural Research Lab *** University of Milano-Bicocca; and KITeS, Bocconi University

Liuc Paper n.254, ottobre 2012
2
Brands are certainly a central marketing tool also within the beer industry. Image and brands
represent the first contact between the beer and the consumer and are likely to influence
consumers’ judgment and intent to buy.
In the experimental literature in economics, marketing and psychology several studies have
shown how strong can be the impact of extrinsic information on consumers’ evaluations and
purchasing decisions of food, drinks and other products (Allison and Uhl, 1964; Makens, 1965;
Nevid, 1981; Morrot et al., 2001; Parr et al., 2003; Caporale and Monteleone, 2004; Combris et
al., 2006). One open question concerns the interrelation between extrinsic and intrinsic
information. Our aim is to explicitly address this issue for the case of lager beer.
In particular, this work experimentally investigates the impact of exposure to brands in
consumers’ evaluations of beers, and explores its relation with exposure to intrinsic information.
The experiment is motivated by two research questions. The first is related to the ability of
consumers to identify their preferred beer. The second question concerns the exact role played
by brands, under two distinct perspectives: i) whether the effect of exposure to brands is either
generalized or specific to preferred beers; ii) the ability of brands to induce perception of
sensory characteristics. The questions we aim at answering are: At which extent can brands
affect consumers’ evalautions? Does exposure to brands only affect consumers that are already
attached to those brands? Can exposure to brands help, or induce, identification of intrinsic
sensorial characteristics?
We present evidence from a beer tasting experiment. In a questionnaire prior to the
experimental sessions, we collected data on preferences for beer from a sample of young
consumers. We then invited a sub-sample of subjects to take part into a beer tasting session. The
experiment was designed to exploit information both on within-subject differences across
different stages, and between-subjects differences across treatments. In particular, in the
experiment, subjects were assigned to one of two treatments and went through two stages. In
each stage, participants’ evaluations for three beers was elicited using an incentive-compatible
mechanism. The first stage was a blind tasting, while in the second beers were presented
together with bottles.
The main results of our experimental analysis are the following. First, consumers were
generally unable to spot their preferred beer in a blind taste. Second, after the brand information
was revealed, the evaluations expressed by the subjects changed significantly. Interestingly,
exposure to brands also appeared to affect the way consumers described their sensorial
perceptions of intrinsic characteristics of the tasted beers, and to induce subjective perception of
sensorial characteristics even when these were not intrinsically conveyed by direct tasting
experience. Finally, the effect of brands appeared to be not only brand-specific but quite
Probably not the best lager in the world: effect of brands on consumers’ preferences in a beer tasting experiment
3
generalized: consumers were affected by the extrinsic information conveyed by all brands,
although the effect was significantly stronger for their most preferred brands. Our results
suggest that young consumers of lager beers seem sensitive to brands in their evaluations. The
effect conveyed by extrinsic information appears stronger than sensorial perceptions of intrinsic
characteristics of the product, and can even induce some of them.
This paper is organized as follows. In section 2 we summarize the experimental literature
and the open research questions. In section 3 we describe the experiment. Section 4 discusses
the results and section 5 concludes.
2. Literature and research questions
In consumer studies, experimental economics and psychology, and sensorial analysis, a wide
literature focuses on the role and impact of extrinsic (top-down) and intrinsic (bottom-up)
information on consumers’ evaluations and purchasing decisions. Extrinsic information by a
product is constituted by all features due to, or related with, the firm’s marketing effort and
strategies, while intrinsic information is instead constituted by what is conveyed by the physical
and sensorial characteristics as directly perceived by the consumer.
The seminal paper by Allison and Uhl (1964) reports that consumers are unable to recognize
their preferred brand in a blind taste and that the perceived characteristics of different beers are
related more to firms’ marketing information (extrinsic information) rather than to perceived
physical differences (intrinsic information).
Several following studies have examined the effects of intrinsic and extrinsic information in
food and drinks products. Makens (1965) finds that turkey meat was appreciated more if
thought to be from a popular brand than from an unpopular brand. Nevid (1981) finds that
Perrier was preferred by consumers to standard seltzer when consumed with labels, but not
otherwise. Olson and Dover (1978) find that consumers perceived the coffee as being less bitter
when repeatedly exposed to that idea. Bowen et al. (1992) and Wardle and Solomons (1994)
observed differences in stated liking of dairy products depending on whether they were labelled
as high or low fat.
Concerning experiments on food which are closer to our design, Fevrier and Visser (2004)
asked a sample of subjects to evaluate 6 orange juices. Subjects were presented each of the 6
juices in a random order, through two phases: first some characteristics of the product were
showed to the subjects via an image; then the juice was tasted. Subjects evaluated each juice and
were then told that they could buy the orange juices they had just evaluated. The authors
checked the consistency of the products choices with the Generalized Axiom of Revealed
Preferences (GARP) and found that almost one-third of the subjects were GARP-inconsistent.

Liuc Paper n.254, ottobre 2012
4
Combris et al., (2007) asked a sample of subjects to evaluate 6 orange juices and complete a
demand schedule with different budget/price situations. In one group, subjects chose after
having looked at the packaging. In the other group, they could also taste the products. Their
results show that subjects who chose without tasting made quicker decisions, selected a larger
set of varieties and were more influenced by prices than those who could taste the products.
Galizzi et al. (2008) asked a sample of subjects to taste 3 wines and 3 hams of the same type
under different conditions, and found that peer pressure was able to affect at some extent
individual preferences expressed for foods, while experts’ opinions significantly affected
evaluations in wine tasting.
Moving to experiments on wine tasting that are methodologically similar to our objectives,
Combris et al., (2006) performed two series of Vickrey auctions to assess the effect of
packaging information (bottle and label) on the reservation prices of non-expert consumers for 5
brut non-vintage Champagne sparkling wines. Packaging information was found to explain
much more of the variation in willingness to pay (WTP) than sensory information. Subjects
were unable to evaluate differently the wines after blind tasting, but they expressed significantly
different WTP when labels were disclosed. Vigne and Gergaud (2007) found that consumers’
preferences for champagne differed significantly when preferences were stated based on
extrinsic information only rather than on intrinsic only. Gustafson (2008) found that
expectations induced by reputational information affected consumers’ experienced utility and
subsequent purchasing decisions. Galizzi and Reiley (2010) reported a field experiment in
which almost two-thirds of a hundred economists tasting three glasses of wines were not able to
identify the two glasses containing exactly the same wine, even though the wines were sold for
twice or even thrice the price.
Concerning the more specific case of beers, some works (Guinard et al., 1998, 2001;
Bushnell et al., 2003; Foster et al., 2001) studied the characteristics of beers and the perception
of a trained panel of consumers to identify the relationship between the chemical compounds
and the perception of consumers in beer. Guinard et al. (2001), for instance, found in an
experiment that consumers significantly changed their hedonic ratings from the blind to the
informed tasting conditions, thus confirming the important role of non-sensory variables in
formulating hedonic judgements. Following the seminal paper by Allison and Uhl (1964),
Caporale and Monteleone (2004) illustrated how information regarding manufacturing
technology was able of altering consumers’ liking of beer. Lee et al. (2006) found that
consumers’ evaluation of beer versus the same beer spiked with balsamic vinegar depended
significantly on the order in which consumers received the sensory information and information
Probably not the best lager in the world: effect of brands on consumers’ preferences in a beer tasting experiment
5
on the ingredients. Porretta and Donadini (2008) report that the most important attribute that
influence consumers’ attitude towards alcohol free beer is packaging.
An extension of this literature has used functional magnetic resonance imaging (fMRI) to
examine brain activity by subjects exposed to different stimuli. McClure et al. (2004) found that
providing information about the brand of cola (either Coke or Pepsi) affected more areas of the
brain of participants in an fMRI study than when the cola was blind tasted. In the blind
condition, preferences were predicted by relative activity in the ventromedial prefrontal cortex
(VMPFC); in the informed condition, the hippocampus, the dorsolateral prefrontal cortex
(DLPFC), and the mid-brain were also active, particularly when the brand was revealed to be
Coca-Cola. The authors interpreted these results as suggesting that the VMPFC functioned
independently from the hippocampus, DLPFC, and midbrain, and that the two systems represent
different processes affecting a subject’s preferences for the product. Plassman et al. (2008)
found that the sensation of pleasantness that people experience when tasting wine was directly
linked to its price: with the higher priced wine, more blood and oxygen was sent to an area of
the brain (medial orbitofrontal cortex), which is thought to be responsible for encoding pleasure
during experiential tasks.
While the literature provides evidence of the impact of extrinsic information on consumers’
evaluations, some open research questions concern the interaction between intrinsic and
extrinsic information. In particular, after being exposed to brands, consumers may not only
increase their evaluations for the products, but also revise, or alter, their sensorial perceptions of
the beers. For instance, it may be the case that, being aware they are tasting a known brand of
beer, consumers pay more attention to the aromas and the sensations they are perceiving during
the tasting; or are able to interpret, classify and verbalize the sensations with greater precision
and accuracy.1 The exposure to extrinsic information can serve as a guideline enabling subjects
to better focus on intrinsic characteristics perceived during tasting. In principle, it is possible
that exposure to brands, rather than simply helping subjects to disentangle the “true” sensorial
characteristics of the beers, can even induce perception of sensorial characteristics that are
actually not intrinsically conveyed by the beers. Finally, an open question remains on whether
the effect of exposure to extrinsic information is confined to brands to which consumers are
already attached, or whether is more generalized.

Liuc Paper n.254, ottobre 2012
6
3. The experiment
3.1 General design
Our experiment consists in a questionnaire and in a two-stage tasting session. Six weeks
prior to the experiment, we conducted a survey between a sample of students. The information
collected through the questionnaire helped to select the beers to be tasted and the subjects to be
invited into the following experimental session. Details about the questionnaire will be provided
in the next section.
The subsample of subjects who met the selection criteria were invited to take part into the
experimental session. Participants were identified with an ID, matched with the one on the
questionnaire. Each experimental session consisted of two stages and one payment period.
Subjects were randomly assigned to one of two treatments. The treatment were identical with
the only exception of one detail in the second stage. The analysis mostly exploits within-
subjects variations of experimental data, altogether with between-subjects variation across
experimental treatments.
In each stage subjects were presented three glasses of beer and asked to taste the beers and to
express their evaluations for each beer in a 0-100 scale. The first stage was a blind taste. In the
second stage the beers were presented together with the bottles. Details about the experimental
stages will be provided in sections 3.3 and 3.4.
At the beginning of the experiment, subjects were told that, at the payment period, one of the
2 experimental stages would be selected randomly, and that subjects would be given 6 bottles of
the beer they mostly prefer at that stage. The compensation for participating into the experiment
was therefore incentive-compatible since it induced subjects to reveal their genuine preferences
for each beer. Similar incentive-compatible mechanisms have also been used by Lee et al.,
(2006) for beer tasting and by Fevrier and Visser (2004) and Combris et al., (2007) in
experiments with orange juices.
3.2 Selection of participants, questionnaires and choice of beers
Beer consumption in Italy has experienced a sharply increasing trend among young subjects,
also at the expense of wine (Assobirre, 2008; Garavaglia, 2009). A sample of young subjects
was therefore particularly appropriate for our beer tasting experiment. We first selected a pool
of 124 last year undergraduate students of management, who attended our course in Industrial
Economics and Competition Policy at LIUC Business School, Castellanza. At the end of the
course, six weeks before the experiment, we distributed them a survey. The survey include,
among others, questions on standard socio-demographic characteristics; preferred drink (e.g.
Probably not the best lager in the world: effect of brands on consumers’ preferences in a beer tasting experiment
7
wine, beer, coke,…); preferred type of beer (e.g. lager, ale, Weiss, Belgian, stout,…); preferred
mean of drinking beer (draught, can, bottle); preferred brand of beer (among the 15 most
common, plus an open choice); preferred mean of drinking preferred brand of beer (draught,
can, bottle); most consumed type, brand of beer, and mean of drinking; monthly frequency of
consumption and purchasing of beer; usual place and conditions in which beer is
consumed/purchased (home, pub, restaurant, bars, clubs...); measure (elicited within a 1-5 grid)
of how relevant is each intrinsic characteristics of a beer for beer consuming decisions: foam,
bitter, sweet, body, alcohol, sparkling, aroma, freshness.
In the questionnaire subjects were also asked if they were interested in being later contacted
to participate in a beer tasting experiment. A total of 113 subjects returned the questionnaire
completely filled in.
Information from the collected questionnaires guided the decision on the details of the
experiment. Looking at the questionnaire data, it turned out that a good share of subjects (48%)
stated beer was their preferred drink; a large proportion (64%) drank at least a beer for week (or
more); a vast majority of subjects (74%) liked lager beer, and a majority (67%) preferred bottled
beer. From the survey it also turned out that preferred brands of beer were (in this order):
Heineken, Beck’s, Peroni/Nastro Azzurro, Corona, Stella Artois, Carlsberg, Guinness, Moretti,
Ceres, Bud, Tennent’s Super, Menabrea, followed by a fringe of minor brands.
In light of the results from the survey, it appeared that subjects in our pool (alike the average
Italian beer consumer) were more keen on lager beers, mostly consumed in bottles. We thus had
to select the three beers to be tasted in the experiment among the most preferred lager beers by
our pool of subjects. Moreover, we needed to decide jointly the selection of both beers and
subjects to be invited into the experiment, in order to ensure that that a sufficiently high number
of subjects would participate into the experiment, and that most participants could taste their
favourite lager beer in the session.
The beers were selected according to four criteria: in particular, the three lager beers needed
to i) be among the ones preferred by the invited subjects; ii) be available in bottles; iii) present
not too similar, but not too distant, intrinsic characteristics, from the sensory point of view; iv)
have sufficiently different brands and images.
In selecting the beers to taste, we also wanted to avoid a potential confounding factor, due to
the fact that subjects may be home-biased when choosing which product to buy or consume.
The home-country bias in economic decisions has indeed been found quite regularly in a variety
of contexts, from financial investments, to purchasing of durable goods, to consumption of daily
products. In order to account for this potential confounding factor, we therefore decide to focus
on a sample of foreign beers only.
Liuc Paper n.254, ottobre 2012
8
According to the above criteria the three selected lager beers were:
H: from the Netherlands, in a green transparent bottle, with a clean and neutral label and
image, sold in supermarkets at an average price of 0.70 €.2
B: from Germany, in a green bottle, with a white-red label and an overall image
unambiguously evoking German beers, sold in supermarkets at an average price of 0.95
€.
C: from Mexico, in a yellow bottle, with very peculiar label and an exotic image, sold in
supermarkets at an average price of 1.40 €.
Concerning the main characteristics of the sensorial profiles of the beers, H produces a
mildly bitter taste and a fruity and fresh aroma, while B has a more bitter taste event if the IBU3
scale is very similar to H. B has a full-bodied taste with a hoppy bouquet, with crisp firmness,
ending with a clean dry finish. C is characterised by low bitterness, low hop aroma and light
body.
3.3 The experimental setting
After having identified the three beers to taste, we browsed the pool of our respondents to
select the subsample of subject whose preferred beer was among the three above. In order to get
an internal control from the evaluations expressed by consumers that were not already attached
to a brand of beer, we also included in our subsample a small proportion of subjects whose
preferred beer was a lager, but from a brand other than H, B or C. From the 113 respondents, the
most preferred beer by 47 subjects was either H, or B, or C, while there were other 24 subjects
whose preferred beer was a lager of another brand. We invited them by email to participate to a
beer tasting experiment, in one of two sessions. The three experimental sessions were held at
late afternoon, in three different time slots compatible with the teaching activities in LIUC
University. A total of 65 subjects replied to our email. We allocated them in the three sessions
in a way to guarantee that in each session there was a good balance among subjects whose
preferred beer was either H, B, C or another lager. A total of 21 subjects showed up in the first
session, 20 in the second, and 22 in the third. We only retained 20 subjects in each session.4
Among the 60 participants in the experiment, 16 had indicated H as their most preferred beer,
13 mostly preferred B, and 14 C, while for 17 subjects the most preferred beer was a lager of
another brand.5 Within each session, 15 were randomly assigned (through the extraction of a
numbered ball from an urn) to a treatment (T), while 5 to an alternative treatment (F). As
discussed below, the two treatments imply subjects would be exposed to “True” and “False”

Probably not the best lager in the world: effect of brands on consumers’ preferences in a beer tasting experiment
9
bottles of beers, respectively. Each subject was identified with the same ID used in the
questionnaire. All sessions were held in a large room, equipped with fifty individual desks and a
small separate kitchen, located just in front of the main entrance of the University.6 Each subject
was accommodated in a separate desk, far away from the other participants. On each desk there
was a pad with three circles on which to leave the glasses of beers, a sheet of paper with the
instructions for the experiment, a pen and some unsalted crackers.
At the beginning of the experiment, subjects were told that the experiment would consist of 2
stages and a payment period; that, at each stage, they would be asked to taste and evaluate three
beers, according to the instructions illustrated at each stage; that, at the payment period, one of
the 2 experimental stages would be selected randomly, and that they would be paid with 6
bottles of the beer they mostly preferred at that stage; and that, in order to be paid, during all the
experimental session, they could not speak or communicate with any other subject in the room.
After having checked that the compensation mechanism was fully understood by all
participants, written instructions were handed in for the first stage of the experiment.
Instructions were then also read aloud and time for questions and clarifications was also
allowed. Subjects then entered the first stage of the experiment. Bottles of beers were kept
around 8 degrees - their ideal serving temperature - in some fridges of the kitchen behind the
room. There, an amount of approximate 100 ml of each beer was poured in some transparent,
light glass, glasses. Glasses of the three selected beers were there prepared for each participant,
according to the order in which he/she was supposed to face and taste each presented beer. In
fact, we presented the three beers in a different order (from left to right) for each subject, and
told subjects we were doing so. Following a standard procedure in similar tasting experiments
(Fevrier and Visser, 2004; Combris et al., 2007; Galizzi and Reiley, 2010) we implemented a
random order or presentation of beers in order to i) minimize the first position bias (MacFie et
al., 1989); ii) randomize the order of presentation of each beer; iii) make communication among
participants pointless. We thus gave each subject the three glasses of beers, positioning them in
the pad according to the planned order of presentation. Subjects were then asked to taste the
three beers and to answer the questions contained in the sheet of paper with the instruction of
the stage. When each subject had answered the questions of one stage, sheets with answers and
empty glasses were collected, and subjects were handed in instructions for the second stage.
Subjects then entered the payment period, in which one participant was asked to extract a ball
from an urn. The extracted number determined the corresponding stage according to which
subjects would then be paid. Each experimental session lasted about 30 minutes. In the next
section the two stages are described in greater detail.

Liuc Paper n.254, ottobre 2012
10
3.4 The four experimental stages
In the first stage of the experiment subjects tasted the three beers (H, B, C) blindly: all beers
were presented simultaneously to subjects, already poured in three glasses, with no further
information. In the experimental instructions and questions, beers were identified with positions
in which they were presented to subjects: in particular they were named Left1, Center1, Right1
beer, according to the order, from left to right, in which they were presented to subjects.
As discussed above, the order in which beers were presented was modified subject by
subject, in a way that no participant in a session had the beers presented in the same order. In
particular, in what follows we will refer to the order in which beers were presented to a
participant as a sequence of three letters - such as HBC, CHB, BCH, or similar - where the first,
second and third letter stand for the beer presented at the left, front and right of the subject,
respectively.
In the instructions of the stage, subjects were told that if stage 1 was selected at the payment
period, they would be awarded a case of six 330 ml bottles of the beer to which they gave the
highest evaluation in the first stage.
Each participant then blindly tasted the 3 beers and was asked to fill in some questions for
each tasted beer. In particular, subjects were asked to express their evaluation of each beer in 0-
100 points grid, and to rate 5 intrinsic characteristics for each beer: bitter, sweet, fizzy, body,
aroma. Rating was to be done within a 0-4 grid, from 0 standing for “the beer does not present
this intrinsic characteristic” to 4, standing for “the beer presents this intrinsic characteristic at a
very high extent”.
In the experimental analysis we will denote the intrinsic characteristics rated at first stage as
Qijx(1), where i stands for subject, j stands for beer and x stands for a given intrinsic
characteristic (e.g. sweetness), as expressed in the first stage. Correspondingly, we will denote
the evaluation for beer j expressed by subject i at the first stage of the experiment Vij(1). With
Qjx(1) and Vj(1) we, respectively, denote the average evaluation and intrinsic characteristic for
beer j, expressed in the first round by all participants. It is also possible to consider each of the
above expressions, as conditional to the information on the beer mostly preferred by a subject.
For instance, the expression Vij(1)|j stands for the evaluation for beer j expressed in the first
stage by subject i, whose preferred beer was i, while Vik≠j(1)|j stands for the evaluation for beer
k expressed by a subject who mostly prefers beer j.
In the second stage of the experiment, subjects were then presented the three H, B, C beers,
poured in glasses and paired with a bottle behind each glass. In order to convey the more
complete and thorough impression from brand-specific extrinsic information, we paired glasses
with real bottles of H, B and C beers that could actually be found in supermarkets. This

Probably not the best lager in the world: effect of brands on consumers’ preferences in a beer tasting experiment
11
amounted to expose subjects extrinsic information about the overall brand image of beers.
Notice that, besides the extrinsic information implicitly (and tacitly) deriving from presented
bottles, we did not provide any further information to participants. In particular, we did not tell
subjects whether beer contained in the glasses was actually coming from the paired shown
bottle. This was indeed the case only for the 15 subjects in the session within the T treatment,
while for the 5 other subjects in treatment F, the poured beers did not actually correspond to the
bottles. Furthermore, subjects were not told whether or not the beers presented in the second
stage were the same tasted in the first stage.
Also in the second stage, beers were identified with their positions relative to the subject: we
will refer to Left2, Center2, Right2 in then sense explained above. Also in the second stage,
moreover, the order in which beers were presented was different for each subject.
In the instruction of the second stage, participants were told that if stage 2 was selected at the
payment period, they would be awarded a case of six 330 ml bottles of the beer to which they
gave the highest evaluation in the second stage.
Each participant then blind tasted the 3 beers and was asked to answer a questionnaire as in
the first stage. In particular, subjects were again asked, for each beer, to rate the 5 above
intrinsic characteristics for each beer, and to express their evaluation of each beer in 0-100
points grid.
In the experimental analysis we will denote the intrinsic characteristics rated at second stage
as Qijx(2), where i stands for subject, j stands for beer and x stands for a given intrinsic
characteristic (e.g. sweetness), as expressed in the second stage. Correspondingly, we will
denote the evaluation for beer j expressed by subject i at the second stage of the experiment
Vij(2). It is in the second stage that the two different treatments T and F come into action. In
fact, as mentioned above, at the beginning of the session, 15 out of 20 subjects were randomly
assigned to treatment T and the remaining 5 to the alternative treatment F. The experiment was
designed in a way that for the 15 subjects in treatment T, the bottles behind the glasses were the
“true” bottles, in the sense of the bottles from which the beers were actually poured. On the
other hand, for the 5 subjects in treatment F, the bottles behind the glasses were not the “true”
bottles, from which the beers were poured. Rather they correspond to one of the other two beers,
randomly selected for each subject. In order to account for differences between the two
treatments, we will denote the expressed intrinsic characteristics, evaluations and willingness to
pay as conditional to the treatment to which subjects were assigned, as Qijx(2|T), Qijx(2|F);
Vij(2|T), Vij(2|F).

Liuc Paper n.254, ottobre 2012
12
3.5 The empirical strategy
The above described experimental design allows to address our experimental questions using
a neat empirical strategy.
As discussed above, the first question concerns the identification of preferred beer. If
consumers indeed have “tasting” preferences for beer, we should observe, at the least, that
virtually all consumers, at the blind tasting in the first stage, give higher evaluations to their
mostly preferred than to the other beers. Ideally, consumers should even explicitly reckon their
preferred beer during blind tasting. If this is indeed the case, we should observe that, using the
above notation, the difference Vij(1)|j - Vik≠j(1)|j should be significantly different from zero for
the evaluations expressed in the blind taste stage.
The second question, on the effect of brands, can also be immediately addressed within our
experimental design. Indeed, if brands do really affect consumers’ evaluations, we should
observe statistically significant differences in Vij(2) - Vij(1). In fact, the only difference between
the first two stages is clearly the exposure of subjects to brand information.
Our experimental design can also account for the different aspects related to the role of
brands. In particular, on whether the effect of brands is a generalized one, we should observe
that the differences Vij(2) - Vij(1) are not significantly different, in statistical terms, when j is
the most preferred beer by subject i, and when it is not: using the above notation, the two
differences (Vij(2)|j - Vij(1)|j) and (Vik≠j (2)|j - Vik≠j (1)|j) should be not significantly different.
If, at the contrary, the effect is brand-specific, we expect that these differences should be
significantly larger for the most preferred beers.
For what concerns the question of whether exposure to brands affects, or induces, the
identification of sensorial characteristics, the vector of intrinsic characteristics measured at the
first and at the second stage should show statistically significant differences Qijx(2) - Qijx(1).
Finally, concerning the question of whether exposure to brands simply helps identification of
intrinsic sensorial characteristics, differences Qijx(2) - Qijx(1) should be statistically significant
only in treatment T. Significant differences in treatment F would at the contrary signal a
potential room for subjects’ sensorial perceptions being induced by exposure to extrinsic
information such as brands and images.
4. Results
In this section we discuss the main results of our experiment, addressing each experimental
question in the order in which they were presented above.

Probably not the best lager in the world: effect of brands on consumers’ preferences in a beer tasting experiment
13
We start with the first question on identification of the preferred beer, that we can summarize
as follows:
Q1: If consumers identify their preferred beer in a blind taste session, the difference Vij(1)|j
- Vik≠j(1)|j should be significantly different from zero.
Table 1 reports the average evaluations of the three beers expressed in the first stage,
conditional to the subjects’ preferred beer. The Table also reports the proportion of subjects
(whose preferred beer was either H, B or C) who gave higher evaluation to their most preferred
beer (% Top). In brackets we also report the p-values of a one-sided sign test7 on the differences
among the evaluations to the most preferred beer and each of the other two beers, under the null
hypothesis that they are not significantly different from zero.
V(1)|H V(1)|B V(1)|C V(1)|Other % Top No subjects 16 13 14 17 60
68.1 52.3 70.7 52.1 H
(0.456) (0.091) (0.378) 31.2
67.3 53.6 85.2 53.6 B
(0.341) (0.046) (0.412) 46.2
70.1 54.4 65.3 52.9 C
(0.268) (0.489) (0.464) 14.3
Table 1: Average evaluations in the first stage conditional on most preferred beer. P-values of differences between most preferred beer and other beers in parentheses.
As it can be seen, consumers do not seem able to spot their preferred beer in a blind taste.
Only less than half of the consumers whose preferred beer was B gave higher evaluations to B
in the blind taste. This proportion was even lower for the other two brands, where only one
consumer every three, or even every eight, gave the highest evaluation to his/her most preferred
brand. In general, notice that consumers with different preferred brands seem to evaluate beers
with very heterogeneous absolute scale. In particular, while the average evaluations expressed
by consumers attached to B does not seem to significantly differ from the ones expressed by
subjects with other preferences (V(1)|Other), consumers whose preferred beer is H or C seem to
express evaluations that are generally higher. Moving from absolute levels to relative distance
in evaluations, notice that consumers whose preferred brand beer is either H or B, or none
among H, B or C, are generally unable to significantly distinguish between the three beers in a
blind taste. At the contrary, consumers whose preferred brand is C turn out to express for beer C
average evaluations that are significantly lower than any of the other two beers.
Table 2 reports the results from an econometric analysis of the factors that are more likely to
explain in statistical terms the ability of consumers to identify their preferred brand. Using a
Liuc Paper n.254, ottobre 2012
14
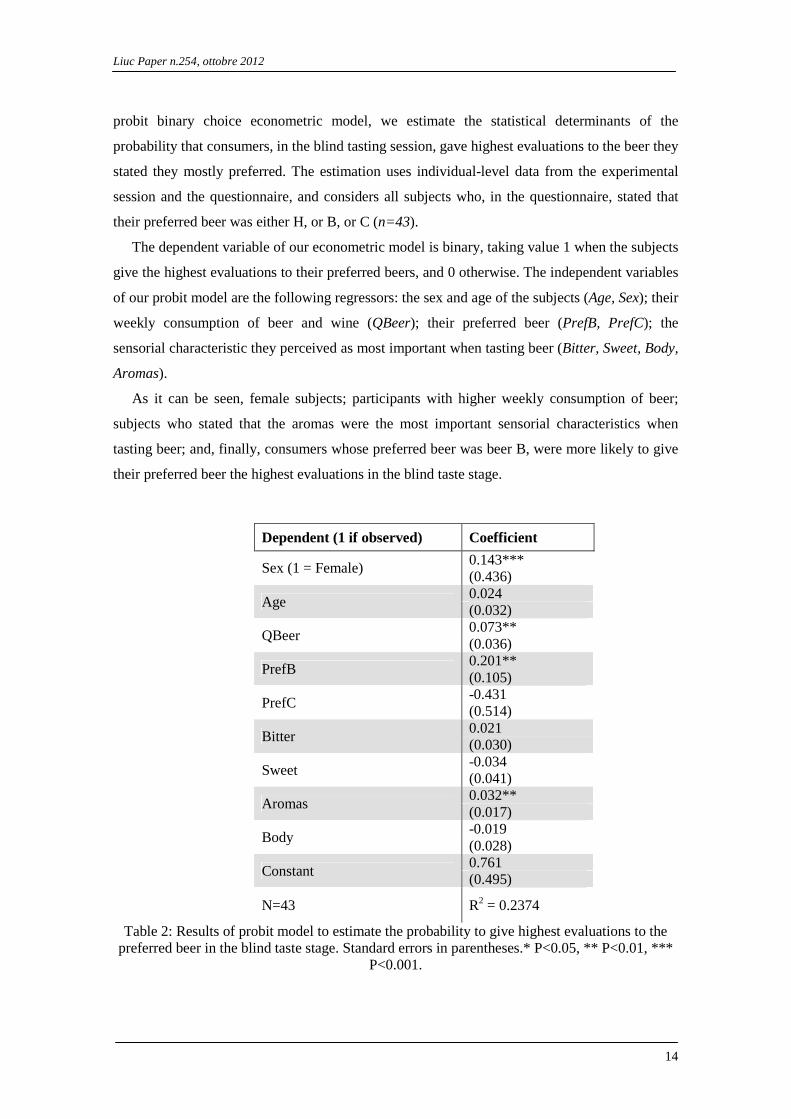
probit binary choice econometric model, we estimate the statistical determinants of the
probability that consumers, in the blind tasting session, gave highest evaluations to the beer they
stated they mostly preferred. The estimation uses individual-level data from the experimental
session and the questionnaire, and considers all subjects who, in the questionnaire, stated that
their preferred beer was either H, or B, or C (n=43).
The dependent variable of our econometric model is binary, taking value 1 when the subjects
give the highest evaluations to their preferred beers, and 0 otherwise. The independent variables
of our probit model are the following regressors: the sex and age of the subjects (Age, Sex); their
weekly consumption of beer and wine (QBeer); their preferred beer (PrefB, PrefC); the
sensorial characteristic they perceived as most important when tasting beer (Bitter, Sweet, Body,
Aromas).
As it can be seen, female subjects; participants with higher weekly consumption of beer;
subjects who stated that the aromas were the most important sensorial characteristics when
tasting beer; and, finally, consumers whose preferred beer was beer B, were more likely to give
their preferred beer the highest evaluations in the blind taste stage.
Dependent (1 if observed) Coefficient
0.143*** Sex (1 = Female) (0.436) 0.024
Age (0.032) 0.073**
QBeer (0.036) 0.201**
PrefB (0.105) -0.431
PrefC (0.514) 0.021
Bitter (0.030) -0.034
Sweet (0.041) 0.032**
Aromas (0.017) -0.019
Body (0.028) 0.761
Constant (0.495)
N=43 R2 = 0.2374
Table 2: Results of probit model to estimate the probability to give highest evaluations to the preferred beer in the blind taste stage. Standard errors in parentheses.* P<0.05, ** P<0.01, ***
P<0.001.

Probably not the best lager in the world: effect of brands on consumers’ preferences in a beer tasting experiment
15
We can thus conclude that the hypothesis in Q1 is not supported by our experimental data.
We now move to the second question, about the effect of exposure to brands, that we can
summarize as follows:
Q2: If exposure to brands affects consumers’ evaluations, the differences Vij(2) - Vij(1))
should be significantly different from zero.
Table 3 reports the average evaluations of the three beers expressed by all subjects in the
first and in the second stage. In the last column we also report the p-values of the Wilcoxon
signed rank tests on the differences between the evaluations of the same beer expressed in the
first and in the second stage, under the null hypothesis that they are not significantly different
from zero.8
V(1) V(2)
No subjects 60 60
56.2 61.7 H
(0.048)
58.4 54.9 B
(0.083)
56.6 60.7 C
(0.076)
Table 3. Average evaluations in stages 1 and 2. P-values of differences between stages in parentheses.
It can be seen that the evaluations expressed by subjects appear to significantly change
following exposure to brands. The effect is more significant for beer H. With regard to brand C,
this positive brand effect can be combined with the previous result, showing how consumers
whose preferred brand is C, expressed lower average evaluations for beer C than for any other
beer. It may be concluded that brand C exerts the strongest brand influence on consumers
among the three brands under study.
While for beers H and C subjects seem to increase their evaluations after being exposed to
brands, a curious result relates to the negative brand effect of beer B. We believe this result may
be due to a less appealing image of brand B. We can thus conclude that the hypothesis in Q2 is
supported by our experimental data. We then move to the third question, about the role of
brands. The first aspect of the question can be summarized as follows:
Q3a: If the effect of brands is generalized, the two differences (Vij(2)|j - Vij(1)|j) and (Vik≠j
(2)|j - Vik≠j (1)|j) should be not significantly different.
Liuc Paper n.254, ottobre 2012
16
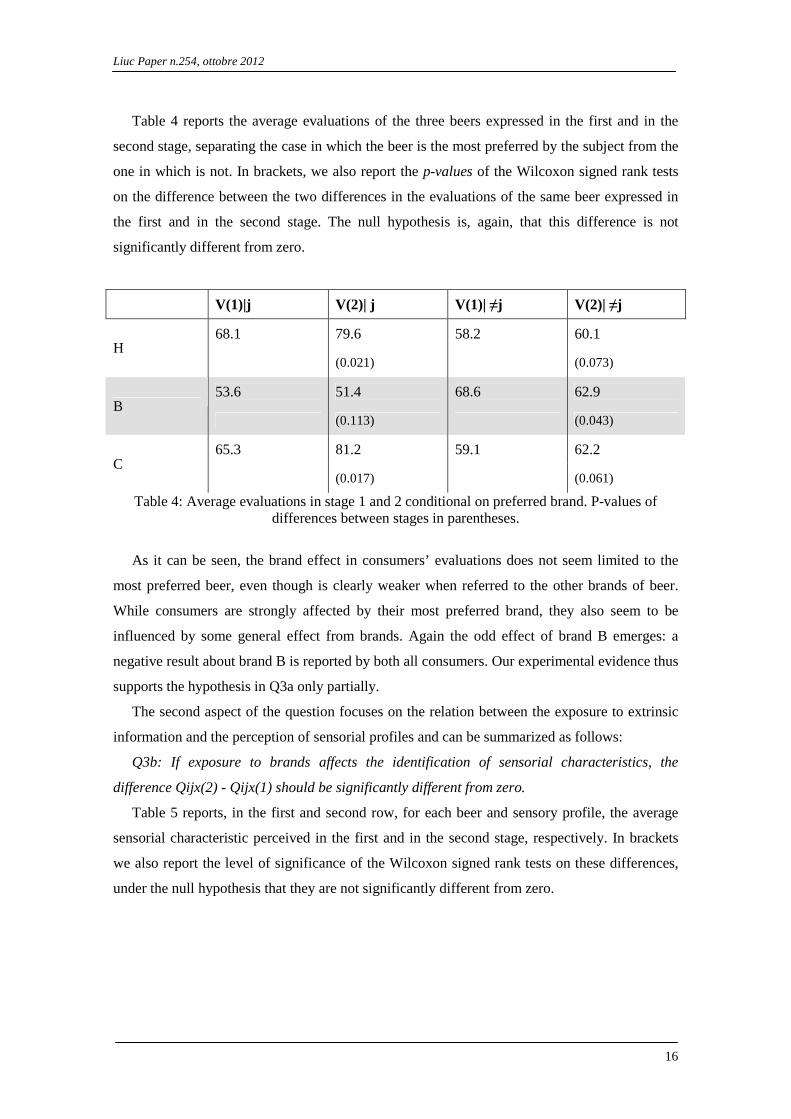
Table 4 reports the average evaluations of the three beers expressed in the first and in the
second stage, separating the case in which the beer is the most preferred by the subject from the
one in which is not. In brackets, we also report the p-values of the Wilcoxon signed rank tests
on the difference between the two differences in the evaluations of the same beer expressed in
the first and in the second stage. The null hypothesis is, again, that this difference is not
significantly different from zero.
V(1)|j V(2)| j V(1)| ≠j V(2)| ≠j
68.1 79.6 58.2 60.1 H
(0.021) (0.073)
53.6 51.4 68.6 62.9 B
(0.113) (0.043)
65.3 81.2 59.1 62.2 C
(0.017) (0.061)
Table 4: Average evaluations in stage 1 and 2 conditional on preferred brand. P-values of differences between stages in parentheses.
As it can be seen, the brand effect in consumers’ evaluations does not seem limited to the
most preferred beer, even though is clearly weaker when referred to the other brands of beer.
While consumers are strongly affected by their most preferred brand, they also seem to be
influenced by some general effect from brands. Again the odd effect of brand B emerges: a
negative result about brand B is reported by both all consumers. Our experimental evidence thus
supports the hypothesis in Q3a only partially.
The second aspect of the question focuses on the relation between the exposure to extrinsic
information and the perception of sensorial profiles and can be summarized as follows:
Q3b: If exposure to brands affects the identification of sensorial characteristics, the
difference Qijx(2) - Qijx(1) should be significantly different from zero.
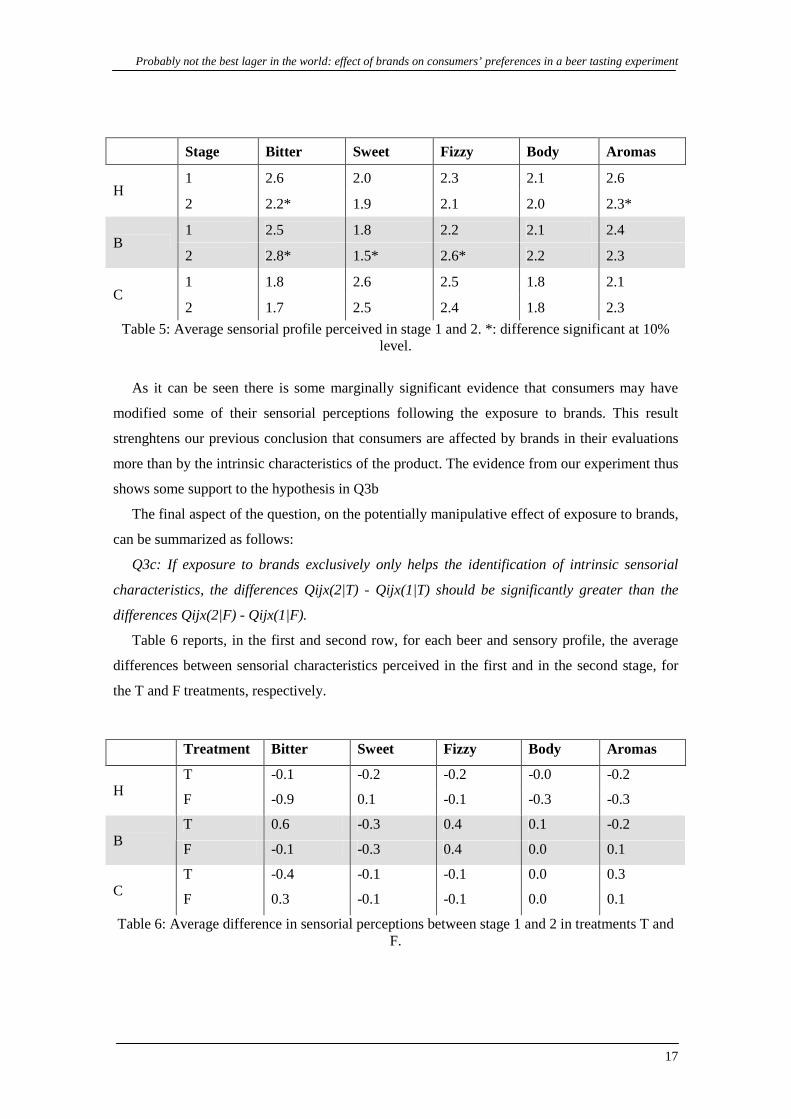
Table 5 reports, in the first and second row, for each beer and sensory profile, the average
sensorial characteristic perceived in the first and in the second stage, respectively. In brackets
we also report the level of significance of the Wilcoxon signed rank tests on these differences,
under the null hypothesis that they are not significantly different from zero.
Probably not the best lager in the world: effect of brands on consumers’ preferences in a beer tasting experiment
17
Stage Bitter Sweet Fizzy Body Aromas
1 2.6 2.0 2.3 2.1 2.6 H
2 2.2* 1.9 2.1 2.0 2.3*
1 2.5 1.8 2.2 2.1 2.4 B
2 2.8* 1.5* 2.6* 2.2 2.3
1 1.8 2.6 2.5 1.8 2.1 C
2 1.7 2.5 2.4 1.8 2.3
Table 5: Average sensorial profile perceived in stage 1 and 2. *: difference significant at 10% level.
As it can be seen there is some marginally significant evidence that consumers may have
modified some of their sensorial perceptions following the exposure to brands. This result
strenghtens our previous conclusion that consumers are affected by brands in their evaluations
more than by the intrinsic characteristics of the product. The evidence from our experiment thus
shows some support to the hypothesis in Q3b
The final aspect of the question, on the potentially manipulative effect of exposure to brands,
can be summarized as follows:
Q3c: If exposure to brands exclusively only helps the identification of intrinsic sensorial
characteristics, the differences Qijx(2|T) - Qijx(1|T) should be significantly greater than the
differences Qijx(2|F) - Qijx(1|F).
Table 6 reports, in the first and second row, for each beer and sensory profile, the average
differences between sensorial characteristics perceived in the first and in the second stage, for
the T and F treatments, respectively.
Treatment Bitter Sweet Fizzy Body Aromas
T -0.1 -0.2 -0.2 -0.0 -0.2 H
F -0.9 0.1 -0.1 -0.3 -0.3
T 0.6 -0.3 0.4 0.1 -0.2 B
F -0.1 -0.3 0.4 0.0 0.1
T -0.4 -0.1 -0.1 0.0 0.3 C
F 0.3 -0.1 -0.1 0.0 0.1
Table 6: Average difference in sensorial perceptions between stage 1 and 2 in treatments T and F.

Liuc Paper n.254, ottobre 2012
18
As it can be seen, in no case the differences between sensorial perceptions in treatment T
appear to be larger than in treatment F. This is confirmed by the results of a difference-of-
difference test on the intra-treatment differences, under the null hypothesis that is not
significantly different from zero. Actually, concerning the Bitter profile for beer H, it turns out
that the opposite is indeed the case: in fact the difference in perception in treatment F is
significantly larger than in treatment T. Our experimental evidence thus does not support the
hypothesis in Q3c and indicates that exposure to extrinsic information may induce subjective
perception of sensorial characteristics even when these are not intrinsically conveyed by direct
tasting experience.
5. Conclusions
We investigated the role and impact of exposure to brands in consumers’ evaluations and
purchasing decisions of lager beers, and explored its relation with exposure to intrinsic
information. The main objectives of our experimental analysis were two. The first question
concerned the actual ability of young consumers to identify their preferred beer. The second
objective was concerned the role played by brands, under two distinct perspectives: i) whether
the effect of exposure to brands was either generalized or specific to preferred beers; ii) the
ability of brands to induce perception of sensory characteristics. We addressed these questions
by proposing an experimental design that combined information from a questionnaire and a
two-stage beer tasting experiment. In a questionnaire prior to the experimental sessions, we
collected data on preferences and habits on beer from a sample of young consumers. We then
invited a sub-sample of subjects to take part into a beer tasting session. The experiment was
designed to exploit information both on within-subject differences across different stages, and
between-subjects differences across treatments. In particular, in the experiment, subjects were
assigned to one of two treatments and went through two stages. In each stage, participants’
evaluations for three beers was elicited using an incentive-compatible mechanism. The first
stage was a blind tasting, while in the second beers were presented together with bottles.
The main results of our experimental analysis are the following. First, consumers were
generally unable to spot their preferred beer in a blind taste. Second, after the brand information
was revealed, the evaluations expressed by the subjects changed significantly. Two particular
cases emerged: consumers whose preferred brand was C, expressed in blind tasting significantly
lower average evaluations for beer C than for any of the other two beers. The evaluations
expressed by these consumers significantly increased after that brand information was revealed.
An interesting case of the opposite sign is related to brand B. After that brand information was

Probably not the best lager in the world: effect of brands on consumers’ preferences in a beer tasting experiment
19
released, consumers expressed a lower evaluation for this beer. We interpret this result a weak
brand effect of beer B on our sample of young consumers, if compared to the other two brands.
Interestingly, exposure to brands also appeared to affect the way consumers described their
sensorial perceptions of intrinsic characteristics of the tasted beers. Our experimental evidence
seems to suggest that exposure to extrinsic information, such as brands, is able to induce
subjective perception of sensorial characteristics even when these are not intrinsically conveyed
by direct tasting experience.
Finally, the effect of brands appeared to be not only brand-specific but quite generalized:
consumers were affected by the extrinsic information conveyed by all brands, although the
effect was significantly stronger for their most preferred brands.
Our results suggest that young consumers of lager beers seem sensitive to brands in their
evaluations. The effect conveyed by extrinsic information appears stronger than sensorial
perceptions of intrinsic characteristics of the product, and can even induce some of them. The
interaction among different sources of extrinsic and intrinsic information, therefore, turns out to
be a challenging key point that deserves attention in future research.
Liuc Paper n.254, ottobre 2012
20
References
Allison R.I., Uhl K.P. (1964), Influence of Beer Brand Identification on Taste Perception, «Journal of Marketing Research», 1, 36-39.
Bowen D.J. et al. (1992), Effects of expectancies and personalized feedback on fat consumption, taste, and preference, «Journal of Applied Social Psychology», 22, 1061-1079.
Bushnell, S.E., Guinard, J.X. and Bamforth, C.W. (2003). Effects of sulfur dioxide and polyvinylpolypyrrolidone on the flavor stability of beer as measured by sensory and chemical analysis, Journal of the American Society of Brewing Chemists, Vol. 61, n.3, 133-141
Caporale, G., and Monteleone, E. (2004). Influence of information about manufacturing process on beer acceptability. Food Quality and Preference, Vol. 15, 3, 271-278
Combris, P., Lange, C., and Issanchou, S. (2006). Assessing the Effect of Information on the Reservation Price for Champagne: What are Consumers Actually Paying For? Journal of Wine Economics.
Combris, P., C. Lange and S. Issanchou (2007): Product Information, Hedonic Evaluation and Purchase Decision: an Experimental Study of Orange Juice, Journal of Wine Economics, 2, (1), 40-54.
Deliza, R., and MacFie, H.J.H. (1996). The generation of sensory expectation by external cues and its effect on sensory perception and hedonic ratings: A review. Journal of Sensory Studies, Vol. 11, 103-128.
Fevrier, P., Visser M. (2004). A Study of Consumer Behavior Using Laboratory Data. Experimental Economics, 7, 93-114.
Foster R.T., Samp E.J., Patino H. (2001), Multivariate modeling of sensory and chemical data to understand staling in light beer, «Journal of the American Society of Brewing Chemists»
Galizzi, M.M., Buonanno, P., Caggiano, G., and Leonida, L. (2008). Expert and peer pressure in food and wine tasting: evidence from a pilot experiment. Enometrica, Vol. 1, 51-68.
Galizzi, M.M. and D. Reiley (2010): An Identification Problem: Economists at a Wine Tasting Experiment. Discussion paper, Department of Economics, University of Brescia.
Garavaglia, C. (2009). Struttura di mercato e concorrenza nell’industria birraria in Italia. L’Industria, Vol. XXX
Guinard, J.X., Souchard, A., Picot, M. and Sieffermann, J.M (1998). Determinants of the Thirst-quenching Character of Beer. Appetite, Vol. 31, Issue 1, 101-115
Guinard, J.X., Uotani, B. and Schlich, P. (2001). Internal and external mapping of preferences for commercial lager beers: comparison of hedonic ratings by consumers blind versus with knowledge of brand and price. Food Quality and Preference, Vol. 12, Issue 4, 243-255.
Gustafson, C. (2008). Estimating the effect of the order of information revelation on purchases: espectations and subjective experience in the wine market, paper presented at the American Agricultural Association Annual Meeting, Orlando, July 27-29, 2008.
Hock, S.J., and Ha, Y. (1986). Consumer learning: advertising and the ambiguity of product experience. Journal of Consumer Research, Vol. 13, 221-233.
Lange, C., Issanchou S. And Combris P. (2000). Expected versus experienced Quality: Trade-Off with Price. Food Quality and Preference, Vol. 11, 289-297.

Probably not the best lager in the world: effect of brands on consumers’ preferences in a beer tasting experiment
21
Lee L., Frederick S., and Ariely D. (2006). Try It, You’ll Like It: The Influence of Expectation, Consumption and Revelation on Preferences for Beer. Psychological Science, Vol. 17, 1054-1058.
MacFie, H.J., Bratchell, N., Greenhoff, K. and Vallis, L.V. (1999). Designs to Balance the Effect of Order of Presentation and First-Order Carry-Over Effects in Hall Tests. Journal of Sensory Studies, Vol. 4, 129-148.
Makens, J.C. (1965). Effect of brand prefernce upon consumers’ perceived taste of turkey meat. Journal of Applied Psychology, Vol. 49, 261-263.
McClure, S.M., Li, J., Tomlin, D., Cypert, K.S., Montagne, L.M., and Montagne, P.R. (2004). Neural correlates of behavioral prefernce for culturally familiar drinks, Neuron, Vol. 44, 379-387.
Morrot, G., Brochet, F., and Dubourdieu, D. (2001). The colour of odours, Brain and Language.
Nevid, J.S. (1981). Effects of brand labeling on ratings of product quality. Perceptual and Motor Skills, 53, 407-410.
Olson, J.C., and Dover, P.A. (1978). Cognitive effects of deceptive advertising, Journal of Marketing Research, Vol. 15, 29-38.
Parr, W.V., White, K.G, and Heatherbell, D.A. (2003). The nose knows: influence of colour on perception of wine aroma, Journal of Wine Research, Vol. 14, 79-101.
Plassmann, H., J. O’Doherty, B. Shiv and A. Rangell (2008). Marketing Actions Can Modulate Neural Representations of Experienced Pleasantness, Proceedings of National Accademy of Science, 3, 105.
Porretta, S., Donadini, G. (2008). A Preference Study for No Alcohol Beer in Italy Using Quantitative Concept Analysis, Journal of the Institute of Brewing , Vol. 114, 315-321.
Tremblay, V.J., and Tremblay, C.H. (2005). The U.S. brewing industry. Data and economic analysis. The MIT Press.
Vigne, A. and Gergaud, O. (2007). Twilight of the idols in the market for champagne: dissonance or consonance in consumer preferences?, Journal of Wine Research, Vol. 18, 147-162.
Wardle, J., and Solomons, W. (1994). Naughty but nice: A laboratory study of health information and food preferences in a community sample, Health Psychology, Vol. 13, 180-183.
Liuc Paper n.254, ottobre 2012
22
Notes
1 The literature shows some evidence of such interaction between extrinsic and intrinsic information. In a
different setting, for instance, Hoch and Ha (1986) studied the effect of exaggerating the quality of JC
Penney shirts before and after participants had examined the shirts, but before the participants had
reported their impression of the shirts. Exaggerating the quality of the shirts before examination led to
participants to spend more time in examining the shirts, and led to higher overall quality perceptions of
the shirts. 2 Prior to the experiment, we had visited seven different supermarkets in the area, belonging to the five
biggest chains in Italy (Esselunga, GS, Iper, Coop and Auchan), and we surveyed the prices for the
three beers. Prices for beers were very close across chains: the exact averages (and standard deviations)
for the prices of the H, B and C beers were 0.68 (0.07), 0.97 (0.09) and 1.42 (0.15), respectively. In two
cases, the price of one beer was currently under a commercial promotion, and we thus referred to the
full, rather than the discounted, price. 3 IBU stands for International Bitterness Units. This scale measures the bitterness level of beer, given by
the use of hops during the brewing production process. 4 We selected the first 20 subjects who showed up earlier, and turned the remaining ones away, after
having compensated them with three bottles of beer as show-up fees. 5 In particular, among the 20 participants in the first session, 5 had indicated H as their most preferred
beer, 4 mostly preferred B, and 5 C. Among the 20 participants in the second session, these figures were
5, 5 and 4 respectively. Finally, in the third session, 6, 4 and 5 subjects had, respectively, indicated H, B
and C as their preferred beer. 6 The room is owned and managed by the municipal council of Castellanza, and is used for a variety of
cultural and social activities, including the course of the certificate for professional wine taster
organized by the Italian Society of Sommelier (AIS, Associazione Italiana Sommelier). 7 Two-sided sign test for the difference between pairs HB, BC and CH, respectively, in column
V(1)|Other. 8 The Wilcoxon signed rank test is a non-parametric test for equality of measures of central tendencies in
two independent samples, which is used whenever the distributional assumptions that underlie the
paired Student-t test are not satisfied. The rationale of the test is as follows. Suppose we collect 2
observations for each of the n subjects, denoted y(i) and x(i) respectively, for i=1,2,...,n. Calculate
z(i)=y(i)-x(i) and rank their absolute values, |z(i)|, from high to low. Let R(i) be the rank assigned to
|z(i)|. Then, under the assumptions that: (i) z(i) are independent, and (ii) z(i) come from a continuous
population and is symmetric around a common median m, the Wilcoxon test statistic is given by
W=f(i)*R(i), where f(i)=I(z(i)>0) and I() is the indicator function. Standard econometric software
usually report the asymptotic normal approximation to W, which is usually used when n>20.


