
Prof. Dr. Engr. S.M. Bhutta

Energy the lifeline of, industrial economic, development and quality of life.
Pakistan is the poorest of the poor as far as energy consumption per capita is concerned.
Pakistan ranks 25th in World Energy consumption and 31s t in Electricity production.
Per Capita electrical consumption per year of Pakistan is 470kWh, of Malaysia 2,708 & of Singapore 6,775 kWh
Pakistan has developed 12% of total hydel potentials, India has 30% & rich countries 75% of hydel potential
Hydel power supplies 715,000 MW or 19% of World Electricity.

44903
35413
22353
17328
72169
101478
0
20000
40000
60000
80000
100000
120000
2007 2010 2013 2016 2019 2022 2025 2028
MW
Electric Power Demand (2007-2025)

2007 2012 2015 2020 2025 2030
Hydel 6474 7379 9071 17423 23948 23948
IPPs 6466 14205 22045 36345 58955 95355
Genco+KESC 6431 10082 10082 10082 10082 10082
Rental 150 846 846 846 846 846
Total 19521 32512 42044 64696 93831 130231
Generation Expansion Plan 2007-2030

130231
64696
93831
19521
3251242044
0
20000
40000
60000
80000
100000
120000
140000
2007 2010 2013 2016 2019 2022 2025 2028
MW
As per generation expansion plan system needs additions of 32512 MW and 93831 MW by years 2012 and by 2025, respectively.
Generation Expansion Plan (2007-2030)

2394823948
17423
9071
7379
6464
0
5000
10000
15000
20000
25000
30000
2007 2010 2013 2016 2019 2022 2025 2028
MW
Hydropower Generation Expansion Plan

9051692
8352
6525
0
1000
2000
3000
4000
5000
6000
7000
8000
9000
MW
2012 2015 2020 2025 2030
Hydropower Addition as Per Generation Expansion Plan


DASU
K OHALA
HY DROPOWER PROJ ECTS
GOLEN GOL
K EY AL LAWI
PALAS VALLEY
SPAT GAH
BUNJ I
70 MW
106 MW
130 MW
621 MW
1100 MW
610 MW
4000 MW
5400 MW
BASHO28 MW
PHANDAR80 MW
PATTAN2800 MW
THAK OT2800 MW
HARPO33 MW
UNDER STUDIESHY DROPLANNING ORGANIZATION (HPO) WAPDA
FIG-2
Y ULBO3000 MW

Sr. No.
Project RiverLocati
on
Installed Capacity
(MW)
Tentative completion month of the study
Present Status
Estimated Construction
CostMillen (US$)
1 Kohala Jhelum Kohala 1100 Aug, 2009 Feasibility Study, Detailed Design and Tender Documents in progress.
2,115
2 Dasu Indus Dasu 4320 Mar, 2011 Feasibility Study completed Design being started
7,800
3 Spat Gah Spat Gah Patan 567 Oct, 2009 Feasibility Study in progress. 614
4 Palan Vally
Chor Nullah
Patan 621 Nov 2009 Feasibility Study in progress. 667
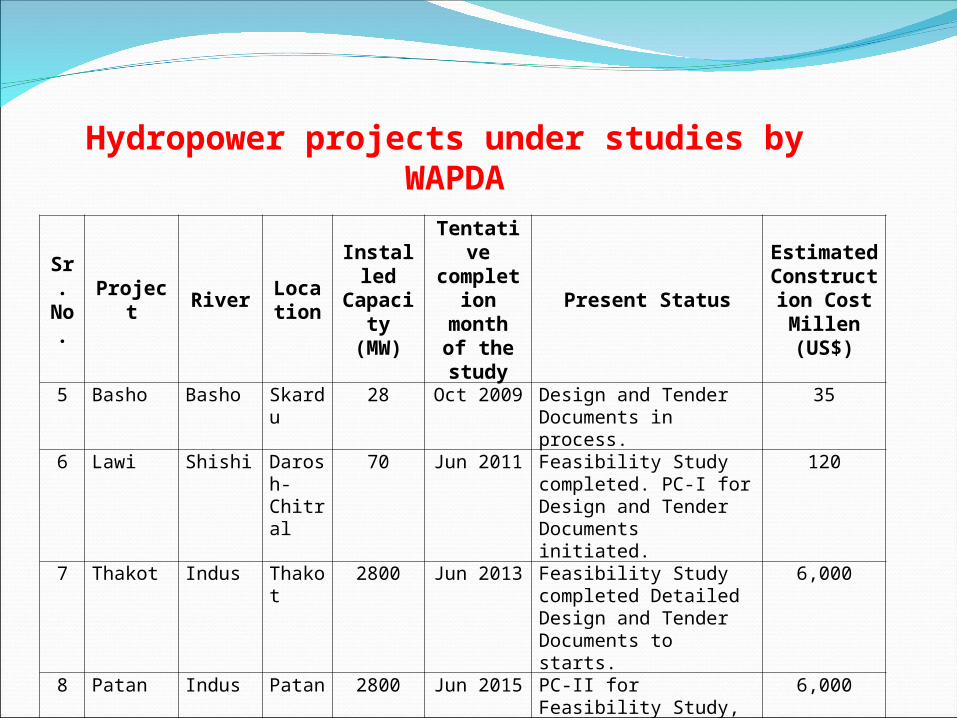
Hydropower projects under studies by WAPDA
Sr. No.
Project RiverLocati
on
Installed Capacity
(MW)
Tentative completio
n month of the study
Present Status
Estimated Constructio
n CostMillen (US$)
5 Basho Basho Skardu 28 Oct 2009 Design and Tender Documents in process.
35
6 Lawi Shishi Darosh-Chitral
70 Jun 2011 Feasibility Study completed. PC-I for Design and Tender Documents initiated.
120
7 Thakot Indus Thakot 2800 Jun 2013 Feasibility Study completed Detailed Design and Tender Documents to starts.
6,000
8 Patan Indus Patan 2800 Jun 2015 PC-II for Feasibility Study, Design and Tender Documents submitted.
6,000
Hydropower projects under studies by WAPDA

9 Phandar Ghizar Gilgit 80 Sep 2009 Feasibility completed Design and Tender Documents in process.
70
10 Keyal Khwar
Keyal Khwar
Patan 122 August, 2009
Feasibility Study completed. Detailed Design and Tender Documents in program completed
180
11 Golen Gol Golen Gol-Mastuj
Chitral-Mastuj
106 Nov 2008 Detailed Design and Tender Documents completed .
130
12 Harpo Harpo-Lungma
Skardu 33 PC-II for Design and Tender Documents prepared.
40
13 Shyok Shyoh Skardu 600 Desk studies 1,00014 Yulbo Indus Skardu 3000 Desk study & field
reconnaissance initiated 6,600
TOTAL 16,247 31.37
Billion
Hydropower projects under studies by WAPDA

Sr. No. Name of Station Installed capacity (MWs)
1 Tarbela 34782 Ghazi Barotha 1450.3 Mangla 1000.4 Warsak 240.05 Chashma 184.06 Rasul 22.07 Malakand 19.68 Dargai 20.09 Nandipur 13.8
10 Shadiwal 13.511 Chichoki Malian 13.212 K.Garhi & Renala 5.113 Chitral 1.14 Satpara 4.86
Total 6464
Installed Hydropower Stations in Pakistan
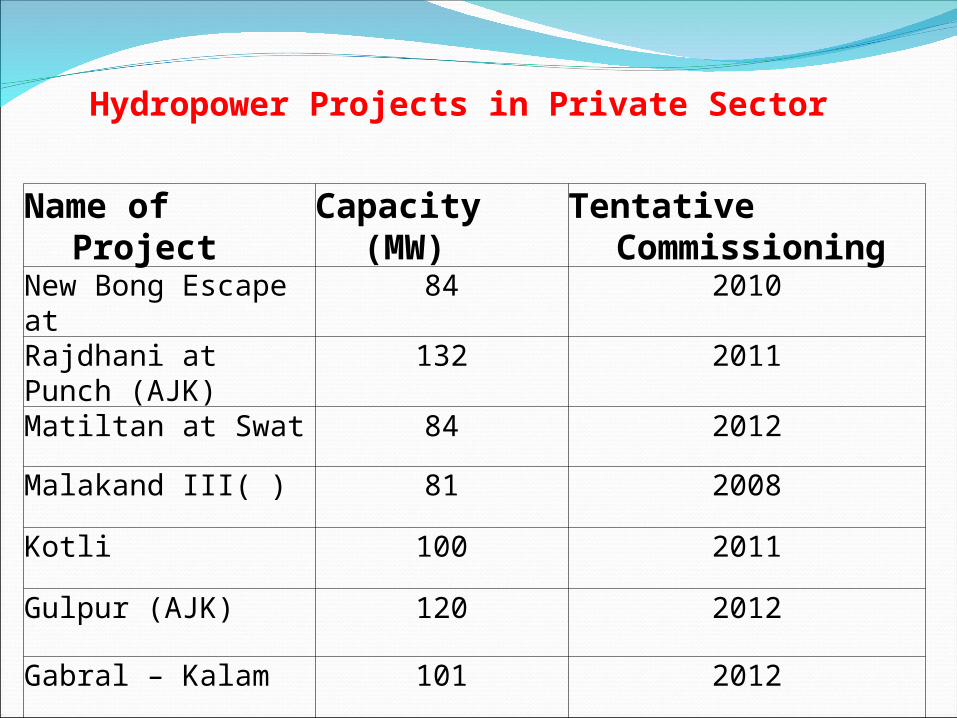
Name of Project Capacity (MW) Tentative Commissioning
New Bong Escape at 84 2010
Rajdhani at Punch (AJK)
132 2011
Matiltan at Swat 84 2012
Malakand III( ) 81 2008
Kotli 100 2011
Gulpur (AJK) 120 2012
Gabral – Kalam 101 2012
Hydropower Projects in Private Sector
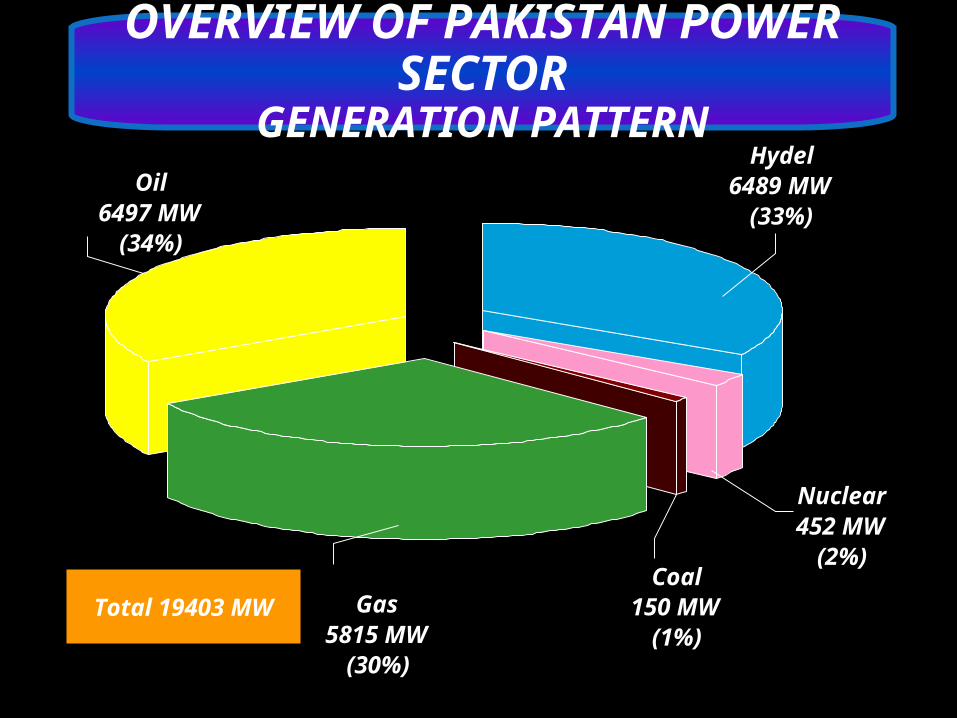
Total 19403 MW
Oil6497 MW
(34%)
Hydel6489 MW
(33%)
Nuclear452 MW
(2%)Coal
150 MW(1%)
Gas5815 MW
(30%)
OVERVIEW OF PAKISTAN POWER SECTOR
GENERATION PATTERN

Barriers in the Development of Hydel Power
1. To achieve consensus among people & provinces.
2. Technology and Information Barriers. 3. Policy Barriers.4. Regulatory Barriers.5. Institutional Barriers.6. Financial Barriers.7. Interconnection Barriers.8. Tariff. 9. Procedural impediments.
9.9. RisksRisksa.a. Hydrological RisksHydrological Risksb.b. Geological Risks. Geological Risks. c.c. Environment Risks.Environment Risks.d.d. Miscellaneous.Miscellaneous.

Technology and information Barriers.
We lack knowledge & information about the Technology of hydel. Need for education of hydel power technology not only for the Engineers but also for general public & decision makers.
Strategy to achieve five E’sE----- EducationE----- EnergyE----- EmploymentE----- EquityE----- Enterprise
UET Taxila has taken a lead in starting the classes for post graduate students about Hydel Power to implement the most important “Es” of Education in Energy & for Employment on Equity basics for Enterprises.

18
PAKISTAN’S HYDROPOWER POTENTIAL (SUMMARY)
Sr.No.
River/ Tributary Power(MW)
1. Indus River 35760
2. Tributaries of Indus (Northern Areas) of NWFP 5558
Sub Total (1+2) 41318
3. Jhelum River 3143
4, Kunhar River 1250
5. Neelum River & its Tributaries 2459
6. Poonch River 397
Sub Total (3+4+5+6) 7249
7. Swat River & its Tributaries 2388
8. Chitral River & its Tributaries 2282
Sub Total (7+8) 4670
9. Schemes below 50 MW on Tributaries 1290
TOTAL 54, 527

19
76.2
8.3
13.2
2.4
Indus River Basin
Jhelum River Basin
Swat & Chitral River
Small Hydel
PAKISTAN’S HYDROPOWER POTENTIAL
41816 MW
7249 MW
4528 MW
1290 MW
Swat & Chitral River
Jhelum River Basin
Small Hydel
Indus River Basin

PAKISTAN POWER DAM PROJECTPAKISTAN POWER DAM PROJECT (And Not KALABAGH DAM As It Is Multi Purpose But
Made Controversial) Pakistan Dam dedicated for 3,600 MW Electricity. No Provision for canal. 35 million acres land irrigated Canal with drawl. Storage depleted by 6MAF to be supplemented. Situation of water shortage, threat of famine. Have reached the stage of “acute water shortage”, where
people fight for every drop of water. Electricity generated will also pump water from tube wells Investigations studies started In 1953 and project planning
feasibility in 1982
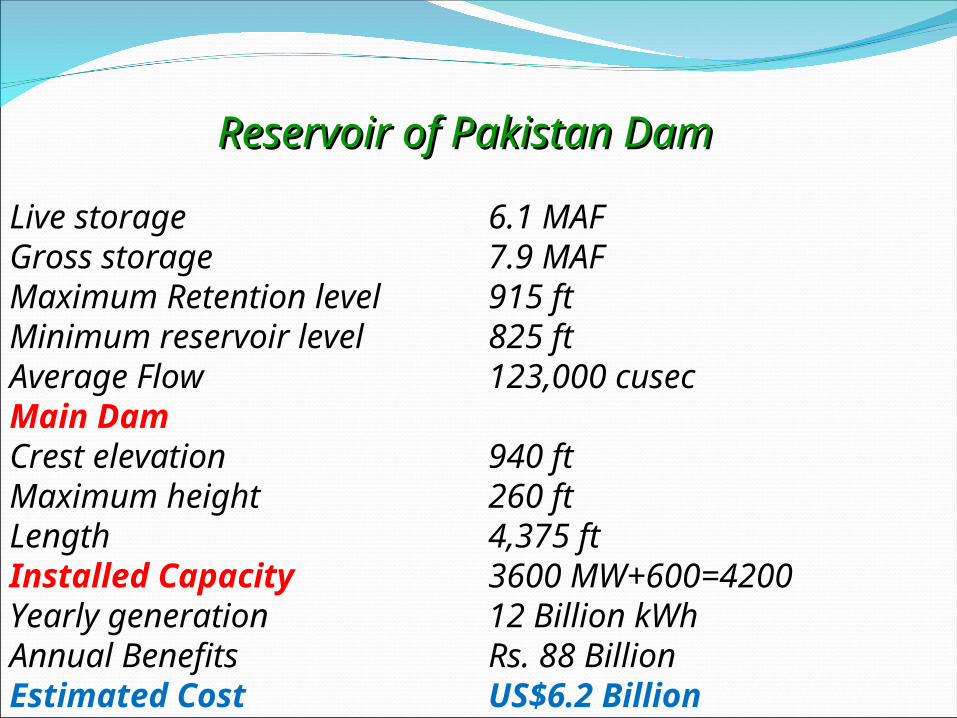
Reservoir of Pakistan Dam Reservoir of Pakistan Dam
Live storage 6.1 MAF Gross storage 7.9 MAFMaximum Retention level 915 ftMinimum reservoir level 825 ftAverage Flow 123,000 cusecMain Dam Crest elevation 940 ftMaximum height 260 ft Length 4,375 ft Installed Capacity 3600 MW+600=4200Yearly generation 12 Billion kWhAnnual Benefits Rs. 88 Billion Estimated Cost US$6.2 Billion

BENEFITS OF PAKISTAN DAM
The benefits to be derived from Pakistan Dam are enormous. On average, every year they will be higher than as given below
(Rs in Billion)
Average annual power benefits 64.64
Average annual irrigation benefits 12.53
Average annual flood alleviation benefits 1.44
Additional power from Tarbela 8.97
Average yearly benefits 87.58

NATIONAL LOSS IF PAKISTAN DAM IS NOT BUILT
The Annual energy generated would be equivalent to 20 million barrels of
oil otherwise needed to produce thermal power.
National food needs would be jeopardized.
38% loss of storage capacity of the existing reservoirs due to
sedimentation, results in shortage of committed irrigation
supplies.
Industrial, Commercial, Economic & quality of life will deteriorate further.
For implementation of Water Apportionment Accord 1991, new
storages are essential. it would give rise in bitter inter-provincial
disputes,

Salient Features of Pakistan(AS OF 1993)
Irrigated Area 34.5 M.AcresCultivated Area 51 M.AcresTotal Area 197 M.AcresTotal Surface Flow 151 M.Acre Ft Canals Withdrawals 106 MAFGround Water Pumps 43 MAF Total length of Canals 58,500 KM Agricultural Produce 26% of GDP
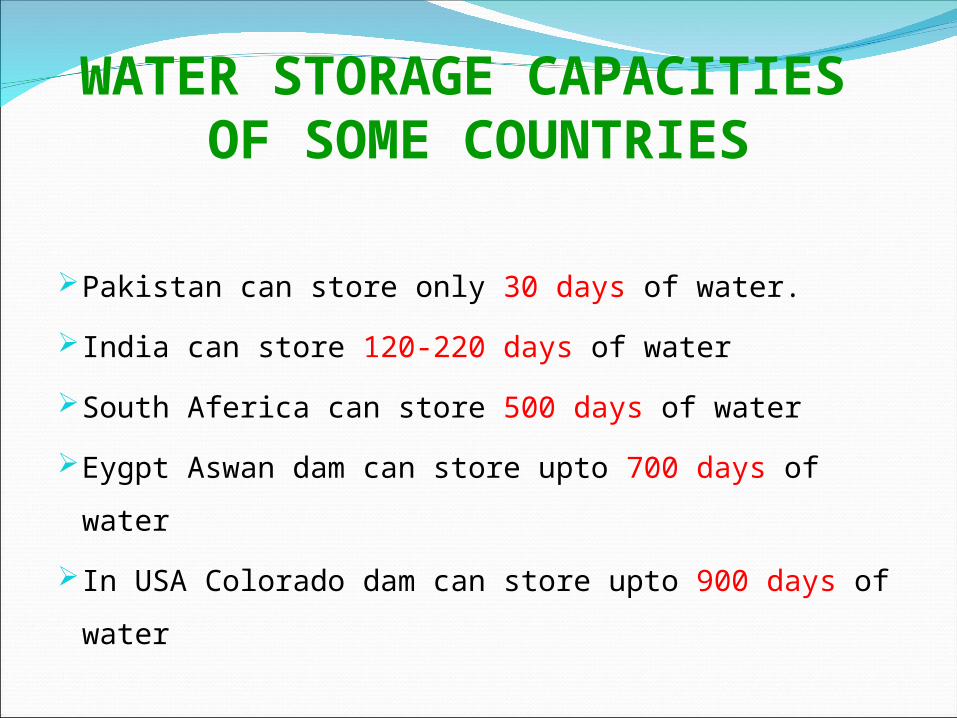
WATER STORAGE CAPACITIES OF SOME COUNTRIES
Pakistan can store only 30 days of water.
India can store 120-220 days of water
South Aferica can store 500 days of water
Eygpt Aswan dam can store upto 700 days of water
In USA Colorado dam can store upto 900 days of
water

APPREHENSIONS OF SINDH(1) No surplus water to fill Pakistan Dam reservoir
® Annual average of 35 MAF escape below Kotri to Sea.
® Pakistan Dam reservoir will be filled up by only 6MAF,
which will gradually be released to the provinces.
® Indus River System Authority (IRSA) has studied and
confirmed that sufficient water is available for further
storage
® Surface flow annual 151 MAF
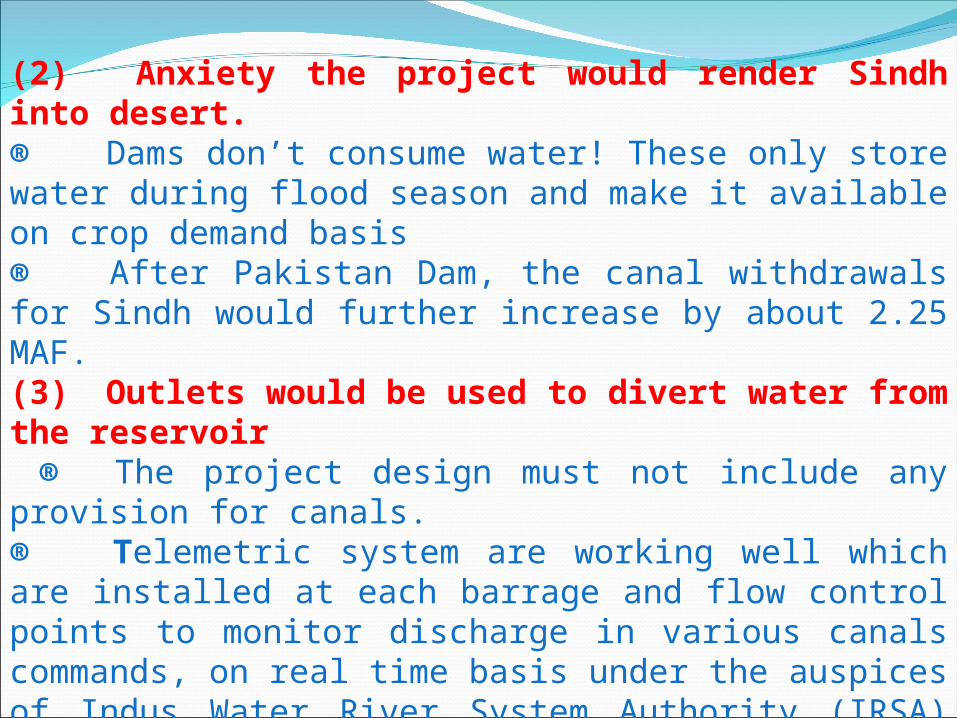
(2) Anxiety the project would render Sindh into desert. ® Dams don’t consume water! These only store water during flood season and make it available on crop demand basis® After Pakistan Dam, the canal withdrawals for Sindh would further increase by about 2.25 MAF.(3) Outlets would be used to divert water from the reservoir ® The project design must not include any provision for canals. ® Telemetric system are working well which are installed at each barrage and flow control points to monitor discharge in various canals commands, on real time basis under the auspices of Indus Water River System Authority (IRSA) and in all provinces.

(4) Cultivation in “Sailaba” areas would be effected ® Flood peaks above 300,000 cusecs would still be coming after construction of Pakistan Dam, without detriment to the present agricultural practices, while large floods would be effectively controlled. This would, in fact, be conducive to installation of permanent tube wells to provide perennial irrigation facility in rive rain areas. The farmer can have two crops annually instead of the present one crop. (5) Sea Water intrusion estuary would accentuate. ® Data shows that sea water intrusion, seems to be at its maximum even now, and it is unlikely to be aggravated further by Pakistan Dam.

APPREHENSION OF NWFP 1. flooding of Peshawar Valley including Nowshera
®Backwater effect of Dam lake would end about 10 miles
downstream of Nowshera.
2. Area of Mardan, Pabbi and Swabi plains would be
adversely affected creating water logging and salinity.
® Lowest ground levels at Mardan, Pabbi and Swabi areas
are 970, 960 and 1000 feet above MSL respectively, as
compared to the maximum conservation level of 915 ft for
dam, Operation pattern of reservoir cannot block the land
drainage and cause water logging or salinity

4. Operation of Mardan SCARP would be adversely affected. ® The invert levels of main drains of Mardan SCARP are higher than reservoir elevation of 915 feet and the back water level in Kabul River. These drains would keep on functioning without any obstruction.5. Fertile cultivable land would be submerged. ® Total cultivable affected land under the reservoir is only 35,000 acres,(24,500 acres in Punjab 3,000 acres in NWFP).irrigated land would be only 3,000 acres (2,900 acres in Punjab and 100 acres in NWFP).6. Population Dislocation ® Total population to be relocated is 120320 of which 78,170 shall be from Punjab and 42,150 from NWFP.
Resettlement of Affected Population will be properly compensated

BENEFITS OF HYDEL POWER DEVELOPMENT
Hydel Potential of 54,000MW to be harnessed to avoid load shedding
To reduce dependency on oil importHydel power a stimulator for the socio-
economic growthHighly reliable, cheap operation and
maintenance Able to respond to rapidly changing loads
without loss of efficiencyThe plants have a long life so highly
economical
BENEFITS OF HYDEL POWER DEVELOPMENT
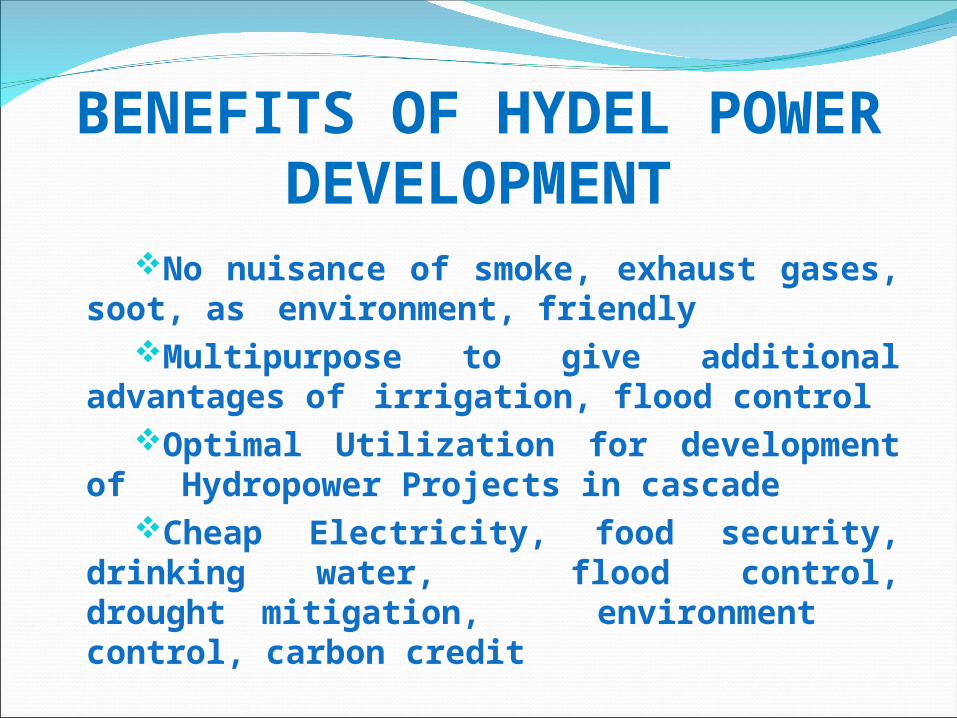
No nuisance of smoke, exhaust gases, soot, as environment, friendly
Multipurpose to give additional advantages of irrigation, flood control
Optimal Utilization for development of Hydropower Projects in cascade
Cheap Electricity, food security, drinking water, flood control, drought mitigation, environment control, carbon credit

Challenges in Hydropower ProjectsChallenges in Hydropower ProjectsTo achieve consensus among people & provinces.
Generally located in remote area, lack of basic infrastructure (access roads, tunnels, electricity, telephone, colony, potable water, manpower)
Dedicated and expensive delivery infrastructure required
Extra thermal capacity for backup in low water season
Hydel Generation varies with availability of water & head
Limited International experience in Private Hydropower Projects 33

Challenges in Hydropower ProjectsChallenges in Hydropower ProjectsSpecific Tariff & Security Documents issues
Project Agreements (IA, PPA) are different and complex
Clearances from the Provinces, Water Use Agreement etc.
More Capital intensive compared to thermal
Longer gestation and construction Period
More Construction Risks (inflation, cost overruns, delays, geological surprises, floods, extreme weather, socio-political)
Higher Tariff in the initial years
No “off-the-shelf” or standard machines similar to thermal plants
34

Challenges in Hydropower ProjectsChallenges in Hydropower Projects
Very site specific. Usually a number of options for developing each site
High percentage of civil works (70-75%) - difficult to estimate end costs
Operational Risks (hydrological risk, multiple uses, future developments/diversions)
Environmental & resettlement issues
Institutional set up at provincial level
To mitigate the conspiracy that “No large dam to be allowed to be build in Pakistan”
35

COMPARISON OF HYDRO POWE PLANTSEXISTING, UNDER CONSTRUCTION AND PLANNED
Pakistan IndiaIndia(Himalayan region)(Himalayan region)
No. of Projects
Capacity( MW)
No. of Projects
Capacity( MW)
Existing 6 6,385 74 15,208Under
Construction7 1,405 37 17,765
Planned 35 33,769 318 93,615Total 48 41,559 429 126,588

MAJOR HYDROELECTRIC STATIONS OF THE WORLDS.No Name Country Year of
CompletionTotal capacity (MW)
Annual Electricity Production (TWh)
1 Three Gorges Dam
China 2009 22,500 >100
2 Itaipu Brazil / Paraguay
1984/2003 14,000 90
3 Guri Venezuela 1986 10,200 46
4 Grand C oulee USA 1942 / 1980 6,800 22.6
5 Tarbela Pakistan 1976 3,478 13
6 Mangla Pakistan 1967 1,000 -

DIAMER BASHA DAM MULTI-PURPOSE PROJECT
(PROFILE OF PROJECT UNDER EXECUTION)
Project Location Chilas on Indus River 315 km upstream of Tarbela Dam,
Height of Dam 272 m
Length of Dam 990 m
Gross Storage 8.1 Million-acre feet (MAF)
Live Storage 6.4MAF
Total Installed Capacity 4,500MW
Total Number of Units 12, each of 375 MW
Power Houses 2 (2,250 MW each)
Average Generation 18,000 Gwh/ annum
Construction Period 2009-2017
Present Status
•Feasibility Completed in 2007.
•Construction to start by mid 2009.


