Fig_PC&P_5 Lecture Product Characterization and Processing of Pharmaceutical Particulate Solids, Silo pressure calculations , Jürgen Tomas 29.05.2013
Figure 5.0 Prof. Dr.-Ing. habil. J. Tomas – chair for Mechanical Process Engineering 5. Silo and hopper pressure calculations 5.1 shaft and hopper pressures 5.2 Wall thickness …

Fig_PC&P_5 Lecture Product Characterization and Processing of Pharmaceutical Particulate Solids, Silo pressure calculations , Jürgen Tomas 29.05.2013
Figure 5.1 Prof. Dr.-Ing. habil. J. Tomas – chair for Mechanical Process Engineering 5.1 shaft and hopper pressures
Vertikal and Horizontal Pressures at Mass Flow Silo
height level of flattenedfree bulk surface
intersection betweenshaft and hopper
height level of discharge opening
fillingdischarging
silo
heig
ht H
silo pressures pv and ph
pv
pv
ph
ph
pv
ph
radial stress field r∝σ
F 5.1
Fig_PC&P_5 Lecture Product Characterization and Processing of Pharmaceutical Particulate Solids, Silo pressure calculations , Jürgen Tomas 29.05.2013
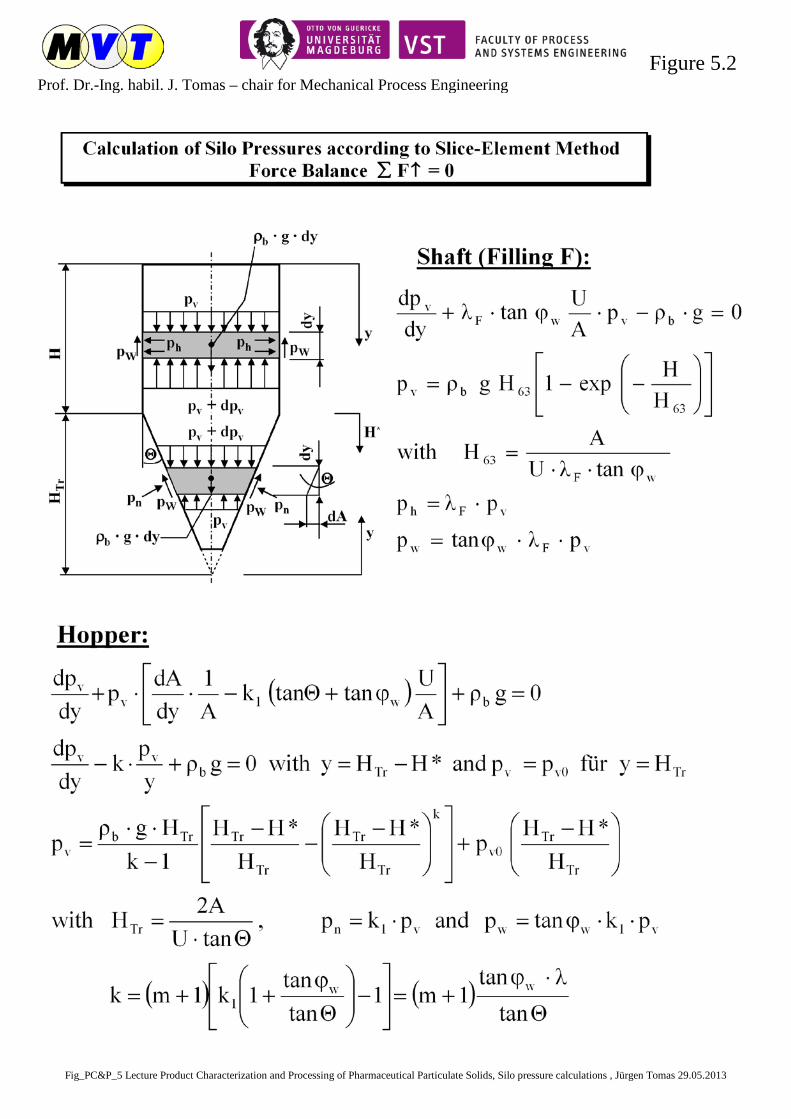
Figure 5.2 Prof. Dr.-Ing. habil. J. Tomas – chair for Mechanical Process Engineering
Fig_PC&P_5 Lecture Product Characterization and Processing of Pharmaceutical Particulate Solids, Silo pressure calculations , Jürgen Tomas 29.05.2013
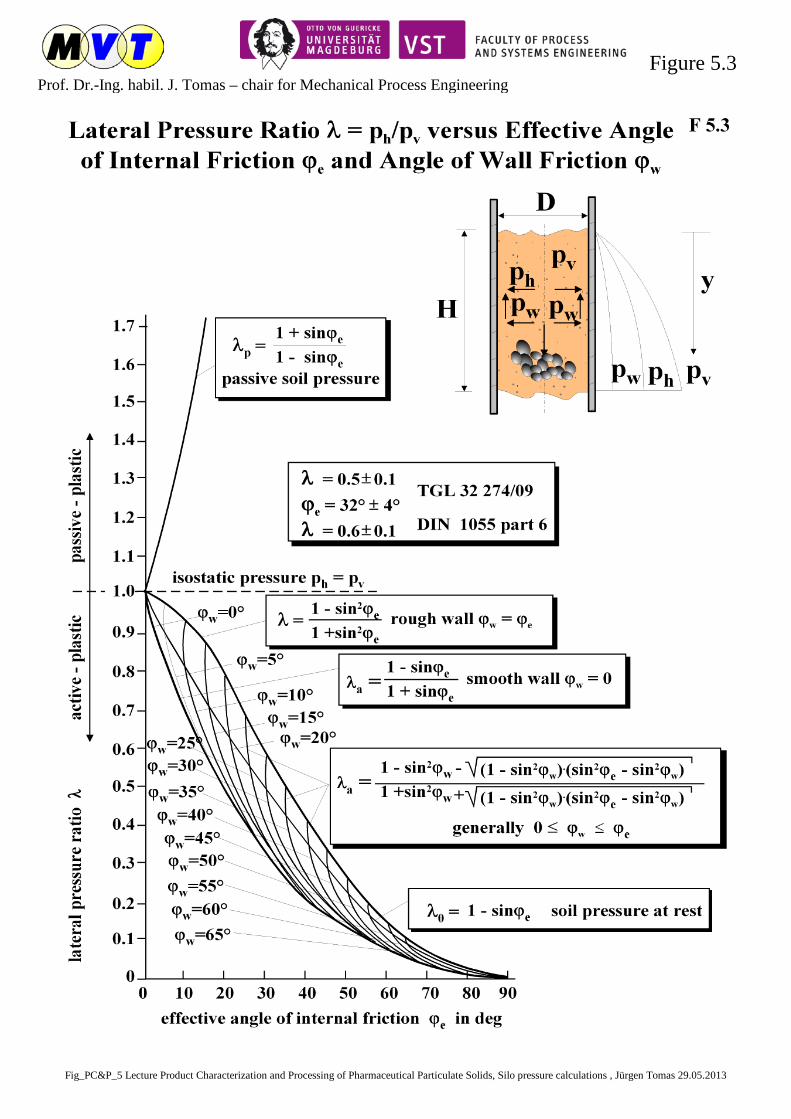
Figure 5.3 Prof. Dr.-Ing. habil. J. Tomas – chair for Mechanical Process Engineering

Fig_PC&P_5 Lecture Product Characterization and Processing of Pharmaceutical Particulate Solids, Silo pressure calculations , Jürgen Tomas 29.05.2013
Figure 5.4 Prof. Dr.-Ing. habil. J. Tomas – chair for Mechanical Process Engineering
posit
ion
of ac
tive s
hear
pla
ne
Active and Passive Rankine's Stress State Limits
Yield locus: τ = tanϕi ·σ +τc = tanϕi ·(σ + σZ) or σR = sin ϕi ·(σM + σZ)
ph,a
activepassive
shea
r st
ress
τ
tensile strength σZ
cohesion τc
ϕi
σ2,aαa=
π ϕi4 2+
ϕiσR ,a
2·αa
pvσ1,a
yield locus
ph,p
σ1,p
αp =π ϕi
4 -
2
σM,p =σ1,p + σ2,p
2
position of passive shear plane
σR,p=
σ1,p σ2,p
2
-
active passive
principal stresses
lateral orhorizontal stress ratio
σ2,a = · σ1+ · τc1 - sin ϕi
1 + sin ϕi
2 · cos ϕi1 + sinϕi
σ1,p = · σ2,p+ · τc1 + sin ϕi
1 - sin ϕi
2 · cos ϕi
1 - sinϕi
lower limit for τc = 0 upper limit for τc = 0
ph,p
pv= = = tan21 + sin ϕi
1 - sin ϕi(π
4 +ϕi
2λp
ph,a
pv= = = tan21 - sin ϕi
1 + sin ϕi( π
4 -ϕi
2λa
·
·
·
active
π ϕi4 2+
pv
ph,aτ pv
ph,p
passive
π ϕi4 2
-τ
pv
ph,aτ
σ
pv ph,p
τσ
normal stress σ
given: pv = σ1 = ρb.g y τc, ϕi
searched: 2 stress states which meet the yield condition
y
x
σ2,p
F 5.4
Fig_PC&P_5 Lecture Product Characterization and Processing of Pharmaceutical Particulate Solids, Silo pressure calculations , Jürgen Tomas 29.05.2013
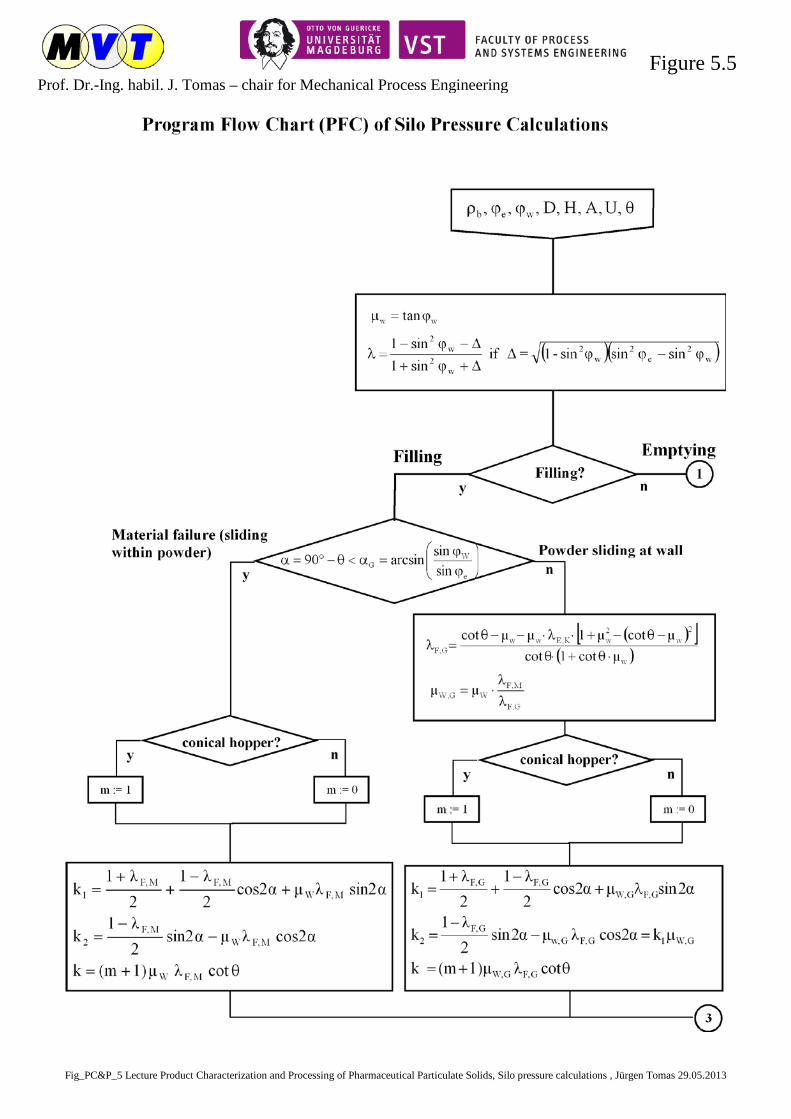
Figure 5.5 Prof. Dr.-Ing. habil. J. Tomas – chair for Mechanical Process Engineering

Fig_PC&P_5 Lecture Product Characterization and Processing of Pharmaceutical Particulate Solids, Silo pressure calculations , Jürgen Tomas 29.05.2013
Figure 5.6 Prof. Dr.-Ing. habil. J. Tomas – chair for Mechanical Process Engineering

Fig_PC&P_5 Lecture Product Characterization and Processing of Pharmaceutical Particulate Solids, Silo pressure calculations , Jürgen Tomas 29.05.2013
Figure 5.7 Prof. Dr.-Ing. habil. J. Tomas – chair for Mechanical Process Engineering

Fig_PC&P_5 Lecture Product Characterization and Processing of Pharmaceutical Particulate Solids, Silo pressure calculations , Jürgen Tomas 29.05.2013
Figure 5.8 Prof. Dr.-Ing. habil. J. Tomas – chair for Mechanical Process Engineering
storage time tL = 22 hmFill = 11,5 tρb = 0,8 t/m3
ϕe = 33°ϕw = 23° steel sheet (CF)ϕw = 18° steel sheet (MF)
mass flow, switch load ∆pn = (c4 - c1) pn · cos Θ,TGL 32274/09
mass flow, switch load ∆pn = ρb· g · (H or D),DIN 1055 part 6
0 5 10 15 20 25 30 35 40
wall normal pressures ph, pn in kPa
0
1
2
3
4
5
heig
ht H
, H' i
n m
mass flow (MF)
core flowflow bondary
siloG 807
pn
Wall Normal Pressures ph, pn of Wheat
measured, filling measured, dischargingcalculated, fillingcalculated, discharging, load factors c1 = 1,4, c4 = 3,0calculated, DIN 1055 part 6
c3 = 1.8 (CF)
23°
30°
ph
D = 2,4 m
measurements according to Scholz
F 5.8
Fig_PC&P_5 Lecture Product Characterization and Processing of Pharmaceutical Particulate Solids, Silo pressure calculations , Jürgen Tomas 29.05.2013
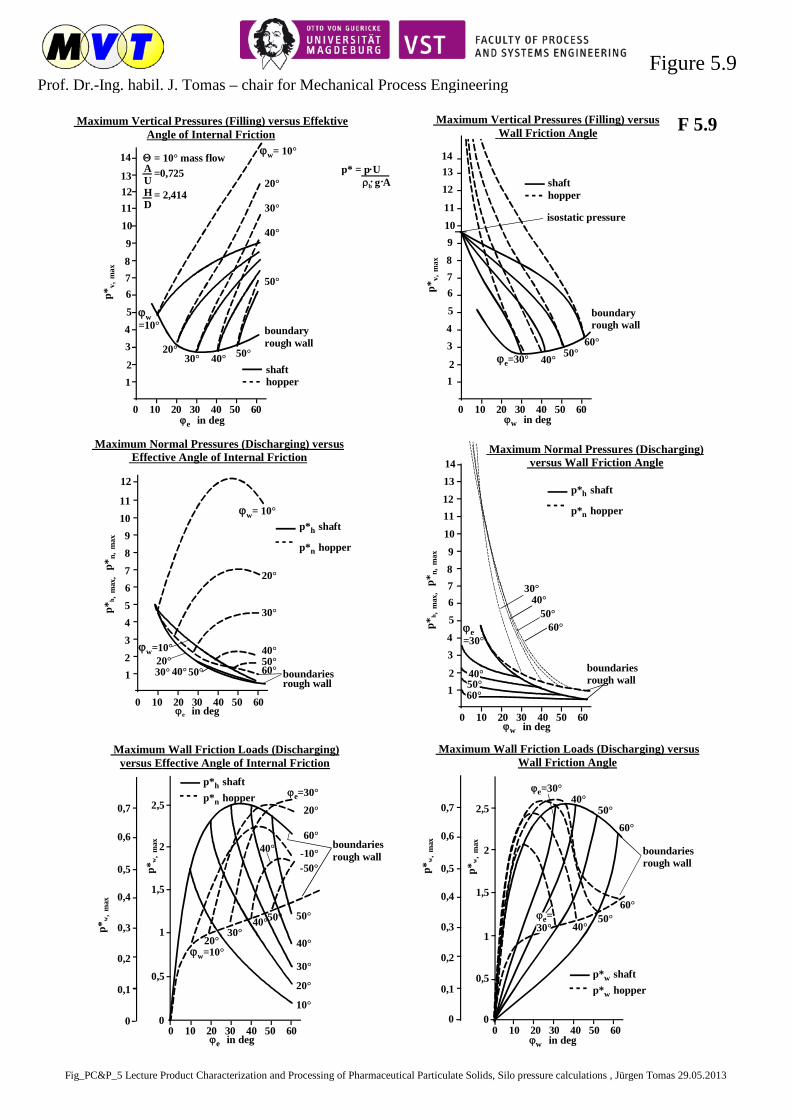
Figure 5.9 Prof. Dr.-Ing. habil. J. Tomas – chair for Mechanical Process Engineering
Maximum Normal Pressures (Discharging) versus Effective Angle of Internal Friction
123456789
1011
ϕw= 10°
boundariesrough wall
ϕw=10°20°30° 40° 50°
0 10 20 30 40 50 60
p*h shaft
p*n hopper
20°
30°
40°50°60°
p*h ,
max
, p
* n,
max
12
ϕe in deg
Maximum Vertical Pressures (Filling) versus EffektiveAngle of Internal Friction
p*v,
max
0 10 20 30 40 50 60
12
345
678
9
1011
ϕw= 10°
20°
30°
40°
50°
boundaryrough wall
Θ = 10° mass flow =0,725
= 2,414
AUHD
shafthopper
ϕw=10°
20°30° 40° 50°
1213
14
ϕe in deg
Maximum Vertical Pressures (Filling) versus Wall Friction Angle
0 10 20 30 40 50 60
12
34
5
678
910
11
ϕe=30° 40° 50°
1213
isostatic pressure
boundary rough wall
p*v,
max
14
shafthopper
60°
ϕw in deg
Maximum Normal Pressures (Discharging) versus Wall Friction Angle
12
34
56789
10
11
30°40°
50°
0 10 20 30 40 50 60
boundariesrough wall
p*h ,
max
, p
* n,
max
12
1314
60°ϕe=30°
ϕw in deg
60°50°40°
p*h shaft
p*n hopper
Maximum Wall Friction Loads (Discharging)versus Effective Angle of Internal Friction
0 10 20 30 40 50 60
ϕw=10°
20°
30°
40°
-50°
p*h shaftp*n hopper
20°
10°
30°
20°
40°
50°
-10°
ϕe=30°
1
2
1,5
2,5
0 0
0,5
0,6
0,7
0,4
0,3
0,2
0,1
p*w
, m
ax
boundariesrough wall
0,5
60°
40°50°
p*w
, m
ax
ϕe in deg
p*w
, m
ax
p*w
, m
ax
Maximum Wall Friction Loads (Discharging) versusWall Friction Angle
ϕe=30°40°
50°
50°40°
0
0,5
1
1,5
2
2,5
0
0,5
0,6
0,7
0,4
0,3
0,2
0,1
boundariesrough wall
0 10 20 30 40 50 60
60°
60°
ϕe=30°
ϕw in deg
p*w shaftp*w hopper
p* = p U ρb g A
.. .
F 5.9

Fig_PC&P_5 Lecture Product Characterization and Processing of Pharmaceutical Particulate Solids, Silo pressure calculations , Jürgen Tomas 29.05.2013
Figure 5.10 Prof. Dr.-Ing. habil. J. Tomas – chair for Mechanical Process Engineering
12
34
5
678
p*v,
max
9
1011
ϕw= 10°
20°
30°40°
50°
boundaryrough wall
Θ = 30° core flow =0,725
= 2,414
AUHD
shafthopper
ϕw=10°
20°30° 40° 50°
0 10 20 30 40 50 60ϕe in deg
Maximum Vertical Pressures (Filling) versus EffektiveAngle of Internal Friction
12
34
5
678
910
11
ϕe=30° 40° 50°
0 10 20 30 40 50 60
12
13
shafthopper
isistatic pressure
boundary rough wall
p*v,
max
60°
ϕw in deg
Maximum Vertical Pressures (Filling) versus Wall Friction Angle
12
345
678
9
10
11 ϕw= 10°
boundariesrough wall
ϕw=10°
20°
30°40° 50°
0 10 20 30 40 50 60
p*h shaft
p*n hopper
20°30°40°50°
60°
p*h ,
max
, p
* n,
max
60°
ϕe in deg
Maximum Normal Pressures (Discharging) versus Effective Angle of Internal Friction
12
345
678
910
11
ϕe=30° 40° 50°
0 10 20 30 40 50 60
ϕe=30°40°50°
60°
60°
boundariesrough wall
p*h ,
max
, p*
n, m
ax
ϕw in deg
p*h shaft
p*n hopper
Maximum Normal Pressures (Discharging) versus Wall Friction Angle
ϕe=30° 40°50°
50°
40°ϕe=30°
0 0
Ip* w
, m
ax
0,5
0,6
0,7
0,8
0,9
1,0
0,4
0,3
0,2
0,10,5
1
1,5
2
2,5
3
p*w
, m
ax boundariesrough wall
0 10 20 30 40 50 60
60°
60°
ϕw in deg
p*h shaft
p*n hopper
Maximum Wall Friction Loads (Discharging) versus Wall Friction Angle
3
ϕw=10° 20°
30°
40°
50°
20°
10°
30°
20°30°40°
50°
10°
ϕe=60°
1
2
1,5
2,5
00 10 20 30 40 50 60
0
0,5
0,6
0,7
0,8
0,9
1,0
0,4
0,3
0,2
0,1
Ip* w
, m
ax boundaries rough wall
0,5
ϕe in deg
p*w
, m
ax
p*h shaft
p*n hopper
Maximum Wall Friction Loads (Discharging)versus Effective Angle of Internal Friction
p* = p U ρb g A
.
. .
F 5.10
Fig_PC&P_5 Lecture Product Characterization and Processing of Pharmaceutical Particulate Solids, Silo pressure calculations , Jürgen Tomas 29.05.2013
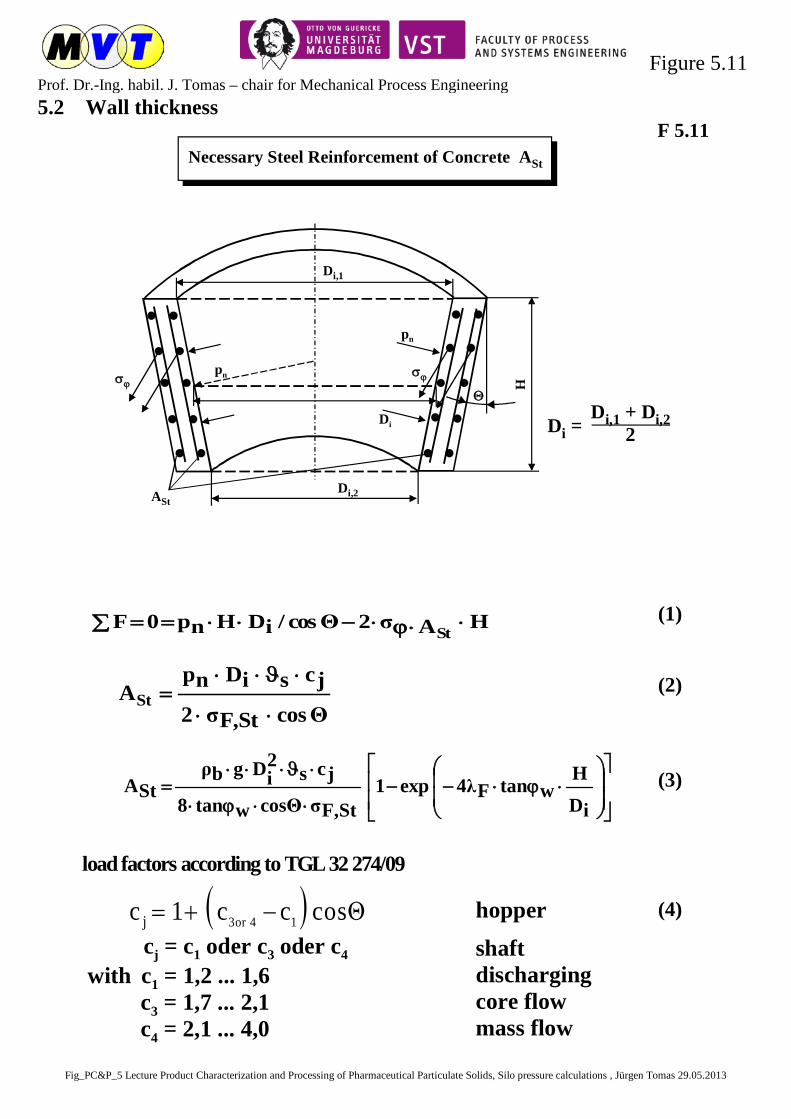
Figure 5.11 Prof. Dr.-Ing. habil. J. Tomas – chair for Mechanical Process Engineering 5.2 Wall thickness
Necessary Steel Reinforcement of Concrete ASt
Di,1
pn
σϕ
ASt
H
Di
Di,2
Θ
pnσϕ
Di = Di,1 + Di,2 2
(1)
(2)
(3)
(4)
ΘcosF,Stσ2jcsiDnp
ASt⋅⋅
⋅ϑ⋅⋅=
HAσ2cosΘ/iDHnp0FSt
⋅⋅ϕ⋅−⋅⋅==∑
⋅ϕ⋅−−
⋅⋅ϕ⋅
⋅ϑ⋅⋅⋅=
iDH
wtanF4λexp1F,StσcosΘwtan8jcs
2iDgbρ
StA
load factors according to TGL 32 274/09
( ) Θcoscc1c 14or3j −+=cj = c1 oder c3 oder c4
with c1 = 1,2 ... 1,6 c3 = 1,7 ... 2,1 c4 = 2,1 ... 4,0
hoppershaftdischargingcore flowmass flow
F 5.11

Fig_PC&P_5 Lecture Product Characterization and Processing of Pharmaceutical Particulate Solids, Silo pressure calculations , Jürgen Tomas 29.05.2013
Figure 5.12 Prof. Dr.-Ing. habil. J. Tomas – chair for Mechanical Process Engineering


