
Professor Ioan RADU, PhD
E-mail: [email protected]
Senior Lecturer Monica SABAU, PhD
E-mail: [email protected]
Associate Professor Cleopatra ŞENDROIU, PhD
E-mail: [email protected]
The Bucharest University of Economic Studies
Associate Professor Stefan PETE
Babes-Bolyai University, Cluj-Napoca
COERCIVE ECONOMIC DIPLOMACY – CORRUPTION
TRIGGER OR DETERRENT
Abstract. Establishing international sanctioning regimes is an important
tool for maintaining peace and international security. Our approach for assessing
the degree of corruption in a country while determining the correlations with
coercive diplomacy and economic sanctions starts from analyzing the general
economic factors affecting the level of corruption and its results. This study
provides an analysis of the impact of coercive instruments of foreign policy (in the
form of economic sanctions) on the level of corruption in the target countries. The
results offer a support for the fact that sanctions cause more extensive damages to
the economic environment and the public perception, more important than the
limited sanctions.
Keywords: corruption deterrence, international infringements, economic
sanctions, coercive diplomacy, SPSS software package.
JEL Classification: F51, M48, N44
1. INTRODUCTION
Visible and very present in the emerging markets, corruption is not a peripheral
social phenomenon which can be ignored by business operators, it is a first-line
threat, directly affecting the competitive economic environment. As a social
phenomenon, corruption is regarded as misuse of power in order to achieve a
personal gain, taking various forms from bribery to fraudulent misuse of funds.
Today the phenomenon of corruption is not addressed tacitly anymore and
managed only at national level, but it is subject to international anti-corruption
movements involving many organizations and companies. The international
commitment against corruption is mainly represented by the Organization of
International Transparency (TI), the Organization for Economic Co-operation and
Ioan Radu, Monica Sabau, Cleopatra Sendroiu, Stefan Pete
_________________________________________________________________
Development (OECD), the World Bank Institute (WBI) and the United Nations
Convention against Corruption. Their collective actions generate resources every
year (as studies, professional guides, indicators), which can be used by companies,
the public or the official institutions in order to promote ethics and integrity
policies and to condemn corruption and build integrated systems for preventing
and detecting any acts of fraud.
The international organizations have at their disposal a number of tools, such as
sanctions and embargoes, which may result in a change of the government attitude,
when they don’t have the will or capacity to provide the political goods or the
multilateral humanitarian relief funds.
The public diplomacy has been used by the US government since World War I, but
the term was used for the first time only in 1965, by Edmund Gullion, an American
diplomat [5], in order to describe the process through which the international actors
were trying to achieve their foreign policy objectives, based on the interaction with
foreign countries audience. Nowadays, the public diplomacy is one of the most
important concepts of the political communication.
Political scientist Joseph Nye [26] described the public diplomacy as a political
expression of soft power, a concept which he introduced in early 1990. In
international politics, power is the ability of an actor to influence another one to
perform certain actions that have not taken place otherwise. Therefore, the hard
power is the ability of an actor to compel another to perform certain actions and to
include as tactics the military intervention, the coercive diplomacy and the
economic sanctions. On the other side, the soft power is the ability to persuade an
actor to take those actions. The combination of these two is the power of smart,
strategic approach, using the most appropriate tactics in the two dimensions of
power mentioned above.
The coercive diplomacy term designates an attempt to reach a target, to convince a
state, a group (or groups) within a state, or a non-state actor to change their
unacceptable behavior either by threatening to use force or actual use limited
forces. The coercive diplomacy is a diplomatic strategy, based on force threat
rather than its use. If force should be used to strengthen diplomatic efforts to
persuade, it will be engaged in an exemplary manner in the form of a
military/economic action rather limited, in order to demonstrate the availability of
having enlarged military/economic actions if necessary.
The economic diplomacy is the foreign policy function linking the foreign policy
approaches and the citizens economic welfare of a country and aims to use all the
instruments of foreign policy in order to promote the business interests of the
Romanian entrepreneurs and the Romanian state. The economic diplomacy
provides an effective framework for the institutional cooperation in order to
achieve certain ways to promote the Romanian economic goals abroad and support
the foreign investments in Romania. The main responsibilities relate to: promoting
the Romanian economic interests abroad; support and promotion of energy
security, cooperation with international economic organizations; inter-institutional
cooperation for economic issues.
Coercive Economic Diplomacy – Corruption Trigger or Deterrent
_______________________________________________________________
2. ECONOMIC SANCTIONS AND RELATED CONSEQUENCES
Establishing international sanctioning regimes is an important tool for maintaining
peace and international security. The sanctions are adopted in order to determine
the change of activities or policies inconsistent with certain standards of conduct
shared by the international community.
After the Cold War ended, the sanctions adopted by ONU and subsequently also
by the European Union began to be increasingly more frequently used as an
"intermediate" tool between negotiations and coercive actions seeking to induce
the desired behavior in order to avoid using armed force. With this increasingly
common usage, the penalties features have changed in order to avoid their side
effects and increase their efficiency on certain target groups.
Therefore, the need to protect the most vulnerable segments of the population in
countries with too restrictive measures regimes has determined avoiding the
imposition of complete prohibition regimes, such as the ones specified in art. 41 of
ONU Charter. Progressively, certain restrictive measures have been identified,
such as arms embargoes, travel bans, freezing of funds per persons or entities.
Also, certain provisions have been included in the documents establishing
sanctioning regimes stipulating the humanitarian exceptions for such sanctions.
These changes of the sanctions have been motivated by the need of increasing their
efficiency as political instruments in the service of diplomacy, in order to affect
directly and immediately those groups, among which, most often, the ruling elites,
whose conduct is sought to be influenced.
The types of sanctions used internationally by the ONU, EU and OSCE are
economical (restrictions on imports, exports, investment, arms embargoes),
financial (freezing of funds and other economic resources), travel restrictions,
restrictions on transport (road , air, sea), penalties cultural, sporting, diplomatic.
In developing and implementing these individualized sanctions, the main purpose
is to have into consideration the human rights and the fundamental freedoms, in
particular the right of individuals or entities sanctioned to a fair trial and their
access to effective remedies. It also seeks to ensure that measures are proportionate
to the aim pursued and accompanied by a system of exceptions that take into
account the basic needs of those sanctioned.
A significant part of the literature on economic sanctions treats the functioning of
economic sanctions [7] [8] [9] [10] [11] [18] [19] [20] [25]. The overall conclusion
is that economic sanctions rarely induce behavioral changes in the desired direction
[27]. It is shown that economic coercion could cause serious political and
humanitarian costs in the target countries. Research shows that economic sanctions
cause problems for civil society by disrupting the ability of government (economic,
demographic, amounts allocated to health and education) in target countries [1] [2] [4] [16] [24] [28] [31].
Penalties can lead to serious political consequences which were not originally
intended by the sender countries, such as worsening of the human rights and
Ioan Radu, Monica Sabau, Cleopatra Sendroiu, Stefan Pete
_________________________________________________________________
democratic freedoms in the sanctioned countries [13] [16] [31]. Due to the fact that
the economic sanctions disrupt the economic and political stability, the external
economic pressures may become a major threat to the country's political leadership
mandate target, increasing the likelihood of political violence [24] [1] and violation
of basic human rights for the citizens of the countries sanctioned [28] [29] [32] [16]. None of these studies relate to the effect of external economic constraints
based on the level of corruption.
The countries determining the sanctions initially apply an external economic
pressure against a target state, in the hope that the economic turmoil caused by the
constraint would endanger the legitimacy and authority of the target regime. The
purpose of applying sanctions is to force the state to respond to the consigning
country target [20]. The consequences of the economic constraints are not limited
to the economic and political impact on the ability of specific schemes, as they also
have significant affects on the socio-economic and political well-being of civilians
[4] [16] [31].
Therefore, an economic constraint will be unlikely to affect the major repressive
capacity and legitimacy of political leadership target, but certainly will not promote
more freedom of association, expression and communication, especially in a less
democratic system.
Instead, the focus on undesirable political repercussions and economic disruptions
caused by the applied constraint indicates that sanctions are likely to aggravate the
freedom of opinion and the level of democracy in the countries sanctioned.
3. CONSIDERATIONS FOR DATA SELECTION
Our approach for assessing the degree of corruption in a country while determining
the correlations with coercive diplomacy and economic sanctions starts from
analyzing the general economic factors affecting the level of corruption and its
results.
In developing the research study, the mimics equation structural model - Multiple
Indicators Multiple Causes (eng. Multiple Indicators Multiple Causes) will be
used. The model was introduced in 1970 in the economic research by Zellner, then
it was mentioned in 1983 in Weck's research [14], developed by Loayza [23], Giles
[17]. It is used successfully in determining the level of the underground economy
for the institutional changes in the countries of Eastern Europe, in order to quantify
the welfare of citizens [21]. It has been recently used by Bajada and Schneider [3]
for the study of corruption in the Australia and Pacific region and by Dell'Anno
and Schneider [30] for determining the shadow economy of Italy.
According tot he MIMIC model, the latent variable is the degree of corruption and
the observable variables are divided into causes and indicators, reflecting the
economic dependence and influence on the processes of this phenomenon.
The information has been taken from the database of World Bank and Eurostat for
the period between 2010-2011, and its actual values are presented in Appendix 1.
For the normalization and the econometric analyzes, the IBM SPSS software
package has been used.

Coercive Economic Diplomacy – Corruption Trigger or Deterrent
_______________________________________________________________
The following data have been chosen as cases for the model: the access to credit (1
low -183 high), the opening of the national economy ((% Imports in Gross
Domestic Product - GDP), the index of democracy (1 low - 10 high), the index of
business facility (1 Low - 183 high), the education (secondary school completed by
% of the population, at ages of 20-24 years), the rate of taxes (% of the total
revenues of a company).
a. the access to credit – if it is reduced, it influences the degree of corruption
through the pressure created for the economic agents to modify their financial
statements in order to apparently meet the financial indicators required by the
credit institutions;
b. the opening of the national economy - the higher the share of imports in GDP,
the higher is for the national economy the influx of foreign capital (as money or
property) and also a new series of regulations harmonized with the international
laws;
c. the democracy index - or the political rights index - it was included due to the
lack of political competition associated with a high degree of corruption;
d. the index of business facility - the more investors will find easy ways to conduct
business, the less opportunities will be linked to bribery and pressure;
e. the level of education - the lack of funds for the education sector is a
characteristic of countries with high levels of corruption (in this case the data
indicate a proportion of 20-24 years population with completed secondary school –
with high school a total population of 20- 24 years);
f. the level of taxation - in countries with a high level of taxation, the business
agents will find solutions either for tax evasion, or for bribing the state officials in
order to establish lower taxes.
The effect variables selected for this study are related to the following data: GDP /
capita (1) foreign investment in GDP (2) (%), unemployment rate, credit rate for
the private sector, the level of taxes collection (as% of GDP).
a. GDP / capita – the corruption generates a money transfer from the state to
various illegal destinations, thus depriving important sectors of the needed amounts
and affecting the living standards of the population;
b. the rate of foreign investment in GDP - the more corrupt a country is, the more it
will be avoided by foreign investors, who are unwilling to expose themselves and
their reputation financially;
c. the unemployment rate – being directly related to the standard of living, the
unemployment rate is a result of a corrupt system based on the diversion of funds
needed for the economy;
d. the crediting rate for the private sector – it is influenced by corruption in two
ways, either by the corrupt system which generates low living standards and
economic development (not a large number of applicants for funding), or the
existing credit institutions (especially the foreign ones) impose international
conditions for financial loans granting and monitoring (which are difficult to fulfill
by the national economic agents or by the population);

Ioan Radu, Monica Sabau, Cleopatra Sendroiu, Stefan Pete
_________________________________________________________________
e. the taxes collection - a corrupt system does not seek a fair collection of taxes,
thus creating a justification for population and small and medium agencies to find
ways of circumventing the law and having a creative and illegal taxes mitigating
for the state.
The motivation for choosing these variables lies in their validity as a result of
factors of influence or the corruption or the underground economy, three of them
being regarded as coercive diplomacy elements [6] [12] [22]. Any macroeconomic
imbalances in direct relationship with the external environment have been
considered as economic sanctions (coercive diplomacy), expressed by the
following indicators: the rate of foreign investment in GDP - if the target country is
sanctioned, the indicator will be low; the open economy (IMP / GDP); the private
sector lending rate - a country with economic sanctions will present a restraint of
the financial companies to credit the private sector.
4. MAPPING EU-CORRUPTION AND ECONOMIC SANCTIONS
CORRELATIONS
For a better and detailed understanding of the degree of corruption in each country,
it is necessary to analyze the causal factors and results of this phenomenon – the
factor analysis, according to which countries will be grouped for subsequent cluster
analysis. The factor analysis also provides the correlation matrix between
variables, thus meeting the need for information for the developments of certain
indicators and the influence of these developments based on the level of
corruption.
The factors analyzed are those listed above as main causes and indicators: the
access to credit (ACCES_CR), the open economy (IMP_GDP), the Democracy
Index (DEMO), the business feature index (FACIL_BUS), the education (EDU),
the level of taxation (R_TAX), the GDP / capita (GDP_CAP), the rate of foreign
investment in GDP (R_FOR_INVEST), the unemployment rate(R_UNEMPL), the
private sector lending rate (R_CREDIT), the collection of taxes (R_C_TAX).
Principal component analysis is performed using IBM-SPSS-Statistics19.0.0, as
shown in Figure 1 and according to standard Principal component analysis’
formula (1):
pjpijiijiij xwxwxwy .....221 (1)
The weights obtained W are deployed based on the maximized variance of y1, y2,
Var (y1), Var (y2), subject to he constraint that the covariance between yi and yj is
zero. The weights matrix is determined from the variance-covariance matrix using
formula (2) :
1
)()(1
n
xxxx
sjjk
n
k
iik
ij (2)
Coercive Economic Diplomacy – Corruption Trigger or Deterrent
_______________________________________________________________
Figure 1. Principal component analysis using SPSS - screenshot
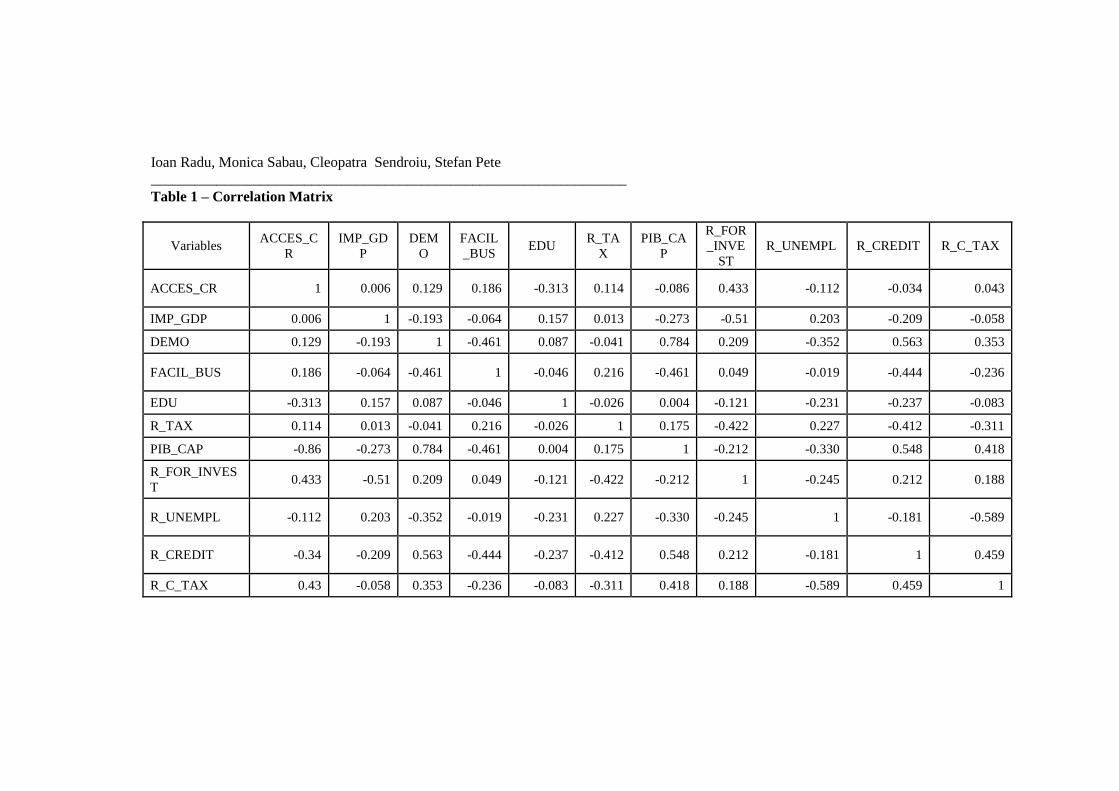
The analysis of all the correlation matrix of all 11 variables considered in Table 1
allows extracting a first set of information on the causal factors and results of the
level of corruption. We can notice that the variable R_UNEMPL (unemployment
rate) is negatively correlated with the access to credit, the degree of democracy, the
business facility, the education, the GDP / capita lending rate and the rate of tax
collection, is directly and positively related to the openness of the economy and the
level of taxation in a country. The R_C_Tax variable rate (tax collection) is
positively related to the access to credit, the democracy index, the GDP / capita
foreign investment rate and the lending rate, and there are negative correlations in
the unemployment rate, the rate of economic openness , the business facility index
and the rate of taxation. Bartlett sphericity test results reject the null hypothesis
(the correlation matrix of the variables is an identity matrix), and the Kaiser-
Meyer-Olkin (KMO) test results are greater than the minimum of 0.05, thus
showing that the method chosen is appropriate.
Varimax rotation method is used for interpretation of the rotated factors, according
formula (3):
k
j
p
i
p
i
ijij
p
bpbp
Q1
1 1
24
1 (3)
Ioan Radu, Monica Sabau, Cleopatra Sendroiu, Stefan Pete
_________________________________________________________________
Table 1 – Correlation Matrix
Variables ACCES_C
R
IMP_GD
P
DEM
O
FACIL
_BUS EDU
R_TA
X
PIB_CA
P
R_FOR
_INVE
ST
R_UNEMPL R_CREDIT R_C_TAX
ACCES_CR 1 0.006 0.129 0.186 -0.313 0.114 -0.086 0.433 -0.112 -0.034 0.043
IMP_GDP 0.006 1 -0.193 -0.064 0.157 0.013 -0.273 -0.51 0.203 -0.209 -0.058
DEMO 0.129 -0.193 1 -0.461 0.087 -0.041 0.784 0.209 -0.352 0.563 0.353
FACIL_BUS 0.186 -0.064 -0.461 1 -0.046 0.216 -0.461 0.049 -0.019 -0.444 -0.236
EDU -0.313 0.157 0.087 -0.046 1 -0.026 0.004 -0.121 -0.231 -0.237 -0.083
R_TAX 0.114 0.013 -0.041 0.216 -0.026 1 0.175 -0.422 0.227 -0.412 -0.311
PIB_CAP -0.86 -0.273 0.784 -0.461 0.004 0.175 1 -0.212 -0.330 0.548 0.418
R_FOR_INVES
T 0.433 -0.51 0.209 0.049 -0.121 -0.422 -0.212 1 -0.245 0.212 0.188
R_UNEMPL -0.112 0.203 -0.352 -0.019 -0.231 0.227 -0.330 -0.245 1 -0.181 -0.589
R_CREDIT -0.34 -0.209 0.563 -0.444 -0.237 -0.412 0.548 0.212 -0.181 1 0.459
R_C_TAX 0.43 -0.058 0.353 -0.236 -0.083 -0.311 0.418 0.188 -0.589 0.459 1
Coercive Economic Diplomacy – Corruption Trigger or Deterrent
_______________________________________________________________
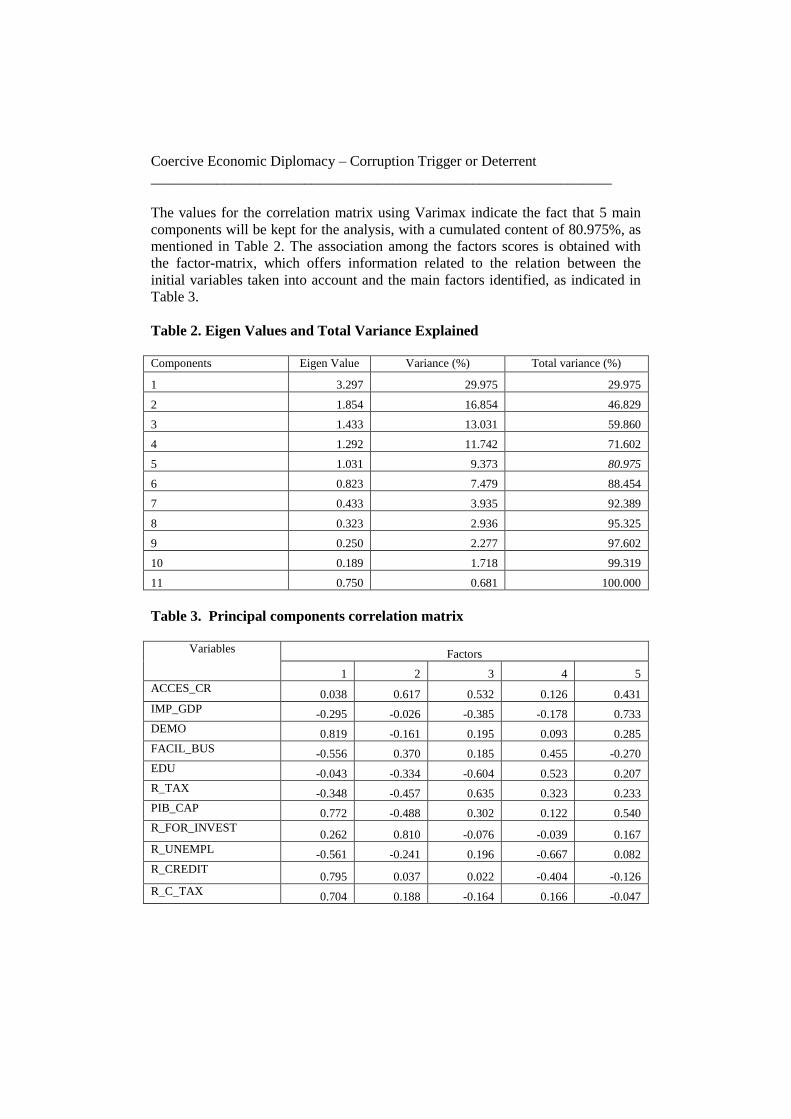
The values for the correlation matrix using Varimax indicate the fact that 5 main
components will be kept for the analysis, with a cumulated content of 80.975%, as
mentioned in Table 2. The association among the factors scores is obtained with
the factor-matrix, which offers information related to the relation between the
initial variables taken into account and the main factors identified, as indicated in
Table 3.
Table 2. Eigen Values and Total Variance Explained
Components Eigen Value Variance (%) Total variance (%)
1 3.297 29.975 29.975
2 1.854 16.854 46.829
3 1.433 13.031 59.860
4 1.292 11.742 71.602
5 1.031 9.373 80.975
6 0.823 7.479 88.454
7 0.433 3.935 92.389
8 0.323 2.936 95.325
9 0.250 2.277 97.602
10 0.189 1.718 99.319
11 0.750 0.681 100.000
Table 3. Principal components correlation matrix
Variables Factors
1 2 3 4 5
ACCES_CR 0.038 0.617 0.532 0.126 0.431
IMP_GDP -0.295 -0.026 -0.385 -0.178 0.733
DEMO 0.819 -0.161 0.195 0.093 0.285
FACIL_BUS -0.556 0.370 0.185 0.455 -0.270
EDU -0.043 -0.334 -0.604 0.523 0.207
R_TAX -0.348 -0.457 0.635 0.323 0.233
PIB_CAP 0.772 -0.488 0.302 0.122 0.540
R_FOR_INVEST 0.262 0.810 -0.076 -0.039 0.167
R_UNEMPL -0.561 -0.241 0.196 -0.667 0.082
R_CREDIT 0.795 0.037 0.022 -0.404 -0.126
R_C_TAX 0.704 0.188 -0.164 0.166 -0.047
Ioan Radu, Monica Sabau, Cleopatra Sendroiu, Stefan Pete
_________________________________________________________________
The 5 factors identified are being correlated with the initial variables taken into
consideration for the analysis of the corruption level, as cause and result, and can
be explained such as:
Factor 1 – named the level of civic and fiscal education is correlated in a strongly
positive way with the taxes collection rate, with the credit rate, with the democracy
rate, with the GDP/capita and in a negative way with the taxation rate and the
population education level.
Factor 2 – named as collecting and owning of operations by foreign capital, is
correlated in a positive way with the credit access and the foreign investments rate
and in a negative way with the population education level and the GDP/capita.
Factor 3 –named taxation versus poor taxes collecting, is correlated in a positive
way with the access to credits and the level of taxation and in a negative way with
the economy openness level, the population education level and the taxes collection
level.
Factor 4 – named national entrepreneurship, is correlated in a positive way with
the business facilitation index, the credit access, as incentive measures, with the
national population education level and in a negative way with the foreign
investments rate, the economy openness level and the unemployment rate.
Factor 5 –named strongly bureaucratic economic openness, has positive
correlations with the economy openness and the credit access, with GDP/capita,
and negative correlations with the business facilitation index (as an index of
operations bureaucracy).
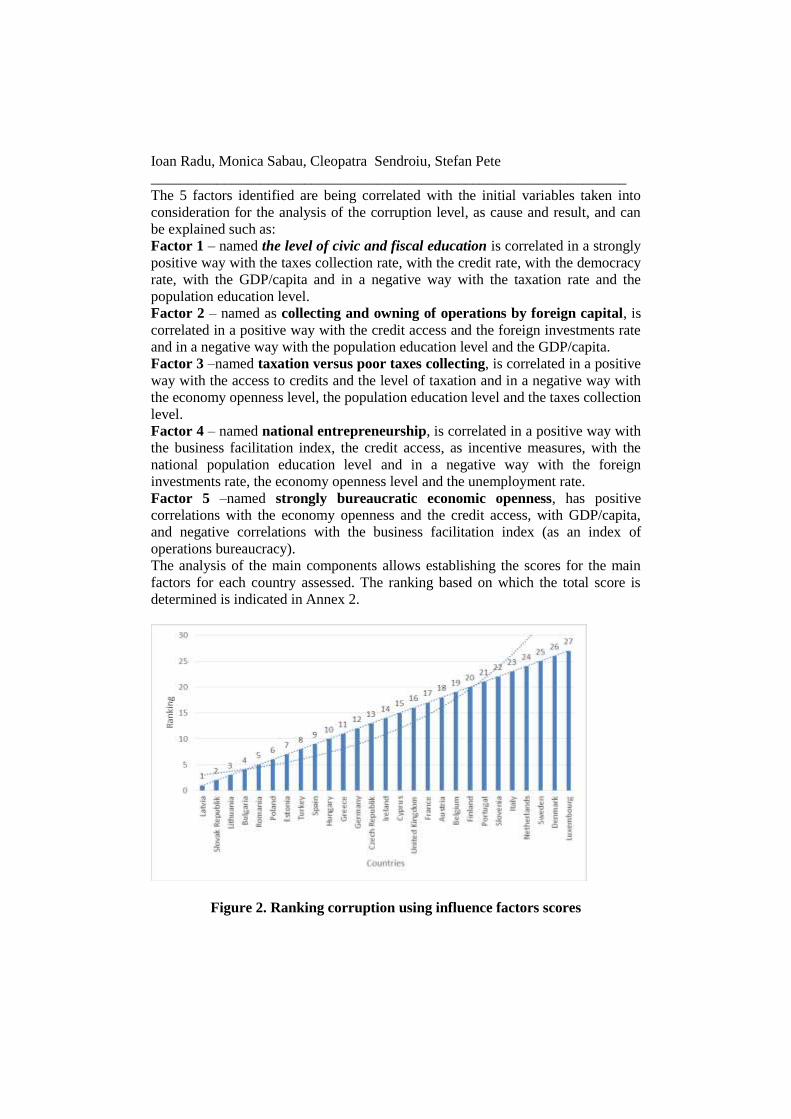
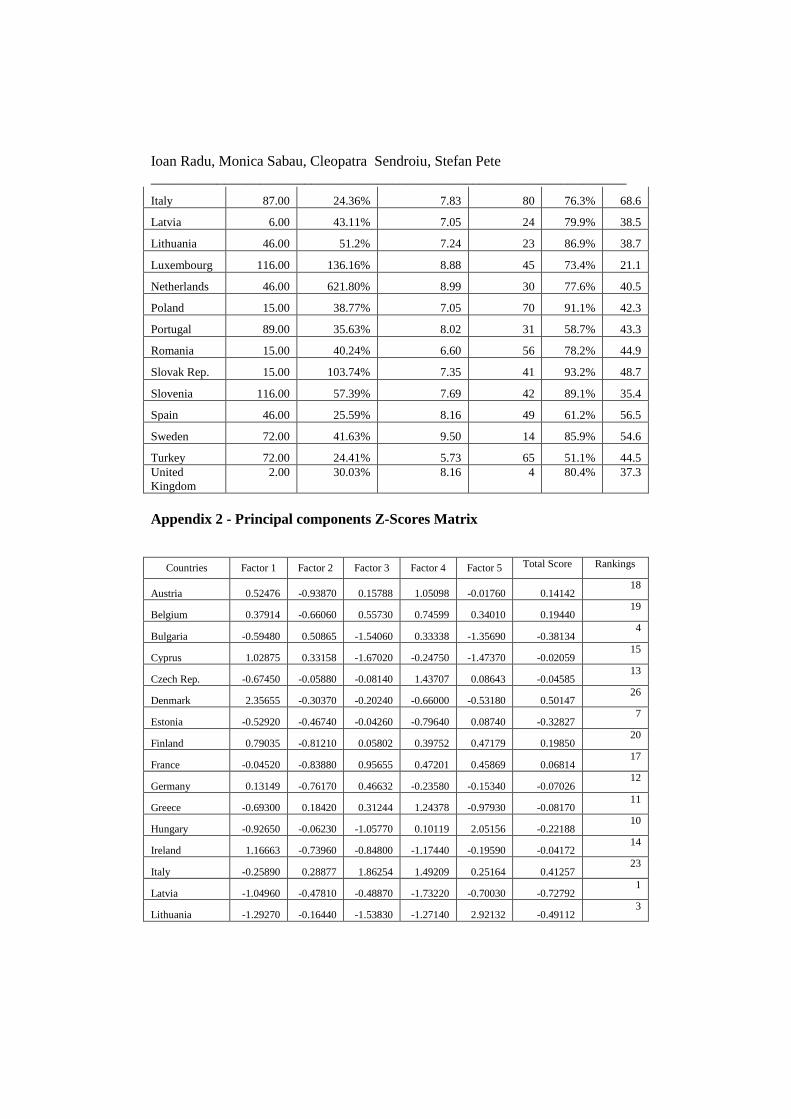
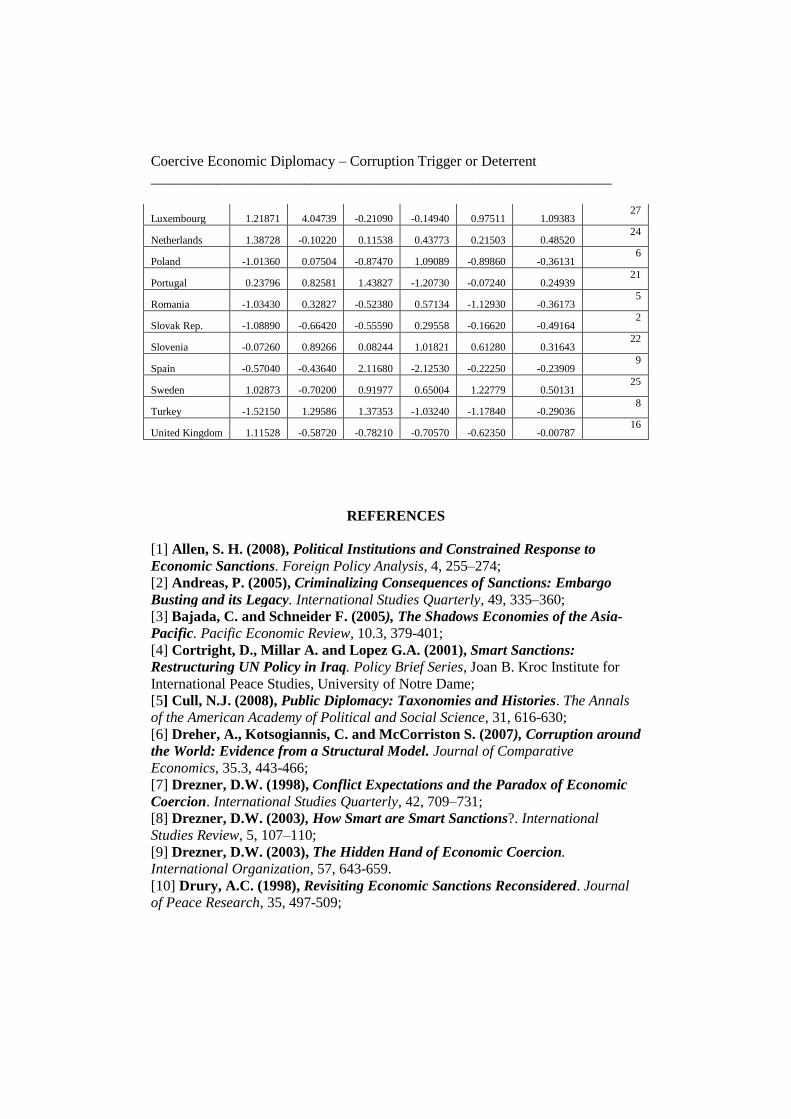
The analysis of the main components allows establishing the scores for the main
factors for each country assessed. The ranking based on which the total score is
determined is indicated in Annex 2.
Figure 2. Ranking corruption using influence factors scores
Coercive Economic Diplomacy – Corruption Trigger or Deterrent
_______________________________________________________________
From Figure 2, we notice that Romania has the 5th position, based on the main
factors or the corruption level, correlated with coercive diplomacy elements and
also taking into consideration the main trends for the group with countries such as:
Bulgaria, Slovakia, Turkey, Estonia. The group is the same even if independent
rankings are being done, based on each type of factor.
Applying the data mining techniques (eng. Data mining) in order to obtain
homogeneous classes for the objects analyzed (27 countries) was achieved using
the K-means clustering. K-means clustering method uses non-hierarchical
algorithms in order to divide various n observations into k homogeneous classes.
To obtain homogeneous classes, five main factors have been taken into account in
the analysis and the principal component used as a method of determining the level
of similarities between countries was the Euclidean distance.
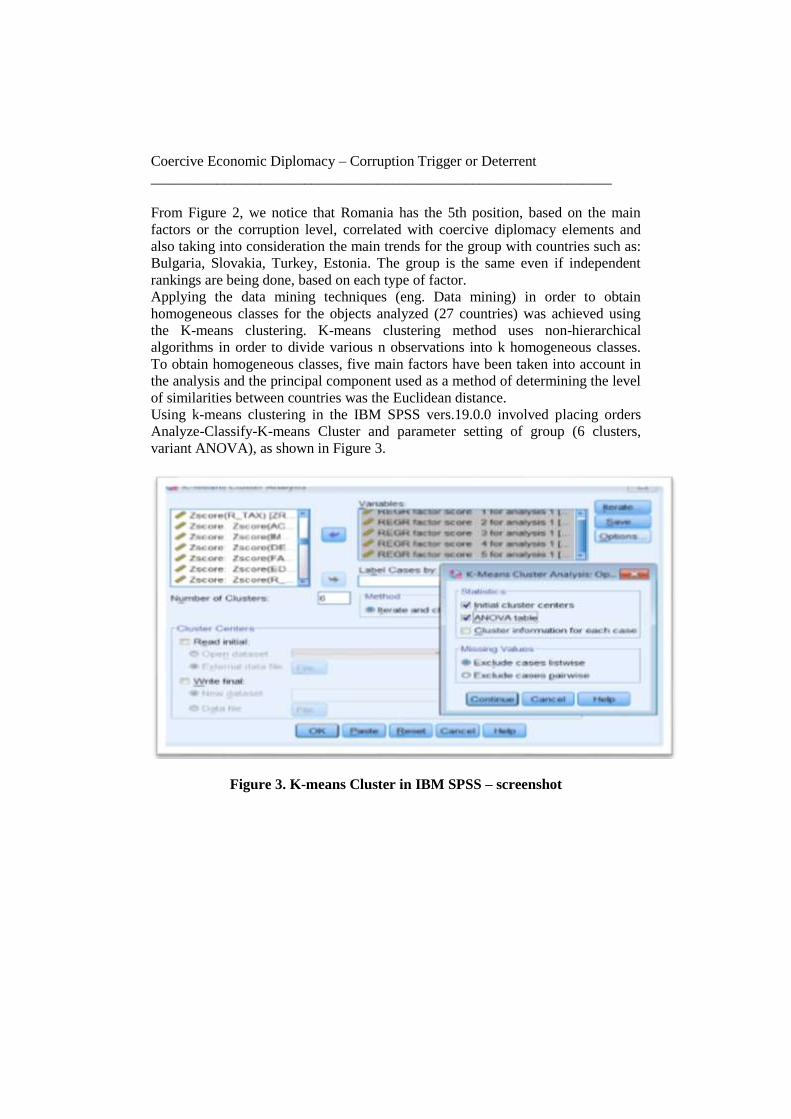
Using k-means clustering in the IBM SPSS vers.19.0.0 involved placing orders
Analyze-Classify-K-means Cluster and parameter setting of group (6 clusters,
variant ANOVA), as shown in Figure 3.
Figure 3. K-means Cluster in IBM SPSS – screenshot

Ioan Radu, Monica Sabau, Cleopatra Sendroiu, Stefan Pete
_________________________________________________________________
Figure 4. Cluster objects using K-means algorithm
Table 4. Final centroid-based clusters
Factors Clusters
1 2 3 4 5 6
REGR factor score 1 1.21871 -0.88506 -1.10962 1.41680 0.22706 -0.61798
REGR factor score 2 4.04739 -0.11630 -0.11332 -0.32474 -0.31902 0.56175
REGR factor score 3 -0.21087 -0.67104 -1.29802 -0.87565 0.49156 1.64286
REGR factor score 4 -0.14941 -0.03957 -0.58510 -0.69691 0.79179 -1.45499
REGR factor score 5 0.97511 -0.69397 2.48644 -0.70621 0.22854 -0.49109
The complete interpretation of Figure 4 and of the final centroid based clusters
from table 4 indicates as a strong positive average for the elements from cluster 1,
factor 2, the owning of the operations by the foreign capital; since Luxembourg is
not a country very much focused on its own industry, this fact generates the
external big openness and the existence of the major economic players on the
market for the most part of capitals.
The 2nd Cluster represents a negative average of Factor 1, since certain countries,
such as Romania, Bulgaria, Estonia, Latvia, Poland, Slovakia have a low level of
fiscal and civic education, which the corruption risk, generating this way a
reduction of taxes collection rate, of the GPD/capita and an increase of the
unemployment rate and the taxation level (measure taken in order to maintain the
budget balance). These observations are validated also by the negative influence of
factor 3, taxation versus tax collection. Also, the average influence of 5th Factor
indicates a strong bureaucracy and a reduction of the business facilitation index,
even though there are legal stipulations in this regard.
The 3rd Cluster reflects a negative average of 3rd Factor, taxation versus low taxes
collection, since Hungary and Lithuania have such a high tax level on a market
with a relative small openness and a low taxes collection level.
Coercive Economic Diplomacy – Corruption Trigger or Deterrent
_______________________________________________________________
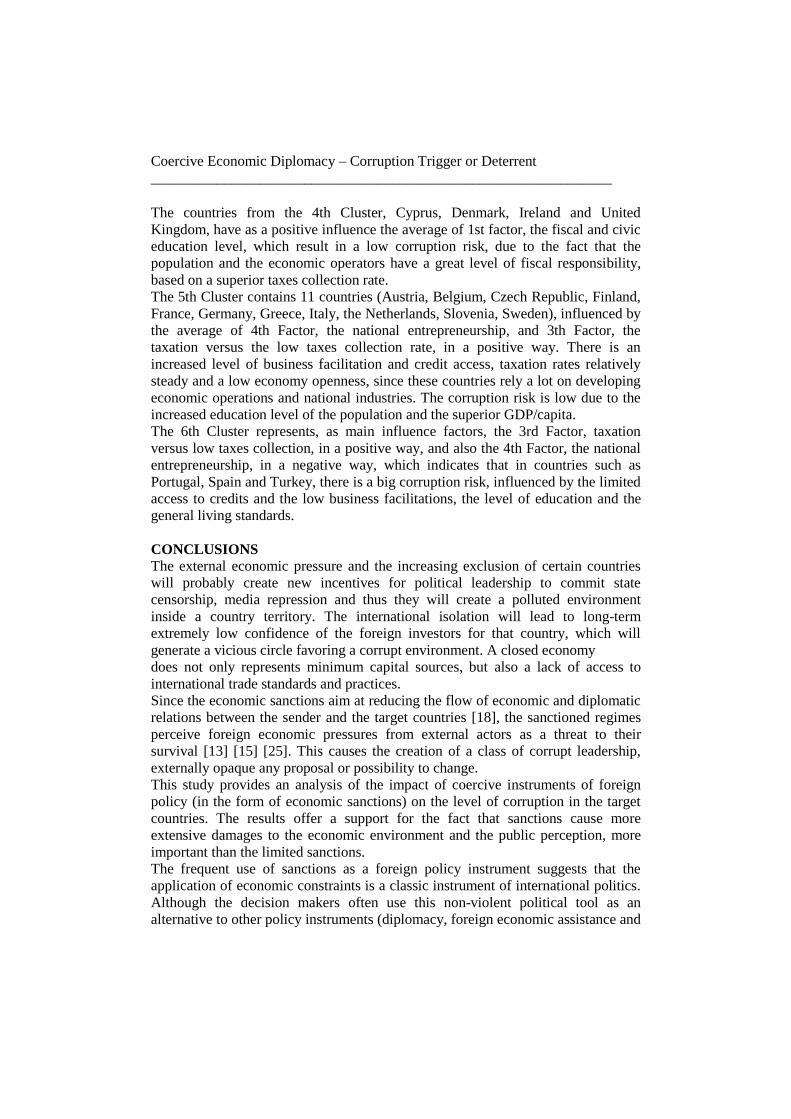
The countries from the 4th Cluster, Cyprus, Denmark, Ireland and United
Kingdom, have as a positive influence the average of 1st factor, the fiscal and civic
education level, which result in a low corruption risk, due to the fact that the
population and the economic operators have a great level of fiscal responsibility,
based on a superior taxes collection rate.
The 5th Cluster contains 11 countries (Austria, Belgium, Czech Republic, Finland,
France, Germany, Greece, Italy, the Netherlands, Slovenia, Sweden), influenced by
the average of 4th Factor, the national entrepreneurship, and 3th Factor, the
taxation versus the low taxes collection rate, in a positive way. There is an
increased level of business facilitation and credit access, taxation rates relatively
steady and a low economy openness, since these countries rely a lot on developing
economic operations and national industries. The corruption risk is low due to the
increased education level of the population and the superior GDP/capita.
The 6th Cluster represents, as main influence factors, the 3rd Factor, taxation
versus low taxes collection, in a positive way, and also the 4th Factor, the national
entrepreneurship, in a negative way, which indicates that in countries such as
Portugal, Spain and Turkey, there is a big corruption risk, influenced by the limited
access to credits and the low business facilitations, the level of education and the
general living standards.
CONCLUSIONS
The external economic pressure and the increasing exclusion of certain countries
will probably create new incentives for political leadership to commit state
censorship, media repression and thus they will create a polluted environment
inside a country territory. The international isolation will lead to long-term
extremely low confidence of the foreign investors for that country, which will
generate a vicious circle favoring a corrupt environment. A closed economy
does not only represents minimum capital sources, but also a lack of access to
international trade standards and practices.
Since the economic sanctions aim at reducing the flow of economic and diplomatic
relations between the sender and the target countries [18], the sanctioned regimes
perceive foreign economic pressures from external actors as a threat to their
survival [13] [15] [25]. This causes the creation of a class of corrupt leadership,
externally opaque any proposal or possibility to change.
This study provides an analysis of the impact of coercive instruments of foreign
policy (in the form of economic sanctions) on the level of corruption in the target
countries. The results offer a support for the fact that sanctions cause more
extensive damages to the economic environment and the public perception, more
important than the limited sanctions.
The frequent use of sanctions as a foreign policy instrument suggests that the
application of economic constraints is a classic instrument of international politics.
Although the decision makers often use this non-violent political tool as an
alternative to other policy instruments (diplomacy, foreign economic assistance and

Ioan Radu, Monica Sabau, Cleopatra Sendroiu, Stefan Pete
_________________________________________________________________
military force), the fact that an economical constraint causes unintended
consequences for the countries concerned remains a certain fact. While the decision
makers are aware of the low success rate and the potential humanitarian
consequences, there have been very few studies showing unwanted political
consequences of economic constraints.
The economic sanctions, especially the sanctions extended throughout the
economy, often hit the target with no or very few discriminatory measures to
reduce their potential impact on ordinary citizens. Therefore, the sanctions
"targeted", such as the freezing of financial assets, reduction or suspension of sales
of military weapons and travel bans for officials, could be better strategies for
decision makers, in order to put a direct pressure on the management target and
reduce costs by constraining the target subjects.
In order to avoid the negative consequences of the coercive economic diplomacy,
the policy makers should consider alternative ways of action in relation to a hostile
regime, such as the commitment through diplomatic communications and
providing economic incentives (external aid and low-interest loans). These
strategies are less likely to determine an isolation of the target country and at the
same time to lead to an infusion of capital. A financially stable company is less
likely to commit acts of corruption, rather than another one at subsistence. Such
policies may also have a success rate higher than the sanctions, meaning that they
could induce a change of behavior / mentality in the countries concerned, by
creating incentives to target leaders which would make them take positive actions
towards the requirements of foreign powers.
Appendix 1 - Original Values for Variables
Countries
GDP/CAP - 2010
USD
FOREIGN
INVESTMEST RATE
% GDP
UNEMPLOYMENT RATE
PRIVATE
SECTOR CREDIT
% GDP
TAX
COLECTION RATE
% GDP
Austria 44,878.55 2.28% 4.80% 126.86% 18.72
Belgium 43,019.27 -8.24% 7.90% 97.92% 24.02
Bulgaria 6,309.85 9.43% 6.80% 75.63% 20.94
Cyprus 30,003.00 23.59% 5.30% 269.59% 25.77
Czech Rep. 18,239.49 1.40% 6.70% 55.26% 13.46
Denmark 55,778.00 1.40% 6.00% 231.62% 34.48
Estonia 13,933.67 0.91% 13.80% 110.19% 17.58
Finland 44,530.80 0.03% 8.20% 94.39% 21.33
France 39,459.55 2.26% 9.50% 110.27% 19.62
Germany 40,541.99 11.70% 7.50% 112.33% 12.04
Greece 26,909.74 0.73% 9.50% 91.69% 19.13

Coercive Economic Diplomacy – Corruption Trigger or Deterrent
_______________________________________________________________
Hungary 13,035.40 2.15% 10.00% 71.34% 23.50
Ireland 45,804.99 11.10% 11.90% 230.31% 20.78
Italy 33,865.92 1.37% 7.80% 110.82% 22.97
Latvia 10,705.08 0.35% 17.10% 107.75% 12.56
Lithuania 10,939.05 0.61% 13.70% 70.85% 13.84
Luxembourg 10,874.00 372.00% 5.20% 186.03% 24.36
Netherlands 47,129.52 4.20% 3.40% 215.28% 22.67
Poland 12,273.72 3.20% 8.20% 52.93% 16.36
Portugal 21,475.70 1.20% 9.60% 187.87% 19.66
Romania 7,534.91 3.91% 6.90% 47.07% 17.88
Slovak Rep. 16,396.87 -0.03% 12.00% 50.00% 12.39
Slovenia 23,128.53 -1.19% 5.90% 93.99% 18.29
Spain 30,451.85 0.44% 18.00% 211.44% 8.54
Sweden 48,754.23 2.84% 8.30% 139.34% 21.53
Turkey 9,712.20 1.36% 12.50% 36.48% 18.91
United Kingdom 36,083.56 3.38% 7.60% 213.52% 25.95
Appendix 1 - Original Values for Variables (2)
Countries CREDIT
ACCESS
FOR
BUSINESS
ECONOMY
OPENESS
(IMPORTS
/GDP)
DEMOCRACY
INDEX
BUSINESS
FACILITY
INDEX
EDU %
TOTAL
POP.
TAX
RATE
Austria 15.00 45.99% 8.49 32 85.6% 55.5
Belgium 46.00 70.22% 8.05 25 82.5% 57
Bulgaria 6.00 55.75% 6.84 51 84.4% 29
Cyprus 5.00 59.75% 7.29 37 86.3% 23.2
Czech Rep. 46.00 63.79% 8.19 63 91.9% 48.8
Denmark 15.00 43.96% 9.52 6 68.3% 29.2
Estonia 32.00 65.23% 7.68 17 83.2% 49.6
Finland 32.00 34.91% 9.19 13 84.2% 44.6
France 46.00 24.99% 7.77 26 82.8% 65.8
Germany 15.00 35.88% 8.38 22 74.4% 48.2
Greece 26.00 29.26% 7.92 109 83.4% 47.2
Hungary 32.00 42.50% 7.21 46 84% 53.3
Ireland 15.00 73.60% 8.79 9 88% 26.5
Ioan Radu, Monica Sabau, Cleopatra Sendroiu, Stefan Pete
_________________________________________________________________
Italy 87.00 24.36% 7.83 80 76.3% 68.6
Latvia 6.00 43.11% 7.05 24 79.9% 38.5
Lithuania 46.00 51.2% 7.24 23 86.9% 38.7
Luxembourg 116.00 136.16% 8.88 45 73.4% 21.1
Netherlands 46.00 621.80% 8.99 30 77.6% 40.5
Poland 15.00 38.77% 7.05 70 91.1% 42.3
Portugal 89.00 35.63% 8.02 31 58.7% 43.3
Romania 15.00 40.24% 6.60 56 78.2% 44.9
Slovak Rep. 15.00 103.74% 7.35 41 93.2% 48.7
Slovenia 116.00 57.39% 7.69 42 89.1% 35.4
Spain 46.00 25.59% 8.16 49 61.2% 56.5
Sweden 72.00 41.63% 9.50 14 85.9% 54.6
Turkey 72.00 24.41% 5.73 65 51.1% 44.5
United
Kingdom
2.00 30.03% 8.16 4 80.4% 37.3
Appendix 2 - Principal components Z-Scores Matrix
Countries Factor 1 Factor 2 Factor 3 Factor 4 Factor 5 Total Score Rankings
Austria 0.52476 -0.93870 0.15788 1.05098 -0.01760 0.14142 18
Belgium 0.37914 -0.66060 0.55730 0.74599 0.34010 0.19440 19
Bulgaria -0.59480 0.50865 -1.54060 0.33338 -1.35690 -0.38134 4
Cyprus 1.02875 0.33158 -1.67020 -0.24750 -1.47370 -0.02059 15
Czech Rep. -0.67450 -0.05880 -0.08140 1.43707 0.08643 -0.04585 13
Denmark 2.35655 -0.30370 -0.20240 -0.66000 -0.53180 0.50147 26
Estonia -0.52920 -0.46740 -0.04260 -0.79640 0.08740 -0.32827 7
Finland 0.79035 -0.81210 0.05802 0.39752 0.47179 0.19850 20
France -0.04520 -0.83880 0.95655 0.47201 0.45869 0.06814 17
Germany 0.13149 -0.76170 0.46632 -0.23580 -0.15340 -0.07026 12
Greece -0.69300 0.18420 0.31244 1.24378 -0.97930 -0.08170 11
Hungary -0.92650 -0.06230 -1.05770 0.10119 2.05156 -0.22188 10
Ireland 1.16663 -0.73960 -0.84800 -1.17440 -0.19590 -0.04172 14
Italy -0.25890 0.28877 1.86254 1.49209 0.25164 0.41257 23
Latvia -1.04960 -0.47810 -0.48870 -1.73220 -0.70030 -0.72792 1
Lithuania -1.29270 -0.16440 -1.53830 -1.27140 2.92132 -0.49112 3
Coercive Economic Diplomacy – Corruption Trigger or Deterrent
_______________________________________________________________
Luxembourg 1.21871 4.04739 -0.21090 -0.14940 0.97511 1.09383 27
Netherlands 1.38728 -0.10220 0.11538 0.43773 0.21503 0.48520 24
Poland -1.01360 0.07504 -0.87470 1.09089 -0.89860 -0.36131 6
Portugal 0.23796 0.82581 1.43827 -1.20730 -0.07240 0.24939 21
Romania -1.03430 0.32827 -0.52380 0.57134 -1.12930 -0.36173 5
Slovak Rep. -1.08890 -0.66420 -0.55590 0.29558 -0.16620 -0.49164 2
Slovenia -0.07260 0.89266 0.08244 1.01821 0.61280 0.31643 22
Spain -0.57040 -0.43640 2.11680 -2.12530 -0.22250 -0.23909 9
Sweden 1.02873 -0.70200 0.91977 0.65004 1.22779 0.50131 25
Turkey -1.52150 1.29586 1.37353 -1.03240 -1.17840 -0.29036 8
United Kingdom 1.11528 -0.58720 -0.78210 -0.70570 -0.62350 -0.00787 16
REFERENCES
[1] Allen, S. H. (2008), Political Institutions and Constrained Response to
Economic Sanctions. Foreign Policy Analysis, 4, 255–274;
[2] Andreas, P. (2005), Criminalizing Consequences of Sanctions: Embargo
Busting and its Legacy. International Studies Quarterly, 49, 335–360;
[3] Bajada, C. and Schneider F. (2005), The Shadows Economies of the Asia-
Pacific. Pacific Economic Review, 10.3, 379-401;
[4] Cortright, D., Millar A. and Lopez G.A. (2001), Smart Sanctions:
Restructuring UN Policy in Iraq. Policy Brief Series, Joan B. Kroc Institute for
International Peace Studies, University of Notre Dame;
[5] Cull, N.J. (2008), Public Diplomacy: Taxonomies and Histories. The Annals
of the American Academy of Political and Social Science, 31, 616-630;
[6] Dreher, A., Kotsogiannis, C. and McCorriston S. (2007), Corruption around
the World: Evidence from a Structural Model. Journal of Comparative
Economics, 35.3, 443-466;
[7] Drezner, D.W. (1998), Conflict Expectations and the Paradox of Economic
Coercion. International Studies Quarterly, 42, 709–731;
[8] Drezner, D.W. (2003), How Smart are Smart Sanctions?. International
Studies Review, 5, 107–110;
[9] Drezner, D.W. (2003), The Hidden Hand of Economic Coercion.
International Organization, 57, 643-659.
[10] Drury, A.C. (1998), Revisiting Economic Sanctions Reconsidered. Journal
of Peace Research, 35, 497-509;

Ioan Radu, Monica Sabau, Cleopatra Sendroiu, Stefan Pete
_________________________________________________________________
[11] Drury, A.C., James, P. and Peksen D. (2014), Neo-Kantianism and
Coercive Diplomacy: The Complex Case of Economic Sanctions. International
Interactions, 40:1, 25-51;
[12] Drury, C.A., Krieckhaus, J. and Lusztig, M. (2006) , Corruption,
Democracy, and Economic Growth. International Political Science Review/Revue
internationale de science politique, 27 (2), 121–136;
[13] Drury, A.C. and Yitan, T. Li. (2006), US Economic Sanctions Threats
against China: Failing to Leverage Better Human Rights. Foreign Policy
Analysis, 2(4), 307-324;
[14] Frey, B.S., Weck-Hannemann, H. (1984), The Hidden Economy as an
“Unobserved” Variable. European Economic Review, 26, 33–53;
[15] Galtung, J. (1967), On the Effects of International Economic Sanctions,
with Examples from the Case of Rhodesia. World Politics, 19.03, 378-416;
[16] Gibbons, E. and Garfield R. (1999), The Impact of Economic Sanctions on
Health and Human Rights in Haiti 1991-1994. American Journal of Public
Health, 10, 1499–1504;
[17] Giles, D.E.A. (1999), Measuring the Hidden Economy: Implications for
Econometric Modelling. The Economic Journal, 109.456, 370-380;
[18] Hufbauer, G.C., Schott, J.J., Elliot, K.A. and Oegg B. (2007),
Economic Sanctions Reconsidered. Peter G. Peterson Institute for International
Economics;
[19] Kirshner, J. (1997), The Micro-foundations of Economic Sanctions.
Security Studies, 6, 32-64;
[20] Kirshner, J. (1997), Currency and Coercion: Political Economy of
International Monetary Power. Princeton University Press;
[21] Kuklys, W. (2004), Measuring Standard of Living in the UK: An
Application of Sen's Functioning Approach Using Structural Equation Models.
Jena: Max-Planck-Inst. for Research into Economic Systems, Strategic Interaction
Group;
[22] Lacy, D., Niou, E.M., Drezner, D., Kydd, A., Oye, K. (2000), A Theory of
Economic Sanctions. Unpublished manuscript, Duke University, Durham, NC;
[23] Loayza, N.V. (1996), The Economics of the Informal Sector: A Simple
Model and some Empirical Evidence from Latin America. Carnegie-Rochester
Conference Series on Public Policy. Vol. 45;
[24] Marinov, N. (2005), Do Economic Sanctions Destabilize Country Leaders?.
American Journal of Political Science, 49, 564–576;
[25] Morgan, T.C. and Schwebach, V.L. (1997), Fools Suffer Gladly: The Use
of Economic Sanctions in International Crises. International Studies Quarterly,
41, 27–50;
[26] Nye, S.J. (2011). The Future of Power. Public Affairs, 153–207;
[27] Pape, R.A. (1998), Why Economic Sanctions Still Do Not
Work. International Security 23:1, 66-77.
[28] Peksen, D. (2009), Better or Worse? The Effect of Economic Sanctions on
Human Rights. Journal of Peace Research, 46, 59-77.
Coercive Economic Diplomacy – Corruption Trigger or Deterrent
_______________________________________________________________
[29] Peksen, D. and Drury, A.C. (2009), Economic Sanctions and Political
Repression: Assessing the Impact of Coercive Diplomacy on Political
Freedoms. Human Rights Review, 10:3, 393-411.;
[30] Schneider, F. and Dell'Anno R. (2003), The Shadow Economy of Italy and
other OECD Countries: What Do we Know?. Journal of public finance and public
choice - Economia delle scelte pubbliche, 21.2, 97-120;
[31] Weiss, T.G. (1999), Sanctions as a Foreign Policy Tool: Weighing
Humanitarian Impulses. Journal of Peace Research, 36, 499-509;
[32] Wood, R.M. (2008), A Hand upon the Throat of the Nation: Economic
Sanctions and State Repression. International Studies Quarterly, 52, 489-513.


