TAU Performance SystemProfiling S3D Harness 2
Acknowledgements
Alan Morris [UO] Kevin Huck [UO] Allen D. Malony [UO] Kenneth Roche [ORNL] Bronis R. de Supinski [LLNL]
TAU Performance SystemProfiling S3D Harness 3
TAU Parallel Performance System
http://www.cs.uoregon.edu/research/tau/ Multi-level performance instrumentation
Multi-language automatic source instrumentation Flexible and configurable performance measurement Widely-ported parallel performance profiling system
Computer system architectures and operating systems Different programming languages and compilers
Support for multiple parallel programming paradigms Multi-threading, message passing, mixed-mode, hybrid
TAU Performance SystemProfiling S3D Harness 4
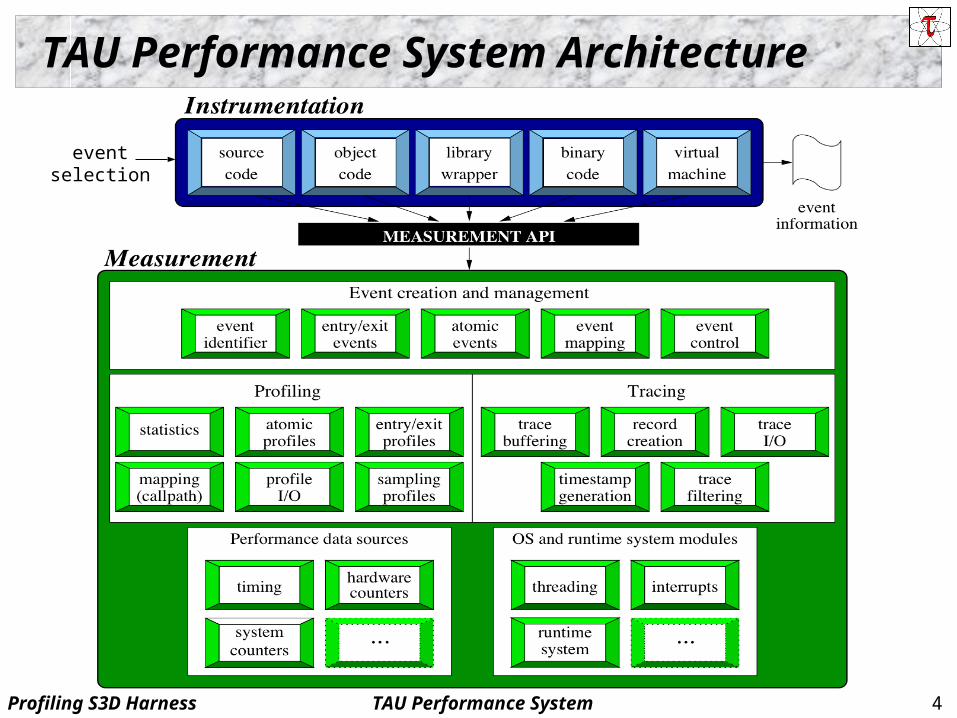
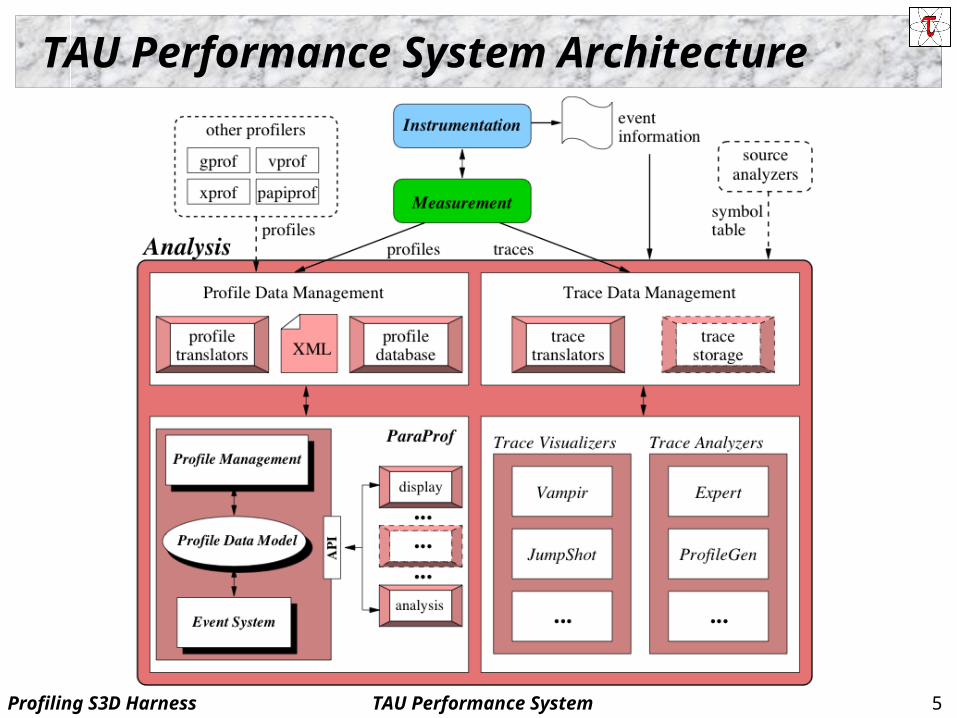
TAU Performance System Architecture
eventselection
TAU Performance SystemProfiling S3D Harness 5
TAU Performance System Architecture
TAU Performance SystemProfiling S3D Harness 6
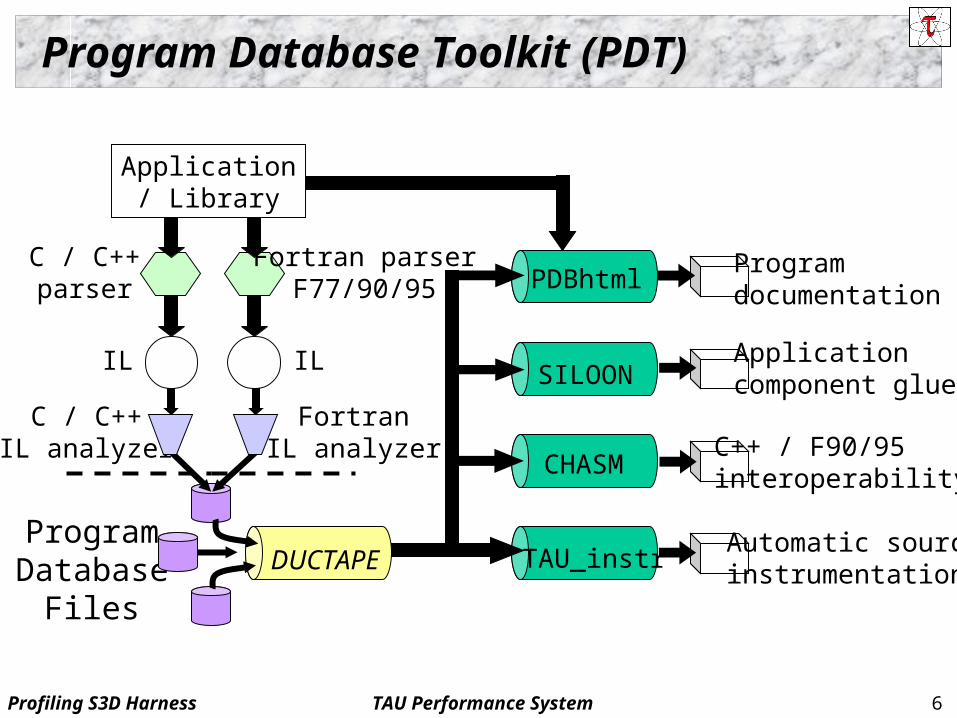
Program Database Toolkit (PDT)
Application/ Library
C / C++parser
Fortran parserF77/90/95
C / C++IL analyzer
FortranIL analyzer
ProgramDatabase
Files
IL IL
DUCTAPE
PDBhtml
SILOON
CHASM
TAU_instr
Programdocumentation
Applicationcomponent glue
C++ / F90/95interoperability
Automatic sourceinstrumentation
TAU Performance SystemProfiling S3D Harness 7
PAPI
Performance Application Programming Interface The purpose of the PAPI project is to design,
standardize and implement a portable and efficient API to access the hardware performance monitor counters found on most modern microprocessors.
Parallel Tools Consortium project Developed by University of Tennessee, Knoxville http://icl.cs.utk.edu/papi/
TAU Performance SystemProfiling S3D Harness 8
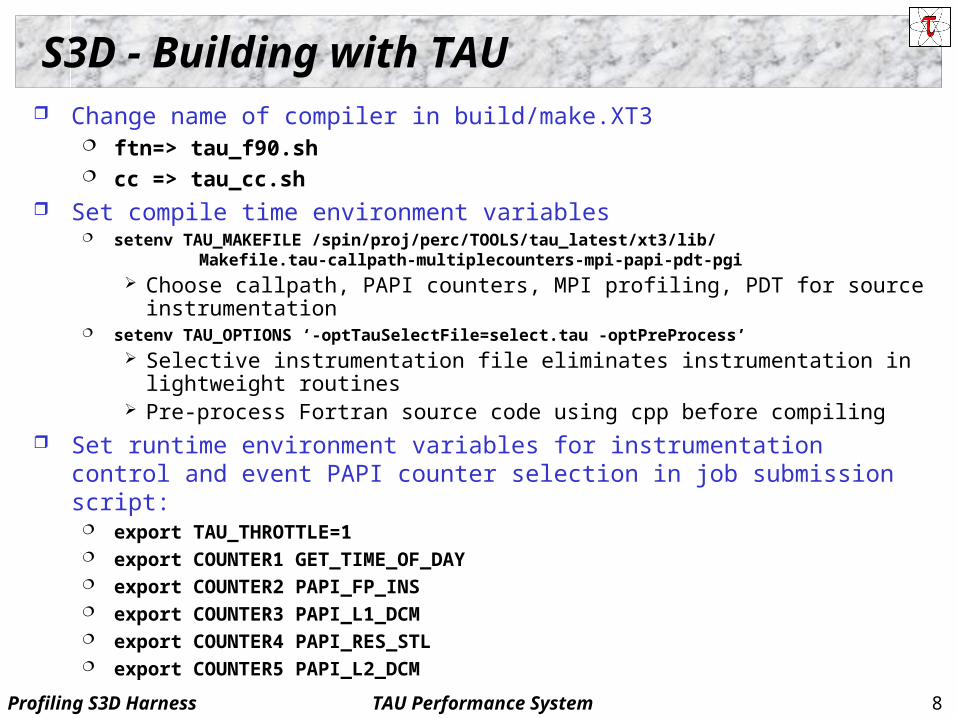
S3D - Building with TAU Change name of compiler in build/make.XT3
ftn=> tau_f90.sh cc => tau_cc.sh
Set compile time environment variables setenv TAU_MAKEFILE /spin/proj/perc/TOOLS/tau_latest/xt3/lib/
Makefile.tau-callpath-multiplecounters-mpi-papi-pdt-pgi Choose callpath, PAPI counters, MPI profiling, PDT for source instrumentation
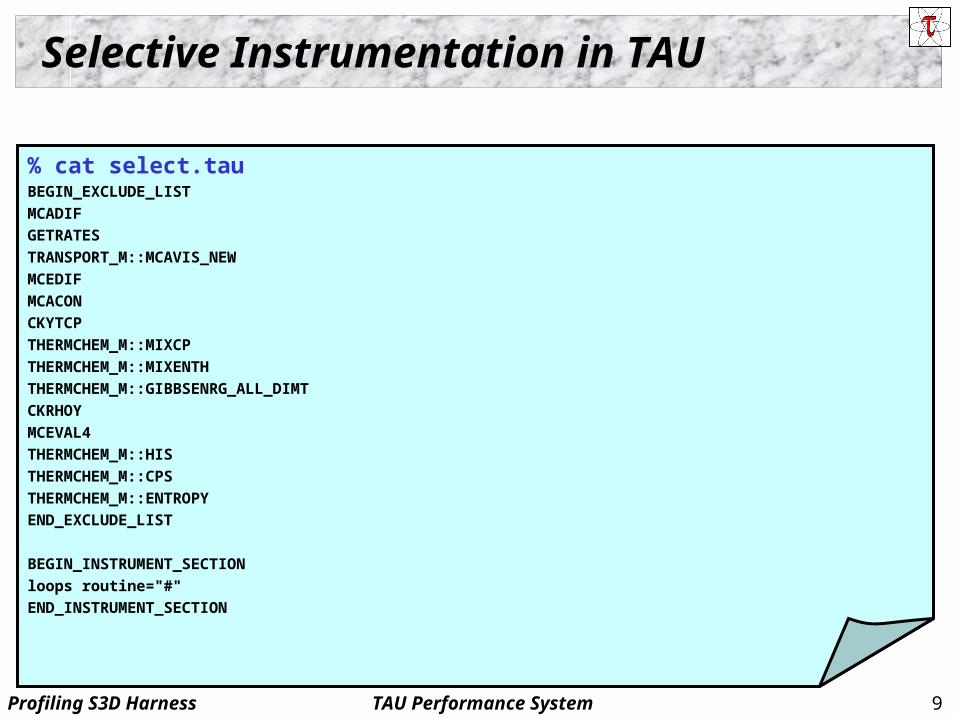
setenv TAU_OPTIONS ‘-optTauSelectFile=select.tau -optPreProcess’ Selective instrumentation file eliminates instrumentation in lightweight routines Pre-process Fortran source code using cpp before compiling
Set runtime environment variables for instrumentation control and event PAPI counter selection in job submission script:
export TAU_THROTTLE=1 export COUNTER1 GET_TIME_OF_DAY export COUNTER2 PAPI_FP_INS export COUNTER3 PAPI_L1_DCM export COUNTER4 PAPI_RES_STL export COUNTER5 PAPI_L2_DCM
TAU Performance SystemProfiling S3D Harness 9
Selective Instrumentation in TAU
% cat select.tauBEGIN_EXCLUDE_LIST
MCADIF
GETRATES
TRANSPORT_M::MCAVIS_NEW
MCEDIF
MCACON
CKYTCP
THERMCHEM_M::MIXCP
THERMCHEM_M::MIXENTH
THERMCHEM_M::GIBBSENRG_ALL_DIMT
CKRHOY
MCEVAL4
THERMCHEM_M::HIS
THERMCHEM_M::CPS
THERMCHEM_M::ENTROPY
END_EXCLUDE_LIST
BEGIN_INSTRUMENT_SECTION
loops routine="#"
END_INSTRUMENT_SECTION
TAU Performance SystemProfiling S3D Harness 10
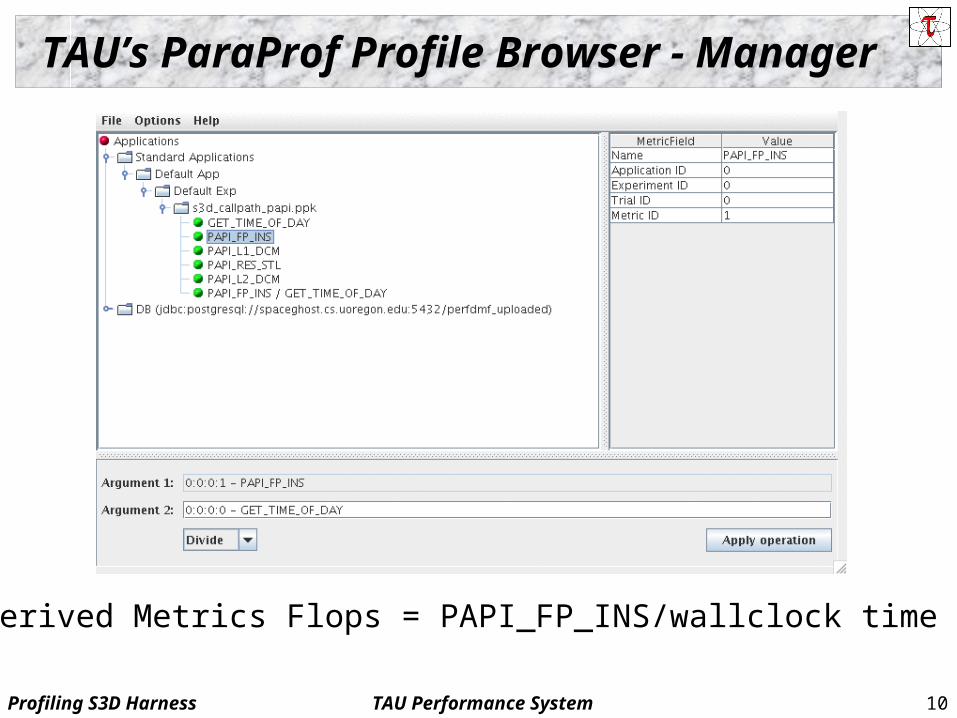
TAU’s ParaProf Profile Browser - Manager
Derived Metrics Flops = PAPI_FP_INS/wallclock time
TAU Performance SystemProfiling S3D Harness 11
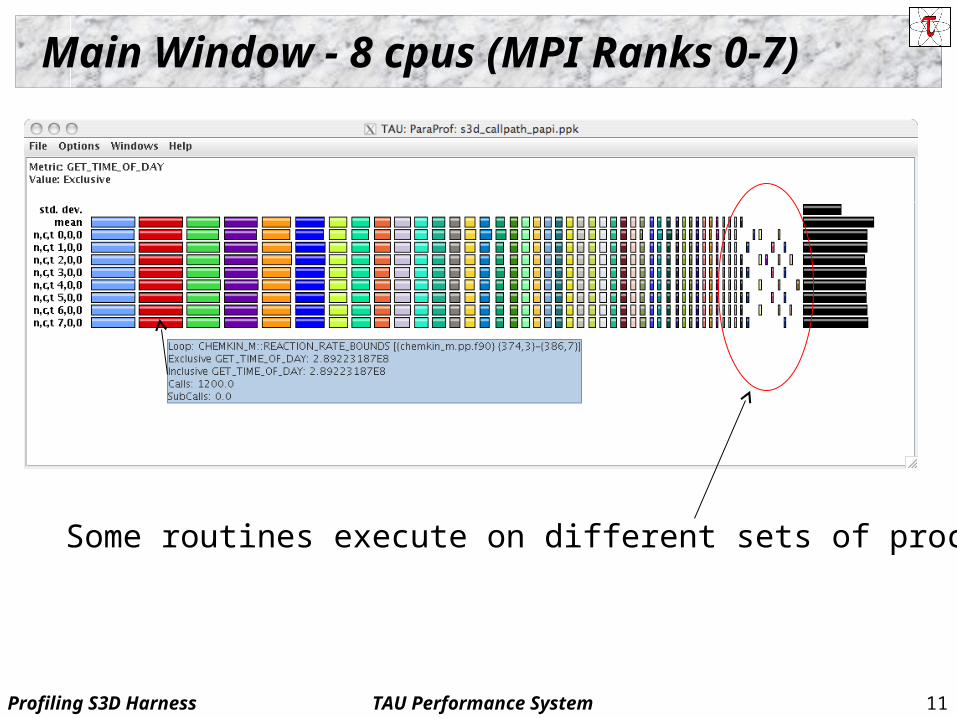
Main Window - 8 cpus (MPI Ranks 0-7)
Some routines execute on different sets of processors
TAU Performance SystemProfiling S3D Harness 12
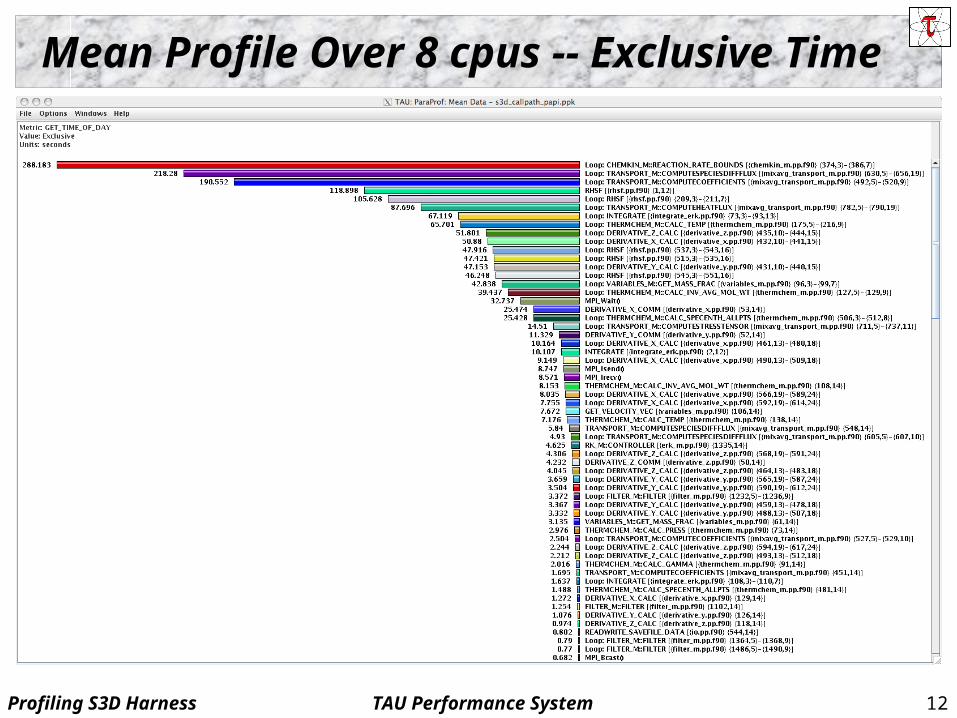
Mean Profile Over 8 cpus -- Exclusive Time
TAU Performance SystemProfiling S3D Harness 13
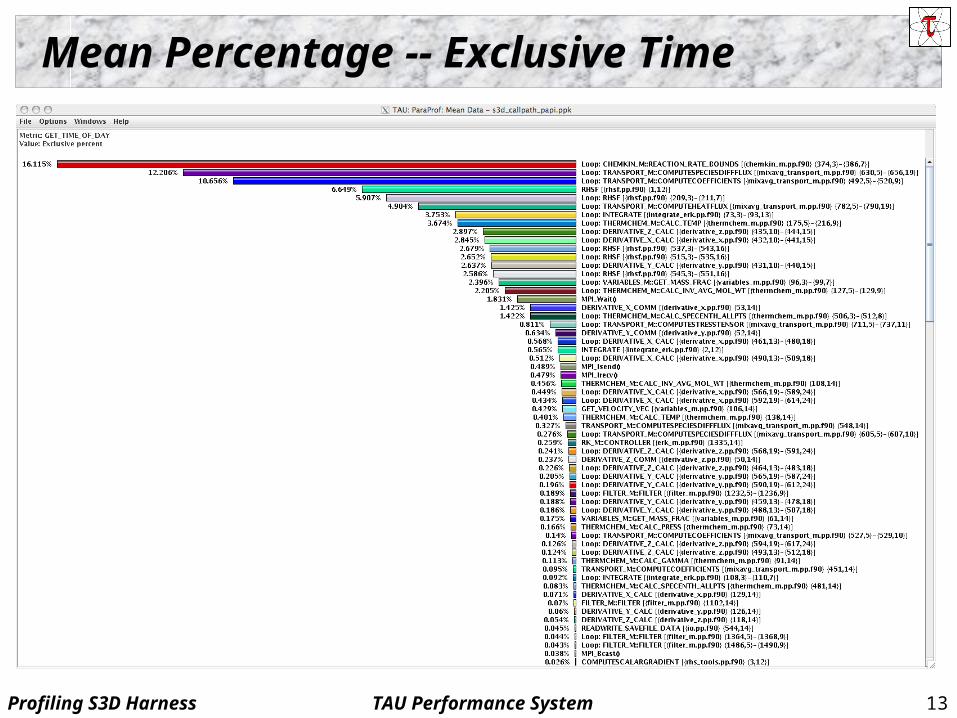
Mean Percentage -- Exclusive Time
TAU Performance SystemProfiling S3D Harness 14
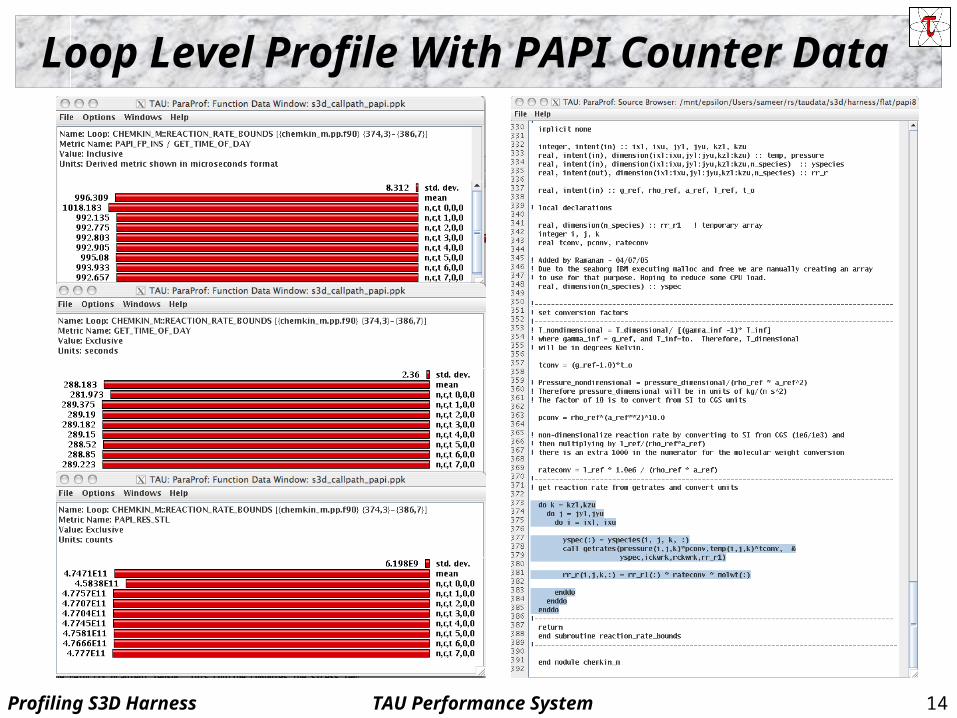
Loop Level Profile With PAPI Counter Data
TAU Performance SystemProfiling S3D Harness 15
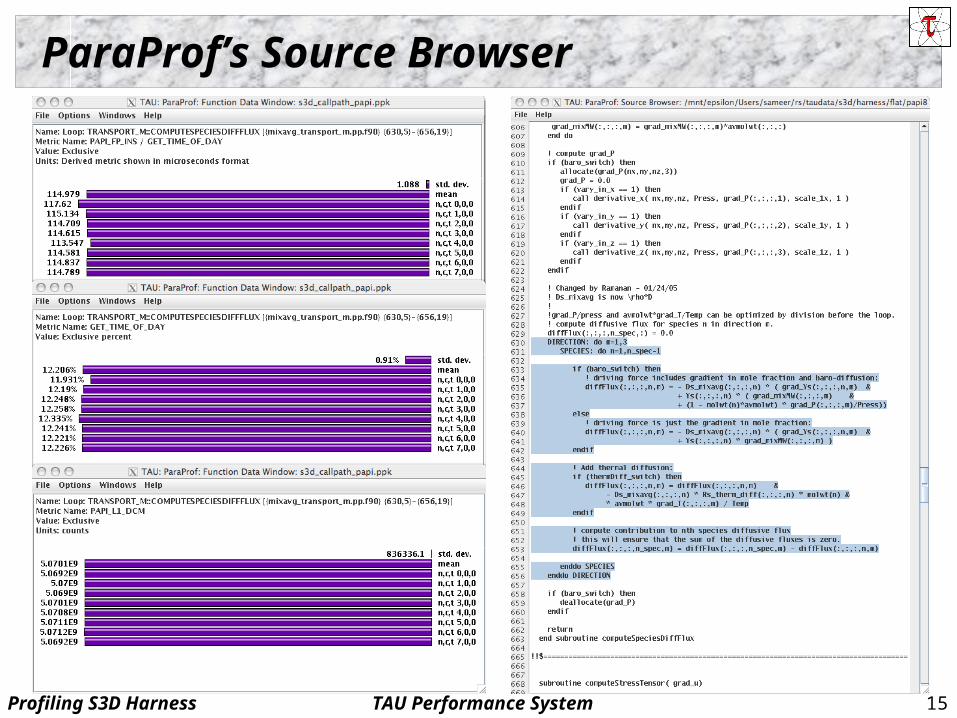
ParaProf’s Source Browser
TAU Performance SystemProfiling S3D Harness 16
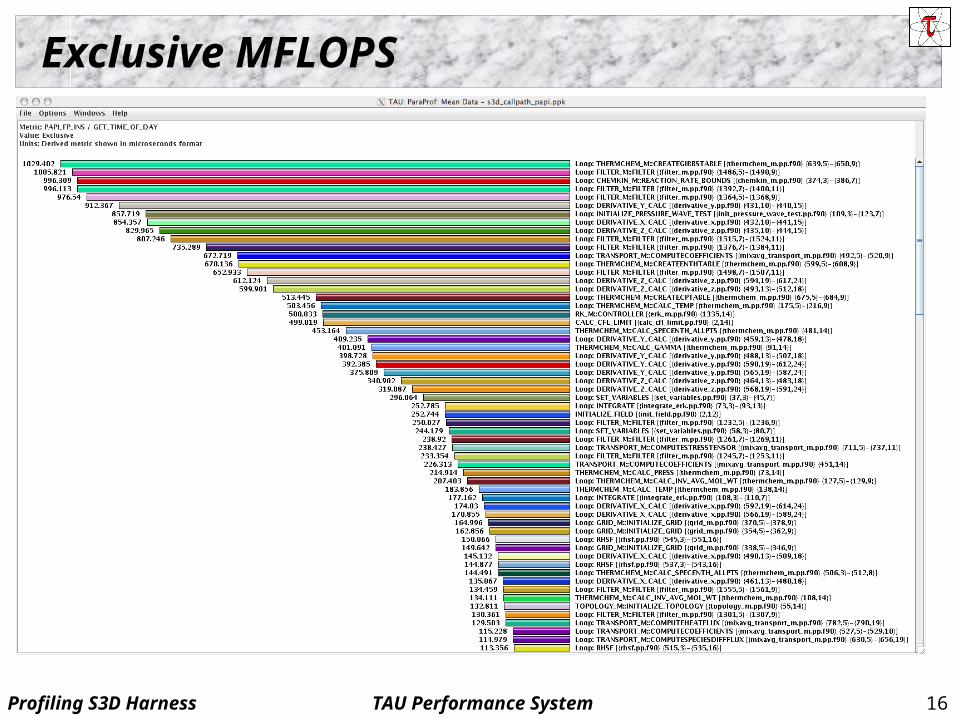
Exclusive MFLOPS
TAU Performance SystemProfiling S3D Harness 17
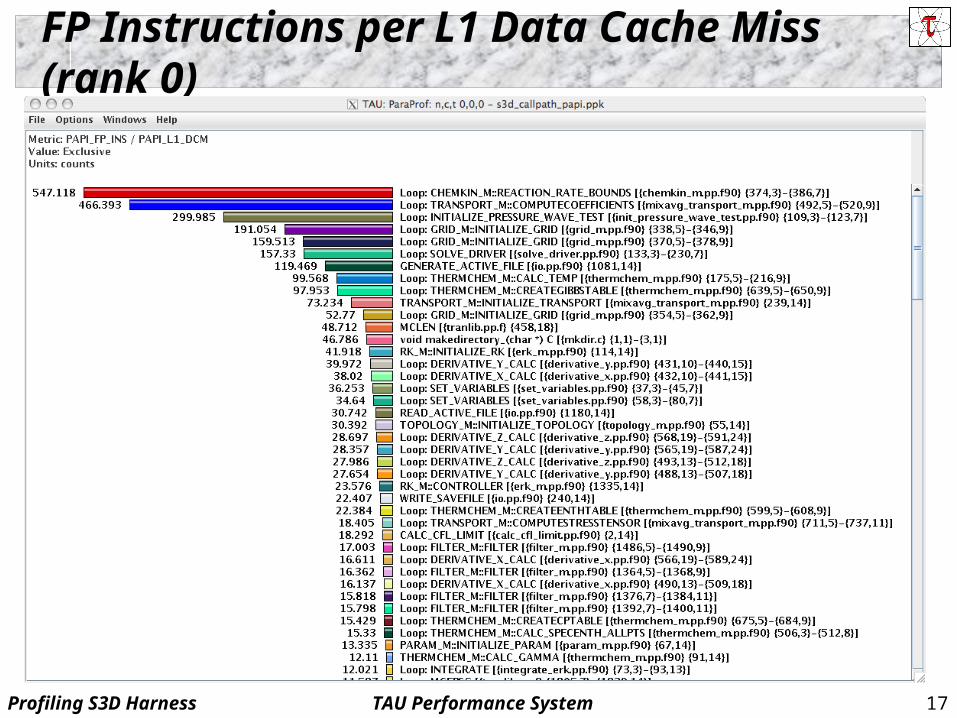
FP Instructions per L1 Data Cache Miss (rank 0)
TAU Performance SystemProfiling S3D Harness 18
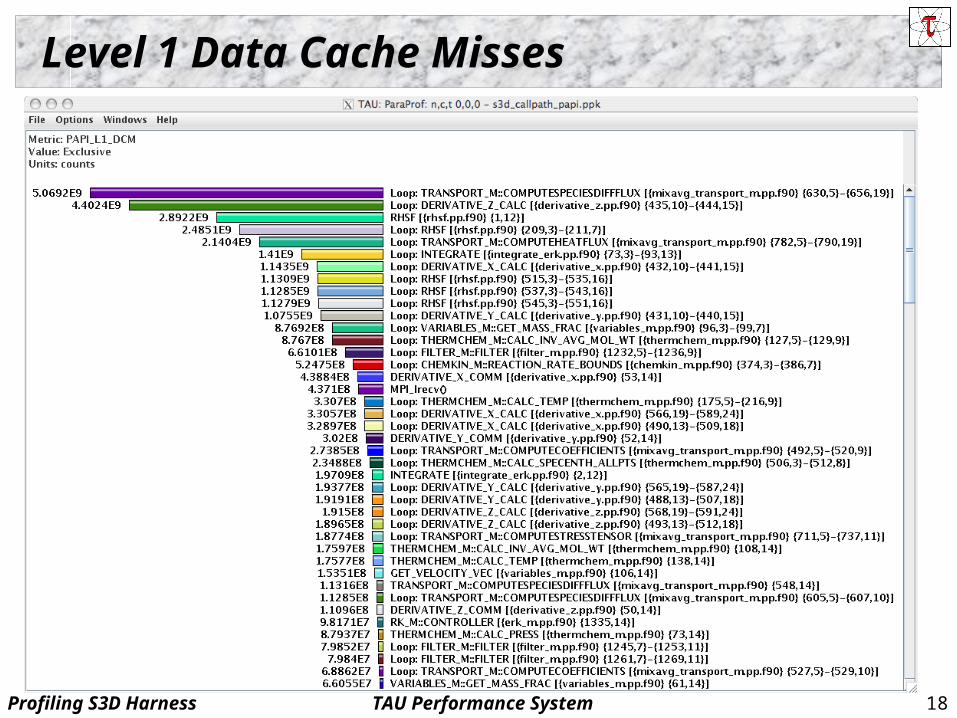
Level 1 Data Cache Misses
TAU Performance SystemProfiling S3D Harness 19
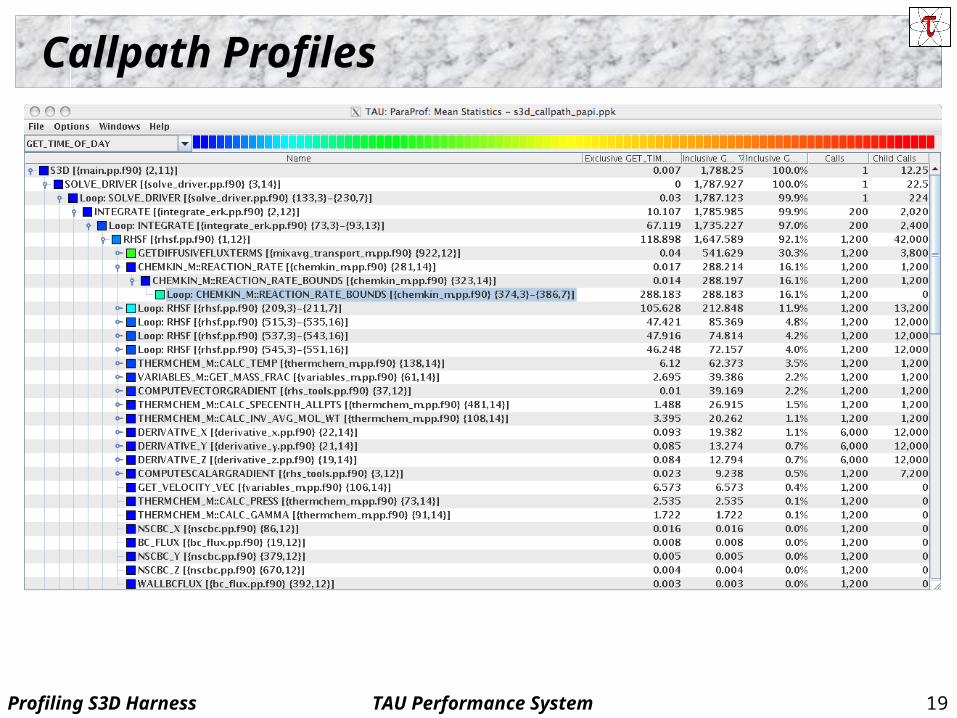
Callpath Profiles
TAU Performance SystemProfiling S3D Harness 20
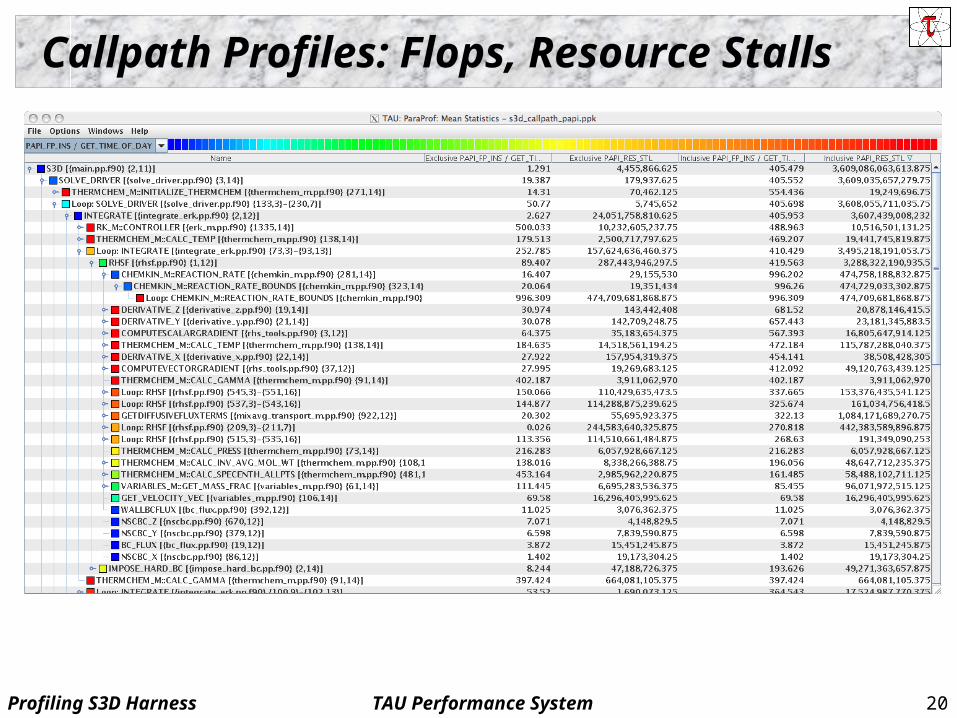
Callpath Profiles: Flops, Resource Stalls
TAU Performance SystemProfiling S3D Harness 21
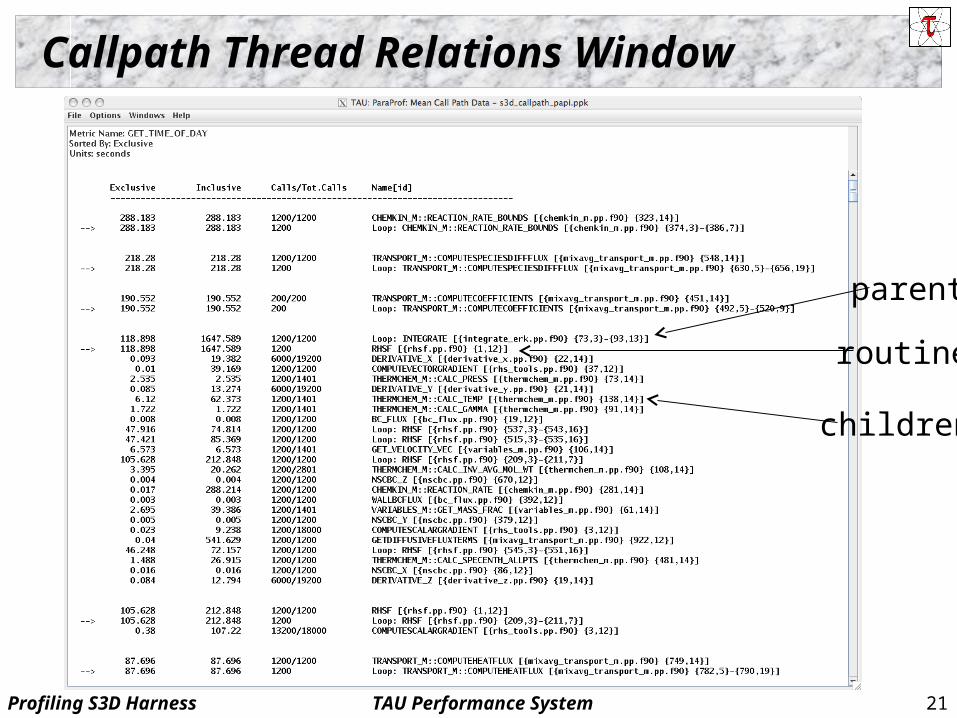
Callpath Thread Relations Window
parent
routine
children
TAU Performance SystemProfiling S3D Harness 22
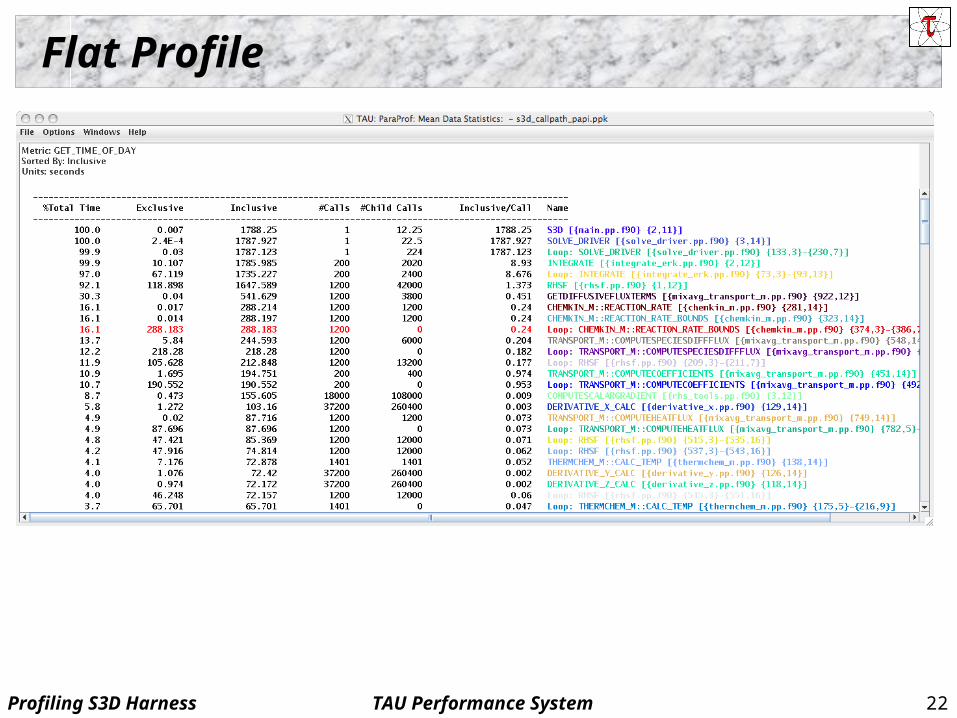
Flat Profile
TAU Performance SystemProfiling S3D Harness 23
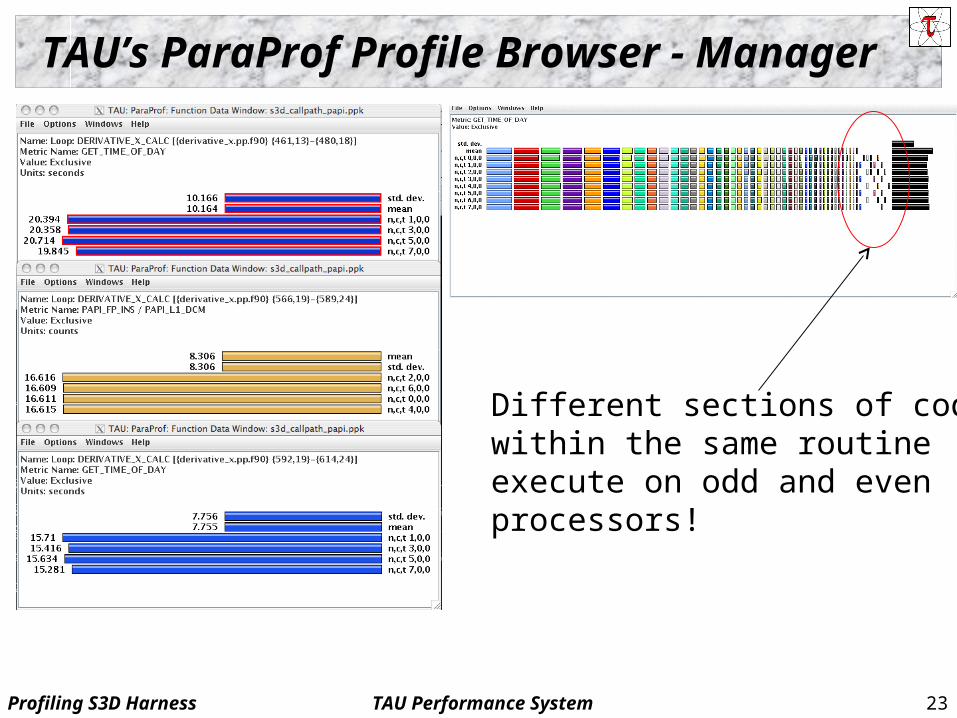
TAU’s ParaProf Profile Browser - Manager
Different sections of codewithin the same routineexecute on odd and even processors!
TAU Performance SystemProfiling S3D Harness 24
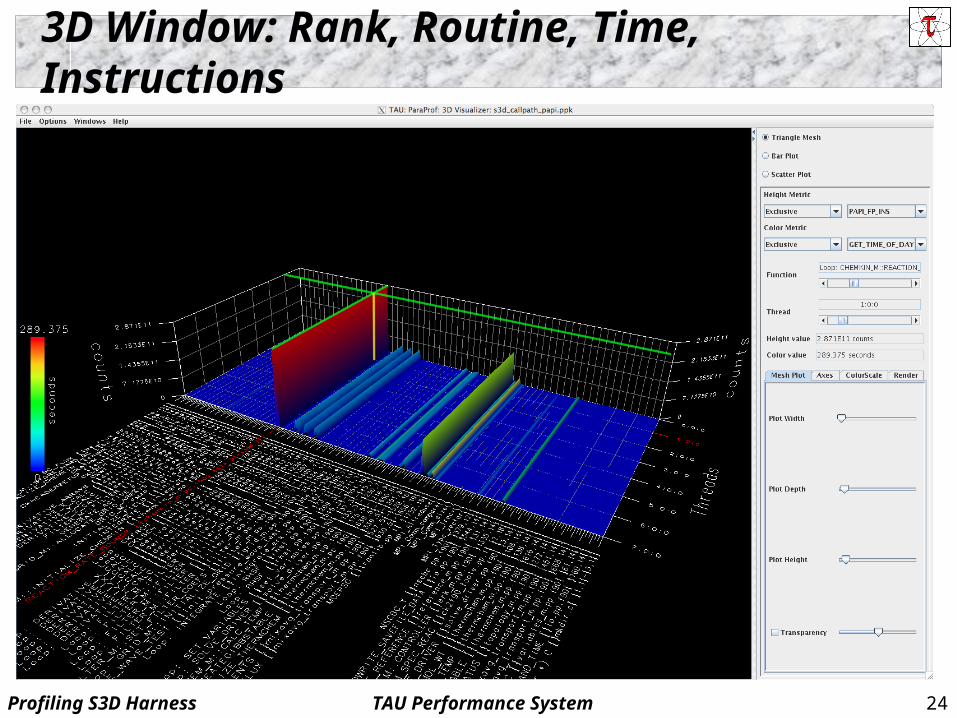
3D Window: Rank, Routine, Time, Instructions
TAU Performance SystemProfiling S3D Harness 25
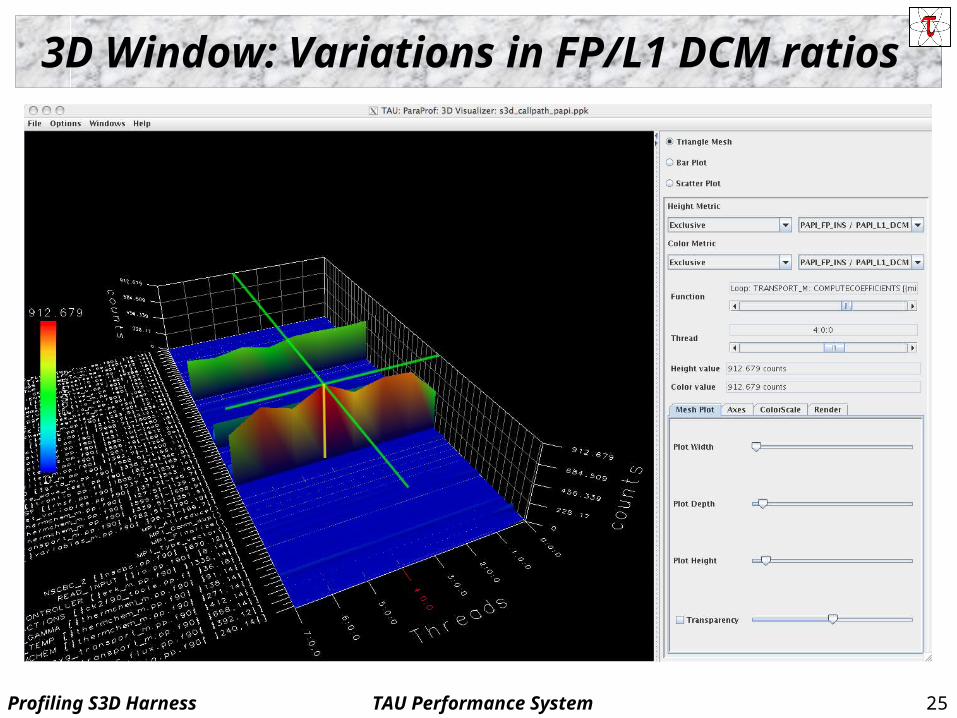
3D Window: Variations in FP/L1 DCM ratios
TAU Performance SystemProfiling S3D Harness 26
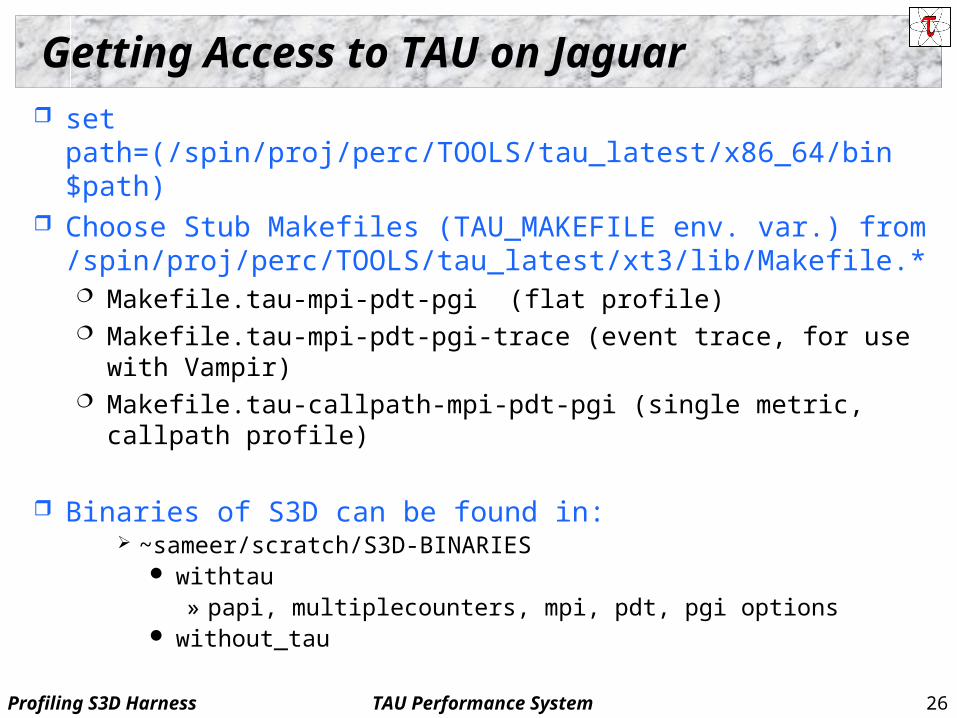
Getting Access to TAU on Jaguar set path=(/spin/proj/perc/TOOLS/tau_latest/x86_64/bin $path) Choose Stub Makefiles (TAU_MAKEFILE env. var.) from
/spin/proj/perc/TOOLS/tau_latest/xt3/lib/Makefile.* Makefile.tau-mpi-pdt-pgi (flat profile) Makefile.tau-mpi-pdt-pgi-trace (event trace, for use with Vampir) Makefile.tau-callpath-mpi-pdt-pgi (single metric, callpath profile)
Binaries of S3D can be found in: ~sameer/scratch/S3D-BINARIES
withtau» papi, multiplecounters, mpi, pdt, pgi options
without_tau


