
Combined David Roy 1, Haiyan Huang 2, Luigi Boschetti 3, Louis Giglio 4, Hankui Zhang 2, Lin Yan 2, Zhongbin Li 2
1 Department of Geography, Environment, & Spatial Sciences and Center for Global Change and Earth Observations, Michigan State University, East Lansing, MI 48824, USA
2 Geospatial Sciences Center of Excellence, South Dakota State University, Brookings, SD 57007, USA
3 Department of Natural Resources and Society, University of Idaho, Moscow, ID 83843, USA
4 Department of Geographical Sciences, University of Maryland, College Park, MD 20740, USA
Progress on Moving Multi-Source Land Imaging of Africa area burned to production
2019 NASA LCLUC Spring Science Team Meeting, Rockville MD, April 9-11 2019

Camp Fire
Woolsey Fire
MODIS satellite imageNovember 9 2018
Deadliest fires in CA history

Fire and Climate
Fire emissions(1015 g C yr-1)
Central and northern South America 0.27
Southern South America 0.80
Northern Africa 0.80Southern Africa 1.02Southeast Asia 0.37
Boreal (north of 38oN) 0.14
Other 0.13
Global 3.53
Wildfires cause ~35% of all global carbon emissions
Inter-annual variability in emissions linked primarily to rainfall variability
Estimated from the MODIS burned area product

MODIS Collection 6 500 m Burned Area Product Stage 3 Global Validation
Locations of 558 Landsat two-date image pairs interpreted into burned, unburned, and unmapped classes
Boschetti, Roy, Giglio, Huang, Humber, Zubkova
Gobal Validation of the Collection 6 MODIS Burned Area Product
RSE, 2019, In Review.

Regression slope 0.815, intercept -0.003 (r2 = 0.82)
Boschetti, Roy, Giglio, Huang, Humber, Zubkova
Gobal Validation of the Collection 6 MODIS Burned Area Product
RSE, 2019, In Review.
MODIS Collection 6 500 m Burned Area Product Stage 3 Global Validation
5km2 cells

Landsat 8, 9, 10
Sentinel 2ASentinel 2B
ESA Sentinel 2A & 2B
New Global moderate resolution era
2020
2027

Global median 10 days Global median 16 days
Average satellite revisit interval (days)
S2 L8
S2 & L8
S2A, S2B, L8
S2A & S2B
Global median 4.5 days Global median 3.7 days
Global median 2.9 days
Li, J. and Roy, D.P. 2017A global analysis of Sentinel-2A,Sentinel-2B and Landsat-8 data revisit intervalsand implications for terrestrial monitoring, Remote Sensing, 9, 902.

Planned Production - all of Africa, including Madagascar, south of the Tropic of Cancer (23.44° N)for 2017 / 2018 / 2019 process on NASA funded AWS
1041 Landsat-8 Collection 1WRS-2 path/rows (UTM)
2829 Sentinel-2 L1C tiles (UTM)
33 MODIS Tiles (sinusoidal)
1255 WELD tiles

[email protected] (GSE/GEOG-741-S01)

5295 x 5295 30m pixels
Sentinel-2
True colorSurfacereflectance
FILOComposite
7 S2 L1C tiles

Sentinel-2
True colorSurfaceNBAR
FILOComposite
7 S2 L1C tiles
5295 x 5295 30m pixels

c =
ρ λ computed from fixed global average MODIS BRDF/Albedo product (MCD43) spectral BRDF model parameters
NBAR c-factor method
Roy, D.P, Li, J., Zhang, H.K., Yan, L., Huang, H., 2017, Examination of Sentinel-2A multi-spectral instrument (MSI) reflectance anisotropy and the suitability of a general method to normalize MSI reflectance to nadir BRDF adjusted reflectance, Remote Sensing of Environment. 199, 25-38.
Roy, D.P., Zhang, H. K., Ju, J., Gomez-Dans, J. L., Lewis, P.E., Schaaf C.B., Sun, Q., Li, J., Huang, H., Kovalskyy, V., 2016, A general method to normalize Landsat reflectance data to nadir BRDF adjusted reflectance, Remote Sensing of Environment, 176, 255-271.
ρλ ( θnadir , θfixed )
NBARλ ( θnadir , θfixed ) = c ρλ ( θobs φobs , θsun φsun )
ρ λ ( θobs φobs , θsun φsun )

103 107 101 105
106 110 104 108
Sentinel-2A 10 days 2016
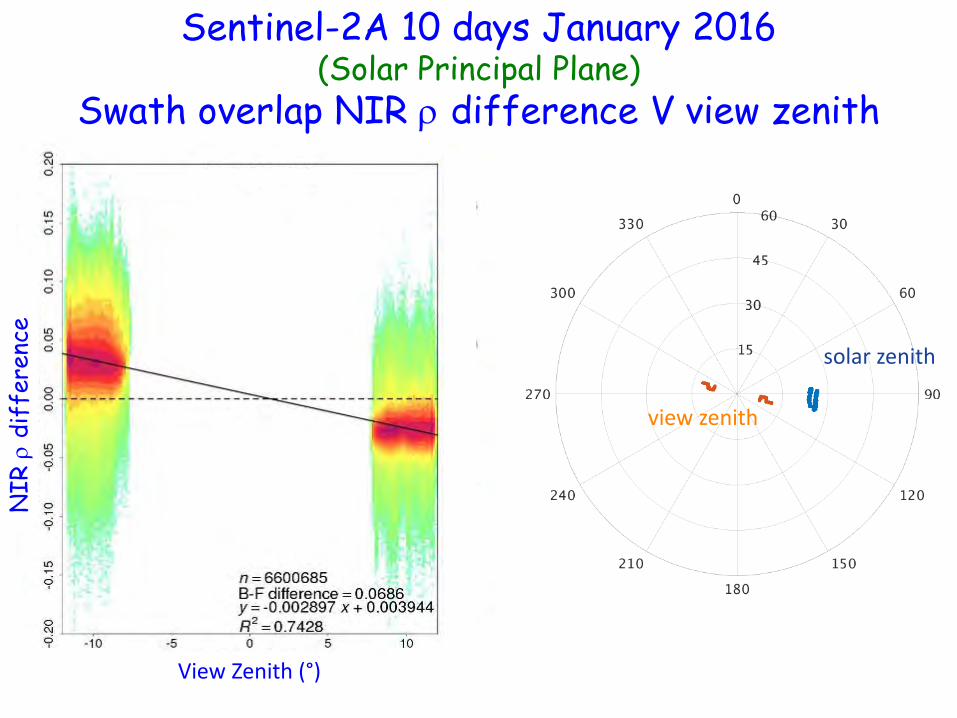
Sentinel-2A 10 days January 2016(Solar Principal Plane)
Swath overlap NIR ρ difference V view zenith
NIR
ρdi
ffer
ence
View Zenith (°)
solar zenith
view zenith

Sentinel-2A 10 days January 2016Swath overlap NIR ρ difference V view zenith
NIR
ρdi
ffer
ence
View Zenith (°)
c-factor BRDF corrected using global MODIS coefficients
solar zenith
view zenith
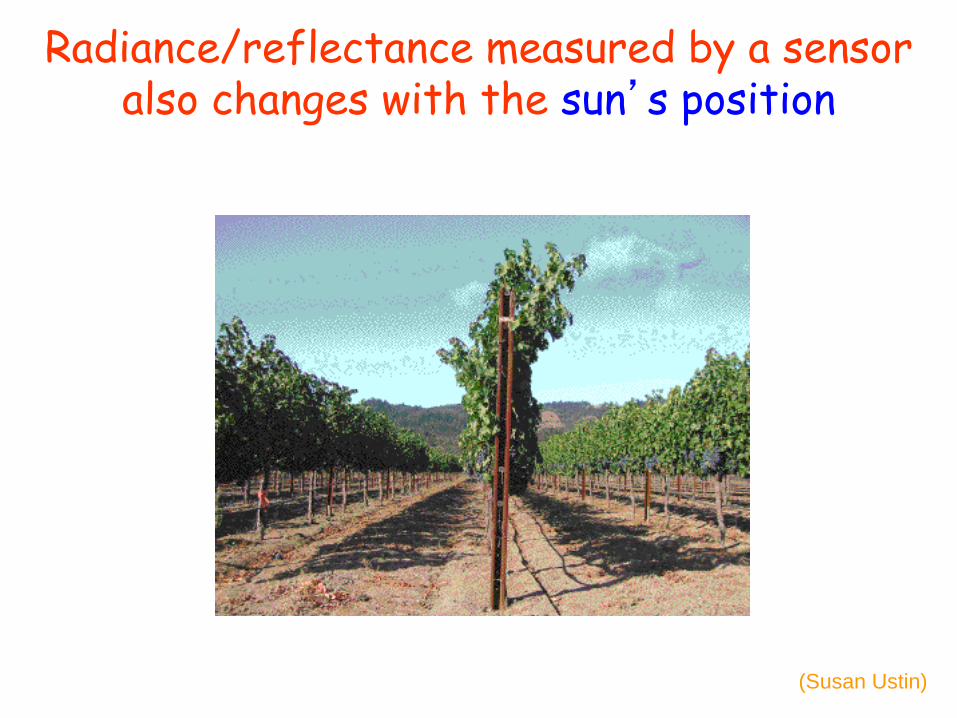
Radiance/reflectance measured by a sensor also changes with the sun’s position
(Susan Ustin)

12 months of global Landsat solar zenith (θs) plotted as a function of scene center latitude & day of year
22.14º <= θs <= 89.71º
θs mean = 43.23º
Zhang, H. K., Roy, D.P., Kovalskyy, V., 2016, Optimal solar geometry definition for global long term Landsat time series bi-directional reflectance normalization, IEEE Transactions on Geoscience and Remote Sensing. 54(3), 1410-1418.

HLS V1.4 modelled solar zenith
Claverie, M., Ju, J., Masek, J. G., Dungan, J. L., Vermote, E. F., Roger, J. C., ... & Justice, C. (2018). The Harmonized Landsat and Sentinel-2 surface reflectance data set. Remote Sensing of Environment, 219, 145-161.
function of latitude only
Derived using a six degree polynomial function of latitude:

Li, Z., Zhang, H.K., Roy, D.P., 2019, Investigation of Sentinel-2 bidirectional reflectance hot-spotsensing conditions. IEEE Transactions on Geoscience and Remote Sensing. DOI:10.1109/TGRS.2018.2885967
where 10.5 (10:30 am) is the Sentinel-2 Local Time at Descending Node (for Landsat 10:11 am), φnadir is the nadir latitude, i is the satellite inclination angle (Sentinel-2 98.62°; Landsat-8 98.2°)
Li modelled solar zenithfunction of latitude & day of year
Derived using sensor overpass time model (& astronomical model):
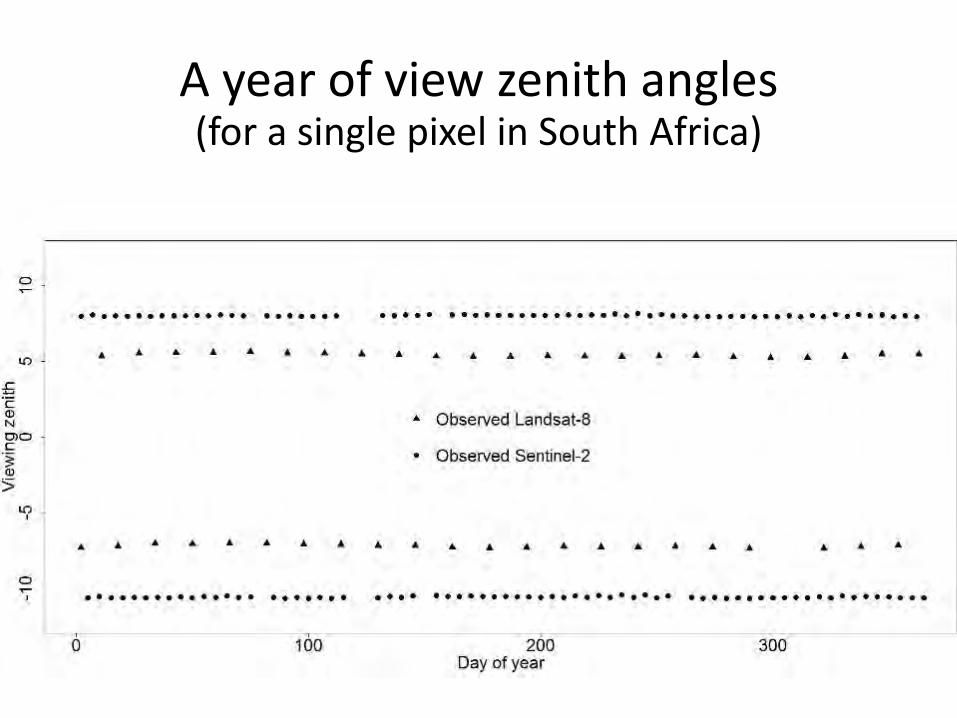
A year of view zenith angles (for a single pixel in South Africa)

A year of solar zenith angles (for a single pixel in South Africa)

= Sentinel-2 = Landsat-8
0.0964
0.0216
8.57%
Range
Noise (σ)
Noise (σ∗)
NIR reflectance(for a single pixel in South Africa)

= Sentinel-2 = Landsat-8
0.0879
0.0110
4.55%
Range
Noise (σ)
Noise (σ∗)
NIR NBAR - fixed HLS 1.4 solar zenith(for a single pixel in South Africa)

= Sentinel-2 = Landsat-8
0.0781
0.0111
4.38%
Range
Noise (σ)
Noise (σ∗)
NIR NBAR – observed solar zenith(for a single pixel in South Africa)

= Sentinel-2 = Landsat-8
0.0779
0.0115
4.55%
Range
Noise (σ)
Noise (σ∗)
NIR NBAR – local modelled solar zenith(for a single pixel in South Africa)

Global WELD NEX Version 3.0 September 2009 30m productfrom 15,058 L1T scenes (7,328 Landsat 5 & 7,730 Landsat 7)
Sinusoidal Equal Area Projection
WELD Landsat 5 & 7 observed Solar Zenithused to derive WELD NBAR

WELD Landsat 5 & 7 modeled Solar Zenithused to derive WELD NBAR
Global WELD NEX Version 3.0 September 2009 30m productfrom 15,058 L1T scenes (7,328 Landsat 5 & 7,730 Landsat 7)
Sinusoidal Equal Area Projection

Sentinel-2 Landsat-8 Pre-Processing
• Global WELD processing framework– Tiling into MODIS sinusoidal grid– Sentinel-2A to Landsat-8 registration– Sentinel-2A to Sentinel-2A registration
• Atmospheric correction (LaSRC)
• Nadir BRDF-adjusted reflectance (NBAR) (MODIS c-factor)
• Masking• cloud (Landsat 8 Collection 1 & Sen2Cor masks)• no masking of shadow

Evaluation of Landsat-8 and Sentinel-2A aerosol optical depth retrievals across Chinese cities and implications for medium spatial resolution urban aerosol monitoring, Li, Z., Roy, D.P., Zhang, H.K., Vermote, E.F., Huang, H., 2019, Remote Sensing. 11(2), 122.
V3.5.5 LaSRC AOD retrievalAll urban AERONET sites in China, +/- 10 minute overpass, Level 2 AERONET

Landsat 8 Collection 1 June 4 – 10 2016 (7 days)
5295 × 5295 30m WELD tiles sinusoidal projection
Southern Africa

Sentinel 2A June 4 – 10 2016 (7 days)
5295 × 5295 30m WELD tiles sinusoidal projection
Southern Africa

ApplyLandsat-8Sentinel-2A bandstatistical calibration
Sentinel-2A band 8 surface NBAR
Land
sat-
8 ba
nd 5
sur
face
NBA
RNIR
Zhang, Roy, Yan, Li, Huang, Vermote, Skakun, Roger, 2018, RSE,
Characterization of Sentinel-2A and Landsat-8 top of atmosphere, surface, nadir BRDF adjusted reflectance and NDVI differences

To first order the change in reflectance due to burning is dependent on the fraction of area burned f and combustion completeness cc
MIXED PIXELINCOMPLETE COMBUSTION
UNBURNED BURNED

Landsat 8
KafueNational park, Zambia
Day 155 2016
false color surface NBAR
2000 x 2000 30m pixels
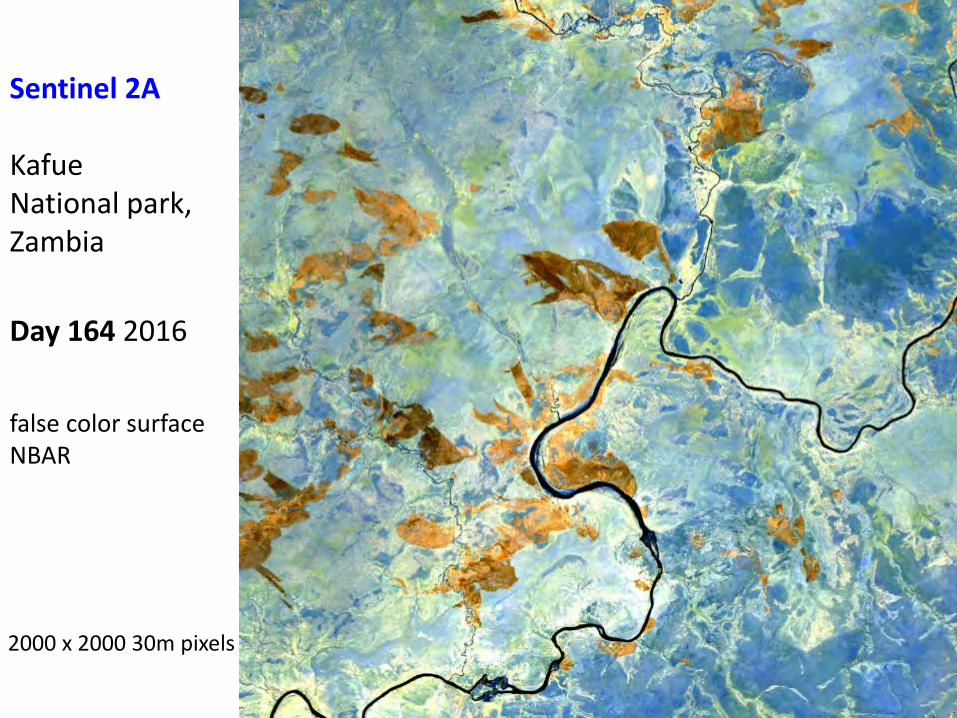
Sentinel 2A
KafueNational park, Zambia
Day 164 2016
false color surface NBAR
2000 x 2000 30m pixels

f x cc
day 155 -> 164
2000 x 2000 30m pixels

Example results

~2200 nm1600 nm865 nm
July 19th 2016
MODIS tile h20v10
7 x 7 WELD tiles

~2200 nm1600 nm865 nm
July 19th 2016
MODIS tile h20v10
7 x 7 WELD tiles

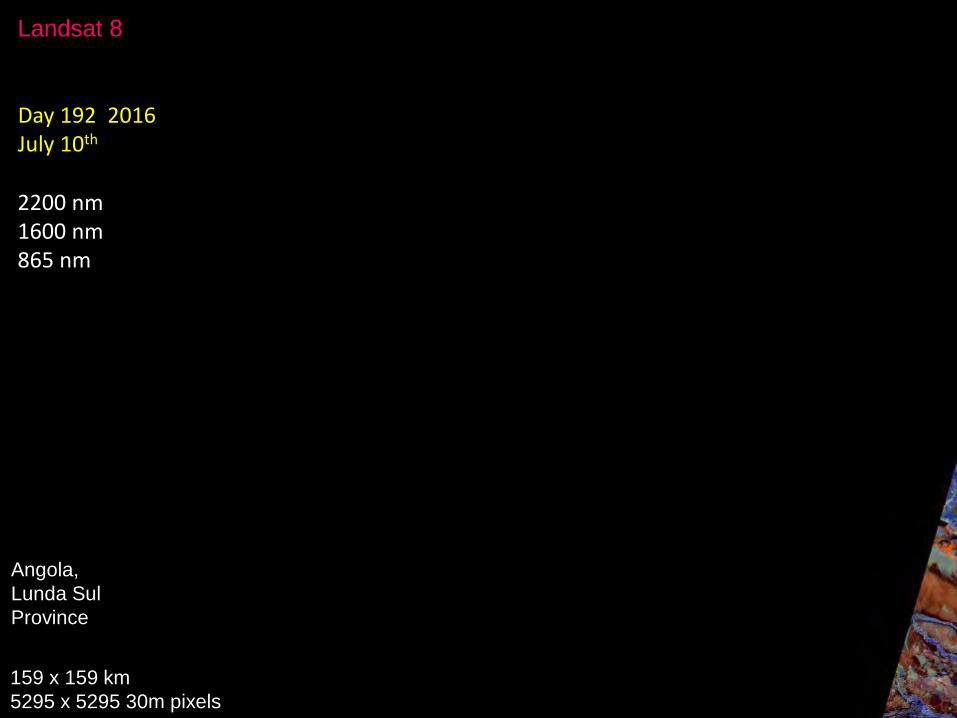
Landsat 8
Angola,Lunda SulProvince
Day 183 2016July 1st
2200 nm1600 nm865 nm
159 x 159 km5295 x 5295 30m pixels

Sentinel 2A
2190 nm1610 nm865 nm
Day 183 2016July 1st
Angola,Lunda SulProvince
159 x 159 km5295 x 5295 30m pixels

Landsat 8
Day 190 2016July 8th
2200 nm1600 nm865 nm
Angola,Lunda SulProvince
159 x 159 km5295 x 5295 30m pixels

Sentinel 2A
2190 nm1610 nm865 nm
Day 190 2016July 8th
Angola,Lunda SulProvince
159 x 159 km5295 x 5295 30m pixels
Landsat 8
Day 192 2016July 10th
2200 nm1600 nm865 nm
Angola,Lunda SulProvince
159 x 159 km5295 x 5295 30m pixels
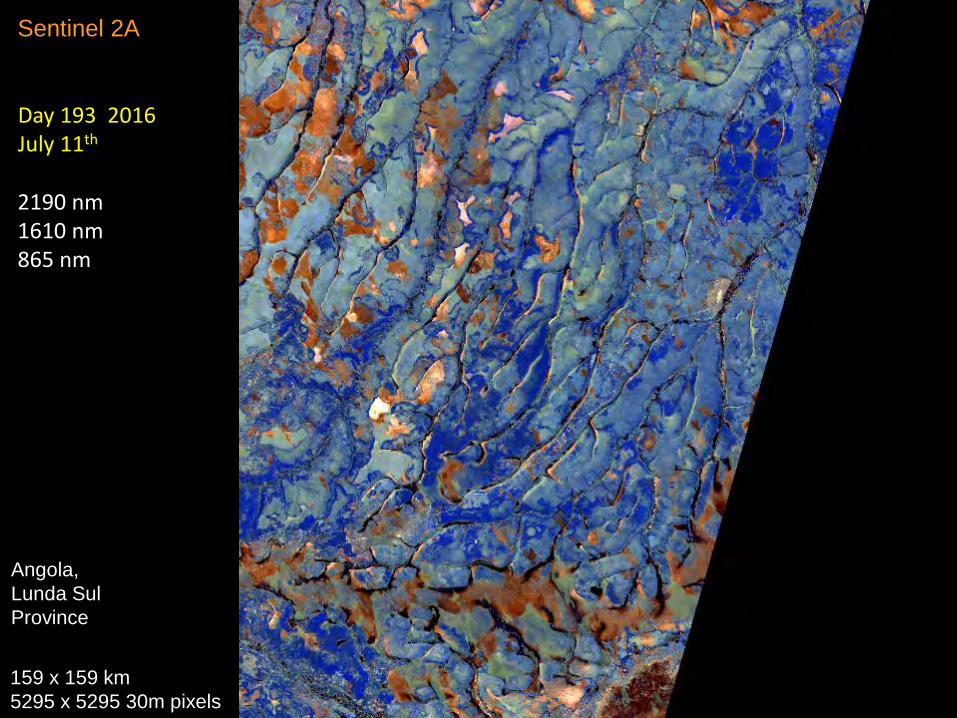
Sentinel 2A
2190 nm1610 nm865 nm
Day 193 2016July 11th
Angola,Lunda SulProvince
159 x 159 km5295 x 5295 30m pixels

Landsat 8
2200 nm1600 nm865 nm
Day 199 2016July 17th
Angola,Lunda SulProvince
159 x 159 km5295 x 5295 30m pixels

Sentinel 2A
2190 nm1610 nm865 nm
Day 200 2016July 18th
Angola,Lunda SulProvince
159 x 159 km5295 x 5295 30m pixels

Sentinel 2A
2190 nm1610 nm865 nm
Day 203 2016July 21st
Angola,Lunda SulProvince
159 x 159 km5295 x 5295 30m pixels

Sentinel 2A
2190 nm1610 nm865 nm
Day 213 2016July 31st
Angola,Lunda SulProvince
159 x 159 km5295 x 5295 30m pixels

0
median 23456
≥7
Angola,Lunda SulProvince
159 x 159 km5295 x 5295 30m pixels
Number of cloud-free observations July 2016Landsat 8

Angola,Lunda SulProvince
159 x 159 km5295 x 5295 30m pixels
0
23
median 456
≥7
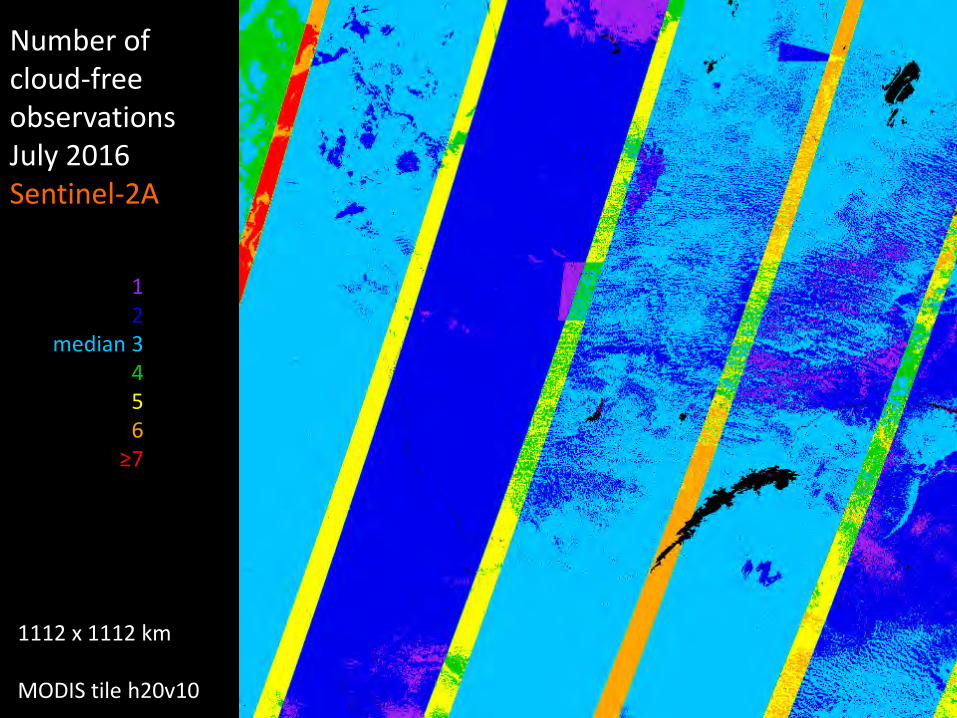
Number of cloud-free observations July 2016Sentinel-2A

Angola,Lunda SulProvince
159 x 159 km5295 x 5295 30m pixels
0
2345
median 6≥7
Number of cloud-free observations July 2016Landsat-8Sentinel-2A

Day of burningJuly 2016Sentinel-2A
0-23-56-8
9-1112-1415-1718-2021-2324-2728-31
Angola,Lunda SulProvince
159 x 159 km5295 x 5295 30m pixels

0-23-56-8
9-1112-1415-1718-2021-2324-2728-31
Angola,Lunda SulProvince
159 x 159 km5295 x 5295 30m pixels
Day of burningJuly 2016Sentinel-2A Landsat-8

0.0 ≤ f.cc < 0.2 0.2 ≤ f.cc < 0.40.4 ≤ f.cc < 0.6 0.6 ≤ f.cc < 0.80.8 ≤ f.cc < 0.9 0.9 ≤ f.cc ≤ 1.0
Angola,Lunda SulProvince
159 x 159 km5295 x 5295 30m pixels
f x ccJuly 2016Sentinel-2A

0.0 ≤ f.cc < 0.2 0.2 ≤ f.cc < 0.40.4 ≤ f.cc < 0.6 0.6 ≤ f.cc < 0.80.8 ≤ f.cc < 0.9 0.9 ≤ f.cc ≤ 1.0
Angola,Lunda SulProvince
159 x 159 km5295 x 5295 30m pixels
f x ccJuly 2016Sentinel-2A Landsat-8

MODIS tile h20v10
7 x 7 WELD tiles

Number of cloud-free observations July 2016Landsat 8
1112 x 1112 km
MODIS tile h20v10
01
median 23456
≥7
012
median 3456
≥7
Number of cloud-free observations July 2016Sentinel-2A
1112 x 1112 km
MODIS tile h20v10

01234
median 56
≥7
Number of cloud-free observations July 2016Landsat 8 Sentinel-2A
1112 x 1112 km
MODIS tile h20v10

0-23-56-8
9-1112-1415-1718-2021-2324-2728-31
1112 x 1112 km
MODIS tile h20v10
Day of burningSentinel-2A Landsat-8July 2016

0-23-56-8
9-1112-1415-1718-2021-2324-2728-31
1112 x 1112 km
MODIS tile h20v10
Day of burningMODIS 500m MCD64 C6July 2016

July 2016 TABLE CONFUSION MATRIX
MODIS MCD64 C6 (assumed to be truth) Row total km2
Burnedkm2
Unburnedkm2
Unmappedkm2
Burned 3,9871 72,428 154 112,454
Landsat-8/ Sentinel-2A
km2 (3.2%) (5.9%) (<0.1%) (9.1%)
Unburned 25,283 1,086,069 2,620 1,113,972
km2 (2.0%) (87.8%) (0.2%) (90.1%)
Unmapped 15 2,430 7,561 10,006
km2 (<0.01%) (0.2%) (0.6%) (0.8%)
Column total 65,170 1,160,926 10,336 1,236,433
[km2 (5.3%) (93.9%) (0.8%) (100.0%)
Confusion matrix for July 2016 results
Omission Error (0-1) = 0.64; Commission Error (0-1) = 0.39; User’s Accuracy (0-1) = 0.61; Producer’s Accuracy (0-1) = 0.36; Overall Accuracy (0-1) = 0.91
Relative Bias [%] = - 41.9%

3 km2 cells
Comparison of July 2016 burned proportions mapped by MODIS and Landsat-8 & Sentinel-2

6 km2 cells
Comparison of July 2016 burned proportions mapped by MODIS and Landsat-8 & Sentinel-2

0-23-56-8
9-1112-1415-1718-2021-2324-2728-31
Angola,Lunda SulProvince
159 x 159 km5295 x 5295 30m pixels
Day of burningSentinel-2A Landsat-8July 2016

0-23-56-8
9-1112-1415-1718-2021-2324-2728-31
Days since the first day of the month
Angola,Lunda SulProvince
159 x 159 km5295 x 5295 30m pixels
Day of burningMODIS 500m MCD64July 2016

0-23-56-8
9-1112-1415-1718-2021-2324-2728-31
Angola,Lunda SulProvince
159 x 159 km5295 x 5295 30m pixels
Day of burningSentinel-2A Landsat-8August 2016

0-23-56-8
9-1112-1415-1718-2021-2324-2728-31
Angola,Lunda SulProvince
159 x 159 km5295 x 5295 30m pixels
Day of burningMODIS 500m MCD64 C6August 2016

0-23-56-8
9-1112-1415-1718-2021-2324-2728-31
Angola,Lunda SulProvince
159 x 159 km5295 x 5295 30m pixels
Day of burningSentinel-2A Landsat-8Sept. 2016

0-23-56-8
9-1112-1415-1718-2021-2324-2728-31
Angola,Lunda SulProvince
159 x 159 km5295 x 5295 30m pixels
Day of burningMODIS 500m MCD64 C6Sept. 2016

0-23-56-8
9-1112-1415-1718-2021-2324-2728-31
Angola,Lunda SulProvince
159 x 159 km5295 x 5295 30m pixels
Day of burningSentinel-2A Landsat-8Oct. 2016

0-23-56-8
9-1112-1415-1718-2021-2324-2728-31
Angola,Lunda SulProvince
159 x 159 km5295 x 5295 30m pixels
Day of burningMODIS 500m MCD64 C6Oct. 2016

0-23-56-8
9-1112-1415-1718-2021-2324-2728-31
Angola,Lunda SulProvince
159 x 159 km5295 x 5295 30m pixels
Day of burningMODIS 1km active firesOct. 2016

0-23-56-8
9-1112-1415-1718-2021-2324-2728-31
Angola,Lunda SulProvince
159 x 159 km5295 x 5295 30m pixels
Day of burningSentinel-2A Landsat-8Oct. 2016

Landsat-8 Sentinel-2 Day of burning - MODIS Day of burning
median difference = 3.00 days
Freq
uenc
yJuly temporal product reporting difference (days)

5km2 cells 6km2 cells
3km2 cells 4km2 cells
Comparison of July 2016 burned proportions mapped by MODIS and Landsat-8 & Sentinel-2

3km2 cells 4km2 cells
5km2 cells 6km2 cells
Comparison of July 2016 burned proportions mapped by MODIS and Landsat-8 & Sentinel-2 with 3-day adjustment

0-23-56-8
9-1112-1415-1718-2021-2324-2728-31
1112 x 1112 km
MODIS tile h20v10
Day of burningSentinel-2A Landsat-8July 2016

0-23-56-8
9-1112-1415-1718-2021-2324-2728-31
1112 x 1112 km
MODIS tile h20v10
Day of burningSentinel-2A Landsat-8August 2016

0-23-56-8
9-1112-1415-1718-2021-2324-2728-31
1112 x 1112 km
MODIS tile h20v10
Day of burningSentinel-2A Landsat-8Sept. 2016

0-23-56-8
9-1112-1415-1718-2021-2324-2728-31
1112 x 1112 km
MODIS tile h20v10
Day of burningSentinel-2A Landsat-8Oct. 2016

0-23-56-8
9-1112-1415-1718-2021-2324-2728-31
1112 x 1112 km
MODIS tile h20v10
Day of burningMODIS 500m MCD64 C6July 2016

0-23-56-8
9-1112-1415-1718-2021-2324-2728-31
1112 x 1112 km
MODIS tile h20v10
Day of burningMODIS 500m MCD64 C6August 2016

0-23-56-8
9-1112-1415-1718-2021-2324-2728-31
1112 x 1112 km
MODIS tile h20v10
Day of burningMODIS 500m MCD64 C6Sept 2016

0-23-56-8
9-1112-1415-1718-2021-2324-2728-31
1112 x 1112 km
MODIS tile h20v10
Day of burningMODIS 500m MCD64 C6Oct 2016

Validation

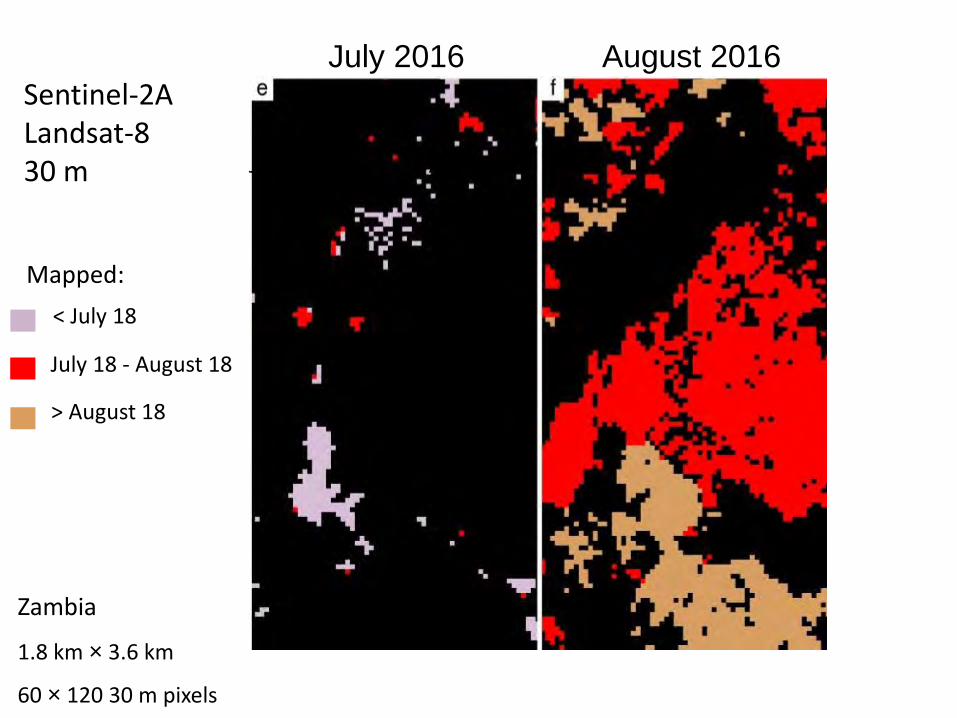
mapped July 18 - August 18
0.2 ≤ f.cc < 0.40.4 ≤ f.cc < 0.6 0.6 ≤ f.cc < 0.80.8 ≤ f.cc < 0.9 0.9 ≤ f.cc ≤ 1.0
July 2016 August 2016Sentinel-2A Landsat-830 m
Zambia
1.8 km × 3.6 km
60 × 120 30 m pixels

Zambia
1.8 km × 3.6 km
600 × 1200 3 m pixels
July18 August 18
3 m false color (0.82, 0.63, 0.54 µm)
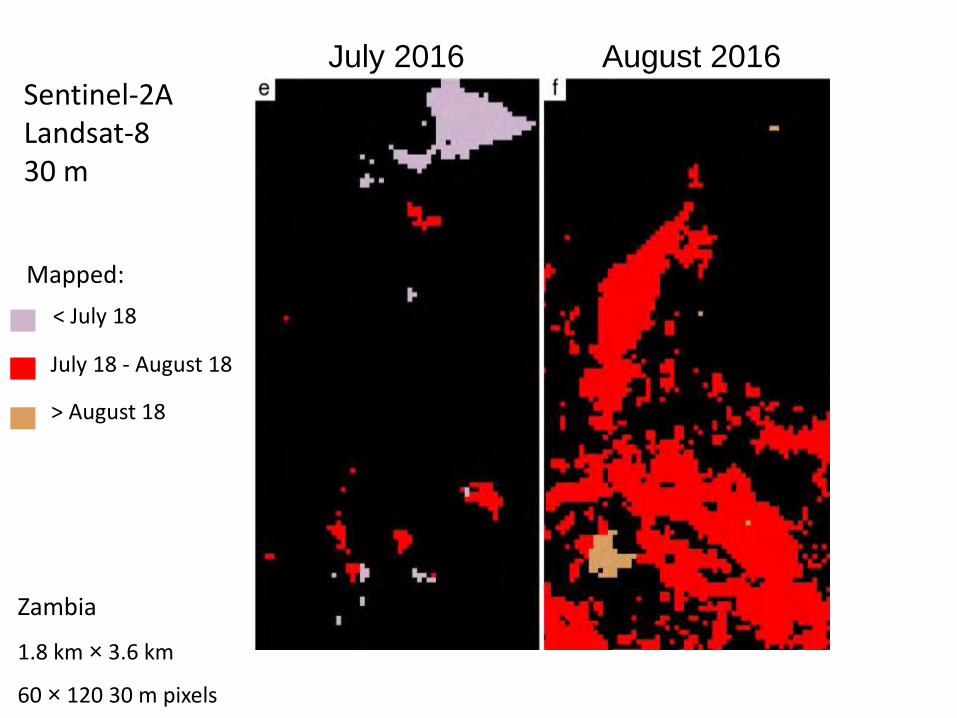
> August 18
< July 18
July 18 - August 18
August 18
July 2016 August 2016
Zambia
1.8 km × 3.6 km
60 × 120 30 m pixels
Sentinel-2A Landsat-830 m
Mapped:

Zambia
1.8 km × 3.6 km
600 × 1200 3 m pixels
July18 August 18
3 m false color (0.82, 0.63, 0.54 µm)

mapped July 18 - August 18
0.2 ≤ f.cc < 0.40.4 ≤ f.cc < 0.6 0.6 ≤ f.cc < 0.80.8 ≤ f.cc < 0.9 0.9 ≤ f.cc ≤ 1.0
July 2016 August 2016Sentinel-2A Landsat-830 m
Zambia
1.8 km × 3.6 km
60 × 120 30 m pixels
> August 18
< July 18
July 18 - August 18
July 18 August 18
July 2016 August 2016
Zambia
1.8 km × 3.6 km
60 × 120 30 m pixels
Sentinel-2A Landsat-830 m
Mapped:

Sentinel-2A false color
surface NBARJuly 2nd 2016 swath
1112 x 1112 km
MODIS tile h20v10

Reference site30 x 30 km
overall accuracycommission error the omission error
1112 x 1112 km
MODIS tile h20v10

Landsat-8/Sentinel-2A
Burned[km2]
Unburned[km2]
Unmapped[km2]
Row total[km2]
Burned 1203.94 378.03 0.00 1581.97
Reference
[km2] (11.13%) (3.50%) (<0.01%) (14.63%)
Unburned 73.39 9152.43 0.05 9225.87[km2] (0.01%) (84.68%) (<0.01%) (84.69%)
Unmapped 0.00 0.01 0.00 0.01[km2] (0.00%) (<0.01%) (0.00%) (<0.01%)
Column total 1277.33 9530.47 0.05 10807.80[km2] (11.14%) (88.18%) (<0.01%)
Omission Error (0-1) = 0.24 Commission Error (0-1) = 0.06 Relative Bias [%] = -0.19User’s Accuracy (0-1) = 0.94 Producer’s Accuracy (0-1) = 0.76 Overall Accuracy (0-1) = 0.96

1.5 km2 cells
Comparison of July 2016 burned proportions mapped by reference and Landsat-8 & Sentinel-2

Validate cc in field with international collaborators ?
Too green to burn !

Kruger National Park, South Africa, October 2018 – drier !

TLS Pre fire

TLS Post fire

Planned Production - all of Africa, including Madagascar, south of the Tropic of Cancer (23.44° N)for 2017 / 2018 / 2019 process on NASA funded AWS
1041 Landsat-8 Collection 1WRS-2 path/rows (UTM)
2829 Sentinel-2 L1C tiles (UTM)
33 MODIS Tiles (sinusoidal)
1255 WELD tiles

Summary• New moderate resolution data will provide global burned area mapping capability
• Exciting • Improved reporting of small and spatially fragmented burned areas• Need S2A and L8 for reliable burned area mapping, L8 alone insufficient• S2A, S2B & L8 will be optimal
• Major R&D effort on Sentinel-2 and Landsat-8 pre-processing • will use HLS V1.5 this Fall (improved cloud mask, correct c-factor implementation)
• Automated burned area algorithm protoyped• applied to NBAR surface reflectance gridded WELD tile time series• only 2 parameters• map 30m burned area + sub-pixel fraction (f) x combustion completeness (cc)• Remote Sensing of Environment, paper currently in review (round 3 !)
• Planned production• all of Africa, including Madagascar, south of the Tropic of Cancer • 2017 (S2A & L8), 2018 (S2A, S2B, L8), 2018 (S2A, SB, L8)
• Validation• Commercial data (burned area, f ) & perhaps in situ Terrestrial Laser Scanner ( cc )


![NASA update 2014-Sopron.ppt - lcluc.umd.edu...Update Garik Gutman, LCLUC Program Manager NASA Headquarters Washington, DC 1. RBI OMPS-Limb [[TSIS-2]] ... (thermal IR issues) – Landsat-9](https://cdn.vdocument.in/doc/165x107/5f70f3cd8908a96f45306b1c/nasa-update-2014-lclucumdedu-update-garik-gutman-lcluc-program-manager.jpg)


