DOTNAC Doc. D7.34
Date: 15-JUL-2013
Issue:
Page: 1 of 33
© DOTNAC
PROJECT DELIVERABLE REPORT
Grant Agreement number: 266320
Project acronym: DOTNAC
Project title: Development and Optimization of THz NDT on Aeronautics Composite Multi-layered
Structures
Funding Scheme: Collaborative Project - Small or Medium Scale Focused Research Project
Deliverable No: D7.34
Deliverable Name: Assessment of NDT THz potential in aeronautics
WP No: 7
Lead Beneficiary: IAI

DOTNAC Doc. D7.34
Date: 15-JUL-2013
Issue:
Page: 2 of 33
© DOTNAC
Document Record
Prepared by Yehuda Sternberg Partner 10, IAI
Verified by Marijke Vandewal Partner 1, RMA
Released by Yehuda Sternberg Partner 10, IAI
Distribution List
Partner 1, RMA Marijke Vandewal
Edison Cristofani
Anna Brook
Partner 2, Verhaert Frederik Wouters
Koenraad Rombout
Wouter Vleugels
Partner 3, Innov Support Jan Depauw
Partner 4, UNIKL Frank Ospald
Rene Beigang
Partner 5, Fh-IPM Joachim Jonuscheit
Carsten Matheis
Sabine Wohnsiedler
Partner 6, CNRS
Patrick Mounaix
Jean-Paul Guillet
Pascal Desbaras
Inka Manek-Hönninger
Partner 7, CTA Idurre Sáez de Ocariz
Ion López
Pablo Venegas
Partner 8, LGAI Jordi Ribas
Elisabeth Ribera
Rafael Martínez
Partner 9, CIMNE Angel Priegue
Jordi Jiménez
Partner 10, IAI Yehuda Sternberg
EC H. Felix

DOTNAC Doc. D7.34
Date: 15-JUL-2013
Issue:
Page: 3 of 33
© DOTNAC
Table of Contents
1 Introduction .............................................................................................................................................. 5 1.1 Project Goals .................................................................................................................................. 5 1.2 WP7 Main Tasks and Goals ........................................................................................................... 5
2 Comparative Analysis between THz and Classical NDT Techniques ..................................................... 7 2.1 Basic Idea ....................................................................................................................................... 7 2.2 Ultrasonic Tests for Comparison Study ......................................................................................... 7
2.2.1 Ultrasonic pulse echo 7 2.2.2 Ultrasonic through transmission 7 2.2.3 IWEX (Inverse Wave Field Extrapolation) 7
2.3 Calibration Samples ....................................................................................................................... 8 2.4 Test samples ................................................................................................................................. 10 2.5 Comparative Study of Results for Calibration Samples .............................................................. 12
2.5.1 Introduction 12 2.5.2 Impact Damage in Carbon Fiber Laminates (CFRP) 13 2.5.3 Impact Damage in Glass Fiber Laminates 14 2.5.4 Water Inclusion 15 2.5.5 Teflon Inclusion in Glass Fiber Samples (Solid Laminates, A & C-sandwich
Structures) 16 2.5.6 Stuck Inclusion in Glass Fiber Samples (Solid Laminates, A & C-sandwich Structures)19 2.5.7 Paper Sheet Inclusion in Glass Fiber Samples (Solid Laminates, A & C-sandwich
Structures) 22 2.6 Comparative Study of Results for Test Samples.......................................................................... 25
2.6.1 Real Disbonds or Delaminations in Glass Fiber A/ C Sandwich Structures 25 2.6.2 Real Delaminations in Solid Laminate Structures 27 2.6.3 Coating Misprocess on CFRP laminates (carbon fiber) 27
3 Assessment of NDT-THz Potential for Composites .............................................................................. 31
DOTNAC Doc. D7.34
Date: 15-JUL-2013
Issue:
Page: 4 of 33
Table of Figures
Figure 1: Comparative Study for the CFRP impact samples ........................................................................... 13
Figure 2: Comparative Study for the glass fiber impact samples .................................................................... 14
Figure 3: Comparative Study for water inclusion samples .............................................................................. 15
Figure 4: Comparative results for the teflon inclusion glass fiber samples ..................................................... 18
Figure 5: FMCW THz results for teflon inclusion on solid laminate and C-sandwich honeycomb samples .. 18
Figure 6: Comparative results for for the stuck inclusion glass fiber samples ................................................ 21
Figure 7: TD-THz results of solid laminate stuck inclusion. TD-THz has a very accurate detection of the
stuck depth and of the individual glass fiber plies. .......................................................................................... 21
Figure 8: Comparative results for for the paper sheet inclusion glass fiber samples ...................................... 23
Figure 9: FMCW-THz results of paper sheet inclusion in solid laminate and C-sandwich foam samples ..... 24
Figure 10: Comparative Study for A/ C sandwich test samples ...................................................................... 25
Figure 11: TD-THz and FMCW-THz results on A-sandwich honeycomb test sample. Disbonds are
accurately detected. TD-THz also detect the actual disbond depth below the 3 plies skin of glass fiber ....... 26
Figure 12: Comparative Study for Solid Laminate Test Samples ................................................................... 27
Figure 13: Comparative analysis for the CFRP samples with RE (Rain Erosion) coating .............................. 29
Figure 14: Comparative analysis for the CFRP samples with PU (polyurethane) coating .............................. 29
Figure 15: Comparative TD-THz analysis between reference sample CFRP_PU_1 and sample CFRP_PU_11
with incorrect primer thickness. ...................................................................................................................... 30
Table of Tables
Table 1: List of calibration samples .................................................................................................................. 8
Table 2: Summary of defects in calibration samples ......................................................................................... 9
Table 3: List of test samples with delaminations, disbonds or porosity .......................................................... 10
Table 4: List of test samples with coating misprocess .................................................................................... 11
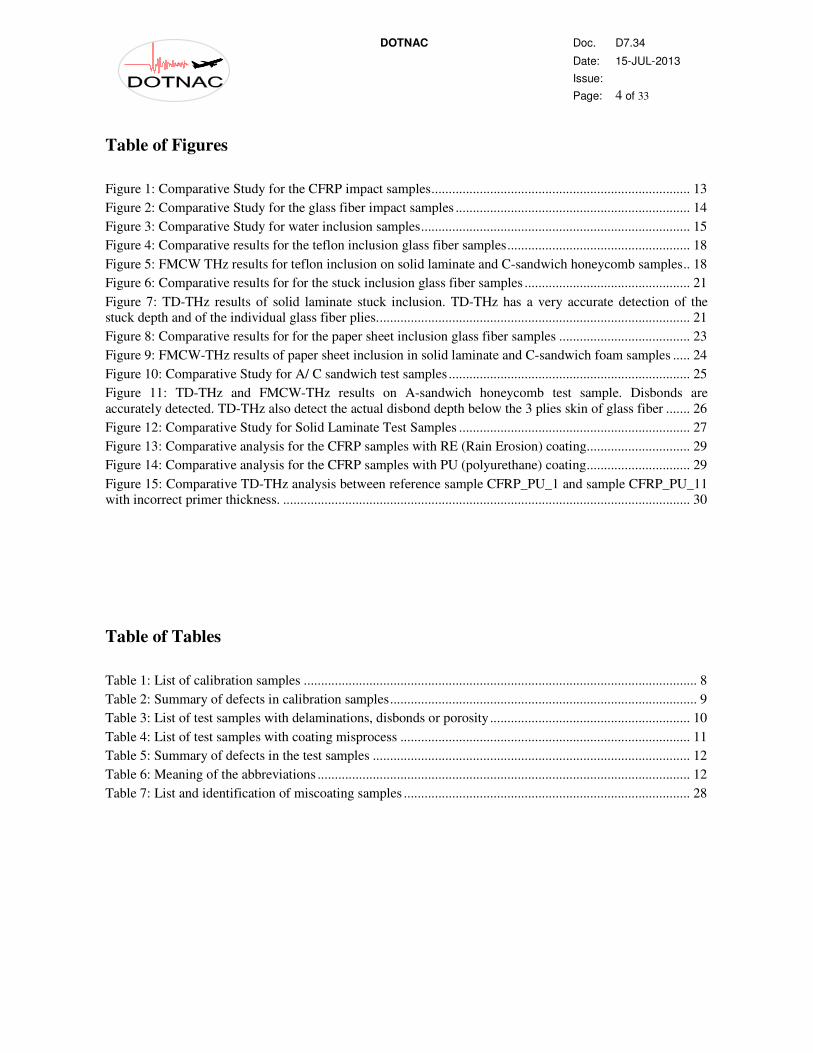
Table 5: Summary of defects in the test samples ............................................................................................ 12
Table 6: Meaning of the abbreviations ............................................................................................................ 12
Table 7: List and identification of miscoating samples ................................................................................... 28

DOTNAC Doc. D7.34
Date: 15-JUL-2013
Issue:
Page: 5 of 33
© DOTNAC
1 Introduction
1.1 Project Goals
The main goal of the DOTNAC project is to develop a fast, high resolution, non-invasive and non-contact
inspection system for assessing aeronautic composite parts either during production or maintenance. The
developed NDT tool will be easy to integrate in industrial facilities and will fill in the performance gaps that
are still present amongst the existing NDT techniques. It will therefore be an extremely useful tool in NDT in
terms of sensor fusion. This new method will not replace directly the existing NDT tools, but will deliver
complementary results which can be sometimes more precise for some defects. Achieving this entails the
following specific objectives:
• To create an integrated (hardware-software) and optimized THz imaging system using pulsed signals
and optical fibre coupling.
• To create an integrated (hardware-software) and optimized THz imaging system using continuous
wave signals and electrical cable coupling.
• To demonstrate, in an industrial setting, the effectiveness of a THz NDT tool.
• To assess the performances of the two developed THz NDT tools (Time Domain Pulsed Signal and
Frequency Modulated Continuous Wave) for assessing aeronautic composite parts.
• To develop a user/research community for fast, high resolution, non-invasive & non-contact
inspection for assessing aeronautic composite parts during production.
1.2 WP7 Main Tasks and Goals
The objectives of WP7 comprise the full comparison analysis of results on test samples through the newly
developed and established NDT tools, the assessment of the NDT potential of the newly developed THz
system and the assessment of an on-site THz-NDT system.
In this sense, this work package has been divided into different tasks as follows:
Task 7.1: Blind tests for all of the above systems
Following measurements on the collection of test samples of D1.5 will be performed by the consortium
partners (the measurements using the established NDT methods can start as soon as the calibration samples
are available):
• CTA will measure the samples using IRT
• LGAI will apply RT (Film and Digital radiography) and UT (Pulse echo with Conventional Probe
and Phase Array, IWEX) on these samples
• IAI will carry out inspections using Ultrasound testing (Pulse echo, Through-transmission by Water
Immersion system and by AirScan® system)
• UNIKL will measure the samples using a traditional TD THz system with mechanical stages as
reference imaging system.
• Fh-IPM will measure the samples using the FMCW system from D2.11 as well as using the wide
beam illumination.
• RMA will apply SAT processing at the FMCW images using wide beam illumination
• CNRS will measure the samples using the TD THz system from D4.19.
These tests are defined by measurement tests on samples with defects that have not been specified before the
execution of the test.

DOTNAC Doc. D7.34
Date: 15-JUL-2013
Issue:
Page: 6 of 33
© DOTNAC
Task 7.2: Comparison analysis of all tests
Similar to task 6.1 a comparison analysis can be performed with respect to the image results (resolution,
penetration, depth, contrast, …) and to complete the comparison and analysis of the NDT method itself
(flexible measurement set-up, measurement time, easy industrial integration, ….) will be done.
Task 7.3: Refinement of the centralized platform for 2D/3D data analysis
The centralized web-platform developed in task 6.2 will be improved using feedback from the users and can
deploy new services and features, that have been found necessary for full and proper operations of the
platform (in the area of automatic analysis of 2D/3D images, new interaction modules for project members,
etc..).
Task 7.4: Feasibility test of THz systems on-site
For this feasibility test the two THz systems (TD and FMCW) will be transported out of their respective
laboratories and installed at LGAI facilities to carry out inspections of real parts with 3D structure provided
by IAI (a radome). This part will be inspected with conventional NDT techniques (UT and X-Ray).
Similar to task 6.1 and 7.2, a comparison analysis of the results from THz NDT and the conventional
techniques will be performed, regarding both the image results (resolution, penetration depth, contrast, ….)
and the method itself (flexible measurement set-up, measurement time, easy industrial integration, ….)
Additionally the samples will be measured by UNIKL using a traditional TD THz system with mechanical
stages as reference imaging system, if the samples fit to the set-up.
Task 7.5: Global assessment of NDT-THz potential
The results of the comparison analysis regarding the test samples and the on-site measurements will be
discussed critically by all partners. The outcome of this discussion will deliver:
• The identification of the next development steps which are necessary to get a real industrial grade THz
NDT tool that fits all requirements of the end users. This could be proposals to speed up the
measurement or to reduce the costs of the tool. It will include adaptations and changes to be made to
the technology demonstrator on system and detailed level.
• The identification of additional applications for which the developed system can be used.
• A database containing the THz-NDT performance of different measurement configurations versus
specific materials and defects.
Task 7.6: Assessment of an “on-site”, “on-equipment” THz system
Last but not least, the partners of the DOTNAC consortium will have a theoretical look at the possibilities of
creating an “on-site” NDT tool starting from the developed THz technology demonstrator. Indeed, looking at
the general expectations of the end users NDT needs, there is at present still an important need for:
• An improvement of the integration of the NDT tools into industrial facilities.
• NDT tools with limited maintenance.
• NDT tools with advanced “on-site” capacities.

DOTNAC Doc. D7.34
Date: 15-JUL-2013
Issue:
Page: 7 of 33
© DOTNAC
2 Comparative Analysis between THz and Classical NDT Techniques
2.1 Basic Idea
The basic idea for the assessment of the NDT-THz systems is to compare the THz results obtained on
calibration and test samples with the results obtained on the same samples by classical NDT techniques. The
calibration and test samples are fully documented in delivery D1.5 and briefly described in sections 2.3 and
2.4. The selected classical NDT techniques used for the THz assessment were Ultrasound, digital X-Ray and
thermography. In addition to digital X-ray several samples were also tested by X-ray tomography on
conventional medical CT scanner. Ultrasonic tests were themselves divided into three categories: Pulse Echo,
Through Transmission and IWEX (Inverse Wave Field Extrapolation) that are shortly described in next section
2.2.
2.2 Ultrasonic Tests for Comparison Study
2.2.1 Ultrasonic pulse echo
In this technique the same ultrasonic probe or probe array is used for emission and detection. The
recorded and processed signal is the reflected signal from the part. Using this technique we can get
depth information and therefore accurately localize depth position of defects.
2.2.2 Ultrasonic through transmission
This technique is essentially used for highly attenuating parts that do not reflect enough energy in pulse
echo. Signal is emitted from one side of the part and collected from the other side by a second probe.
This technique is highly sensitive but does not provide any depth information.
2.2.3 IWEX (Inverse Wave Field Extrapolation)
IWEX is a new ultrasonic pulse echo method developed by APPLUS that applies seismic signal
processing approach to ultrasonic testing. It is based on sequential emission element by element of a
multi-element phased array transducer while all elements are constantly acting as receivers. Recorded
signals at each element are then extrapolated back into the inspected part and gradually the whole part
volume can be reconstructed.

DOTNAC Doc. D7.34
Date: 15-JUL-2013
Issue:
Page: 8 of 33
© DOTNAC
2.3 Calibration Samples
Following is a summary table of the calibration samples used for the project (table 1) and a summary of
the defect types (table 2). A complete description of the calibration samples can be found in
deliverableD1.5.
REFERENCE DESCRIPTION
GROUP A DOTNAC_GFRP_02 GFRP A-SANDWICH ROHACELL WITH INSERTS
DOTNAC_GFRP_03 GFRP A-SANDWICH HONEYCOMB WITH INSERTS
GROUP B DOTNAC_GFRP_01 GFRP SOLID LAMINATE WITH INSERTS
GROUP C DOTNAC_GFRP_04 GFRP SOLID LAMINATE WITH IMPACTS 15J AND 22J
DOTNAC_GFRP_05 GFRP SOLID LAMINATE WITH IMPACT 30J
DOTNAC_GFRP_06 GFRP SOLID LAMINATE WITH IMPACT 40J
DOTNAC_GFRP_07 GFRP A-SANDWICH ROHACELL 0,2ml WATER
DOTNAC_GFRP_08 GFRP A-SANDWICH ROHACELL 0,35ml WATER
DOTNAC_GFRP_09 GFRP A-SANDWICH ROHACELL 0,75ml WATER
DOTNAC_GFRP_10 GFRP A-SANDWICH HONEYCOMB 0,2ml WATER
DOTNAC_GFRP_11 GFRP A-SANDWICH HONEYCOMB 0,35ml WATER
DOTNAC_GFRP_12 GFRP A-SANDWICH HONEYCOMB 0,75ml WATER
GROUP D DOTNAC_GFRP_13 GFRP C-SANDWICH ROHACELL WITH INSERTS
DOTNAC_GFRP_14 GFRP C-SANDWICH HONEYCOMN WITH INSERTS
DOTNAC_GFRP_15 GFRP C-SANDWICH ROHACELL 0,2ml WATER
DOTNAC_GFRP_16 GFRP C-SANDWICH ROHACELL 0,35ml WATER
DOTNAC_GFRP_17 GFRP C-SANDWICH ROHACELL 0,75ml WATER
DOTNAC_GFRP_18 GFRP C-SANDWICH HONEYCOMB 0,2ml WATER
DOTNAC_GFRP_19 GFRP C-SANDWICH HONEYCOMB 0,35ml WATER
DOTNAC_GFRP_20 GFRP C-SANDWICH HONEYCOMB 0,75ml WATER
GROUP E DOTNAC_CFRP_11 CFRP WITH 6J IMPACT
DOTNAC_CFRP_12 CFRP WITH 7J IMPACT
DOTNAC_CFRP_13 CFRP WITH 8J MPACT
DOTNAC_CFRP_14 CFRP WITH 9J IMPACT
DOTNAC_CFRP_15 CFRP WITH 10J IMPACT
Table 1: List of calibration samples

DOTNAC Doc. D7.34
Date: 15-JUL-2013
Issue:
Page: 9 of 33
© DOTNAC
Table 2: Summary of defects in calibration samples

DOTNAC Doc. D7.34
Date: 15-JUL-2013
Issue:
Page: 10 of 33
© DOTNAC
2.4 Test samples
A summary of the test samples is presented in the following two tables. Table 3 is focusing on the
laminate and sandwich samples with either delaminations, disbonds or porosity. Table 4 is focusing on
the CFRP samples with coating misprocess. Table 5 shows a summary of the defects for the test
samples. A complete description of the test samples can be found in delivery D1.5.
"GROUP G": A-Sandwich (H/C) and C-Sandwich (H/C) panels with real disbonds or delaminations
Reference DESCRIPTION A-SNDW1 A-Sandwich sample (H/C) with disbond between skin & adhesive sheet
A-SNDW2 A-Sandwich sample (H/C) with disbond between adhesive & core
A-SNDW3 A-Sandwich sample (H/C) with disbond between skin & adhesive sheet
C-SNDW1 C-Sandwich sample (H/C) with disbond between inner skin & adhesive sheet
C-SNDW2 C-Sandwich sample (H/C) with disbond between inner adhesive & core
C-SNDW3 C-Sandwich sample (H/C) with delamination within inner skin
"GROUP H": A-Sandwich (Rohacell core) panels with real disbonds
Reference DESCRIPTION A-SNDW4_RHC A-Sandwich sample (RHC) with disbond between skin & adhesive sheet
A-SNDW5_RHC A-Sandwich sample (RHC) with disbond between adhesive & core
"GROUP I": Solid laminate (Fiberglass) samples with real delaminations
Reference DESCRIPTION FG_LAM_DEL1 Fiberglass solid laminate 14 plies (~3.5 mm thick) with real delaminations
FG_LAM_DEL2 Fiberglass solid laminate 20 plies (~5 mm thick) with real delaminations
FG_LAM_DEL3 Fiberglass solid laminate 20 plies (~5 mm thick) with real delaminations and polyurethane coating
"GROUP J": Solid laminate (Fiberglass) samples with real porosity
Reference DESCRIPTION FG_LAM_REF Fiberglass solid laminate 14 plies (~3.5 mm thick) reference plate
FG_LAM_POR1 Fiberglass solid laminate 14 plies (~3.5 mm thick) with high porosity level
Table 3: List of test samples with delaminations, disbonds or porosity

DOTNAC Doc. D7.34
Date: 15-JUL-2013
Issue:
Page: 11 of 33
© DOTNAC
Misprocess with RE coating (*)
with PU coating (**)
Summation
Reference 2 2 4
w/o sanding of the surface 1 1 2
Surface contamination w/o clean: 4 4 8
Es 1. Oil
2. Release agent
3. Water
4. Powder
Surface contamination followed by incomplete clean:
4 4 8
1. Oil
2. Release agent
3. Water
4. Powder
w/o primer 1 1 2
w/o red primer prior RE layer 1 0 1
Application of topcoat on a one week aged primer without sanding the primer, only cleaning the surface with a solvent
1 1 2
Application of topcoat on a one week aged primer without sanding the primer and without cleaning the surface
1 1 2
Application of topcoat on a one week aged primer without sanding the primer, only incomplete cleaning of the surface with a solvent/alcohol from:
2 2 4
1. Oil
2. Water
Incorrect RE layer thickness 50, 100, 150 µm (normal ~ 250 µm)
3 0 3
Incorrect primer layer thickness 60 - 100 µm (normal ~30 µm)
1 1 2
TOTAL 21 17 38
(*) RE coating: Rain Erosion
(**) PU coating: Polyurethane coating
Table 4: List of test samples with coating misprocess
DOTNAC Doc. D7.34
Date: 15-JUL-2013
Issue:
Page: 12 of 33
© DOTNAC
Table 5: Summary of defects in the test samples
2.5 Comparative Study of Results for Calibration Samples
2.5.1 Introduction
For each sample the different NDT techniques were compared. In an attempt to save space in the
following plots each technique is described by a short abbreviation instead of its full name. Meaning of
the different abbreviations is provided in the following table.
Abbreviation Full technique name
FMCW-THz Frequency Modulated Continuous Wave Terahertz
TD-THz Time Domain Terahertz
UT Ultrasound (pulse echo, through transmission)
IWEX Inverse Wave Field Extrapolation Ultrasound
IRT Infrared Thermography
RT Digital X-Ray radiography
Table 6: Meaning of the abbreviations

DOTNAC Doc. D7.34
Date: 15-JUL-2013
Issue:
Page: 13 of 33
© DOTNAC
2.5.2 Impact Damage in Carbon Fiber Laminates (CFRP)
Figure 1: Comparative Study for the CFRP impact samples
Best results are obtained by ultrasonic tests (Pulse Echo or IWEX) and by TD-THz. NDT-THz is thus
one of the preferred methods.
GOOD DETECTION
BAD DETECTION
Pulse Echo

DOTNAC Doc. D7.34
Date: 15-JUL-2013
Issue:
Page: 14 of 33
© DOTNAC
2.5.3 Impact Damage in Glass Fiber Laminates
Figure 2: Comparative Study for the glass fiber impact samples
Best results are obtained by the THz and IRT (infrared thermography) methods. THz is therefore one of
the best method.
GOOD DETECTION
BAD DETECTION

DOTNAC Doc. D7.34
Date: 15-JUL-2013
Issue:
Page: 15 of 33
© DOTNAC
2.5.4 Water Inclusion
Figure 3: Comparative Study for water inclusion samples
Best results are obtained by IRT that can detect all kind of water inclusion either within honeycomb or
syntactic foam. On the other hand very good results are also obtained by THz on honeycomb structures.
Since water inclusion essentially occurs in honeycomb structures we can conclude that THz is by far
one of the best methods for water detection in composite sandwich structures.
GOOD DETECTION
BAD DETECTION

DOTNAC Doc. D7.34
Date: 15-JUL-2013
Issue:
Page: 16 of 33
© DOTNAC
2.5.5 Teflon Inclusion in Glass Fiber Samples (Solid Laminates, A & C-sandwich Structures)
Teflon inclusions are generally considered as delamination simulation. Results are analysed on different
types of samples: Solid laminates, A-sandwich and C-sandwich structures.
GOOD DETECTION
BAD DETECTION
GOOD DETECTION
BAD DETECTION
A-SANDWICH ROHACELL
Solid Laminate

DOTNAC Doc. D7.34
Date: 15-JUL-2013
Issue:
Page: 17 of 33
© DOTNAC
A-SANDWICH HONEYCOMB
GOOD DETECTION
BAD DETECTION
C-SANDWICH ROHACELL GOOD
DETECTION
BAD

DOTNAC Doc. D7.34
Date: 15-JUL-2013
Issue:
Page: 18 of 33
© DOTNAC
Figure 4: Comparative results for the teflon inclusion glass fiber samples
Figure 5: FMCW THz results for teflon inclusion on solid laminate and C-sandwich
honeycomb samples From these results we can have several observations as follows:
1. FMCW THz and UT (Ultrasound) are the best methods for teflon inclusion detection within glass fiber
composite structures.
2. FMCW THz shows some advantages over Ultrasound for A-sandwich foam core of 5 mm thickness.
3. FMCW THZ shows significant advantages over Ultrasound for C-sandwich foam core of 10 mm thickness.
The main conclusion from these results is that THz has a better penetration and sensitivity than Ultrasound
for thick foam sandwich structures.
C-SANDWICH HONEYCOMB GOOD
DETECTION
BAD DETECTION

DOTNAC Doc. D7.34
Date: 15-JUL-2013
Issue:
Page: 19 of 33
© DOTNAC
2.5.6 Stuck Inclusion in Glass Fiber Samples (Solid Laminates, A & C-sandwich Structures)
SOLID LAMINATE
GOOD DETECTION
BAD DETECTION
A-SANDWICH ROHACELL
GOOD DETECTION
BAD DETECTION

DOTNAC Doc. D7.34
Date: 15-JUL-2013
Issue:
Page: 20 of 33
© DOTNAC
A-SANDWICH HONEYCOMB GOOD
DETECTION
BAD DETECTION
C-SANDWICH ROHACELL GOOD
DETECTION
BAD DETECTION
DOTNAC Doc. D7.34
Date: 15-JUL-2013
Issue:
Page: 21 of 33
© DOTNAC
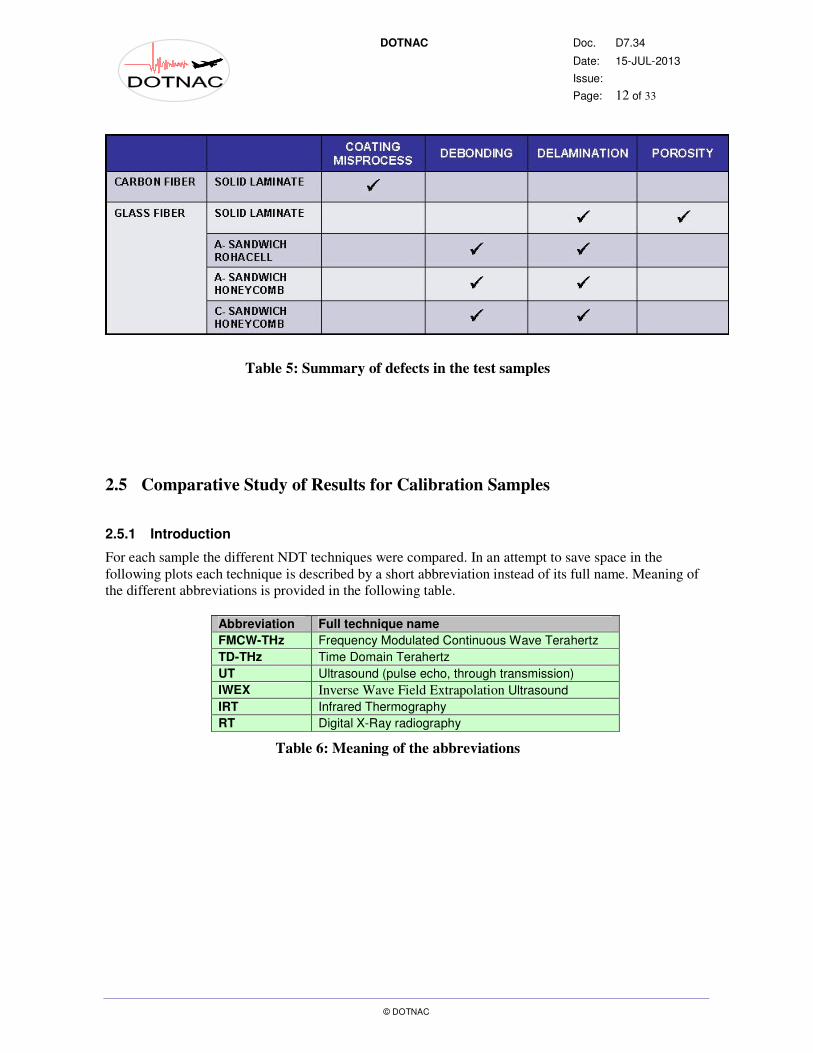
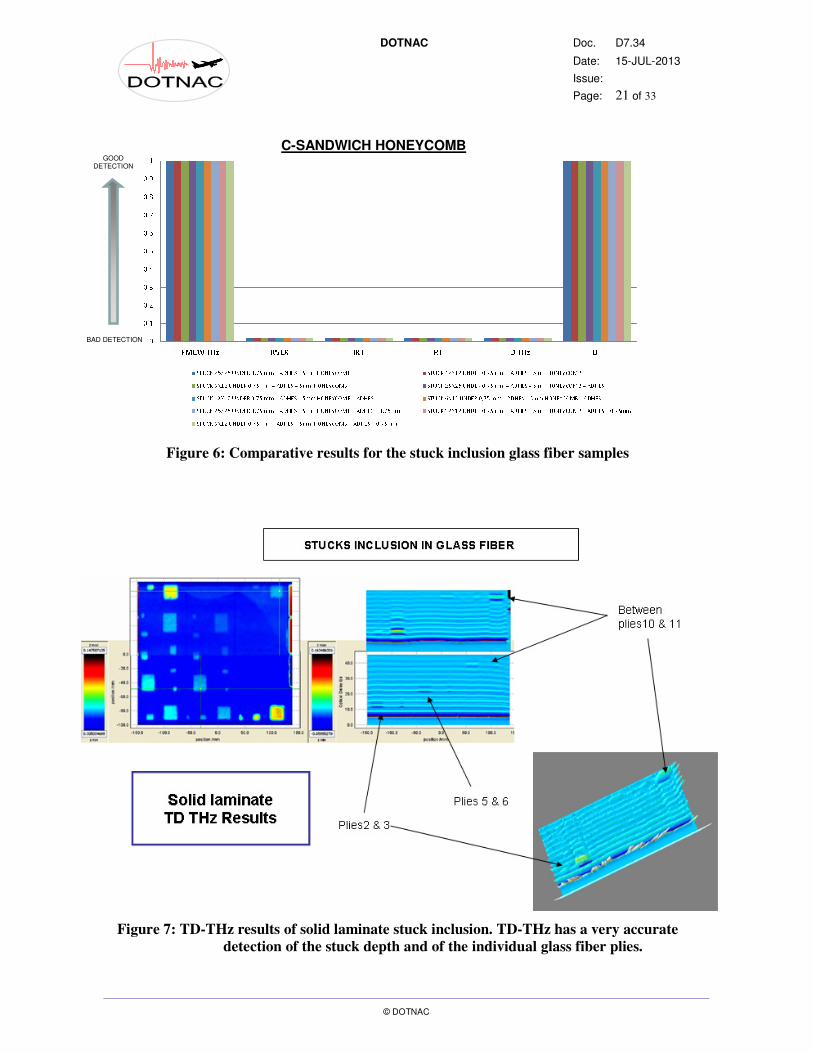
Figure 6: Comparative results for the stuck inclusion glass fiber samples
Figure 7: TD-THz results of solid laminate stuck inclusion. TD-THz has a very accurate
detection of the stuck depth and of the individual glass fiber plies.
C-SANDWICH HONEYCOMB GOOD
DETECTION
BAD DETECTION
DOTNAC Doc. D7.34
Date: 15-JUL-2013
Issue:
Page: 22 of 33
© DOTNAC
The conclusions are very similar than for teflon inclusion: FMCW-THz and UT are the best techniques.
FMCW is more sensitive than UT for foam core sandwich structures. In addition we can see the very high
accuracy of TD-THz in depth localization of defects. Individual glass fiber plies can be viewed and the
actual depth location is clearly seen. This is a significant advantage over ultrasound that can also determine
defect depth but not to the same accuracy since it can’t view individual laminate layers.
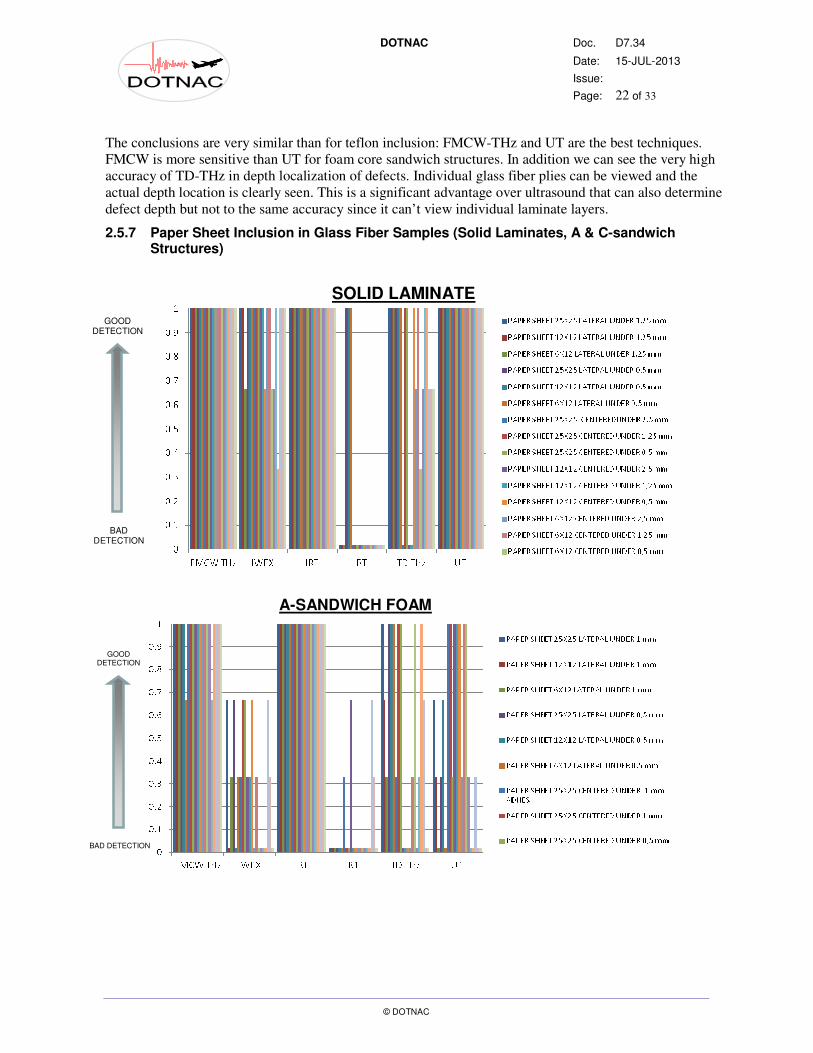
2.5.7 Paper Sheet Inclusion in Glass Fiber Samples (Solid Laminates, A & C-sandwich Structures)
SOLID LAMINATE
GOOD DETECTION
BAD DETECTION
GOOD DETECTION
BAD DETECTION
A-SANDWICH FOAM

DOTNAC Doc. D7.34
Date: 15-JUL-2013
Issue:
Page: 23 of 33
© DOTNAC
Figure 8: Comparative results for for the paper sheet inclusion glass fiber samples
GOOD DETECTION
BAD DETECTION
A-SANDWICH HONEYCOMB
GOOD DETECTION
BAD DETECTION
C-SANDWICH FOAM
GOOD DETECTION
BAD DETECTION
C-SANDWICH HONEYCOMB

DOTNAC Doc. D7.34
Date: 15-JUL-2013
Issue:
Page: 24 of 33
© DOTNAC
Figure 9: FMCW-THz results of paper sheet inclusion in solid laminate and C-sandwich
foam samples
From these results we can see that FMCW-THz and UT are the best fitted techniques. FMCW-THz shows
better sensitivity than UT on sandwich structures.
DOTNAC Doc. D7.34
Date: 15-JUL-2013
Issue:
Page: 25 of 33
© DOTNAC
2.6 Comparative Study of Results for Test Samples
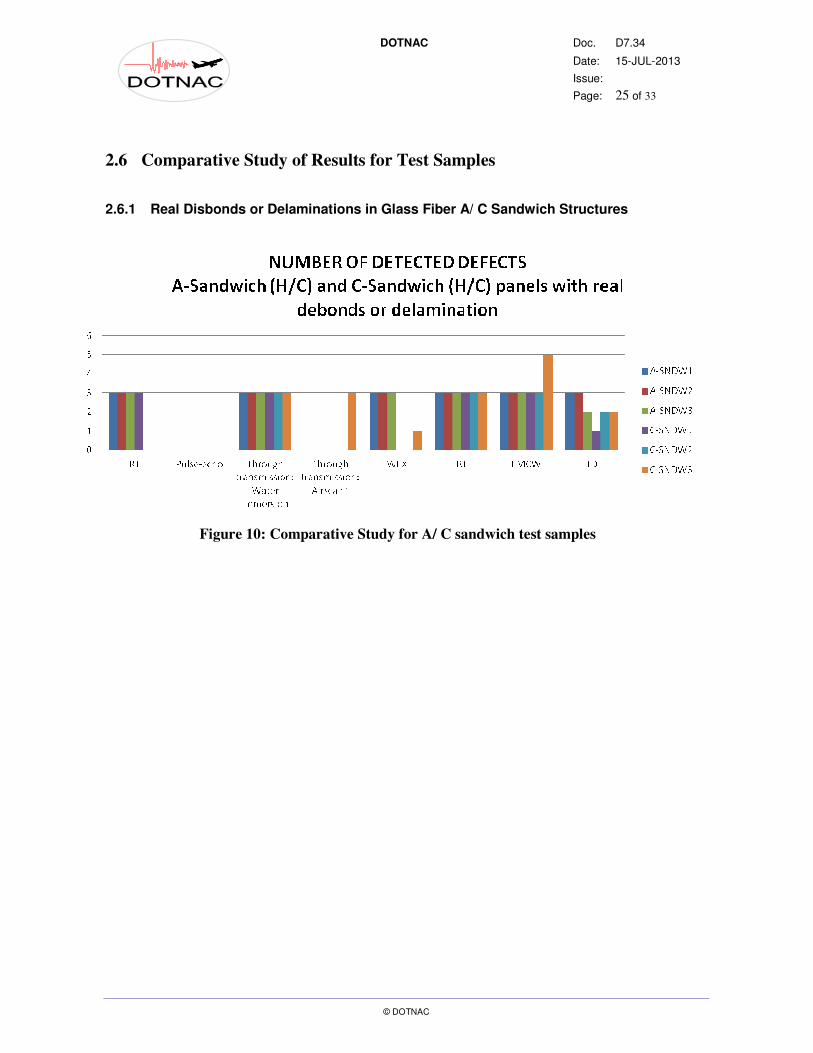
2.6.1 Real Disbonds or Delaminations in Glass Fiber A/ C Sandwich Structures
Figure 10: Comparative Study for A/ C sandwich test samples

DOTNAC Doc. D7.34
Date: 15-JUL-2013
Issue:
Page: 26 of 33
© DOTNAC
Figure 11: TD-THz and FMCW-THz results on A-sandwich honeycomb test sample.
Disbonds are accurately detected. TD-THz also detects the actual disbond depth
below the 3 plies skin of glass fiber
The comparative study on A and C sandwich shows that FMCW-THz is one of the most sensitive
techniques.
TD-THz has lower sensitivity but can provide valuable information regarding depth of defect. In the
example of figure 11 TD-THz actually verifies that the defect is a disbond between the honeycomb and the
three plies skin cover. If the defect was a delamination within the skin we would have expected to get the
return signal earlier.
TD-THz
FMCW-THz A-SANDWICH HONEYCOMB

DOTNAC Doc. D7.34
Date: 15-JUL-2013
Issue:
Page: 27 of 33
© DOTNAC
2.6.2 Real Delaminations in Solid Laminate Structures
Figure 12: Comparative Study for Solid Laminate Test Samples
From these results we can see that the best methods for defect detection are ultrasonic “pulse echo” or
“through transmission”. Sensitivity improvements are still required in THz for real delamination detection.
2.6.3 Coating Misprocess on CFRP laminates (carbon fiber)
Misprocess coating experiment is described in table 4. Table 7 is a list with identification of each
sample. Figures 13 and 14 show a comparative analysis with the other NDT methods.
CFRP samples with coating misprocesses
REFERENCE DESCRIPTION
CFRP_RE_01_A CFRP REFERENCE (RE)
CFRP_RE_01_B CFRP REFERENCE (RE)
CFRP_RE_02 WITHOUT SANDING OF THE SURFACE (RE)
CFRP_RE_03_A SURFACE CONTAMINATION WITHOUT CLEAN OIL (RE)
CFRP_RE_03_B SURFACE CONTAMINATION WITHOUT CLEAN RELEASE AGENT (RE)
CFRP_RE_03_C SURFACE CONTAMINATION WITHOUT CLEAN WATER (RE)
CFRP_RE_03_D SURFACE CONTAMINATION WITHOUT CLEAN POWDER (RE)
CFRP_RE_04_A SURFACE CONTAMINATION FOLLOWED BY INCOMPLETE CLEAN OIL (RE)
CFRP_RE_04_B SURFACE CONTAMINATION FOLLOWED BY INCOMPLETE CLEAN RELEASE AGENT (RE)
CFRP_RE_04_C SURFACE CONTAMINATION FOLLOWED BY INCOMPLETE CLEAN WATER (RE)
CFRP_RE_04_D SURFACE CONTAMINATION FOLLOWED BY INCOMPLETE CLEAN POWDER (RE)
CFRP_RE_05 CFRP WITHOUT PRIMER (RE)
CFRP_RE_06 CFRP WITHOUT RED PRIMER PRIOR RE LAYER
CFRP_RE_07 APPLICATION OF TOPCOAT ON A ONE WEEK AGED PRIMER WITHOUT SANDING THE PRIMER, ONLY CLEANING THE SURFACE WITH A SOLVENT (RE)
CFRP_RE_08 APPLICATION OF TOPCOAT ON A ONE WEEK AGED PRIMER WITHOUT SANDING THE PRIMER AND WITHOUT CLEANING THE SURFACE (RE)

DOTNAC Doc. D7.34
Date: 15-JUL-2013
Issue:
Page: 28 of 33
© DOTNAC
CFRP_RE_09_A
APPLICATION OF TOPCOAT ON A ONE WEEK AGED PRIMER WITHOUT SANDING THE PRIMER, ONLY INCOMPLETE CLEANING OF THE SURFACE WITH A SOLVENT/ALCOHOL FROM OIL (RE)
CFRP_RE_09_B
APPLICATION OF TOPCOAT ON A ONE WEEK AGED PRIMER WITHOUT SANDING THE PRIMER, ONLY INCOMPLETE CLEANING OF THE SURFACE WITH A SOLVENT/ALCOHOL FROM WATER (RE)
CFRP_RE_10_A INCORRECT RE LAYER THICKNESS 50µm
CFRP_RE_10_B INCORRECT RE LAYER THICKNESS 100µm
CFRP_RE_10_C INCORRECT RE LAYER THICKNESS 150µm
CFRP_RE_11 INCORRECT PRIMER LAYER THICKNESS 60-100µm (RE)
CFRP_PU_01_A CFRP REFERENCE (PU)
CFRP_PU_01_B CFRP REFERENCE (PU)
CFRP_PU_02 WITHOUT SANDING OF THE SURFACE (PU)
CFRP_PU_03_A SURFACE CONTAMINATION WITHOUT CLEAN OIL (PU)
CFRP_PU_03_B SURFACE CONTAMINATION WITHOUT CLEAN RELEASE AGENT (PU)
CFRP_PU_03_C SURFACE CONTAMINATION WITHOUT CLEAN WATER (PU)
CFRP_PU_03_D SURFACE CONTAMINATION WITHOUT CLEAN POWDER (PU)
CFRP_PU_04_A SURFACE CONTAMINATION FOLLOWED BY INCOMPLETE CLEAN OIL (PU)
CFRP_PU_04_B SURFACE CONTAMINATION FOLLOWED BY INCOMPLETE CLEAN RELEASE AGENT (PU)
CFRP_PU_04_C SURFACE CONTAMINATION FOLLOWED BY INCOMPLETE CLEAN WATER (PU)
CFRP_PU_04_D SURFACE CONTAMINATION FOLLOWED BY INCOMPLETE CLEAN POWDER (PU)
CFRP_PU_05 CFRP WITHOUT PRIMER (PU)
CFRP_PU_07 APPLICATION OF TOPCOAT ON A ONE WEEK AGED PRIMER WITHOUT SANDING THE PRIMER, ONLY CLEANING THE SURFACE WITH A SOLVENT (PU)
CFRP_PU_08 APPLICATION OF TOPCOAT ON A ONE WEEK AGED PRIMER WITHOUT SANDING THE PRIMER AND WITHOUT CLEANING THE SURFACE (PU)
CFRP_PU_09_A
APPLICATION OF TOPCOAT ON A ONE WEEK AGED PRIMER WITHOUT SANDING THE PRIMER, ONLY INCOMPLETE CLEANING OF THE SURFACE WITH A SOLVENT/ALCOHOL FROM OIL (PU)
CFRP_PU_09_B
APPLICATION OF TOPCOAT ON A ONE WEEK AGED PRIMER WITHOUT SANDING THE PRIMER, ONLY INCOMPLETE CLEANING OF THE SURFACE WITH A SOLVENT/ALCOHOL FROM WATER (PU)
CFRP_PU_11 INCORRECT PRIMER LAYER THICKNESS 60-100µm (PU)
Table 7: List and identification of miscoating samples

DOTNAC Doc. D7.34
Date: 15-JUL-2013
Issue:
Page: 29 of 33
© DOTNAC
Figure 13: Comparative analysis for the CFRP samples with RE (Rain Erosion) coating
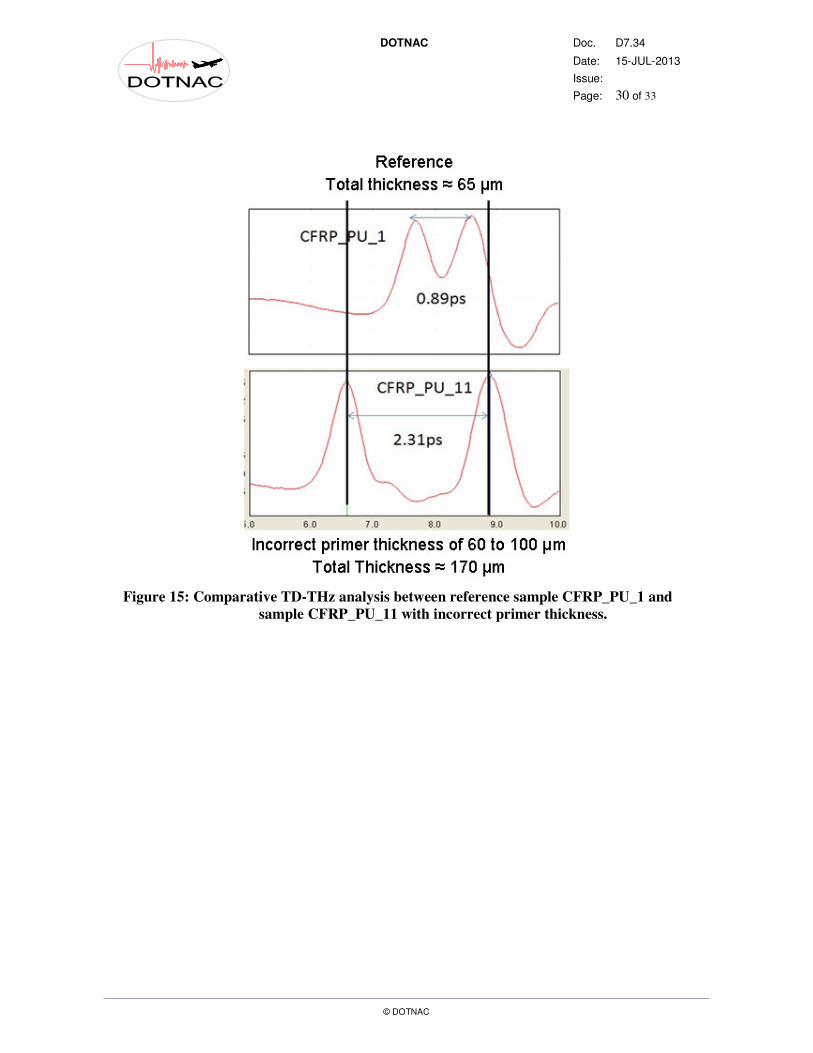
Figure 14: Comparative analysis for the CFRP samples with PU (polyurethane) coating From the results shown in figures 13 and 14 it appears that TD-NDT is the only method that can provide
information on the coating quality. Figure 15 below shows a clear example of miscoating detection.
DOTNAC Doc. D7.34
Date: 15-JUL-2013
Issue:
Page: 30 of 33
© DOTNAC
Figure 15: Comparative TD-THz analysis between reference sample CFRP_PU_1 and
sample CFRP_PU_11 with incorrect primer thickness.

DOTNAC Doc. D7.34
Date: 15-JUL-2013
Issue:
Page: 31 of 33
© DOTNAC
3 Assessment of NDT-THz Potential for Composites
An overall summary of the NDT-THz capability is presented in the following two figures.
From these two figures we can see that the FMCW-THz technique shows a high sensitivity to most of
the investigated NDT issues in this project. TD-THz shows lower detection sensitivity. This difference
can be related to two effects:
1. Lower intensity of the signal at the efficient working waveband (100 - 500 GHz). FMCW-THz is
optimized to the actual used frequency band that is in the 100-350 GHz range, and therefore has

DOTNAC Doc. D7.34
Date: 15-JUL-2013
Issue:
Page: 32 of 33
© DOTNAC
much lower losses in the active range. On the other hand, TD-THz that is broadband (0.1 to 1
THz) suffers from losses in the whole range. More powerful THz sources could counterbalance
these high losses.
2. High converging optics that were used in the experiments in order to get high spatial resolution.
This caused a small depth of field (or Rayleigh length) that drastically limited beam penetrability
within the tested samples.
The second effect mentioned above should be considered as the main reason that limited the efficiency
of TD-THz. Practically most of the defects at higher than half sample depth remained undetected, while
defects at the first half depth and mid range were generally detected at a very high accuracy. By looking
at the results it seems that by using less converging optics we wouldn’t have lost much in spatial
resolution but at the same time we would have obtained a significant gain in penetrability. Preliminary
tests performed at the end of the project showed that with less converging optics higher depth of field
could be provided and by this way we could actually detect and localize (in depth) flaws at deeper
depths such as 5 mm in glass fiber laminates and 10 or 20 mm in honeycomb C-sandwich structures.
This issue should be further investigated in the scope of a future project.
.
A second difference between FMCW-THz and TD-THz has to be mentioned. The FMCW-THz allows
quick scanning of parts with high detection sensitivity. Practically all calibration and test samples could
be scanned in very short times of 5 to 20 sec depending on their sizes. In contrast to this TD-THz is time
consuming and requires several hours per sample for complete scanning. Looking at this we can
conclude that a combination of the two techniques could be the ideal method. First a rapid scanning of
the tested part by FMCW, providing high sensitivity defect detection in short times and then a more
localized TD-THz scanning at the critical area in order to get more accurate defect information (in size
and depth).
The main point that is still unresolved with THz is for dielectric structures with “porosity”. THz has not
provided valuable results in porosity analysis. This issue needs to be further investigated in the future.

DOTNAC Doc. D7.34
Date: 15-JUL-2013
Issue:
Page: 33 of 33
© DOTNAC
4 Conclusions
Regarding the feasibility of a THz application in aeronautics, i.e. inspection of dielectric parts, the THz
technology has proved to be a valuable technique for NDT. The technique is able to detect:
1. Delaminations and foreign inclusions in dielectric laminates such as glass fiber laminates.
2. Delaminations and disbonds in dielectric sandwich structures such as A-sandwich or C-
sandwich structures with either honeycomb or syntactic foam cores.
In addition the technique is very sensitive to coating misprocess on conductive substrate such as CFRP
and probably to the same extent on dielectric substrates such as glass fiber.
On the other hand THz failed to detect porosity in glass fiber laminates. The capability of THz NDT for
porosity detection should be further investigated.
In comparison with the classical NDT techniques, NDT-THz looks very competitive. It does not require
high and costly radiation protection such as for X-Ray radiography and is totally non contact in contrast
with ultrasound.
A combination of the two techniques investigated in this project, FMCW and TD THz, seems to be the
ideal way of applying THz in NDT. FMCW-THz can provide fast scanning at high detection sensitivity.
TD-THz can complete the data at the critical area by providing very accurate measures of defect sizes
and depth.
5 Bibliography
1. Emerging NDE Technologies and Challenges at the Beginning of the 3rd
Millennium, Y.
Bar-Cohen, NDT.net - February 2000, Vol. 5 No.02.
2. Optoélectronique Térahertz, J. L. Coutaz, ISBN 978-2-86883-975-6, EDP Sciences, 2008.
3. IWEX: A New Ultrasonic Array Technology for Direct Imaging of Subsurface Defects, K.
Chougrani, N Pörtzgen, 17th World Conference on Nondestructive Testing, 25-28 Oct 2008,
Shanghai, China.
4. Experimental Comparison of Wave-field Based Ultrasonic Imaging with other Advanced
Ultrasonic Weld Inspection Techniques, X. Deleye, L. Hörchens, K. Chougrani, 18th World
Conference on Nondestructive Testing, 16-20 April 2012, Durban, South Africa.


