PROJECT ON HEALTH PROMOTION AND
PREVENTIVE CARE MEASURES OF CHRONIC NCDS
FINAL REPORT
MARCH 2013
JAPAN INTERNATIONAL COOPERATION AGENCY (JICA)
GLOBAL LINK MANAGEMENT, INC. SL
JR
13-002
Democratic Socialist Republic of Sri Lanka
Ministry of Health

The following foreign exchange rates are applied in the study
(as of February 2013)
USD 1 = 91.04 JPY
LKR 1 = 0.72 JPY
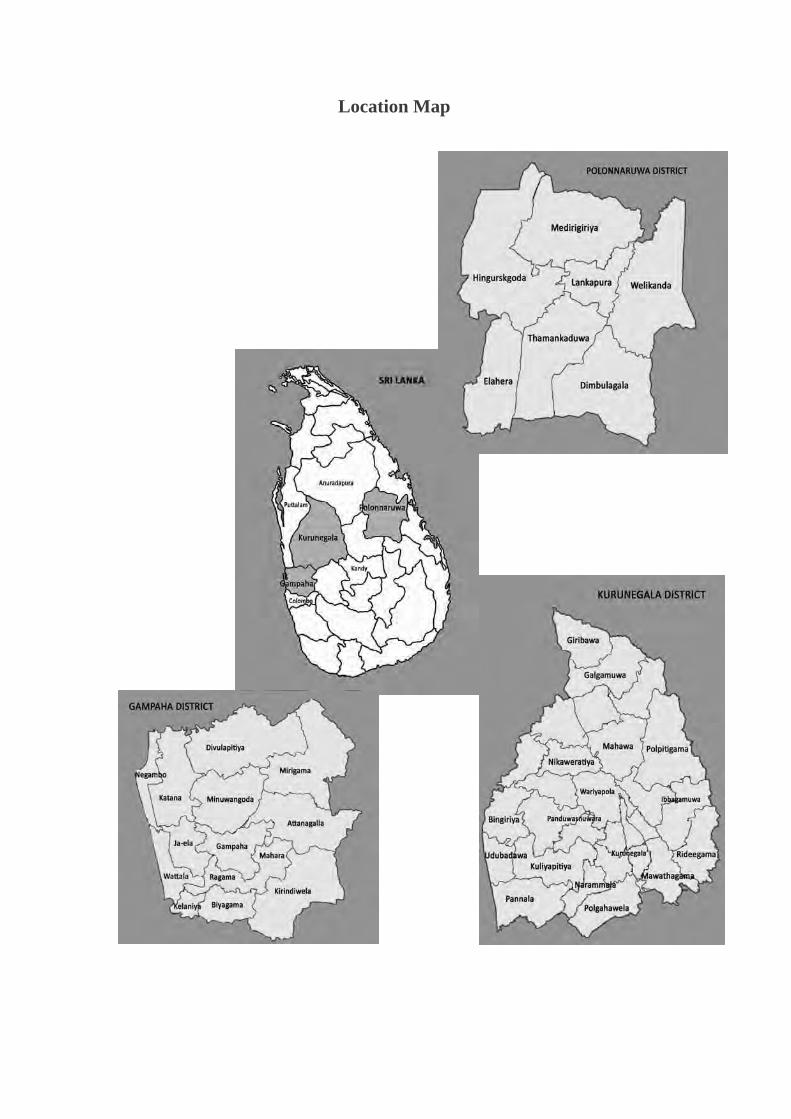
Location Map

Abbreviations
AMO Assistant Medical Officer
BH Base Hospital
BHA, BHB Base Hospital type A, Base Hospital type B
BMI Body Mass Index
CD Central Dispensary
CI Confidence Interval
CVD Cardio-vascular diseases
DDG/DS Deputy Director General, Dental Services
DDG/ET&R Deputy Director General, Education, Training & Research
DDG/F Deputy Director General, Finance
DDG/LS Deputy Director General, Laboratory Services
DDG/MS Deputy Director General, Medical Services
DDG/P Deputy Director General, Planning
DDG/PHS Deputy Director General, Public Health Services
DG Director General
DGH District General Hospital
DH District Hospital
DM Diabetes Mellitus
ECG Electrocardiograph
ECU Emergency Care Unit
ET&R Education, Training and Research
FBG Fasting Blood Glucose
FY Fiscal Year
GH General Hospital
GoSL Government of Sri Lanka
GPT(ALT) Glutamic Pyruvic Transaminase
HC Health Check-up (subgroup)
HDL High Density Lipoproteins
HEB Health Education Bureau
HEO Health Education Officer
HI Health Information (subgroup)
HLC Healthy Lifestyle Centre(s)
HMP Health Master Plan
HR Hazard Ratio
HT Hypertension
HP Health Promotion (subgroup)
HRH Human Resources for Health
HSDP Health Sector Development Programme
ICB International Competitive Bidding
ICU Intensive Care Unit
IEC Information, Education and Communication
IDA International Development Association
IFG Impaired Fasting Glycaemia
IHD Ischaemic Heart Disease
IMMR Indoor Mortality and Morbidity Return
JCC Joint Coordinating Committee
JICA Japan International Cooperation Agency
JPY Japanese Yen
LDL Lipid Density Lipoproteins
MCH Maternal and Child Health
MET Metabolic equivalent for Task
MI Myocardial Infarction
MLT Medical Laboratory Technologist
MO Medical Officer
MoH Ministry of Health
MOH Medical Officer of Health, or Medical Office of Health
NABNCD National Advisory Body for NCDs
N/A Not Available
NAFLD Non Alcoholic Fatty Liver Disease
NC North Central Province
NCD Non-Communicable Diseases
NHSL National Hospital of Sri Lanka
NO Nursing Officer
NPP NCD Prevention Project
NW North Western Province
OPD Outpatient Department
OR Odds Ratio
p Probability value
PEN Package of Essential NCD interventions for primary health care in low-resource settings
PDHS Provincial Director of Health Services
PDM Project Design Matrix
PGH Provincial General Hospital
PGIM Post Graduate Institute for Medicine
PH Provincial Hospital
PHI Public Health Inspector
PHM Public Health Midwife
PMCU Primary Medical Care Units
PPA Programme Planning Assistant
PU Peripheral Unit
PY Person Years
RDHS Regional Director of Health Services
RH Rural Hospital
RHS Ragama Health Study
RMO Registered Medical Officer
Rs Sri Lankan Rupees
SD Standard Deviation
SLDCS Sri Lanka Diabetes and Cardiovascular Study
STEPS STEPwise approach to surveillance
TAG Triacylglycerol
TH Teaching Hospital
TOT Training of Trainers

ToR Terms of Reference
TWG Technical Working Group
USD United States Dollars
VP Visiting Physician
WB World Bank
WHO World Health Organization

Table of Contents
CHAPTER 1 INTRODUCTION .................................................................................... 1 1.1 NCD Situation in Sri Lanka ............................................................................................................. 1 1.2 Challenges of the Ministry of Health (MoH) ................................................................................... 2
1.2.1 Formulation of the NCD policy ............................................................................................. 2 1.2.2 Implementation of NCD policy and programmes .................................................................. 3 1.2.3 Risk factor surveillance .......................................................................................................... 4 1.2.4 Mapping NCD-related research ............................................................................................. 4 1.2.5 Multi-sectorial coordination .................................................................................................. 5
1.3 International Trends and NCD Prevention Partners in Sri Lanka ................................................. 6 1.3.1 International trends on NCD prevention ............................................................................... 6 1.3.2 NCD prevention partners in Sri Lanka ................................................................................. 7
1.4 NCD Prevention Project (NPP) ........................................................................................................ 9 1.4.1 Background ............................................................................................................................ 9 1.4.2 Project components .............................................................................................................. 10 1.4.3 Implementation structure ..................................................................................................... 11
CHAPTER 2 NCD Risk Factors .................................................................................. 14 2.1 Introduction ..................................................................................................................................... 14 2.2 Background Information about Ragama Health Study (RHS) ..................................................... 14
2.2.1 Purpose of the RHS .............................................................................................................. 14 2.2.2 RHS study setting ................................................................................................................. 14 2.2.3 RHS population .................................................................................................................... 15 2.2.4 RHS examination items ........................................................................................................ 15 2.2.5 RHS ethical aspect ................................................................................................................ 15
2.3 Methodology of Follow-up Risk Factor Survey ............................................................................. 16 2.3.1 Design ................................................................................................................................... 16 2.3.2 Variables for the follow-up studies ...................................................................................... 16 2.3.3 Statistical methods ................................................................................................................ 17
2.4 Analysis of the Baseline Data ......................................................................................................... 17 2.5 Results of the Follow-up Study ....................................................................................................... 19
2.5.1 Participants ........................................................................................................................... 19 2.5.2 Outcome data ........................................................................................................................ 20
2.6 Discussion ........................................................................................................................................ 26 2.6.1 Prevalence of NCDs ............................................................................................................. 26 2.6.2 Risk factors ........................................................................................................................... 26
2.7 Recommendations ........................................................................................................................... 27 2.8 Limitations ....................................................................................................................................... 28
CHAPTER 3 NPP models for NCD prevention ........................................................... 29 3.1 Screening Model .............................................................................................................................. 29
3.1.1 Development structure and system ....................................................................................... 29 3.1.2 A transition of screening models .......................................................................................... 30 3.1.3 Information system ............................................................................................................... 36 3.1.4 Treatment strategies ............................................................................................................. 37 3.1.5 Referral and back-referral ................................................................................................... 38
3.2 Result of Feasibility Test in Pilot Areas ......................................................................................... 38 3.2.1 Main results in Kurunegala ................................................................................................. 38 3.2.2 Main results in Polonnaruwa .............................................................................................. 39
3.3 Initial Effects of Health Check-up ................................................................................................. 39 3.3.1 Follow-up survey for people at high risk of CVD ............................................................... 39 3.3.2 Effects of health check-up on improving health promoting behaviours ............................ 43
3.4 Health Guidance Model .................................................................................................................. 44 3.4.1 General health guidance ...................................................................................................... 44 3.4.2 Follow-up health guidance .................................................................................................. 44 3.4.3 Methodologies and tools ....................................................................................................... 45 3.4.4 Training module and mechanisms ....................................................................................... 47
3.5 Health Promotion Model ................................................................................................................ 48 3.5.1 Health promotion – an overview .......................................................................................... 48 3.5.2 Standard procedures for implementing health promotion settings .................................... 50 3.5.3 Implementing health promotion activities ........................................................................... 52 3.5.4 Training of trainers (TOT) ................................................................................................... 53 3.5.5 Health promotion activities in the settings .......................................................................... 54 3.5.6 Monitoring and evaluation ................................................................................................... 57 3.5.7 Capacity development ........................................................................................................... 59
3.6 IEC and the Social Marketing Model ............................................................................................. 60 3.7 Cost Analysis Survey ....................................................................................................................... 61
3.7.1 An outline of cost analysis survey ........................................................................................ 61 3.7.2 Cost analysis survey results .................................................................................................. 63 3.7.3 Cost Analysis and Health Finance Seminar........................................................................ 64
CHAPTER 4 Expansion of NPP models with Healthy Lifestyle Centres ................... 66 4.1 Introducing Healthy Lifestyle Centres ........................................................................................... 66 4.2 Current Situation of HLCs ............................................................................................................. 67 4.3 Financial Planning for HLCs ......................................................................................................... 67
4.3.1 Hypothesis for cost calculation ............................................................................................ 68 4.3.2 Simulation model .................................................................................................................. 68
4.4 Human Resource Implications ....................................................................................................... 69 4.5 NPP Contributions to Expansion of HLCs .................................................................................... 70
4.5.1 Production of guidelines, manuals and tools ...................................................................... 70 4.5.2 DVD production for HLCs ................................................................................................... 71
CHAPTER 5 : Lessons Learnt and Ways Forward ..................................................... 73 5.1 Lessons learnt from NPP ................................................................................................................ 73 5.2 Review of Recommendations Made During the Terminal Evaluation .......................................... 75 5.3 Ways Forward ................................................................................................................................. 78 5.4 Acknowledgements .......................................................................................................................... 80
1
CHAPTER 1 INTRODUCTION
1.1 NCD Situation in Sri Lanka
In terms of health status, Sri Lanka has come a long way since independence. Until recently, the main
focuses have been the control of communicable diseases and reducing maternal and child morbidities
and mortalities through improved sanitary conditions, high coverage of an expanded immunization
programme, and comprehensive maternal and child health services. The epidemiological, demographic
and social transition is shifting the disease pattern from one related to maternal and child health and
communicable diseases to chronic non-communicable diseases (NCDs), such as cardiovascular
disease (CVD), cancer, respiratory disease, diabetes and mental disorders. NCDs are now the leading
cause of mortality, morbidity, and disability in the country.
Over the last few decades, the proportion of deaths due to cardiovascular diseases such as heart
diseases and strokes increased from less than 5 per cent to 30 per cent. During the same period, deaths
due to communicable diseases decreased from 24 per cent to 12 per cent. Mortality rates from NCDs
are currently 20–50 per cent higher in Sri Lanka than in developed countries, with high disparities for
cardiovascular diseases and asthma. In Sri Lanka two-thirds of all deaths in the country can be
attributed to NCDs. Out of total deaths, 29.6 per cent have been attributed to CVDs, 9.4 per cent to
cancers, 8.5 per cent to respiratory diseases and 3.9 per cent to diabetes. Incidence of hospitalization
due to diabetes mellitus, hypertensive disease and ischemic heart disease increased between 2005 and
2010 by 36 per cent, 40 per cent and 29 per cent, respectively1.
Patients with NCDs are largely managed by specialist clinics as long-term outpatients and as inpatients
in higher-level (secondary or tertiary) facilities in the country. Primary health care facilities are not
expected to initiate management of chronic NCDs but only to provide follow-up care in some
lower-level hospitals. A formal referral system is not in place and government policy allows
self-referral on demand to secondary and tertiary facilities. Thus, patients often use these higher-level
facilities, bypassing primary facilities, as these often lack the facilities to perform necessary clinical
investigations and provide medications.
Bed-occupancy rates in 2008 were nearly 85 per cent in higher-level facilities and below 50 per cent in
lower-level facilities. Specialist clinics in secondary and tertiary facilities are overcrowded, managing
65 per cent of chronic NCD cases. Primary care facilities manage follow-up for approximately 33 per
cent of the acute NCD cases. The staff to provide essential clinical investigations and medical
equipment to diagnose and manage NCDs are frequently unavailable at primary and secondary care 1 Ministry of Health (2011). Country Report, Regional Meeting on Health and Development Challenges of
Noncommunicable Diseases, 1-4 March 2011, Jakarta.

2
levels. In addition, at lower-level (primary care) facilities such as divisional hospitals and primary
medical care units, essential medications for treating NCDs are often unavailable2.
Four common shared risk factors for four major chronic NCDs are well-known, namely smoking,
unhealthy diet, physical inactivity and harmful use of alcohol. Prevalence of these risk factors at the
population level has a major influence on morbidity and mortality due to NCDs. The prevalence of
(current) smokers nationwide among adult males is 22.8%, while less than 1 % of females smoke3.
Although a declining trend for smoking has been observed over the past few years, this is not reflected
in a drop of overall sales for tobacco-related products.
Despite a modest consumption of fat (15%-18%) by Sri Lankans, this includes a higher percentage of
saturated fats in the diet compared to unsaturated fats. A higher saturated to unsaturated fat ratio is
considered an important risk factor for the development of cardiovascular diseases.
The daily intake of salt (10g/day) and added sugar (60g/day, based on food consumption data; and 35
g/day, based on individual dietary records) is also high in the Sri Lankan diet when compared to WHO
recommendations. Although the traditional Sri Lankan diet is vegetable-based, a large proportion of
adults (82%) do not consume an adequate amount of vegetables. Despite the availability of an
abundance and variety of fruit in Sri Lanka, average consumption has been found to be inadequate.
A majority of Sri Lankans (78%) are engaged in moderate or higher level physical activities (>600
MET-minutes/week). However, only a small proportion engages regularly in recreational activities.
Females are significantly sedentary (30%) compared to males (19%) and this is also reflected in the
higher mean BMI among females (BMI>=25 among females 30.4%).
The percentage of current drinkers is significantly higher in males (26.0%) compared to females
(1.2%). However, less than five per cent of the male population consumes alcohol more than 4 days
per week.
1.2 Challenges of the Ministry of Health (MoH)
1.2.1 Formulation of the NCD policy
The government of Sri Lanka has acknowledged that the prevention and control of chronic NCDs is a
priority issue in the national health agenda. Priority has been given in the National Health Master Plan
2007-2016 as these diseases lower the quality of life, impair the economic growth of the country and
place a heavy and rising demand on families and national budgets. It is recognized that a significant
proportion of the NCD burden is preventable if evidence-based policies are in place and relevant
2 Engelgau, M., Okamoto, K., Navaratne, K.V., & Gopalan, S. (2010). Prevention and control of selected chronic NCDs in
Sri Lanka: Policy options and action, Working Paper No: 57563. The World Bank. 3 MoH, (2008). Risk Factor Surveillance.
3
programmes are implemented.
Considering these facts, MoH formulated the National Policy for Prevention and Control of Chronic
Non-communicable Diseases in 2010. The emphasis of the National NCD Policy is on promoting the
health and well-being of the population by preventing chronic NCDs through four major prevention
models: primordial, primary, secondary and tertiary prevention. It emphasises prevention of shared
modifiable risk factors (primordial and primary prevention), providing acute and integrated long-term
care for people with NCDs (secondary and tertiary prevention), and maximizing their quality of life.
A series of international policy guidelines on NCDs developed by the World Health Organisation
(WHO) have also been taken into consideration in formulating this policy document. It includes World
Health Assembly Resolution (WHA 57.17): WHO Global Strategy on Diet & Physical Activity, Health
and Preventing Chronic Diseases - A Vital Investment (WHO 2005), and the WHO Strategic
Framework for NCD Control and Prevention 2008-2013.
Four priority actions for prevention and control of NCDs were established by the WHO as the guiding
principles for development of the policy document. These are: addressing risk factors through
multi-stakeholder partnerships, health system strengthening, providing essential medicines and
technology, and ensuring accountability by monitoring and evaluation.
The objective of the NCD policy is to reduce premature mortality (less than 65 years) due to chronic
NCDs by 2% annually over the next 10 years through the expansion of evidence-based curative
services, and individual and community-wide health promotion measures for the reduction of risk
factors. The strategic framework includes nine key strategies to achieve the above objective.
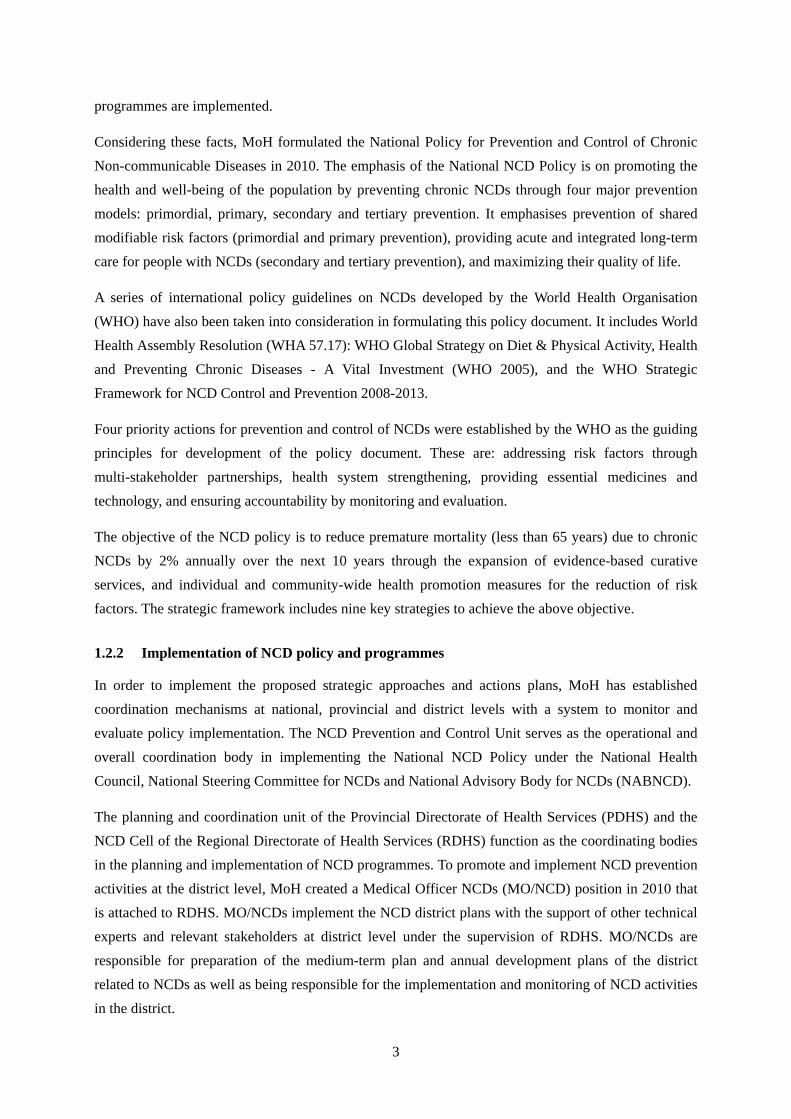
1.2.2 Implementation of NCD policy and programmes
In order to implement the proposed strategic approaches and actions plans, MoH has established
coordination mechanisms at national, provincial and district levels with a system to monitor and
evaluate policy implementation. The NCD Prevention and Control Unit serves as the operational and
overall coordination body in implementing the National NCD Policy under the National Health
Council, National Steering Committee for NCDs and National Advisory Body for NCDs (NABNCD).
The planning and coordination unit of the Provincial Directorate of Health Services (PDHS) and the
NCD Cell of the Regional Directorate of Health Services (RDHS) function as the coordinating bodies
in the planning and implementation of NCD programmes. To promote and implement NCD prevention
activities at the district level, MoH created a Medical Officer NCDs (MO/NCD) position in 2010 that
is attached to RDHS. MO/NCDs implement the NCD district plans with the support of other technical
experts and relevant stakeholders at district level under the supervision of RDHS. MO/NCDs are
responsible for preparation of the medium-term plan and annual development plans of the district
related to NCDs as well as being responsible for the implementation and monitoring of NCD activities
in the district.

4
1.2.3 Risk factor surveillance
The WHO STEPwise approach to surveillance (STEPS) is the recommended tool of the WHO for
surveillance of chronic diseases and their risk factors. STEPS is a sequential process. It starts with
gathering key information on risk factors with a questionnaire, then moves to simple physical
measurements and then to more complex collection of blood samples for biochemical analysis.
Usually, this survey is carried out to gather demographic and behavioural information by questionnaire
in a household setting. Physical measurements are carried out either in a household setting or in a
clinic. Taking blood samples is done in a clinic to measure prevalence of diabetes or raised blood
glucose and abnormal blood lipids.
In Sri Lanka, STEPS risk factor surveillance has been carried out every 5 years from 2003 to describe
the prevalence of non-communicable disease risk factors. The last STEPS surveillance was carried out
in 2007. STEPS surveillance 2007 was a population-based national survey to study selected risk
factors for non-communicable diseases. It consisted of two steps: a questionnaire-based assessment
and physical measurements. The survey was carried out in five randomly selected districts. The
sample size of 12,500 consisted of people aged between 15-64 years.
“STEPS surveillance 2012” has been already initiated and data collection will be carried out in
mid-2013. This time, all three steps will be implemented: a questionnaire, followed by anthropometric
and biochemical measurements to determine behaviour-related non-communicable disease risk factors.
The survey covers a sample population of 6,300 of ages 15-64 years from each province of the
country.
1.2.4 Mapping NCD-related research
In order to uncover the prevalence of NCDs and their risk factors in Sri Lanka, and to assess the
socioeconomic burden they impart on the population, the NCD Unit conducted a research mapping
survey 4 on NCDs, based on the hypotheses of studies conducted by other researchers and
organizations.
This survey was carried out from September to December 2012 in seven libraries/institutions5 by
referring to printed and digital publications. NCD-related local studies, surveys and activities
published between January 1st 1990 and November 30th 2012 were documented in this research
mapping. Altogether 356 publications relating to the topic of NCDs were gathered during a four-month
period, with 241 of them directly related to the prevalence and risk factors of NCDs. The 75 studies
showed the prevalence of NCDs and their risk factors in the general population.
4 Ministry of Health (2012). Abstracts of non communicable diseases and prevalence of risk factors in Sri Lanka, published
from 1990 – 2012. 5 Postgraduate Institute of Medicine (PGIM), Alcohol and Drug Information Centre (ADIC), Sri Lanka Medical
Association (SLMA), National Science Foundation (NSF), World Health Organisation (WHO), University of Colombo and Ministry of Health.
5
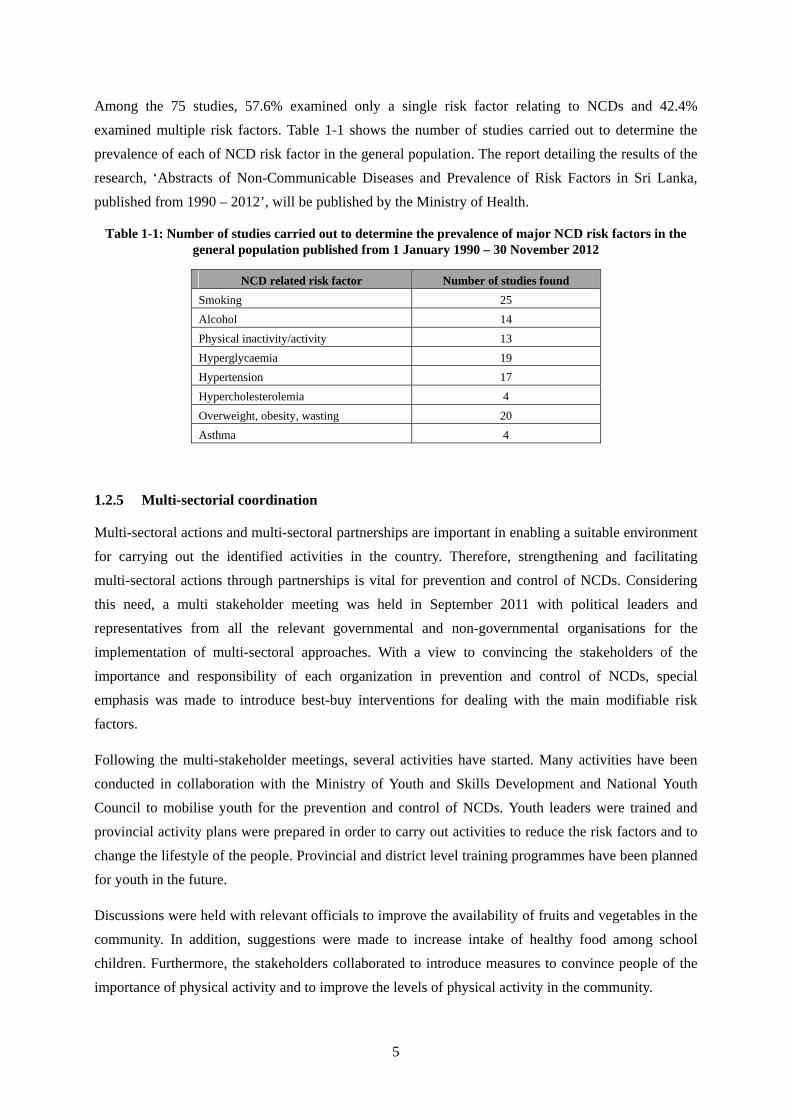
Among the 75 studies, 57.6% examined only a single risk factor relating to NCDs and 42.4%
examined multiple risk factors. Table 1-1 shows the number of studies carried out to determine the
prevalence of each of NCD risk factor in the general population. The report detailing the results of the
research, ‘Abstracts of Non-Communicable Diseases and Prevalence of Risk Factors in Sri Lanka,
published from 1990 – 2012’, will be published by the Ministry of Health.
Table 1-1: Number of studies carried out to determine the prevalence of major NCD risk factors in the general population published from 1 January 1990 – 30 November 2012
NCD related risk factor Number of studies found
Smoking 25
Alcohol 14
Physical inactivity/activity 13
Hyperglycaemia 19
Hypertension 17
Hypercholesterolemia 4
Overweight, obesity, wasting 20
Asthma 4
1.2.5 Multi-sectorial coordination
Multi-sectoral actions and multi-sectoral partnerships are important in enabling a suitable environment
for carrying out the identified activities in the country. Therefore, strengthening and facilitating
multi-sectoral actions through partnerships is vital for prevention and control of NCDs. Considering
this need, a multi stakeholder meeting was held in September 2011 with political leaders and
representatives from all the relevant governmental and non-governmental organisations for the
implementation of multi-sectoral approaches. With a view to convincing the stakeholders of the
importance and responsibility of each organization in prevention and control of NCDs, special
emphasis was made to introduce best-buy interventions for dealing with the main modifiable risk
factors.
Following the multi-stakeholder meetings, several activities have started. Many activities have been
conducted in collaboration with the Ministry of Youth and Skills Development and National Youth
Council to mobilise youth for the prevention and control of NCDs. Youth leaders were trained and
provincial activity plans were prepared in order to carry out activities to reduce the risk factors and to
change the lifestyle of the people. Provincial and district level training programmes have been planned
for youth in the future.
Discussions were held with relevant officials to improve the availability of fruits and vegetables in the
community. In addition, suggestions were made to increase intake of healthy food among school
children. Furthermore, the stakeholders collaborated to introduce measures to convince people of the
importance of physical activity and to improve the levels of physical activity in the community.
6
Activities carried out are being monitored and evaluated frequently through the meetings held such as
steering committee meetings, NABNCD and Working group for NCDs. The challenge of
multi-stakeholder partnerships is to maintain the commitment and the interest shown by the other
stakeholders over time, despite the other priorities of their ministries and organisations.
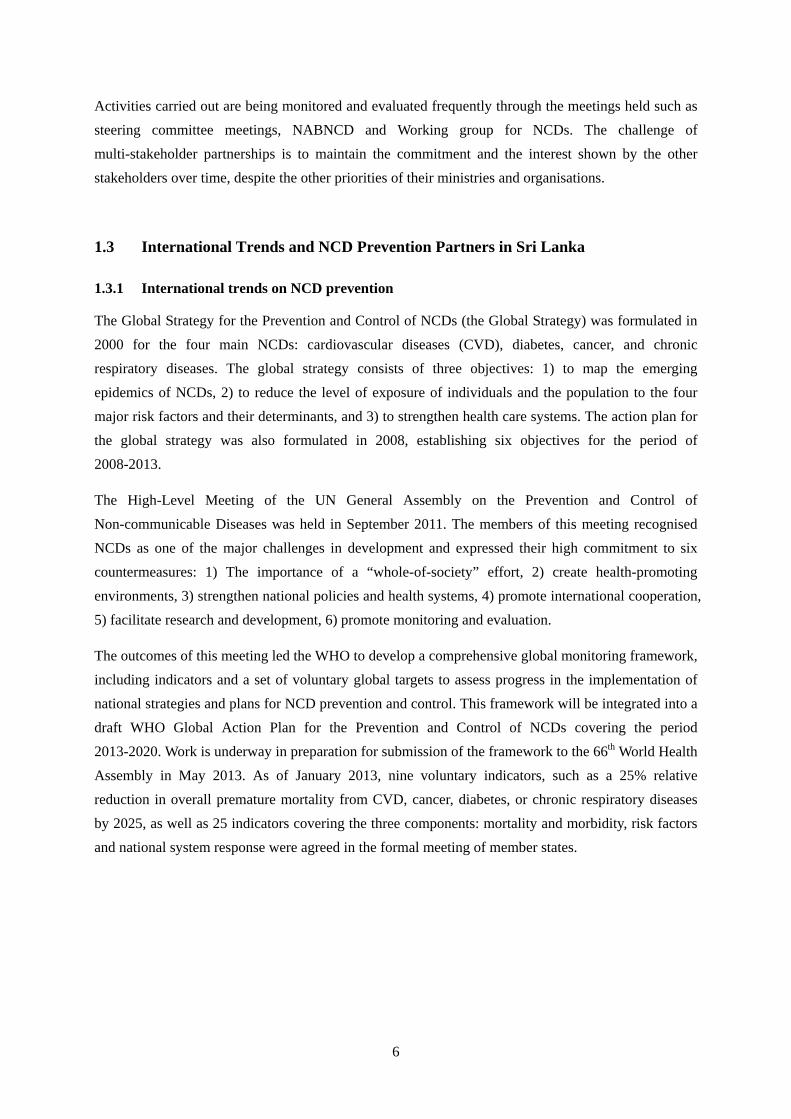
1.3 International Trends and NCD Prevention Partners in Sri Lanka
1.3.1 International trends on NCD prevention
The Global Strategy for the Prevention and Control of NCDs (the Global Strategy) was formulated in
2000 for the four main NCDs: cardiovascular diseases (CVD), diabetes, cancer, and chronic
respiratory diseases. The global strategy consists of three objectives: 1) to map the emerging
epidemics of NCDs, 2) to reduce the level of exposure of individuals and the population to the four
major risk factors and their determinants, and 3) to strengthen health care systems. The action plan for
the global strategy was also formulated in 2008, establishing six objectives for the period of
2008-2013.
The High-Level Meeting of the UN General Assembly on the Prevention and Control of
Non-communicable Diseases was held in September 2011. The members of this meeting recognised
NCDs as one of the major challenges in development and expressed their high commitment to six
countermeasures: 1) The importance of a “whole-of-society” effort, 2) create health-promoting
environments, 3) strengthen national policies and health systems, 4) promote international cooperation,
5) facilitate research and development, 6) promote monitoring and evaluation.
The outcomes of this meeting led the WHO to develop a comprehensive global monitoring framework,
including indicators and a set of voluntary global targets to assess progress in the implementation of
national strategies and plans for NCD prevention and control. This framework will be integrated into a
draft WHO Global Action Plan for the Prevention and Control of NCDs covering the period
2013-2020. Work is underway in preparation for submission of the framework to the 66th World Health
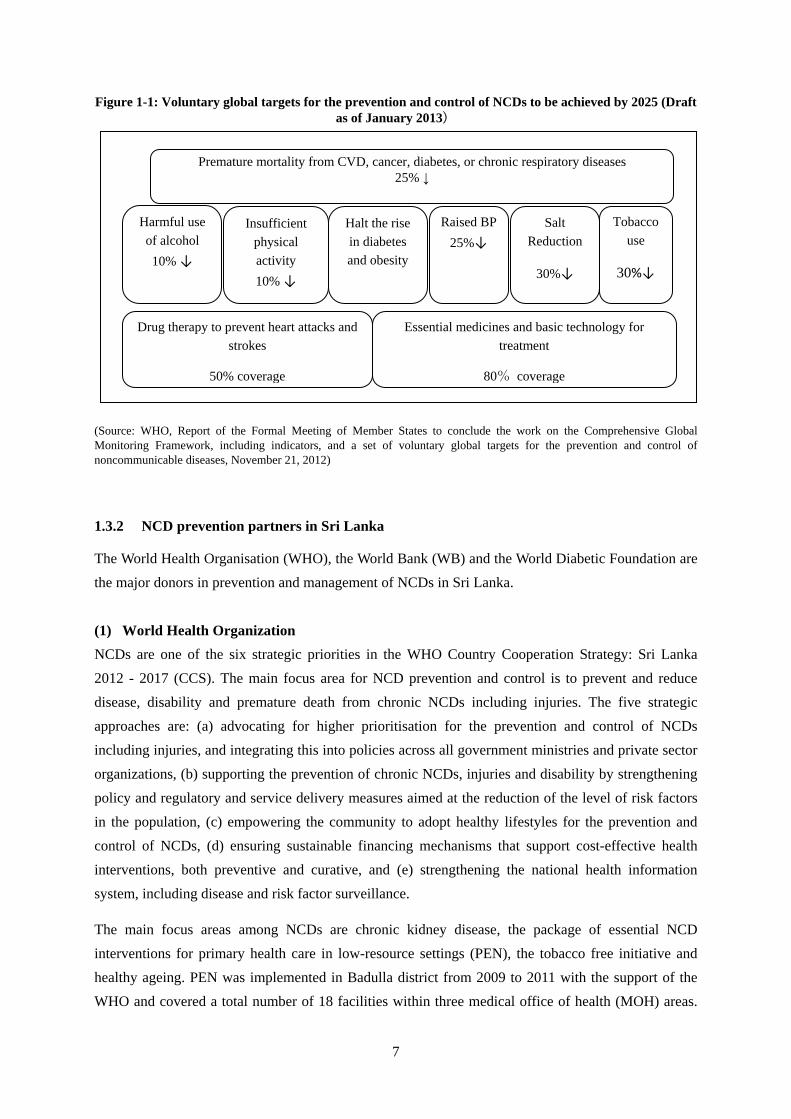
Assembly in May 2013. As of January 2013, nine voluntary indicators, such as a 25% relative
reduction in overall premature mortality from CVD, cancer, diabetes, or chronic respiratory diseases
by 2025, as well as 25 indicators covering the three components: mortality and morbidity, risk factors
and national system response were agreed in the formal meeting of member states.
7
Figure 1-1: Voluntary global targets for the prevention and control of NCDs to be achieved by 2025 (Draft as of January 2013)
(Source: WHO, Report of the Formal Meeting of Member States to conclude the work on the Comprehensive Global Monitoring Framework, including indicators, and a set of voluntary global targets for the prevention and control of noncommunicable diseases, November 21, 2012)
1.3.2 NCD prevention partners in Sri Lanka
The World Health Organisation (WHO), the World Bank (WB) and the World Diabetic Foundation are
the major donors in prevention and management of NCDs in Sri Lanka.
(1) World Health Organization
NCDs are one of the six strategic priorities in the WHO Country Cooperation Strategy: Sri Lanka
2012 - 2017 (CCS). The main focus area for NCD prevention and control is to prevent and reduce
disease, disability and premature death from chronic NCDs including injuries. The five strategic
approaches are: (a) advocating for higher prioritisation for the prevention and control of NCDs
including injuries, and integrating this into policies across all government ministries and private sector
organizations, (b) supporting the prevention of chronic NCDs, injuries and disability by strengthening
policy and regulatory and service delivery measures aimed at the reduction of the level of risk factors
in the population, (c) empowering the community to adopt healthy lifestyles for the prevention and
control of NCDs, (d) ensuring sustainable financing mechanisms that support cost-effective health
interventions, both preventive and curative, and (e) strengthening the national health information
system, including disease and risk factor surveillance.
The main focus areas among NCDs are chronic kidney disease, the package of essential NCD
interventions for primary health care in low-resource settings (PEN), the tobacco free initiative and
healthy ageing. PEN was implemented in Badulla district from 2009 to 2011 with the support of the
WHO and covered a total number of 18 facilities within three medical office of health (MOH) areas.
Premature mortality from CVD, cancer, diabetes, or chronic respiratory diseases 25% ↓
Harmful use
of alcohol
10% ↓
Insufficient
physical
activity
10% ↓
Halt the rise
in diabetes
and obesity
Raised BP
25%↓
Salt
Reduction
30%↓
Tobacco
use
30%↓
Drug therapy to prevent heart attacks and
strokes
50% coverage
Essential medicines and basic technology for
treatment
80% coverage

8
The package includes six core activities as well as plans to introduce comprehensive NCD care within
the primary care settings and includes assessing human resource availability. The six core activities
are: providing NCD care knowledge updates for staff, assessing availability of essential equipment
needs for NCD care, making necessary changes to the essential drugs list to include first line drugs for
NCDs, developing and applying 10-year CVD risk charts to clinic populations, and developing and
introducing protocols for follow-up care and management of NCDs.
(2) World Bank
The Health Sector Development Project (HSDP) was implemented by the MoH and the PDHS from
2004 to 2010, and funded by the International Development Administration (IDA)/World Bank with a
grant of US $60 million and additional credit of $24 million6. The development objective was to
contribute to improvements in efficiency, utilization, equity of access, and quality of public health
sector health services in Sri Lanka, with a particular focus on the district and provincial level.
The World Bank issued a report entitled “Prevention and Control of Selected Chronic NCDs in Sri
Lanka” in October 2010 aiming to stimulate policy dialogue for NCDs and to provide an evidence
base to facilitate decisions.
The second HSDP will start from 2013 with a total cost of US $5,170 million, of which the
International Development Association (IDA) contribution is expected to be US$200 million7. Area 3
of the of the Country Partnership Strategy for the Democratic Socialist Republic of Sri Lanka (FY
2013 - FY 2016) calls for improving living standards and social inclusion as part of its emerging
middle-income country agenda. The second HSDP is expected to make an important contribution to
addressing all three sub-areas of Area 3. The project development objective is to improve the public
sector health system so as to respond to the challenges facing it, especially with regard to nutrition and
NCDs. Improving prevention and control of NCDs is one of the Bank’s focus thematic areas for
technical engagement and monitoring. The resources will be utilised mainly in the following
NCD-related areas: implementation of the WHO Framework Convention for Tobacco Control
(FCTC); introduction of legislation for the control of indoor air pollution, pesticides and excessive
alcohol, salt, sugar and trans fat usage; establishment of fully functional 24-hour emergency treatment
units at all levels of hospitals; establishment of at least one healthy lifestyle centre in each of the 325
MOH areas; utilization of a mobile health screening system for screening at workplaces; improvement
of NCD care management at hospitals; strengthening laboratory and other investigation services, ICU
services, clinic facilities, and other ancillary services; and improvement of drug quality assurance,
drug logistics and the distribution system.
6 World Bank, 2011, Sri Lanka Health Sector Development Project – Report No. ICR1842 7 World Bank, 2013, Project Information Document (Appraisal Stage) – Sri Lanka – Second Health Sector Development
Project-Report No. PIDA55
9
(3) World Diabetes Foundation
The Nirogi Lanka project, started in 2009 with a grant from the World Diabetes Foundation, aimed to
establish diabetes educator nursing officers in Sri Lanka, improve the quality of diabetes care through
development of a health care model of tertiary-primary care partnerships in Colombo, and prevent
type 2 diabetes by empowering the public and identifying at-risk populations. The phase two project is
expected to start in 2013.
1.4 NCD Prevention Project (NPP)
1.4.1 Background
Japanese cooperation with the Sri Lankan health sector dates back several decades. The well-known
contribution includes the formulation of the Health Master Plan, the National Blood Transfusion
Centre, rehabilitation of major hospitals such as Jaffna Teaching Hospital, and introduction of
5S-TQM in hospital management.
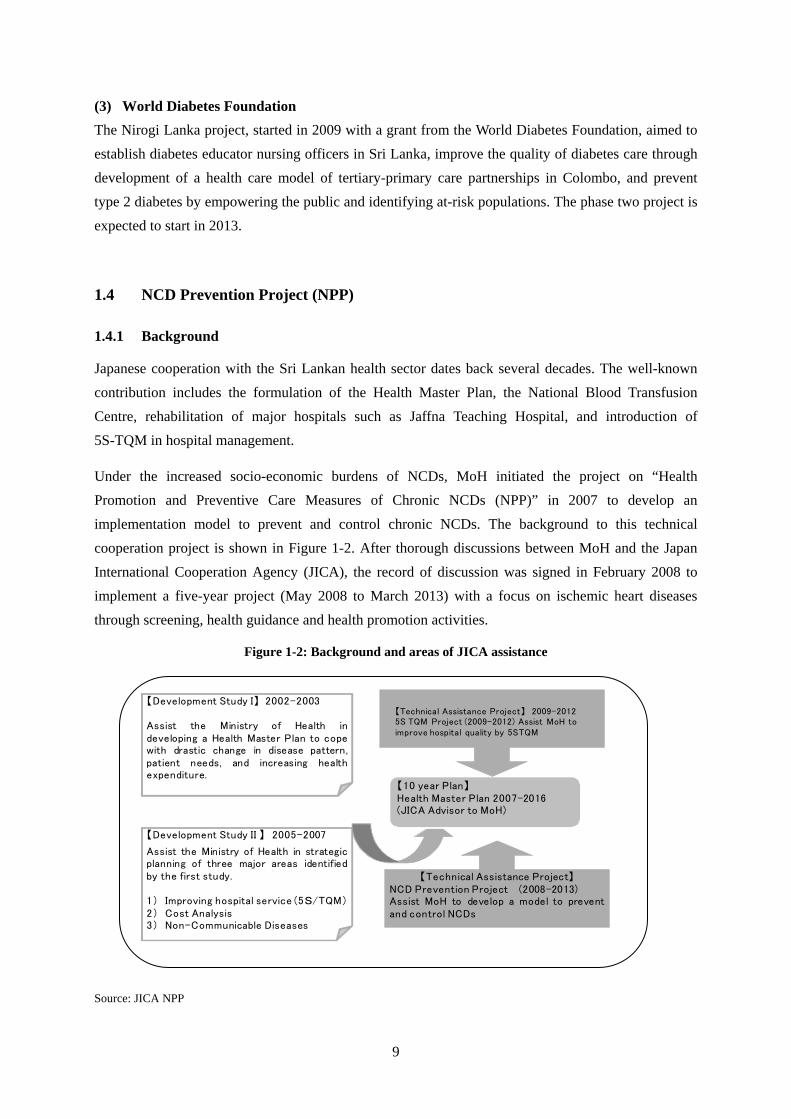
Under the increased socio-economic burdens of NCDs, MoH initiated the project on “Health
Promotion and Preventive Care Measures of Chronic NCDs (NPP)” in 2007 to develop an
implementation model to prevent and control chronic NCDs. The background to this technical
cooperation project is shown in Figure 1-2. After thorough discussions between MoH and the Japan
International Cooperation Agency (JICA), the record of discussion was signed in February 2008 to
implement a five-year project (May 2008 to March 2013) with a focus on ischemic heart diseases
through screening, health guidance and health promotion activities.
Figure 1-2: Background and areas of JICA assistance
Source: JICA NPP
【Development Study I】 2002-2003
Assist the Ministry of Health indeveloping a Health Master Plan to copewith drastic change in disease pattern,patient needs, and increasing healthexpenditure.
【Development Study II 】 2005-2007
Assist the Ministry of Health in strategicplanning of three major areas identifiedby the first study.
1) Improving hospital service(5S/TQM)2) Cost Analysis3) Non-Communicable Diseases
【Technical Assistance Project】NCD Prevention Project (2008-2013)Assist MoH to develop a model to preventand control NCDs
【10 year Plan】Health Master Plan 2007-2016(JICA Advisor to MoH)
【Technical Assistance Project】 2009-20125S TQM Project (2009-2012) Assist MoH to improve hospital quality by 5STQM
10
1.4.2 Project components
The NPP is designed to “develop effective and efficient implementation models to prevent and control
NCDs”. The following three indicators were set to measure the achievements of the project:
1) Twenty (20) % of target population is screened annually;
2) Seventy (70) % of people identified as high risk receive regular follow-up guidance; and
3) Ninety (90) % of newly identified patients have received necessary treatment.
To achieve the above goal, NPP selected four approaches (outputs):
Output 1: Risk factors of cardiovascular diseases are identified by the Ragama Health Study based on
the evidence;
Output 2: Intervention guidelines and manuals are formulated based on available evidence and related
literature;
Output 3: Institutional and technical feasibilities of the consolidated intervention guidelines are
assessed for development of the NCD prevention models in pilot areas; and
Output 4: Expansion plan for health check-up/guidance and health promotion for prevention of
cardiovascular diseases is finalised.
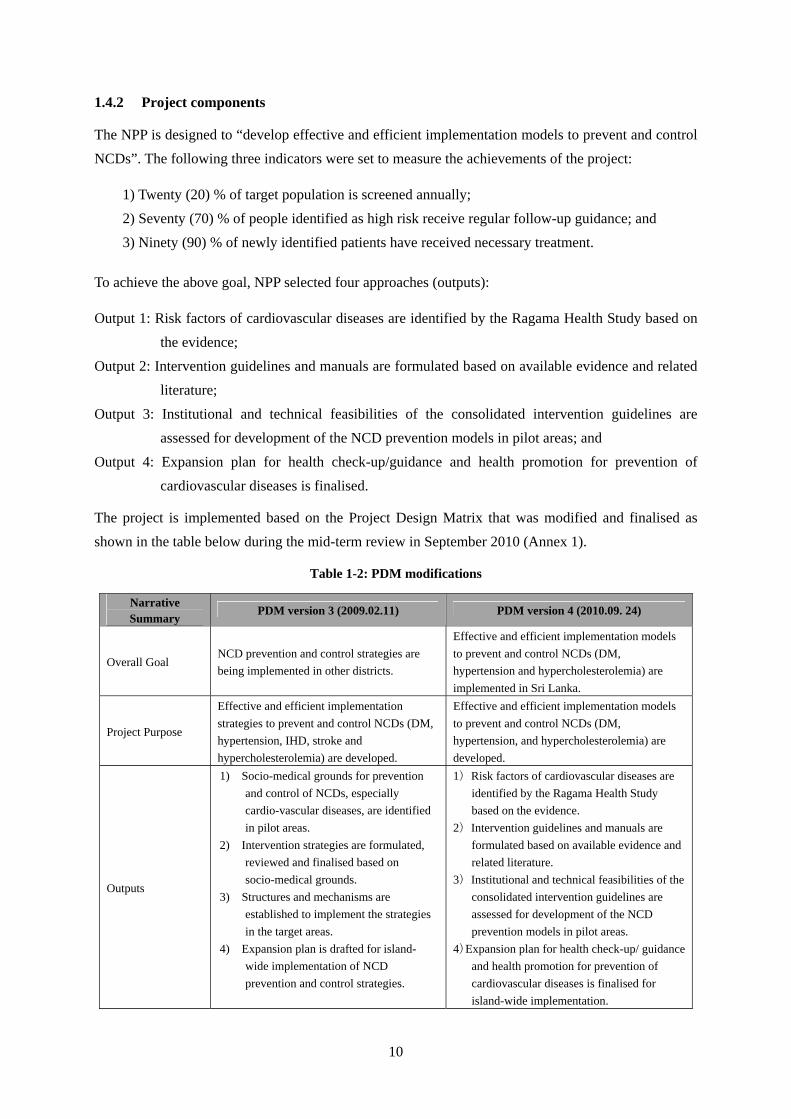
The project is implemented based on the Project Design Matrix that was modified and finalised as
shown in the table below during the mid-term review in September 2010 (Annex 1).
Table 1-2: PDM modifications
Narrative Summary
PDM version 3 (2009.02.11) PDM version 4 (2010.09. 24)
Overall Goal NCD prevention and control strategies are
being implemented in other districts.
Effective and efficient implementation models
to prevent and control NCDs (DM,
hypertension and hypercholesterolemia) are
implemented in Sri Lanka.
Project Purpose
Effective and efficient implementation
strategies to prevent and control NCDs (DM,
hypertension, IHD, stroke and
hypercholesterolemia) are developed.
Effective and efficient implementation models
to prevent and control NCDs (DM,
hypertension, and hypercholesterolemia) are
developed.
Outputs
1) Socio-medical grounds for prevention
and control of NCDs, especially
cardio-vascular diseases, are identified
in pilot areas.
2) Intervention strategies are formulated,
reviewed and finalised based on
socio-medical grounds.
3) Structures and mechanisms are
established to implement the strategies
in the target areas.
4) Expansion plan is drafted for island-
wide implementation of NCD
prevention and control strategies.
1)Risk factors of cardiovascular diseases are
identified by the Ragama Health Study
based on the evidence.
2)Intervention guidelines and manuals are
formulated based on available evidence and
related literature.
3)Institutional and technical feasibilities of the
consolidated intervention guidelines are
assessed for development of the NCD
prevention models in pilot areas.
4)Expansion plan for health check-up/ guidance
and health promotion for prevention of
cardiovascular diseases is finalised for
island-wide implementation.
11
1.4.3 Implementation structure
(1) Governing body in MoH
In the Record of Discussion (R/D) signed by both governments, the Secretary, the Ministry of Health
is designated as project director and the Deputy Director General (Planning) as project manager of
NPP. The highest decision-making body for NPP is the “Joint Coordinating Committee (JCC)” chaired
by the Secretary of Health and consists of DDGs, Provincial Directors (PDs) and representatives from
medical associations. JCC is responsible for planning major activities, monitoring the progress and
endorsing guidelines and tools for distribution.
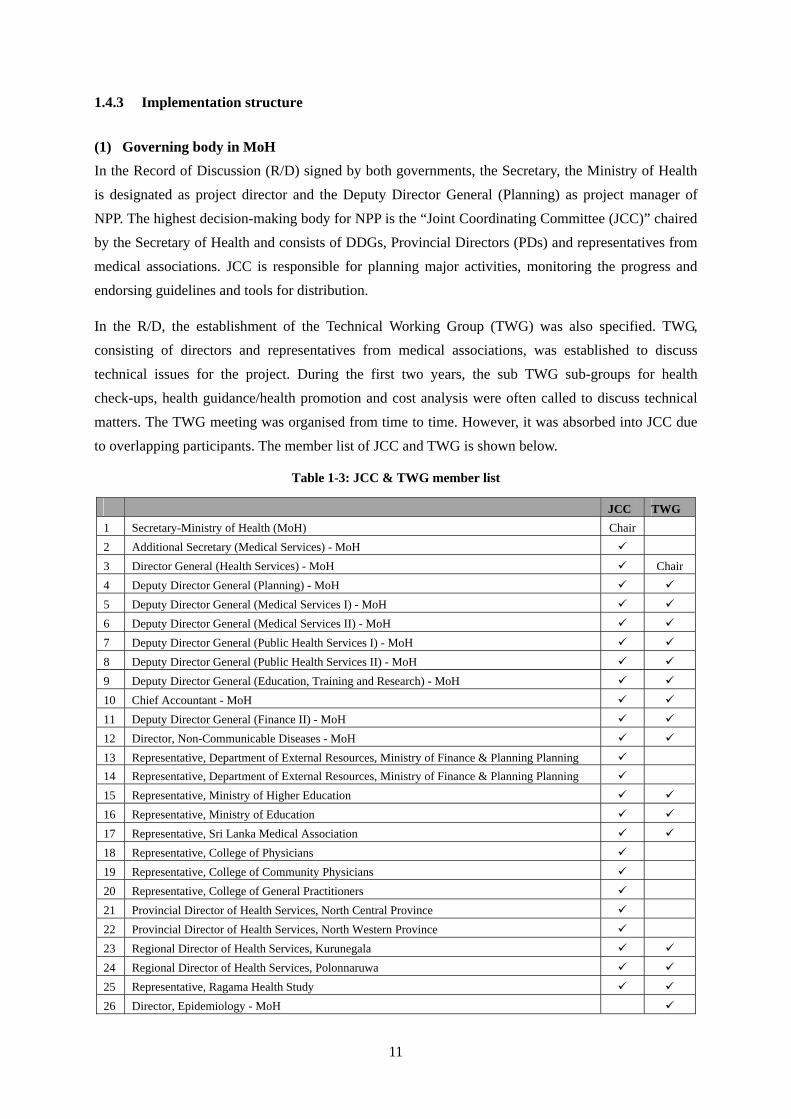
In the R/D, the establishment of the Technical Working Group (TWG) was also specified. TWG,
consisting of directors and representatives from medical associations, was established to discuss
technical issues for the project. During the first two years, the sub TWG sub-groups for health
check-ups, health guidance/health promotion and cost analysis were often called to discuss technical
matters. The TWG meeting was organised from time to time. However, it was absorbed into JCC due
to overlapping participants. The member list of JCC and TWG is shown below.
Table 1-3: JCC & TWG member list
JCC TWG
1 Secretary-Ministry of Health (MoH) Chair
2 Additional Secretary (Medical Services) - MoH
3 Director General (Health Services) - MoH Chair
4 Deputy Director General (Planning) - MoH
5 Deputy Director General (Medical Services I) - MoH
6 Deputy Director General (Medical Services II) - MoH
7 Deputy Director General (Public Health Services I) - MoH
8 Deputy Director General (Public Health Services II) - MoH
9 Deputy Director General (Education, Training and Research) - MoH
10 Chief Accountant - MoH
11 Deputy Director General (Finance II) - MoH
12 Director, Non-Communicable Diseases - MoH
13 Representative, Department of External Resources, Ministry of Finance & Planning Planning
14 Representative, Department of External Resources, Ministry of Finance & Planning Planning
15 Representative, Ministry of Higher Education
16 Representative, Ministry of Education
17 Representative, Sri Lanka Medical Association
18 Representative, College of Physicians
19 Representative, College of Community Physicians
20 Representative, College of General Practitioners
21 Provincial Director of Health Services, North Central Province
22 Provincial Director of Health Services, North Western Province
23 Regional Director of Health Services, Kurunegala
24 Regional Director of Health Services, Polonnaruwa
25 Representative, Ragama Health Study
26 Director, Epidemiology - MoH
12
JCC TWG
27 Director, Family Health Bureau - MoH
28 Director, Health Education Bureau - MoH
29 Director, Information - MoH
30 Director, Mental Health - MoH
31 Director, Nutrition - MoH
32 Director, Planning - MoH
33 Director, Youth, Elderly and People with Disability - MoH
34 Director, Cancer Control Programme - MoH
35 JICA NPP Team
36 Representative, JICA Sri Lanka Office
37 Representative, Embassy of Japan (Observer)
38 Representative, World Health Organization (Observer)
39 Representative, World Bank (Observer)
40 Others to be designated by MoH and JICA, if necessary
(2) Sri Lankan counterparts
During the five years of NPP implementation, a total of 21 officials from MoH and RDHS were
assigned as major counterparts: Secretary of Health, Deputy Director General (Planning), Director
NCD, Director Health Education Bureau (HEB), Regional Director (RD) Kurunegala, RD
Polonnaruwa, MO/NCD Kurunegala and MO/NCD Polonnaruwa. The list of Sri Lankan counterpart
personnel is attached as Annex 2.
(3) Japanese experts
JICA dispatched a team of experts on an assignment basis to assist MoH in implementing the project.
A total of 11 experts were dispatched for the period of 94.5 months to work in Sri Lanka. A list of
Japanese experts is attached as Annex 3.
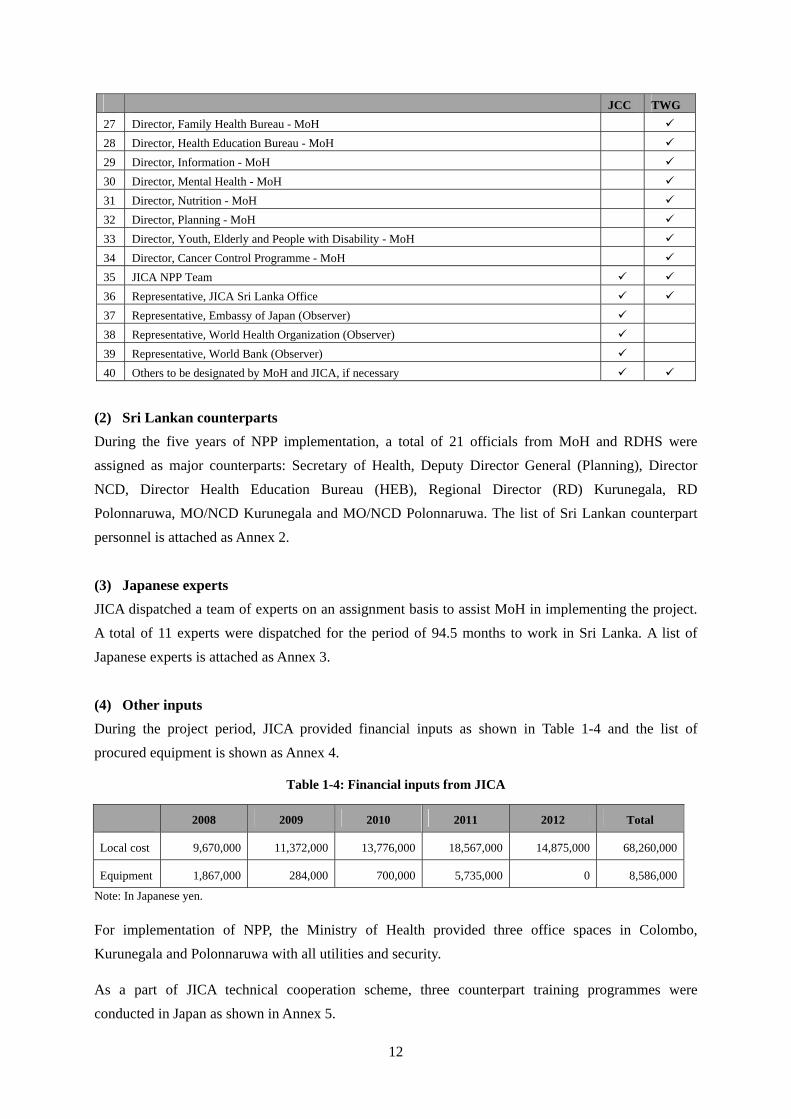
(4) Other inputs
During the project period, JICA provided financial inputs as shown in Table 1-4 and the list of
procured equipment is shown as Annex 4.
Table 1-4: Financial inputs from JICA
2008 2009 2010 2011 2012 Total
Local cost 9,670,000 11,372,000 13,776,000 18,567,000 14,875,000 68,260,000
Equipment 1,867,000 284,000 700,000 5,735,000 0 8,586,000
Note: In Japanese yen.
For implementation of NPP, the Ministry of Health provided three office spaces in Colombo,
Kurunegala and Polonnaruwa with all utilities and security.
As a part of JICA technical cooperation scheme, three counterpart training programmes were
conducted in Japan as shown in Annex 5.
13
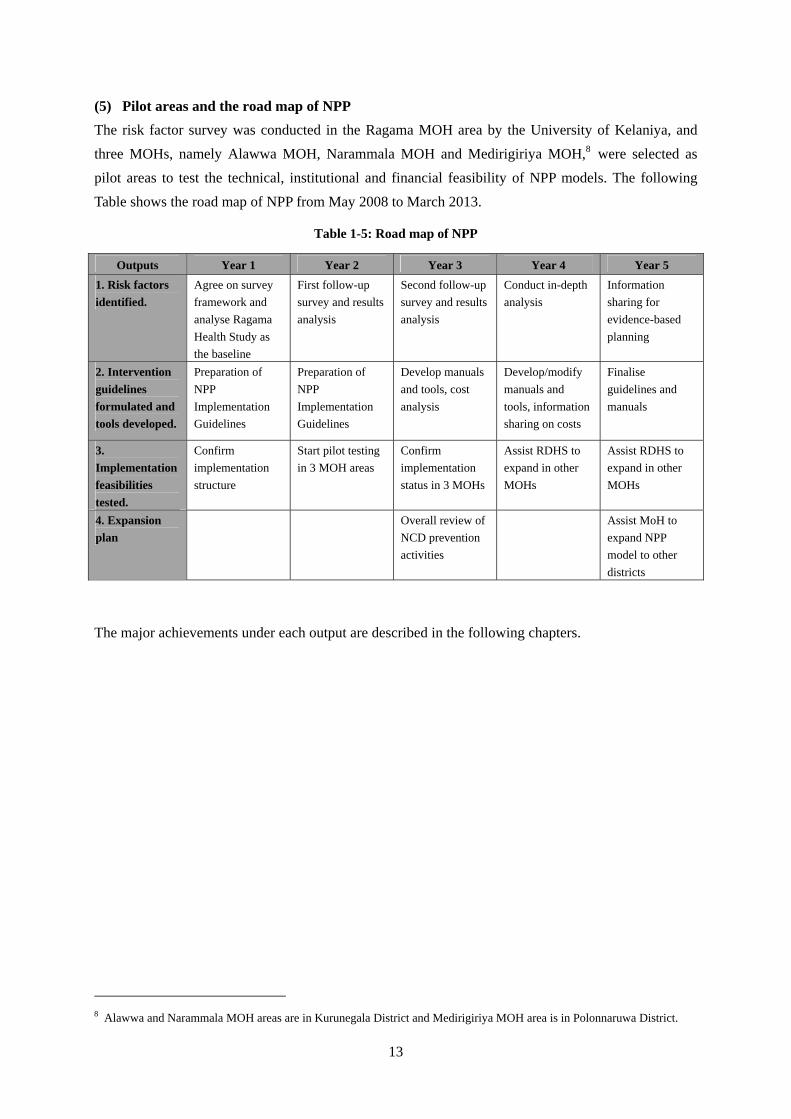
(5) Pilot areas and the road map of NPP
The risk factor survey was conducted in the Ragama MOH area by the University of Kelaniya, and
three MOHs, namely Alawwa MOH, Narammala MOH and Medirigiriya MOH,8 were selected as
pilot areas to test the technical, institutional and financial feasibility of NPP models. The following
Table shows the road map of NPP from May 2008 to March 2013.
Table 1-5: Road map of NPP
Outputs Year 1 Year 2 Year 3 Year 4 Year 5
1. Risk factors
identified.
Agree on survey
framework and
analyse Ragama
Health Study as
the baseline
First follow-up
survey and results
analysis
Second follow-up
survey and results
analysis
Conduct in-depth
analysis
Information
sharing for
evidence-based
planning
2. Intervention
guidelines
formulated and
tools developed.
Preparation of
NPP
Implementation
Guidelines
Preparation of
NPP
Implementation
Guidelines
Develop manuals
and tools, cost
analysis
Develop/modify
manuals and
tools, information
sharing on costs
Finalise
guidelines and
manuals
3.
Implementation
feasibilities
tested.
Confirm
implementation
structure
Start pilot testing
in 3 MOH areas
Confirm
implementation
status in 3 MOHs
Assist RDHS to
expand in other
MOHs
Assist RDHS to
expand in other
MOHs
4. Expansion
plan
Overall review of
NCD prevention
activities
Assist MoH to
expand NPP
model to other
districts
The major achievements under each output are described in the following chapters.
8 Alawwa and Narammala MOH areas are in Kurunegala District and Medirigiriya MOH area is in Polonnaruwa District.
14
CHAPTER 2 NCD Risk Factors
2.1 Introduction
Cardiovascular diseases (CVD) are the main cause of death globally and over 80% of these deaths take
place in low- and middle-income countries. It is estimated that CVDs will continue to dominate
mortality trends in the future. Over the past decades, many in depth epidemiological studies have been
conducted on CVD risk factors, incidence, and mortality in developed countries. However, no cohort
studies have as yet been carried out in Sri Lanka.
Considering the importance of obtaining country-specific data on CVD risks and CVD outcomes, this
component was designed as one of the project outputs. For this purpose, the Ragama Health Study
(RHS) population was selected to identify risk factors of CVD for the following reasons: (1) a risk
factor survey had already been implemented once in 2007, and (2) its methodology and operating
structure were clear enough to track the same population in order to identify incidence of hypertension,
diabetes mellitus, dyslipidaemia and CVD events as well as to track a variety of potential risk factors
(exposure) that might be relevant to the development of relevant NCDs.
2.2 Background Information about Ragama Health Study (RHS)
2.2.1 Purpose of the RHS
The RHS was conducted in 2007 by the Faculty of Medicine, University of Kelaniya to determine the
prevalence of major metabolic disorders and to establish diagnostic criteria for metabolic syndrome in
the Sri Lankan population. This study was part of an international project by the National Centre for
Global Health and Medicine, Tokyo, Japan. The study, conducted in Vietnam, China, Tanzania and Sri
Lanka, aimed at controlling NCDs.
2.2.2 RHS study setting
The RHS was conducted in the Ragama Medical Office of Health (MOH) area, the field practice area
for the Faculty of Medicine, University of Kelaniya. Ragama is situated in Gampaha district, which is
the second most populous district of the country (Table 2-1). The Ragama MOH area has
characteristics typical of an urban community in Sri Lanka.

15
Table 2-1: Basic data about Gampaha district
Province Western
Population 2,298,588
Population density 1,714 /km2
Sector Urban 14.6%, Rural 85.4%, Estate 0%
Ethnic Group Sinhalese 90.6%, Sri Lankan Tamil 3.5%, Indian Tamil 0.5%, Sri Lankan Moor
4.2%, Burgher 0.4%, Malay 05%, Other 0.1%
Religions Buddhist 71.5%, Hindu 2.3%, Muslim 5.0%, Christian 21.2%, Other 0.1% Source: Census of Population and Housing 2012. Data about the sector is from the Census 2001
2.2.3 RHS population
A total of 3,150 individuals between 35-64 years of age were sampled using age stratified random
sampling from the electoral lists. Of the sample, 3,000 were invited to join the study and 2,986
completed all the examinations and were selected for the RHS cohort in the baseline survey (Table
2-2). 44.8% (n=1,338) were males.
Table 2-2: Study population by age group and sex
Birth Year Age group at the baseline Total
(n=2,987)
Male
(n=1,338)
Female
(n=1,649)
1942-1951 55-64 1,332 601 731
1952-1961 45-54 1,140 497 643
1962-1971 35-44 515 240 275 Source: Baseline Survey 2009
2.2.4 RHS examination items
The participants were screened by structured interview (past history, family history, dietary habits,
physical exercise habits, smoking habits, drinking habits etc.), anthropometric measurements (height,
weight, waist circumference), blood pressure measurement, blood investigation including fasting
blood glucose, lipid profile, serum insulin, HbA1c, GPT (ALT), and blood count, urinary micro
albumin, liver ultrasonography and ECG.
Data was collected by trained pre-intern medical graduates. At the end of the interview, all forms were
checked for completeness and participants were requested to come on a pre-assigned date to collect
their reports. Data on events from non-responders were obtained by the research assistants during
visits to the community to invite subjects to participate in the study.
2.2.5 RHS ethical aspect
Ethical clearance was obtained from the Ethics Committees of the Faculty of Medicine, University of
Kelaniya. Voluntary informed written consent was obtained from all participants. Blood for
biochemistry was drawn by trained nurses using disposable equipment under aseptic conditions. All
reports of investigations were given to participants and participants were appropriately counselled. In
cases where results indicated possible abnormalities, participants were referred to the follow-up clinic
16
or to an appropriate consultant at the Colombo North Teaching Hospital, Ragama for necessary
investigations and follow-up.
2.3 Methodology of Follow-up Risk Factor Survey
2.3.1 Design
This survey was a prospective cohort study of 2,986 people with a 3-year follow-up period from 2007
to 2010 with the following specifications.
In the first project year, analysis of RHS was conducted in order to utilise it as baseline data for CVD
risk factor analysis. During the same time, a follow-up survey was designed by the University of
Kelaniya and NPP. The NPP entrusted the University of Kelaniya to conduct two follow-up surveys in
the second and third project year. In the fourth project year, a task force group was established by
MoH, NPP, and University of Kelaniya to promote in-depth analysis for identifying risk factors and
applying the findings to the NCD intervention strategy. Results of the in-depth analysis were presented
in the Seminar of Evidence-based Planning to encourage further discussion in the final project year.
Table 2-3: Benchmarks for output 1
Year Benchmark activity for output 1
2008 Analysis of the RHS as the baseline and submission of the baseline survey report.
2009 Implementation of the first follow-up study and submission of the RHS annual report.
2010 Implementation of the second follow-up study and submission of the RHS annual report.
2011 In-depth analysis by the task force team
2012 Seminar of Evidence-based Planning
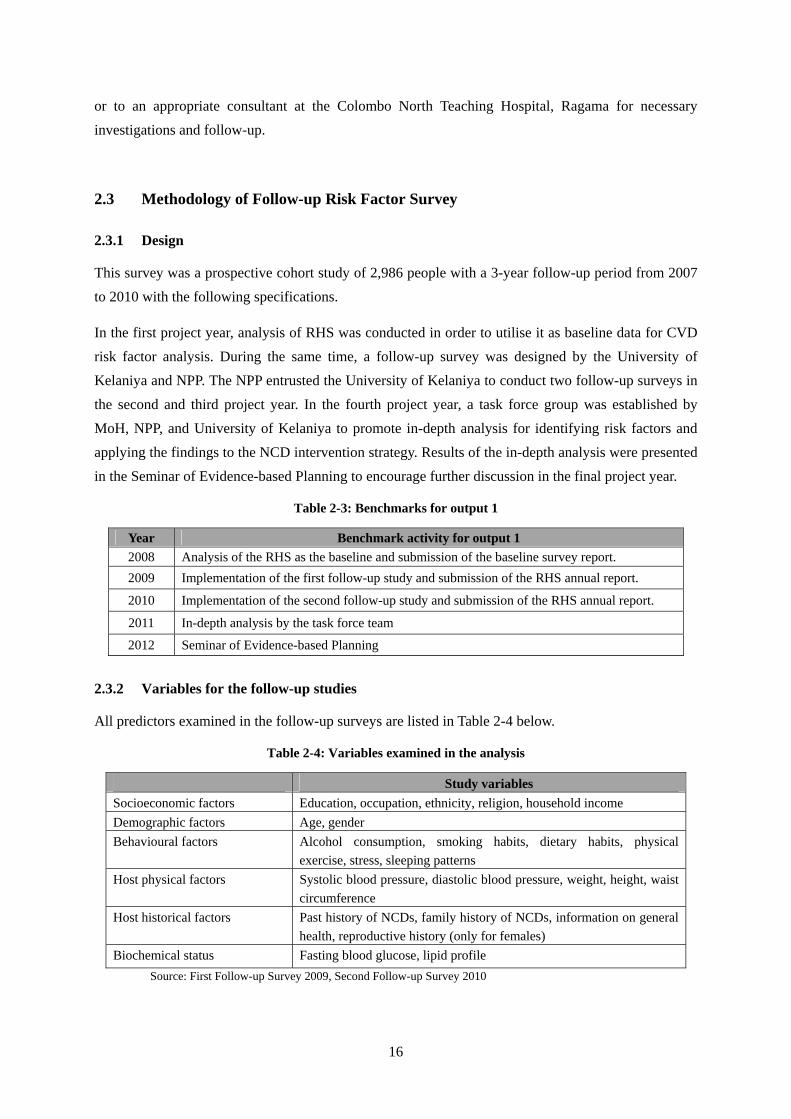
2.3.2 Variables for the follow-up studies
All predictors examined in the follow-up surveys are listed in Table 2-4 below.
Table 2-4: Variables examined in the analysis
Study variables
Socioeconomic factors Education, occupation, ethnicity, religion, household income
Demographic factors Age, gender
Behavioural factors Alcohol consumption, smoking habits, dietary habits, physical
exercise, stress, sleeping patterns
Host physical factors Systolic blood pressure, diastolic blood pressure, weight, height, waist
circumference
Host historical factors Past history of NCDs, family history of NCDs, information on general
health, reproductive history (only for females)
Biochemical status Fasting blood glucose, lipid profile
Source: First Follow-up Survey 2009, Second Follow-up Survey 2010

17
Analysis was done using the following definitions:
1) Hypertension: past history of hypertension or a blood pressure of >=140/90 mmHg on follow-up.
2) Diabetes mellitus: past history of diabetes or a FBG>125 mg/dl on follow-up.
3) Dyslipidaemia: past history of dyslipidaemia or presence of one or more of the following criteria:
an LDL cholesterol >160 mg/dl or an HDL cholesterol <40 mg/dl or a triglyceride concentration
>200 mg/dl or total cholesterol >240 mg/dl.
4) CVD events (outcome): occurrence of a fatal or non-fatal stroke, myocardial infarction or other
ischaemic heart diseases (IHD). Events were identified by the researchers’ direct observations,
reports by health services, or information gathered from relatives with death certificate.
A dietary assessment was conducted using a validated food frequency questionnaire developed by
University of Wayamba and University of Kelaniya in a sub-sample of the Ragama Health Study
cohort in the Second Follow-up Survey in 2010.
2.3.3 Statistical methods
Data were entered and checked in EPIINFO. Discrepancies were manually checked and corrections
made accordingly. Frequency and logical checks were done to ensure data quality.
The significance of the baseline differences was tested with χ2 test. Factors associated with incidence
of hypertension, diabetes mellitus, dyslipidaemia, comorbidity related to the preceding diseases, and
CVD events were analysed with Cox’s proportional hazards model, which included only those
predictors that were significant in the bivariate analysis.
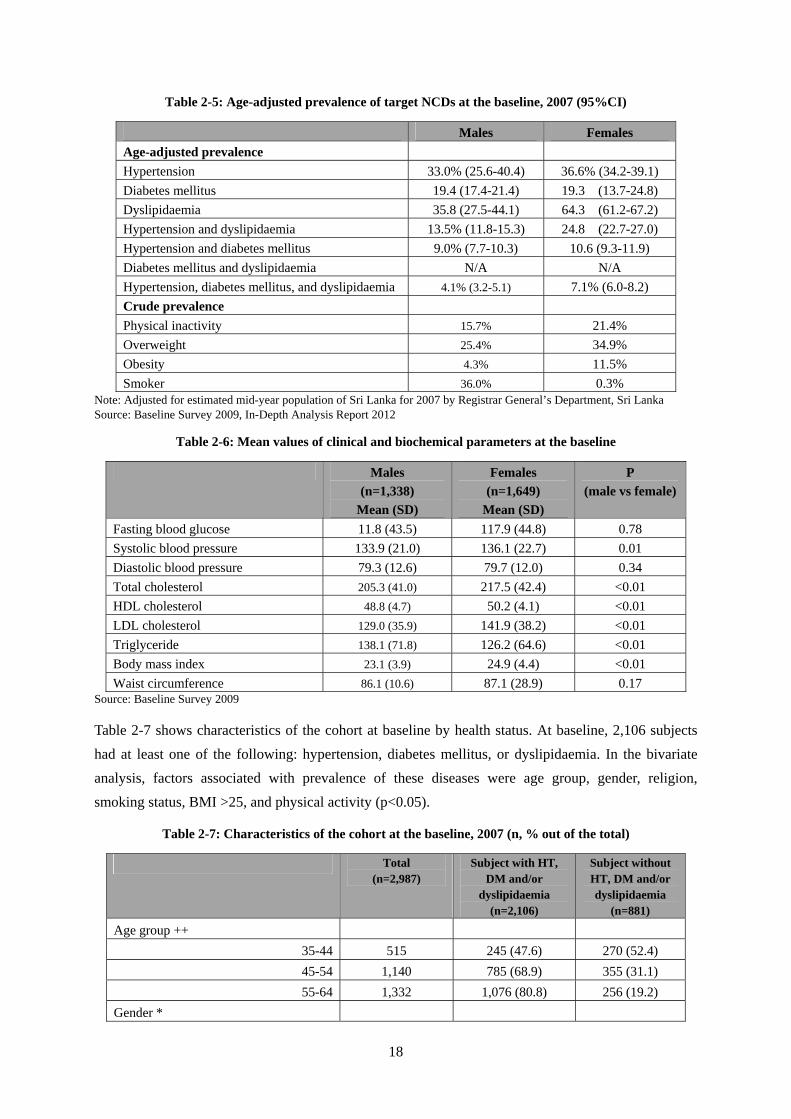
2.4 Analysis of the Baseline Data
The prevalence of hypertension, diabetes mellitus, dyslipidaemia, comorbidities, and other risk factors
are listed in Table 2-5. The age-adjusted prevalence of dyslipidaemia in females (64.3% (95% CI:
61.2-67.2)) was significantly higher than males (35.8% (95% CI: 27.5-44.1)) (p<0.001). The mean
value of selected risk factors by sex is given in Table 2-6.
18
Table 2-5: Age-adjusted prevalence of target NCDs at the baseline, 2007 (95%CI)
Males Females
Age-adjusted prevalence
Hypertension 33.0% (25.6-40.4) 36.6% (34.2-39.1)
Diabetes mellitus 19.4 (17.4-21.4) 19.3 (13.7-24.8)
Dyslipidaemia 35.8 (27.5-44.1) 64.3 (61.2-67.2)
Hypertension and dyslipidaemia 13.5% (11.8-15.3) 24.8 (22.7-27.0)
Hypertension and diabetes mellitus 9.0% (7.7-10.3) 10.6 (9.3-11.9)
Diabetes mellitus and dyslipidaemia N/A N/A
Hypertension, diabetes mellitus, and dyslipidaemia 4.1% (3.2-5.1) 7.1% (6.0-8.2)
Crude prevalence
Physical inactivity 15.7% 21.4%
Overweight 25.4% 34.9%
Obesity 4.3% 11.5%
Smoker 36.0% 0.3% Note: Adjusted for estimated mid-year population of Sri Lanka for 2007 by Registrar General’s Department, Sri Lanka Source: Baseline Survey 2009, In-Depth Analysis Report 2012
Table 2-6: Mean values of clinical and biochemical parameters at the baseline
Males
(n=1,338)
Mean (SD)
Females
(n=1,649)
Mean (SD)
P
(male vs female)
Fasting blood glucose 11.8 (43.5) 117.9 (44.8) 0.78
Systolic blood pressure 133.9 (21.0) 136.1 (22.7) 0.01
Diastolic blood pressure 79.3 (12.6) 79.7 (12.0) 0.34
Total cholesterol 205.3 (41.0) 217.5 (42.4) <0.01
HDL cholesterol 48.8 (4.7) 50.2 (4.1) <0.01
LDL cholesterol 129.0 (35.9) 141.9 (38.2) <0.01
Triglyceride 138.1 (71.8) 126.2 (64.6) <0.01
Body mass index 23.1 (3.9) 24.9 (4.4) <0.01
Waist circumference 86.1 (10.6) 87.1 (28.9) 0.17 Source: Baseline Survey 2009
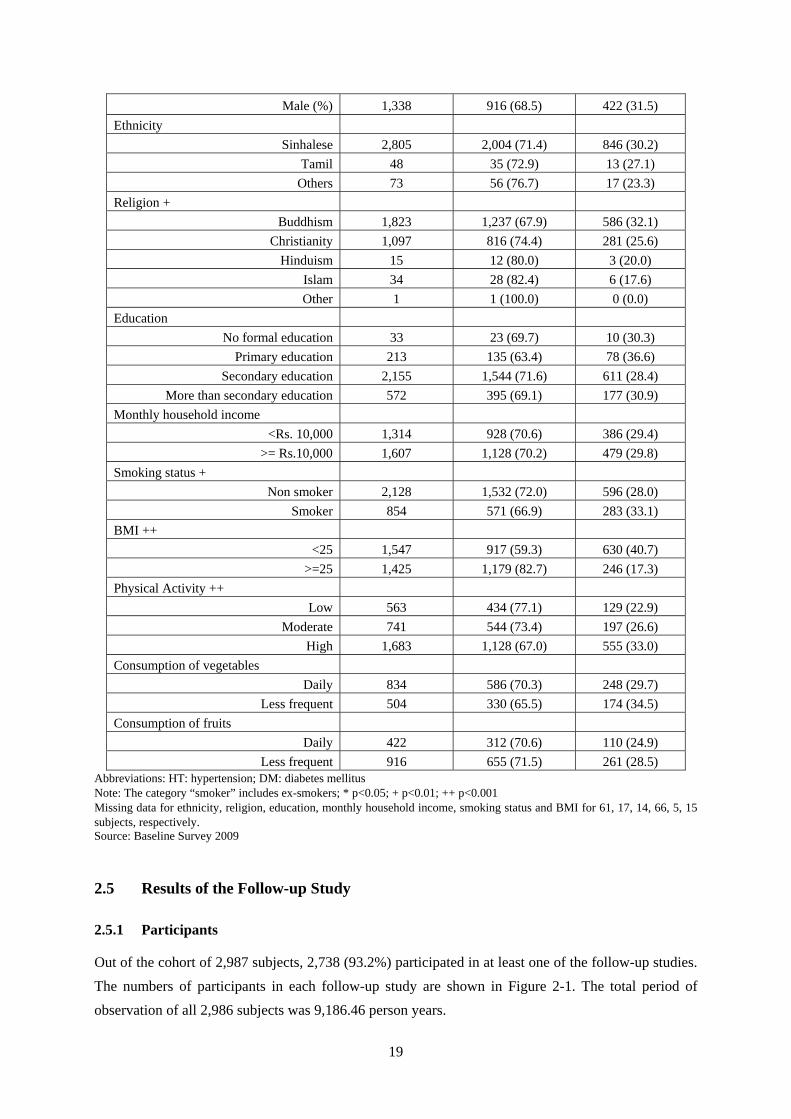
Table 2-7 shows characteristics of the cohort at baseline by health status. At baseline, 2,106 subjects
had at least one of the following: hypertension, diabetes mellitus, or dyslipidaemia. In the bivariate
analysis, factors associated with prevalence of these diseases were age group, gender, religion,
smoking status, BMI >25, and physical activity (p<0.05).
Table 2-7: Characteristics of the cohort at the baseline, 2007 (n, % out of the total)
Total (n=2,987)
Subject with HT, DM and/or
dyslipidaemia (n=2,106)
Subject without HT, DM and/or dyslipidaemia
(n=881)
Age group ++
35-44 515 245 (47.6) 270 (52.4)
45-54 1,140 785 (68.9) 355 (31.1)
55-64 1,332 1,076 (80.8) 256 (19.2)
Gender *
19
Male (%) 1,338 916 (68.5) 422 (31.5)
Ethnicity
Sinhalese 2,805 2,004 (71.4) 846 (30.2)
Tamil 48 35 (72.9) 13 (27.1)
Others 73 56 (76.7) 17 (23.3)
Religion +
Buddhism 1,823 1,237 (67.9) 586 (32.1)
Christianity 1,097 816 (74.4) 281 (25.6)
Hinduism 15 12 (80.0) 3 (20.0)
Islam 34 28 (82.4) 6 (17.6)
Other 1 1 (100.0) 0 (0.0)
Education
No formal education 33 23 (69.7) 10 (30.3)
Primary education 213 135 (63.4) 78 (36.6)
Secondary education 2,155 1,544 (71.6) 611 (28.4)
More than secondary education 572 395 (69.1) 177 (30.9)
Monthly household income
<Rs. 10,000 1,314 928 (70.6) 386 (29.4)
>= Rs.10,000 1,607 1,128 (70.2) 479 (29.8)
Smoking status +
Non smoker 2,128 1,532 (72.0) 596 (28.0)
Smoker 854 571 (66.9) 283 (33.1)
BMI ++
<25 1,547 917 (59.3) 630 (40.7)
>=25 1,425 1,179 (82.7) 246 (17.3)
Physical Activity ++
Low 563 434 (77.1) 129 (22.9)
Moderate 741 544 (73.4) 197 (26.6)
High 1,683 1,128 (67.0) 555 (33.0)
Consumption of vegetables
Daily 834 586 (70.3) 248 (29.7)
Less frequent 504 330 (65.5) 174 (34.5)
Consumption of fruits
Daily 422 312 (70.6) 110 (24.9)
Less frequent 916 655 (71.5) 261 (28.5) Abbreviations: HT: hypertension; DM: diabetes mellitus Note: The category “smoker” includes ex-smokers; * p<0.05; + p<0.01; ++ p<0.001 Missing data for ethnicity, religion, education, monthly household income, smoking status and BMI for 61, 17, 14, 66, 5, 15 subjects, respectively. Source: Baseline Survey 2009
2.5 Results of the Follow-up Study
2.5.1 Participants
Out of the cohort of 2,987 subjects, 2,738 (93.2%) participated in at least one of the follow-up studies.
The numbers of participants in each follow-up study are shown in Figure 2-1. The total period of
observation of all 2,986 subjects was 9,186.46 person years.

20
The total number of deaths during the three-year follow-up was 49 (1.8%): 16 deaths (32.7%) were
due to myocardial infarction (MI) or other IHD, 5 cases (10.2%) were due to stroke.
Figure 2-1: Recruitment and follow-up flow diagram
NOTE: * Those who didn’t participate in the screening were visited/telephoned to confirm any occurrence of diseases. Source: First Follow-up Survey 2009, Second Follow-up Survey 2010
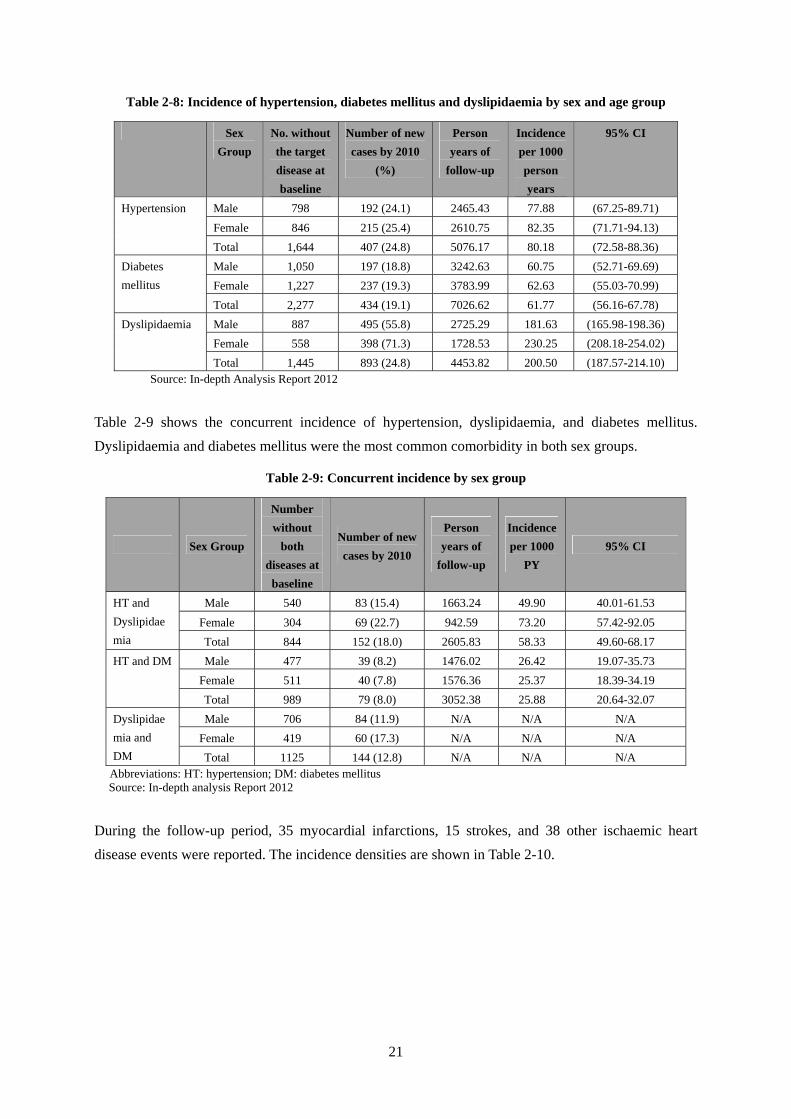
2.5.2 Outcome data
(1) Incidence
Newly diagnosed cases during the follow-up period were 407 with hypertension, 434 with diabetes,
893 with dyslipidaemia, along with 88 confirmed CVD events. Table 2-8 shows the incidence of
hypertension, dyslipidaemia and diabetes by gender. The incidence of dyslipidaemia was more than 2
times higher than hypertension and diabetes mellitus.
2010
2009
2007
YEAR
Baseline Cohort (n = 2,987)
The 1st follow-up study
Screening (n = 2,635)
Event assessment* (n =282)
The 2nd follow-up study
Screening (n = 2,504)
Event assessment (n =285)
Deaths (n = 37)
New NCD cases
Hypertension (n = 282)
Diabetes (n= 338)
Dyslipidaemia (n = 847)
CVD event (n = 54)
Deaths (n = 12)
New NCD cases
Hypertension (n = 125)
Diabetes (n= 96)
Dyslipidaemia (n = 46)
CVD event (n = 34)
Total invited to the study (n = 3,000)
21
Table 2-8: Incidence of hypertension, diabetes mellitus and dyslipidaemia by sex and age group
Sex
Group
No. without
the target
disease at
baseline
Number of new
cases by 2010
(%)
Person
years of
follow-up
Incidence
per 1000
person
years
95% CI
Hypertension Male 798 192 (24.1) 2465.43 77.88 (67.25-89.71)
Female 846 215 (25.4) 2610.75 82.35 (71.71-94.13)
Total 1,644 407 (24.8) 5076.17 80.18 (72.58-88.36)
Diabetes
mellitus
Male 1,050 197 (18.8) 3242.63 60.75 (52.71-69.69)
Female 1,227 237 (19.3) 3783.99 62.63 (55.03-70.99)
Total 2,277 434 (19.1) 7026.62 61.77 (56.16-67.78)
Dyslipidaemia Male 887 495 (55.8) 2725.29 181.63 (165.98-198.36)
Female 558 398 (71.3) 1728.53 230.25 (208.18-254.02)
Total 1,445 893 (24.8) 4453.82 200.50 (187.57-214.10) Source: In-depth Analysis Report 2012
Table 2-9 shows the concurrent incidence of hypertension, dyslipidaemia, and diabetes mellitus.
Dyslipidaemia and diabetes mellitus were the most common comorbidity in both sex groups.
Table 2-9: Concurrent incidence by sex group
Sex Group
Number
without
both
diseases at
baseline
Number of new
cases by 2010
Person
years of
follow-up
Incidence
per 1000
PY
95% CI
HT and
Dyslipidae
mia
Male 540 83 (15.4) 1663.24 49.90 40.01-61.53
Female 304 69 (22.7) 942.59 73.20 57.42-92.05
Total 844 152 (18.0) 2605.83 58.33 49.60-68.17
HT and DM Male 477 39 (8.2) 1476.02 26.42 19.07-35.73
Female 511 40 (7.8) 1576.36 25.37 18.39-34.19
Total 989 79 (8.0) 3052.38 25.88 20.64-32.07
Dyslipidae
mia and
DM
Male 706 84 (11.9) N/A N/A N/A
Female 419 60 (17.3) N/A N/A N/A
Total 1125 144 (12.8) N/A N/A N/A Abbreviations: HT: hypertension; DM: diabetes mellitus Source: In-depth analysis Report 2012
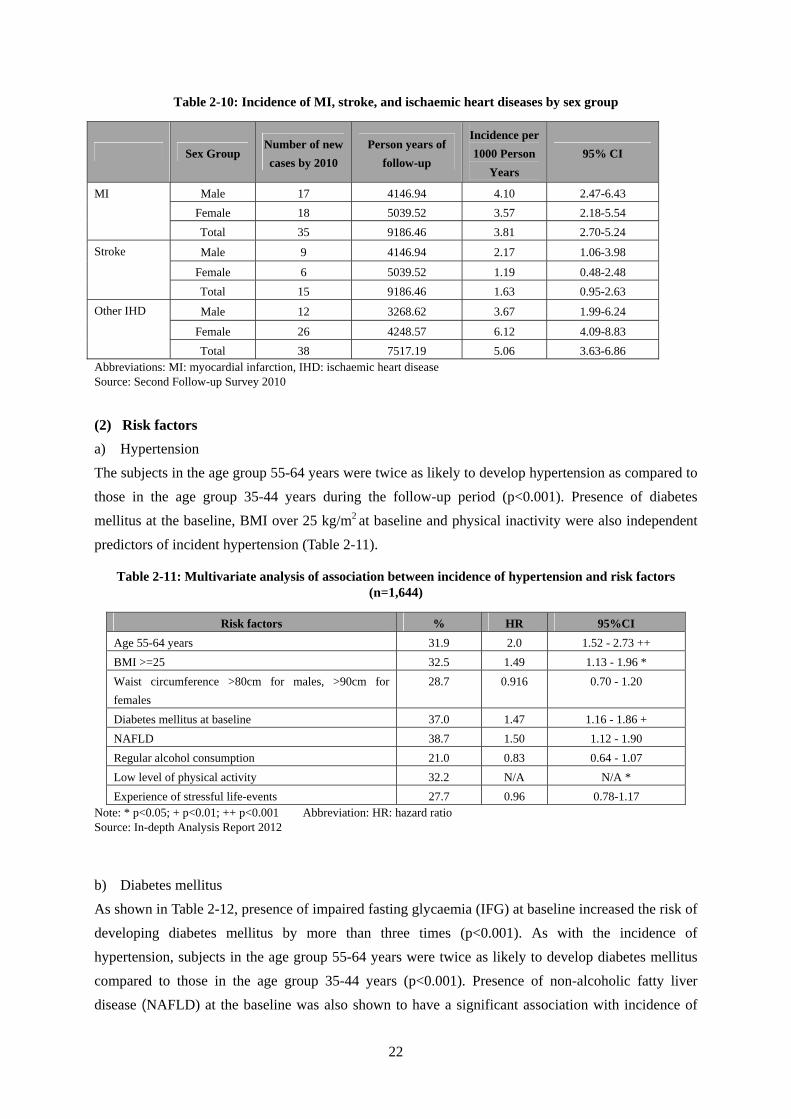
During the follow-up period, 35 myocardial infarctions, 15 strokes, and 38 other ischaemic heart
disease events were reported. The incidence densities are shown in Table 2-10.
22
Table 2-10: Incidence of MI, stroke, and ischaemic heart diseases by sex group
Sex Group Number of new
cases by 2010
Person years of
follow-up
Incidence per
1000 Person
Years
95% CI
MI Male 17 4146.94 4.10 2.47-6.43
Female 18 5039.52 3.57 2.18-5.54
Total 35 9186.46 3.81 2.70-5.24
Stroke Male 9 4146.94 2.17 1.06-3.98
Female 6 5039.52 1.19 0.48-2.48
Total 15 9186.46 1.63 0.95-2.63
Other IHD Male 12 3268.62 3.67 1.99-6.24
Female 26 4248.57 6.12 4.09-8.83
Total 38 7517.19 5.06 3.63-6.86 Abbreviations: MI: myocardial infarction, IHD: ischaemic heart disease Source: Second Follow-up Survey 2010
(2) Risk factors
a) Hypertension
The subjects in the age group 55-64 years were twice as likely to develop hypertension as compared to
those in the age group 35-44 years during the follow-up period (p<0.001). Presence of diabetes
mellitus at the baseline, BMI over 25 kg/m2 at baseline and physical inactivity were also independent
predictors of incident hypertension (Table 2-11).
Table 2-11: Multivariate analysis of association between incidence of hypertension and risk factors (n=1,644)
Risk factors % HR 95%CI
Age 55-64 years 31.9 2.0 1.52 - 2.73 ++
BMI >=25 32.5 1.49 1.13 - 1.96 *
Waist circumference >80cm for males, >90cm for
females
28.7 0.916 0.70 - 1.20
Diabetes mellitus at baseline 37.0 1.47 1.16 - 1.86 +
NAFLD 38.7 1.50 1.12 - 1.90
Regular alcohol consumption 21.0 0.83 0.64 - 1.07
Low level of physical activity 32.2 N/A N/A *
Experience of stressful life-events 27.7 0.96 0.78-1.17 Note: * p<0.05; + p<0.01; ++ p<0.001 Abbreviation: HR: hazard ratio Source: In-depth Analysis Report 2012
b) Diabetes mellitus
As shown in Table 2-12, presence of impaired fasting glycaemia (IFG) at baseline increased the risk of
developing diabetes mellitus by more than three times (p<0.001). As with the incidence of
hypertension, subjects in the age group 55-64 years were twice as likely to develop diabetes mellitus
compared to those in the age group 35-44 years (p<0.001). Presence of non-alcoholic fatty liver
disease (NAFLD) at the baseline was also shown to have a significant association with incidence of
23
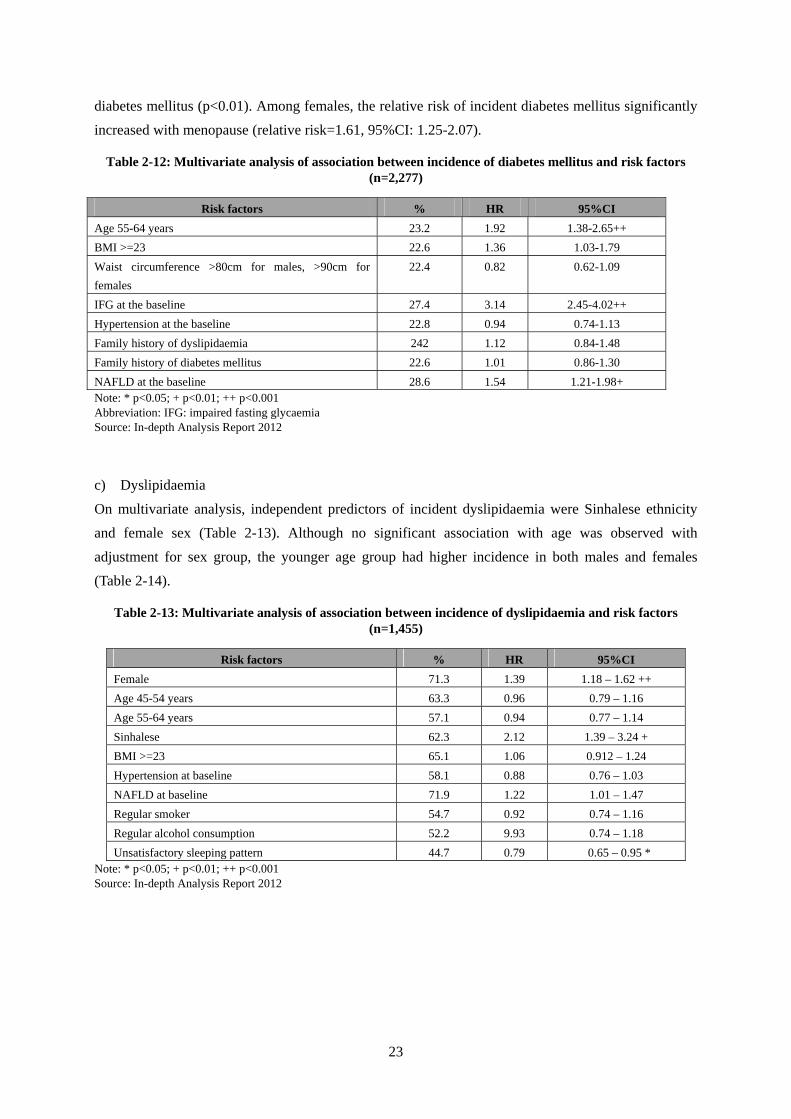
diabetes mellitus (p<0.01). Among females, the relative risk of incident diabetes mellitus significantly
increased with menopause (relative risk=1.61, 95%CI: 1.25-2.07).
Table 2-12: Multivariate analysis of association between incidence of diabetes mellitus and risk factors (n=2,277)
Risk factors % HR 95%CI
Age 55-64 years 23.2 1.92 1.38-2.65++
BMI >=23 22.6 1.36 1.03-1.79
Waist circumference >80cm for males, >90cm for
females
22.4 0.82 0.62-1.09
IFG at the baseline 27.4 3.14 2.45-4.02++
Hypertension at the baseline 22.8 0.94 0.74-1.13
Family history of dyslipidaemia 242 1.12 0.84-1.48
Family history of diabetes mellitus 22.6 1.01 0.86-1.30
NAFLD at the baseline 28.6 1.54 1.21-1.98+ Note: * p<0.05; + p<0.01; ++ p<0.001 Abbreviation: IFG: impaired fasting glycaemia Source: In-depth Analysis Report 2012
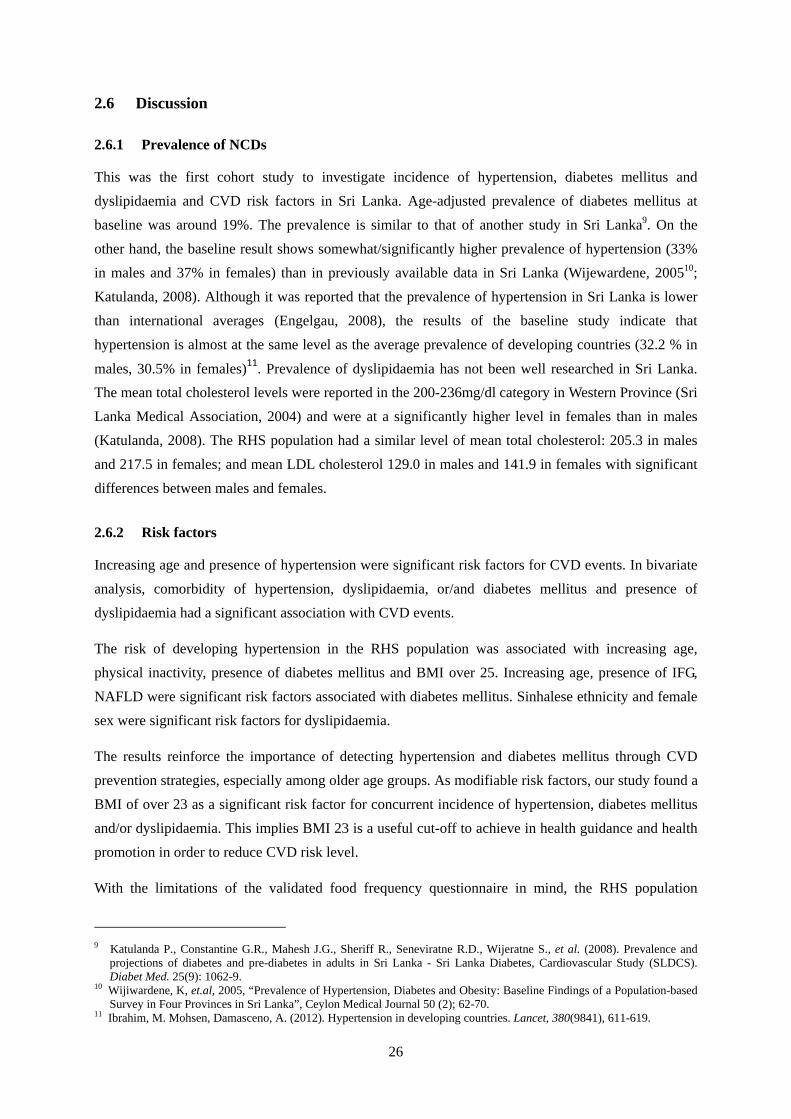
c) Dyslipidaemia
On multivariate analysis, independent predictors of incident dyslipidaemia were Sinhalese ethnicity
and female sex (Table 2-13). Although no significant association with age was observed with
adjustment for sex group, the younger age group had higher incidence in both males and females
(Table 2-14).
Table 2-13: Multivariate analysis of association between incidence of dyslipidaemia and risk factors (n=1,455)
Risk factors % HR 95%CI
Female 71.3 1.39 1.18 – 1.62 ++
Age 45-54 years 63.3 0.96 0.79 – 1.16
Age 55-64 years 57.1 0.94 0.77 – 1.14
Sinhalese 62.3 2.12 1.39 – 3.24 +
BMI >=23 65.1 1.06 0.912 – 1.24
Hypertension at baseline 58.1 0.88 0.76 – 1.03
NAFLD at baseline 71.9 1.22 1.01 – 1.47
Regular smoker 54.7 0.92 0.74 – 1.16
Regular alcohol consumption 52.2 9.93 0.74 – 1.18
Unsatisfactory sleeping pattern 44.7 0.79 0.65 – 0.95 * Note: * p<0.05; + p<0.01; ++ p<0.001 Source: In-depth Analysis Report 2012

24
Table 2-14: Incidence of dyslipidaemia by sex and age group
Age-Sex
Group
Number
without
dyslipidaemia
at baseline
Number of new
cases by 2010
Person years
of follow-up
Incidence per
1000 PY 95% CI
Male 887 495 2725.29 181.63 (165.98-198.36)
35-44 154 101 (14.6) 484.23 208.58 (169.89-253.44)
45-54 305 167 (20.7) 935.47 178. 52 (152.47-207.74)
55-64 428 227 (33.9) 1305.59 173.87 (151.98-198.02)
Female 558 398 1728.53 230.25 (208.18-254.02)
35-44 108 85 (19.6) 337.80 251.63 (200.99-311.15)
45-54 207 157 (26.1) 640.79 245.01 (208.18-286.48)
55-64 243 156 (29.6) 749.94 208.02 (176.65-243.34)
Total 1445 893 (24.8) 4453.82 200.50 (187.57-214.10) Source: In-depth Analysis Report 2012
d) Concurrent incidence of hypertension, diabetes mellitus, and dyslipidaemia
The risk of concurrent incidence of hypertension and dyslipidaemia was statistically significant for the
following variables: BMI ≥23 kg/m2 at baseline (HR: 1.63; 95%CI: 1.05-2.53; p<0.05), female sex
(HR: 1.49; 95%CI: 1.02-2.20; p<0.05), and presence of NAFLD at baseline (HR: 1.72; 95%CI:
1.13-2.62; p<0.05).
The risk of concurrent incidence of hypertension and diabetes mellitus was statistically significant for
the following variables: BMI ≥23 kg/m2 at baseline (HR: 2.11; 95%CI: 1.13-3.92; p<0.05), presence of
NAFLD at baseline (HR: 2.50; 95%CI:1.41-4.45; p<0.05), age 45-54 at baseline (HR: 2.07;
95%CI:1.03-4.13; p<0.05), and age 55-64 at baseline (HR: 4.46; 95%CI:2.27-8.79; p<0.001).
The risk of concurrent incidence of dyslipidaemia and diabetes mellitus was statistically significant for
the following variables: BMI ≥23 kg/m2 at baseline (HR: 1.53; 95%CI: 1.05-2.23; p<0.05) and
presence of NAFLD at baseline (HR: 1.64; 95%CI:1.06-2.54; p<0.05).
The risk of concurrent incidence of hypertension, dyslipidaemia and diabetes mellitus was statistically
significant for the following variables: BMI ≥23 kg/m2 at baseline (HR: 4.16; 95%CI: 1.45-11.93;
p<0.05).
e) CVD events
Being older was a significant predictor of CVD events. Subjects in the age group 45-54 years were 2.7
times and age group 55-64 years were 3.3 times more likely to develop CVD events compared with
those in the age group 35-44 years (Table 2-15). Even after adjusting for the effects of aging,
hypertension was a significant predictor.

25
Table 2-15: Multivariate analysis of association between CVD events and risk factors
Risk factors % HR 95%CI
Age 45-54 years 1.2 2.73 1.05-7.09*
Age 55-64 years 3.1 3.34 1.29-8.64*
Experience of stressful life event 4.7 0.67 0.43-1.05
Hypertension 4.4 1.70 1.06-2.70* Note: * p<0.05; + p<0.01; ++ p<0.001, Abbreviation: HR, hazard ratio Source: Second Follow-up Survey 2010
The relative risk of CVD events significantly increased with comorbidity of hypertension,
dyslipidaemia or/and diabetes mellitus (Relative Risk=2.45, 95%CI: 1.62-3.71).
(3) Dietary profile
Table 2-16 shows median energy intake, % of carbohydrates, fat intake, protein intake and median
sodium intake among the 1,917 subjects in 2010.
Table 2-16: Nutrition intake of the subjects
Male (n=830)
Median (interquartile range)
Female (n=1,087)
Median (interquartile range)
Energy Intake (Kcal) 2,950 (2,430-3,604) 2,370 (1,872-2,839)
Carbohydrate (%) 72.7 (68.5-76.3) 72.7 (68.1-76.4)
Fat (%) 16.5 (13.5-20.1) 16.8 (13.6-20.6)
Protein (%) 10.4 (9.7-11.4) 10.2 (9.5-11.1)
Salt intake (g) 7.6 (5.6-10.3) 6.1 (4.8-7.9) Note: Amount of salt was converted from amount of sodium intake by multiplying 2.5 Source: In-depth Analysis Report 2012
Over 94% of both males and females receive more than 60% of their energy from carbohydrates.
About 66% (n=1,271) receive more than 70% of their daily energy from carbohydrates. Those who
receive >60% of their daily energy intake from carbohydrates are more likely to have dyslipidaemia
(OR=1.64, 95%CI: 1.02-2.65, p<0.05), while diabetes mellitus is less prevalent among them
(OR=0.63, 95%CI: 0.42-0.92, p<0.05).
A larger percentage of subjects (44.6%) receiving >10.3% of their daily energy intake from protein
have prevalent diabetes mellitus as compared to subjects recenving <=10.3% of their daily energy
intake from protein (36.6%). The association was statistically significant (OR=1.397, 95%CI:
1.16-1.68, p<0.001).
Approximately 18% (n=348) of the sample consumed more than 10g of salt daily. The percentage
consuming more than 5g of salt was 75.1% (n=794). No significance was observed in the association
between consumption of salt and prevalence/incidence of hypertension.
26
2.6 Discussion
2.6.1 Prevalence of NCDs
This was the first cohort study to investigate incidence of hypertension, diabetes mellitus and
dyslipidaemia and CVD risk factors in Sri Lanka. Age-adjusted prevalence of diabetes mellitus at
baseline was around 19%. The prevalence is similar to that of another study in Sri Lanka9. On the
other hand, the baseline result shows somewhat/significantly higher prevalence of hypertension (33%
in males and 37% in females) than in previously available data in Sri Lanka (Wijewardene, 200510;
Katulanda, 2008). Although it was reported that the prevalence of hypertension in Sri Lanka is lower
than international averages (Engelgau, 2008), the results of the baseline study indicate that
hypertension is almost at the same level as the average prevalence of developing countries (32.2 % in
males, 30.5% in females)11. Prevalence of dyslipidaemia has not been well researched in Sri Lanka.
The mean total cholesterol levels were reported in the 200-236mg/dl category in Western Province (Sri
Lanka Medical Association, 2004) and were at a significantly higher level in females than in males
(Katulanda, 2008). The RHS population had a similar level of mean total cholesterol: 205.3 in males
and 217.5 in females; and mean LDL cholesterol 129.0 in males and 141.9 in females with significant
differences between males and females.
2.6.2 Risk factors
Increasing age and presence of hypertension were significant risk factors for CVD events. In bivariate
analysis, comorbidity of hypertension, dyslipidaemia, or/and diabetes mellitus and presence of
dyslipidaemia had a significant association with CVD events.
The risk of developing hypertension in the RHS population was associated with increasing age,
physical inactivity, presence of diabetes mellitus and BMI over 25. Increasing age, presence of IFG,
NAFLD were significant risk factors associated with diabetes mellitus. Sinhalese ethnicity and female
sex were significant risk factors for dyslipidaemia.
The results reinforce the importance of detecting hypertension and diabetes mellitus through CVD
prevention strategies, especially among older age groups. As modifiable risk factors, our study found a
BMI of over 23 as a significant risk factor for concurrent incidence of hypertension, diabetes mellitus
and/or dyslipidaemia. This implies BMI 23 is a useful cut-off to achieve in health guidance and health
promotion in order to reduce CVD risk level.
With the limitations of the validated food frequency questionnaire in mind, the RHS population
9 Katulanda P., Constantine G.R., Mahesh J.G., Sheriff R., Seneviratne R.D., Wijeratne S., et al. (2008). Prevalence and
projections of diabetes and pre-diabetes in adults in Sri Lanka - Sri Lanka Diabetes, Cardiovascular Study (SLDCS). Diabet Med. 25(9): 1062-9.
10 Wijiwardene, K, et.al, 2005, “Prevalence of Hypertension, Diabetes and Obesity: Baseline Findings of a Population-based Survey in Four Provinces in Sri Lanka”, Ceylon Medical Journal 50 (2); 62-70.
11 Ibrahim, M. Mohsen, Damasceno, A. (2012). Hypertension in developing countries. Lancet, 380(9841), 611-619.
27
indicated relatively higher energy intake (median 2,950kcal in males and 2,370kcal in females) than
previously available data12. In Sri Lanka, it is recommended to receive 50 to 65% of daily requirement
of energy from carbohydrates, 10 to 15% from protein, 15-30% from fat, and consume less than 5g of
salt13. Our study observed 73% from carbohydrates 10% from protein, 17% from fat and 7.6g of salt
in males and 6.1 g in females as mean value of daily energy intake. Relatively higher intake of
carbohydrates in the South Asian region was reported in several studies14, and it has been pointed out
that consumption of large carbohydrate meals may lead to hyperinsulinaemia, high serum TAG and
low HDL-cholesterol levels among the population. The result also found a significant association
between high intake of carbohydrates and presence of dyslipidaemia. The association between low
intake of carbohydrates and the presence of diabetes mellitus in our study may be due to dietary
modification according to nutritional guidance in their treatment. No significant association was
observed between the presence of dyslipidaemia and amount of fat intake. It may due to the high ratio
of saturated fats to polyunsaturated fats compared to a recommended ratio of <1:1 has been pointed
out in other studies15. In this study, type of fat was not investigated and therefore the ratio of saturated
fats to polyunsaturated fats was not known.
2.7 Recommendations
The following recommendations have been made by the project.
1) To address the unhealthy lifestyle factors identified in the RHS, promotion of a healthy balanced
diet, physical activity and encouraging maintenance of a BMI <23 is necessary.
2) Considering the strong impact of hypertension on CVD events, it is recommended to create an
opportunity to measure blood pressure regularly in community such as at antenatal clinic centres
and Public Health Inspector (PHI) offices, MOHs and hospitals. Since presence of diabetes
mellitus is a significant risk factor for hypertension and IFG is an important risk factor for diabetes
mellitus, health guidance programs that target people with IFG are important to prevent both
diabetes mellitus and hypertension.
3) Older age groups should be given priority for screening since the risk of hypertension, diabetes
mellitus and CVD events significantly increase with age, especially after 55 years of age.
4) Comorbidity of dyslipidaemia with hypertension or/and diabetes mellitus significantly increases
CVD event risk. Therefore it is strongly recommended to test lipid profiles for those who develop
12 Jayawardena, R., Swaminathan, S., Byrne, Nuala M. et al., (2012). Development of a food frequency questionnaire for Sri
Lankan adults. Nutrition Journal, 11(1),63. 13 Ministry of Health, Nutrition Division, Sri Lanka.2011. Food Based Dietary Guidelines for Sri Lankans. 14 Misra A., Khurana L., Isharwal S. & Bhardwaj S., South Asian diets and insulin resistance. Br. J Nutrition 2009, 101(4),
465-473. 15 Abeywardena, M.Y., 2003, Dietary fats, carbohydrates and vascular disease: Sri Lankan perspectives, Elsevier Ireland
Ltd.
28
hypertension and/or diabetes mellitus.
5) Longer follow-up is needed for identification of risk factors for CVD incidences in Sri Lanka. It is
strongly recommended that this cohort be maintained and the study continued.
2.8 Limitations
A limitation of the study was that the short period of follow-up was inadequate to obtain a sufficient
number of CVD events. This study did not have the statistical power to identify an association
between dyslipidaemia and diabetes and CVD events. It may be due to the small sample of CVD
events. Although dietary habits are considered to be one of the strong risk factors and hence may lead
to the finding of specific Sri Lankan risk factors, our food questionnaire did not enable detailed
information such as type of fat and amount of sugar.

29
CHAPTER 3 NPP models for NCD prevention
As described in Chapter 1, the purpose of the NCD Prevention Project (NPP) is to develop effective
and efficient implementation models to prevent and control NCDs. The main interventions of NPP
consist of (1) screening, (2) health guidance and management, (3) health promotion and (4) social
marketing. The complete NPP model is shown in Figure 3-1.
Figure 3-1: Complete NPP model
Abbreviation: IEC: Information, Education and Communication
The NPP models and interventions are in accordance with the National Policy and Strategic
Framework for Prevention and Control of Chronic Non-Communicable Diseases 2010, and provide
support for national strategies II and IV.
Strategy II: Implement a cost-effective NCD screening programme at community level with
special emphasis on cardiovascular diseases, and
Strategy IV: Empower the community for promotion of healthy lifestyles for NCD prevention and
control.
This Chapter will discuss descriptions, the development process and way forward for each model,
along with how they were compiled into the Guidelines for NCD Prevention.
3.1 Screening Model
3.1.1 Development structure and system
At the national level, TWG subgroups on health check-ups and health information were established in
the Ministry with relevant experts, including professionals from several colleges, universities, and the
WHO, to develop a screening model ensuring technical soundness. The health check-up subgroup was
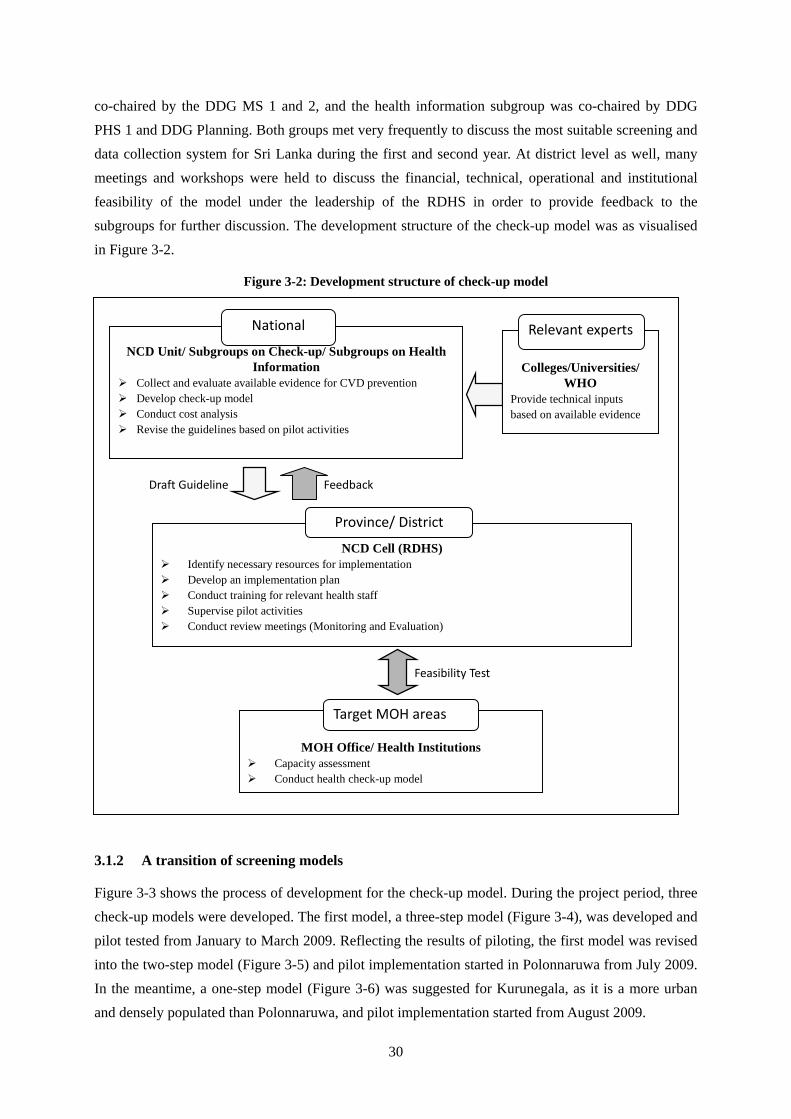
30
co-chaired by the DDG MS 1 and 2, and the health information subgroup was co-chaired by DDG
PHS 1 and DDG Planning. Both groups met very frequently to discuss the most suitable screening and
data collection system for Sri Lanka during the first and second year. At district level as well, many
meetings and workshops were held to discuss the financial, technical, operational and institutional
feasibility of the model under the leadership of the RDHS in order to provide feedback to the
subgroups for further discussion. The development structure of the check-up model was as visualised
in Figure 3-2.
Figure 3-2: Development structure of check-up model
3.1.2 A transition of screening models
Figure 3-3 shows the process of development for the check-up model. During the project period, three
check-up models were developed. The first model, a three-step model (Figure 3-4), was developed and
pilot tested from January to March 2009. Reflecting the results of piloting, the first model was revised
into the two-step model (Figure 3-5) and pilot implementation started in Polonnaruwa from July 2009.
In the meantime, a one-step model (Figure 3-6) was suggested for Kurunegala, as it is a more urban
and densely populated than Polonnaruwa, and pilot implementation started from August 2009.
NCD Cell (RDHS)
Identify necessary resources for implementation Develop an implementation plan Conduct training for relevant health staff Supervise pilot activities Conduct review meetings (Monitoring and Evaluation)
MOH Office/ Health Institutions Capacity assessment Conduct health check-up model
Target MOH areas
Province/ District
Feasibility Test
FeedbackDraft Guideline
NCD Unit/ Subgroups on Check-up/ Subgroups on Health
Information Collect and evaluate available evidence for CVD prevention Develop check-up model Conduct cost analysis Revise the guidelines based on pilot activities
National
Colleges/Universities/ WHO
Provide technical inputs based on available evidence
Relevant experts

31
Figure 3-3: Development process of check-up model
After piloting two models, all the lessons and results were discussed in the Ministry and these
crystallised into a final model that has been included in the NPP Guidelines. The basic characteristics
of each model are summarised in Table 3-1.
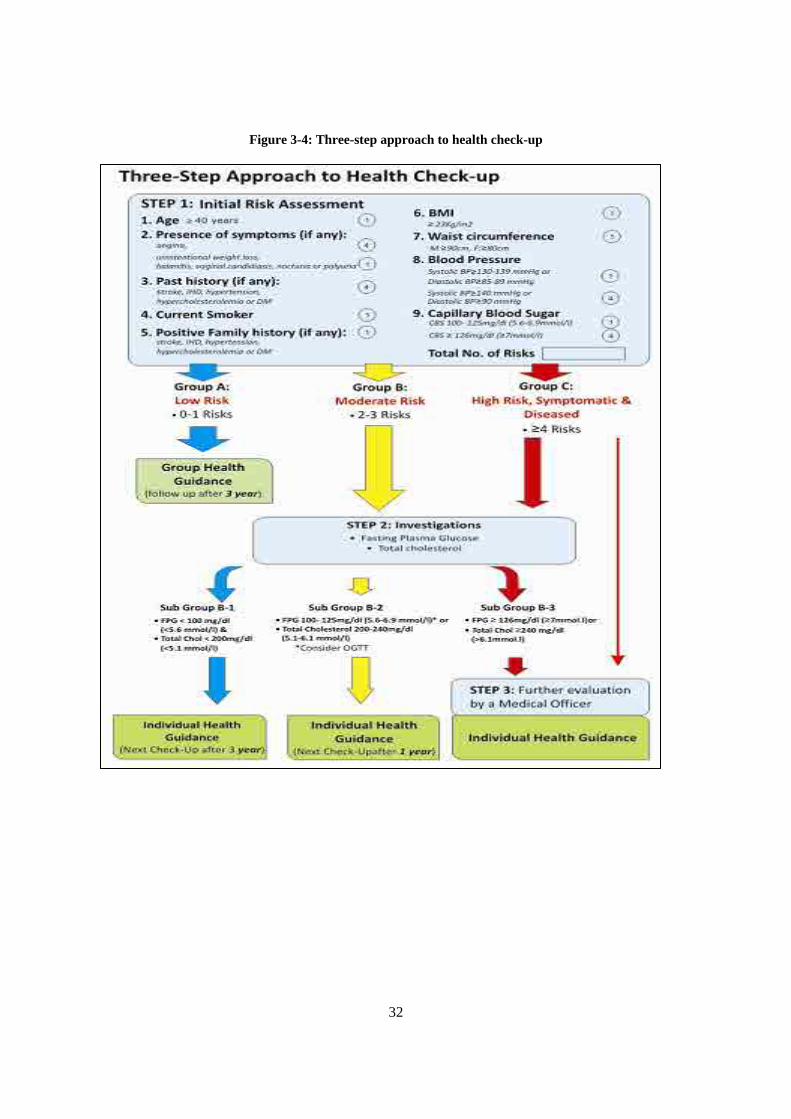
32
Figure 3-4: Three-step approach to health check-up
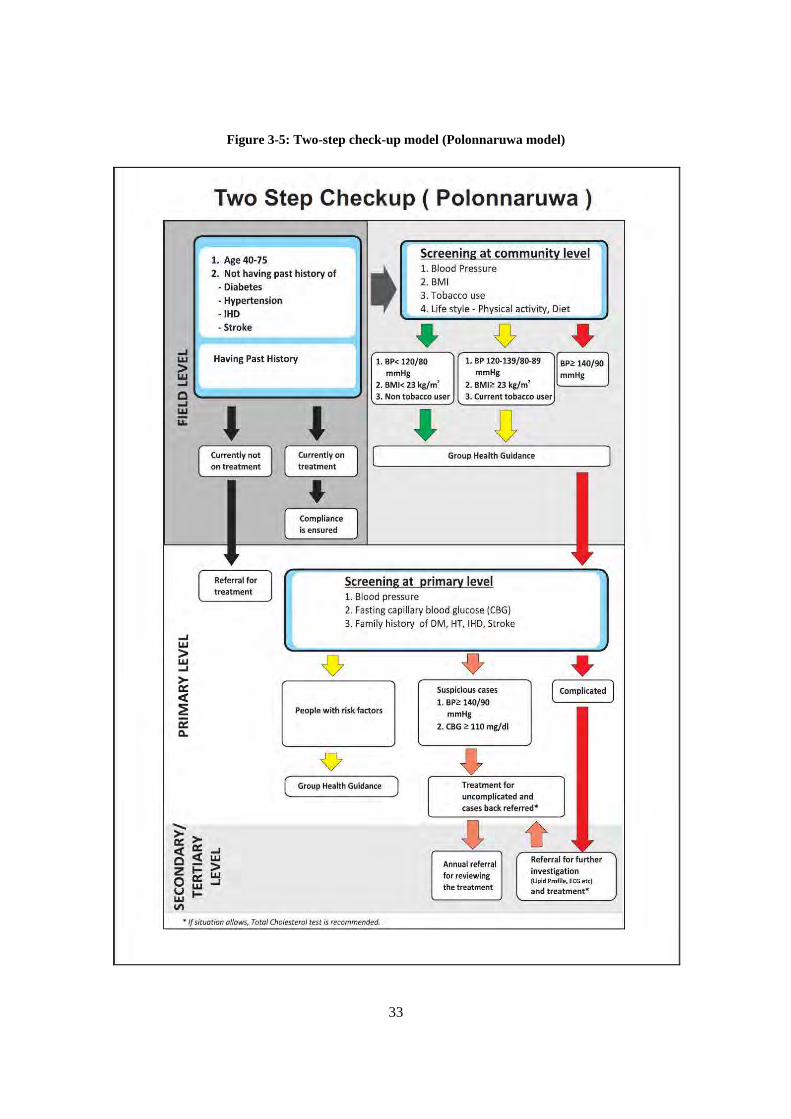
33
Figure 3-5: Two-step check-up model (Polonnaruwa model)
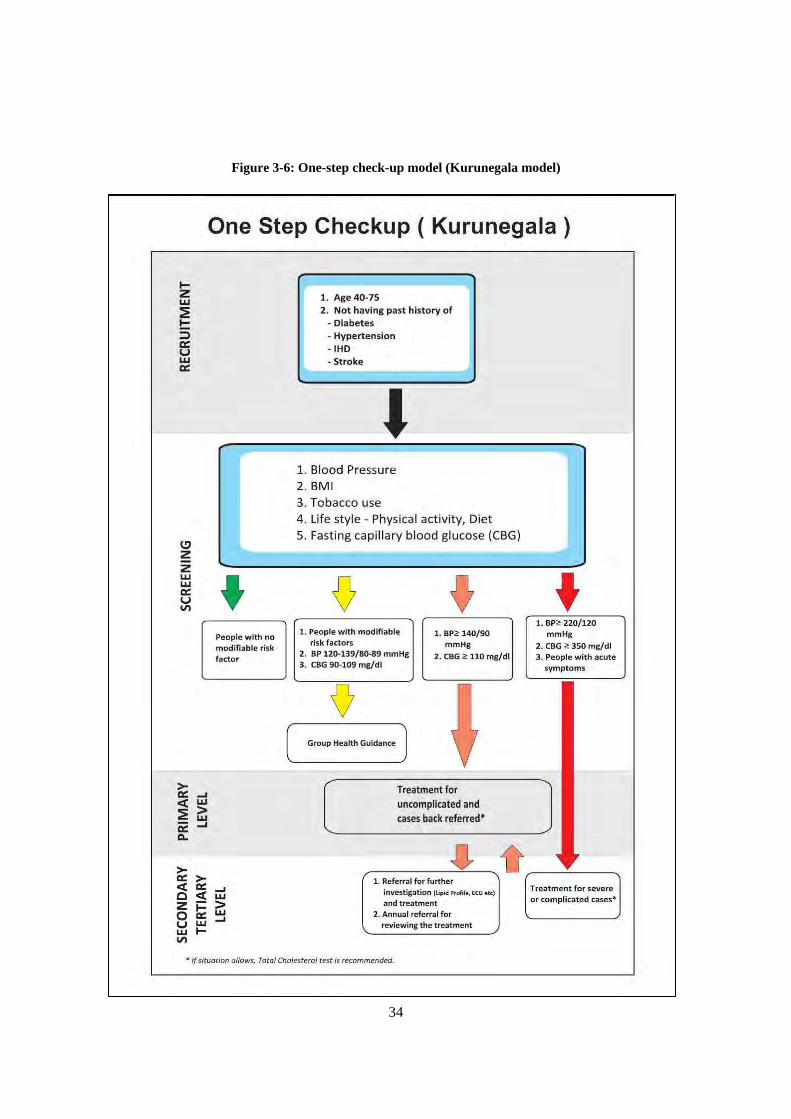
34
Figure 3-6: One-step check-up model (Kurunegala model)
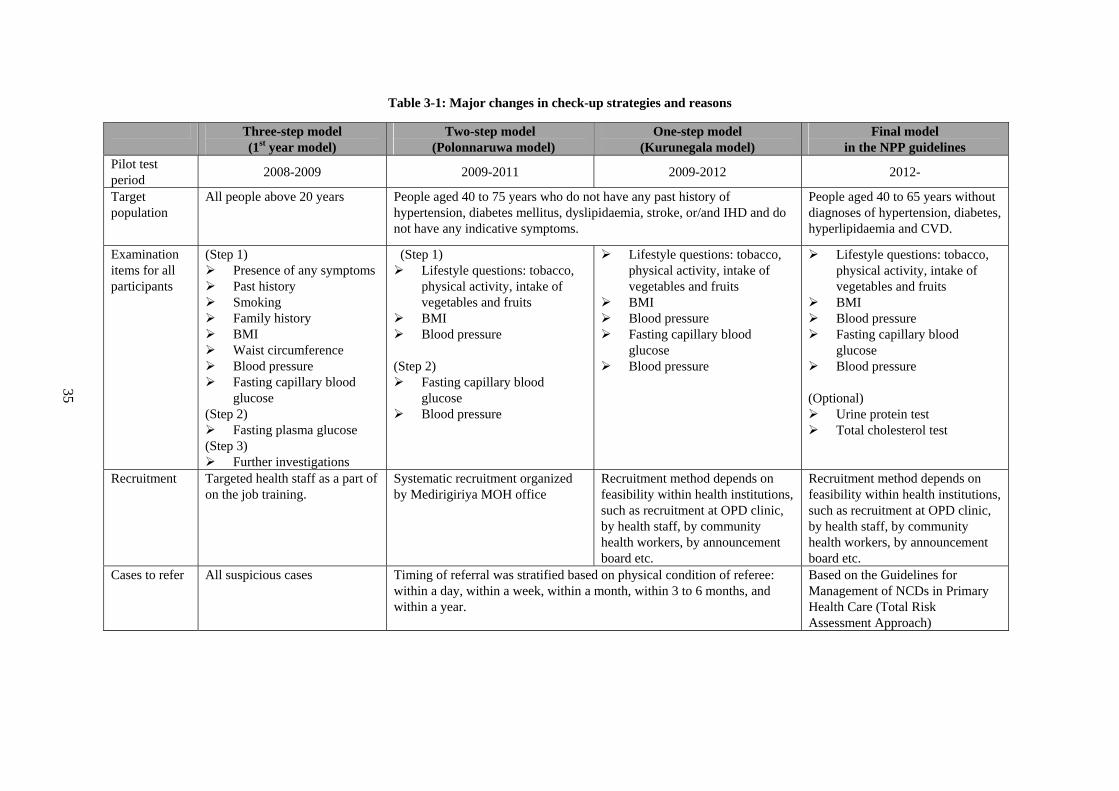
35
Table 3-1: Major changes in check-up strategies and reasons
Three-step model (1st year model)
Two-step model (Polonnaruwa model)
One-step model (Kurunegala model)
Final model in the NPP guidelines
Pilot test period
2008-2009 2009-2011 2009-2012 2012-
Target population
All people above 20 years People aged 40 to 75 years who do not have any past history of hypertension, diabetes mellitus, dyslipidaemia, stroke, or/and IHD and do not have any indicative symptoms.
People aged 40 to 65 years without diagnoses of hypertension, diabetes, hyperlipidaemia and CVD.
Examination items for all participants
(Step 1) Presence of any symptoms Past history Smoking Family history BMI Waist circumference Blood pressure Fasting capillary blood
glucose (Step 2) Fasting plasma glucose (Step 3) Further investigations
(Step 1) Lifestyle questions: tobacco,
physical activity, intake of vegetables and fruits
BMI Blood pressure (Step 2) Fasting capillary blood
glucose Blood pressure
Lifestyle questions: tobacco, physical activity, intake of vegetables and fruits
BMI Blood pressure Fasting capillary blood
glucose Blood pressure
Lifestyle questions: tobacco, physical activity, intake of vegetables and fruits
BMI Blood pressure Fasting capillary blood
glucose Blood pressure (Optional) Urine protein test Total cholesterol test
Recruitment Targeted health staff as a part of on the job training.
Systematic recruitment organized by Medirigiriya MOH office
Recruitment method depends on feasibility within health institutions, such as recruitment at OPD clinic, by health staff, by community health workers, by announcement board etc.
Recruitment method depends on feasibility within health institutions, such as recruitment at OPD clinic, by health staff, by community health workers, by announcement board etc.
Cases to refer All suspicious cases Timing of referral was stratified based on physical condition of referee: within a day, within a week, within a month, within 3 to 6 months, and within a year.
Based on the Guidelines for Management of NCDs in Primary Health Care (Total Risk Assessment Approach)
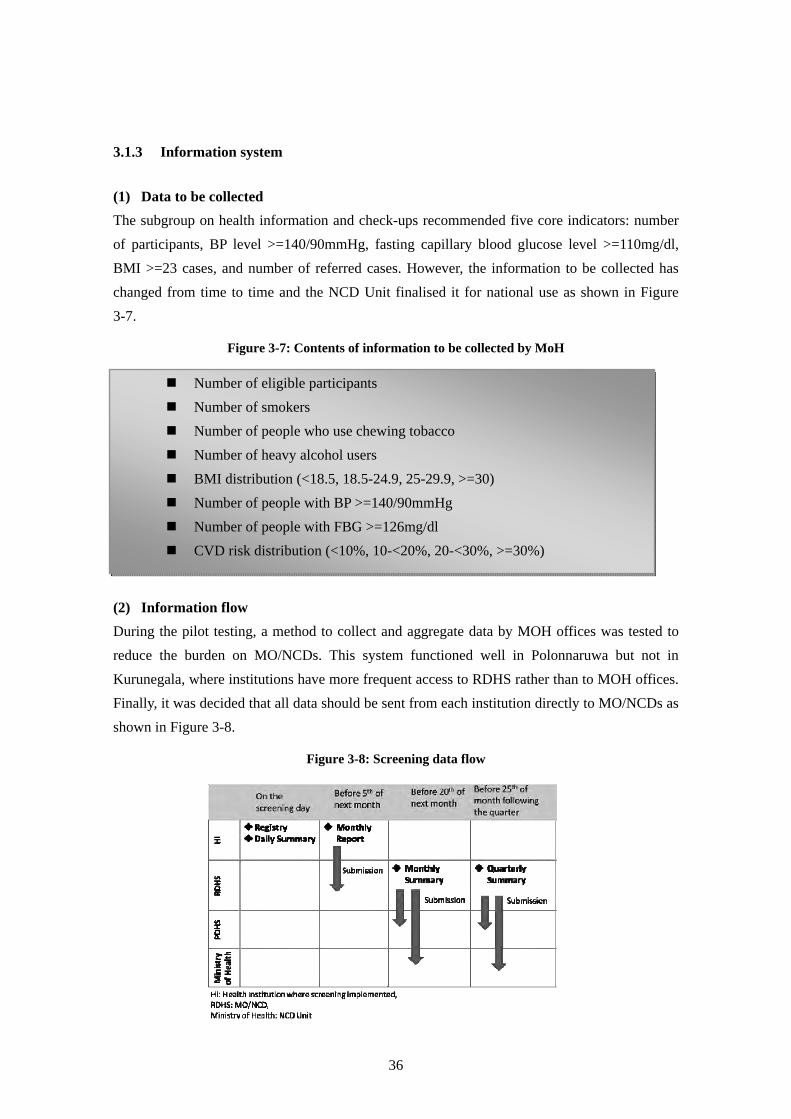
36
3.1.3 Information system
(1) Data to be collected
The subgroup on health information and check-ups recommended five core indicators: number
of participants, BP level >=140/90mmHg, fasting capillary blood glucose level >=110mg/dl,
BMI >=23 cases, and number of referred cases. However, the information to be collected has
changed from time to time and the NCD Unit finalised it for national use as shown in Figure
3-7.
Figure 3-7: Contents of information to be collected by MoH
(2) Information flow
During the pilot testing, a method to collect and aggregate data by MOH offices was tested to
reduce the burden on MO/NCDs. This system functioned well in Polonnaruwa but not in
Kurunegala, where institutions have more frequent access to RDHS rather than to MOH offices.
Finally, it was decided that all data should be sent from each institution directly to MO/NCDs as
shown in Figure 3-8.
Figure 3-8: Screening data flow
Number of eligible participants
Number of smokers
Number of people who use chewing tobacco
Number of heavy alcohol users
BMI distribution (<18.5, 18.5-24.9, 25-29.9, >=30)
Number of people with BP >=140/90mmHg
Number of people with FBG >=126mg/dl
CVD risk distribution (<10%, 10-<20%, 20-<30%, >=30%)
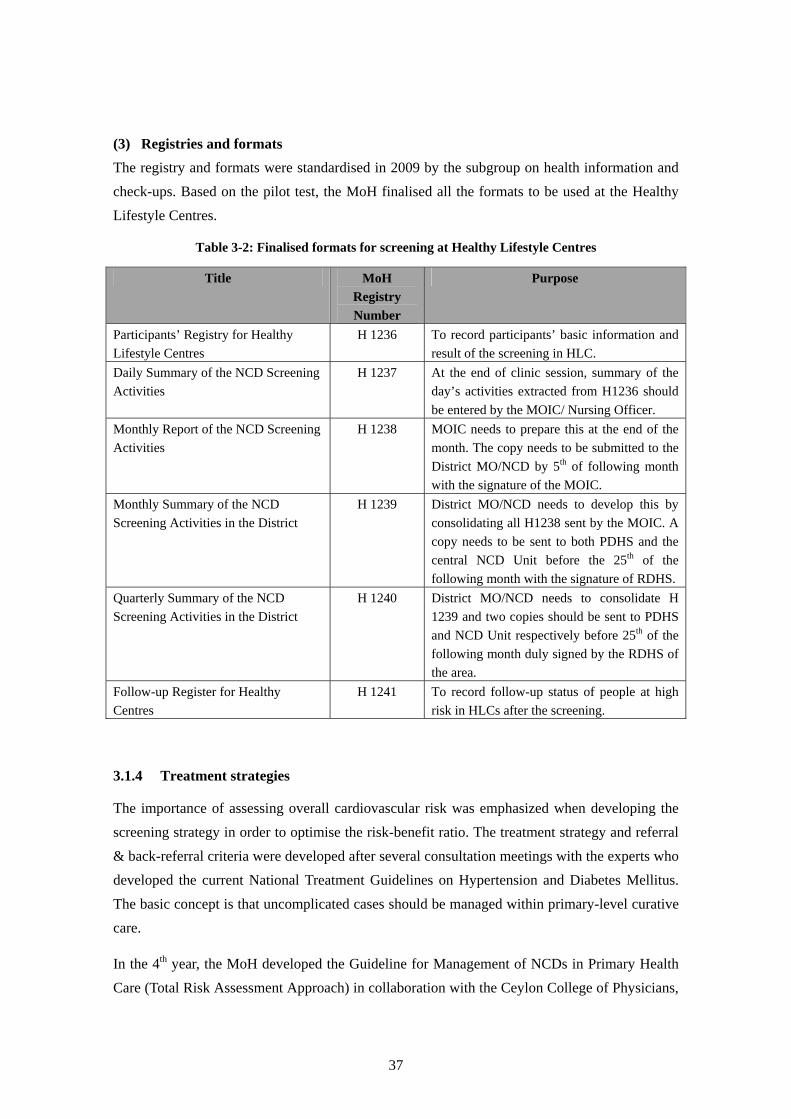
37
(3) Registries and formats
The registry and formats were standardised in 2009 by the subgroup on health information and
check-ups. Based on the pilot test, the MoH finalised all the formats to be used at the Healthy
Lifestyle Centres.
Table 3-2: Finalised formats for screening at Healthy Lifestyle Centres
Title MoH
Registry
Number
Purpose
Participants’ Registry for Healthy
Lifestyle Centres
H 1236 To record participants’ basic information and
result of the screening in HLC.
Daily Summary of the NCD Screening
Activities
H 1237 At the end of clinic session, summary of the
day’s activities extracted from H1236 should
be entered by the MOIC/ Nursing Officer.
Monthly Report of the NCD Screening
Activities
H 1238 MOIC needs to prepare this at the end of the
month. The copy needs to be submitted to the
District MO/NCD by 5th of following month
with the signature of the MOIC.
Monthly Summary of the NCD
Screening Activities in the District
H 1239 District MO/NCD needs to develop this by
consolidating all H1238 sent by the MOIC. A
copy needs to be sent to both PDHS and the
central NCD Unit before the 25th of the
following month with the signature of RDHS.
Quarterly Summary of the NCD
Screening Activities in the District
H 1240 District MO/NCD needs to consolidate H
1239 and two copies should be sent to PDHS
and NCD Unit respectively before 25th of the
following month duly signed by the RDHS of
the area.
Follow-up Register for Healthy
Centres
H 1241 To record follow-up status of people at high
risk in HLCs after the screening.
3.1.4 Treatment strategies
The importance of assessing overall cardiovascular risk was emphasized when developing the
screening strategy in order to optimise the risk-benefit ratio. The treatment strategy and referral
& back-referral criteria were developed after several consultation meetings with the experts who
developed the current National Treatment Guidelines on Hypertension and Diabetes Mellitus.
The basic concept is that uncomplicated cases should be managed within primary-level curative
care.
In the 4th year, the MoH developed the Guideline for Management of NCDs in Primary Health
Care (Total Risk Assessment Approach) in collaboration with the Ceylon College of Physicians,
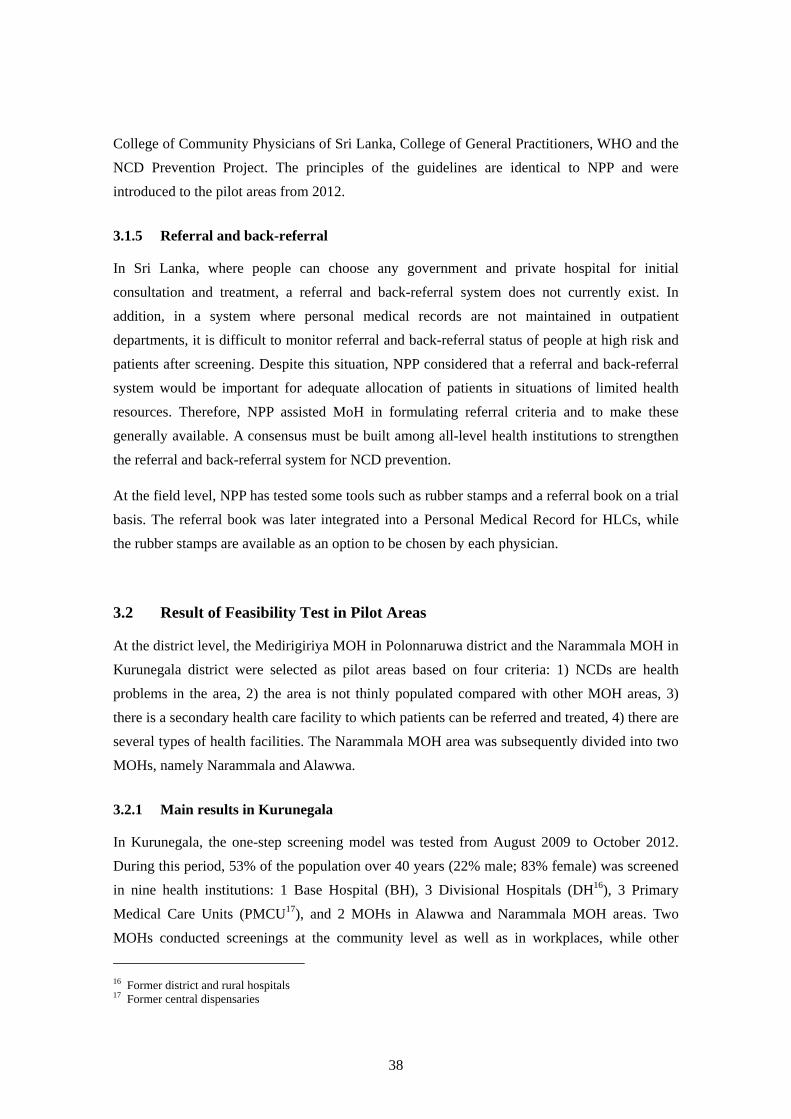
38
College of Community Physicians of Sri Lanka, College of General Practitioners, WHO and the
NCD Prevention Project. The principles of the guidelines are identical to NPP and were
introduced to the pilot areas from 2012.
3.1.5 Referral and back-referral
In Sri Lanka, where people can choose any government and private hospital for initial
consultation and treatment, a referral and back-referral system does not currently exist. In
addition, in a system where personal medical records are not maintained in outpatient
departments, it is difficult to monitor referral and back-referral status of people at high risk and
patients after screening. Despite this situation, NPP considered that a referral and back-referral
system would be important for adequate allocation of patients in situations of limited health
resources. Therefore, NPP assisted MoH in formulating referral criteria and to make these
generally available. A consensus must be built among all-level health institutions to strengthen
the referral and back-referral system for NCD prevention.
At the field level, NPP has tested some tools such as rubber stamps and a referral book on a trial
basis. The referral book was later integrated into a Personal Medical Record for HLCs, while
the rubber stamps are available as an option to be chosen by each physician.
3.2 Result of Feasibility Test in Pilot Areas
At the district level, the Medirigiriya MOH in Polonnaruwa district and the Narammala MOH in
Kurunegala district were selected as pilot areas based on four criteria: 1) NCDs are health
problems in the area, 2) the area is not thinly populated compared with other MOH areas, 3)
there is a secondary health care facility to which patients can be referred and treated, 4) there are
several types of health facilities. The Narammala MOH area was subsequently divided into two
MOHs, namely Narammala and Alawwa.
3.2.1 Main results in Kurunegala
In Kurunegala, the one-step screening model was tested from August 2009 to October 2012.
During this period, 53% of the population over 40 years (22% male; 83% female) was screened
in nine health institutions: 1 Base Hospital (BH), 3 Divisional Hospitals (DH16), 3 Primary
Medical Care Units (PMCU17), and 2 MOHs in Alawwa and Narammala MOH areas. Two
MOHs conducted screenings at the community level as well as in workplaces, while other
16 Former district and rural hospitals 17 Former central dispensaries
39
curative health care institutions conducted screenings on the premises.
The prevalence of hypertension among participants was 26% of males and 25 % of females. The
prevalence of high blood glucose level (>=110mg/dl) was 18% of males and 16% of females.
The number of screening participants needed to detect one case of CVD Risk >=20% was 33 for
males and 29 for females. Group health guidance was provided to all participants by health staff
including doctors in all institutions.
3.2.2 Main results in Polonnaruwa
In Polonnaruwa, the two-step model was pilot tested from July 2009. By the end of 201118, 42%
of the target population (23% male; 66% female) was screened in Medirigiriya MOH area. In
the two-step model, the initial screening (step one) was conducted by Public Health Inspectors
(PHIs) and Public Health Midwives (PHMs) at community health centres of all PHM areas. The
next step (step two) was conducted in four curative institutions: 1 BH and 3 PMCUs.
The prevalence of hypertension among participants was 29% of males and 32 % of females. The
prevalence of high blood glucose level (>=110mg/dl) was 6% of males and 9% of females. The
number of screening participants needed to detect one case of CVD Risk >=20% was 63 for
males and 53 for females. Group health guidance was provided to all the step-one participants
by MOH staff. Due to lack of manpower, however, health guidance was not provided for
step-two participants at PMCU. Instead, minor staff at PMCU assisted people at high risk of
CVD in monitoring their BMI on their follow-up visits. At BH, group health guidance was
provided at step 2.
3.3 Initial Effects of Health Check-up
In order to evaluate effectiveness of the screening models, two surveys were conducted during
the project period.
3.3.1 Follow-up survey for people at high risk of CVD
(1) Objective
To understand current situation of people at high risk of CVD who have participated in the
check-ups.
18 The pilot test finished in Medirigiriya by the end of 2011 and Healthy Lifestyle centres (HLCs) started at curative
health institutions at the instruction of the MoH.

40
(2) Method
All check-up participants from August 2009 to October 2010 whose CVD event risk was more
than 20% were listed based on the check-up registries from the all target institutions.
Knowledge of lifestyle modification and CVD risk, treatment status, and current CVD event
risk was investigated by using a questionnaire that was prepared by NPP with NCD Unit.
(3) Results in Kurunegala
During the survey period, 6,867 people participated in the check-up in Narammala and Alawwa
MOH areas. Of these, 228 people (3.3%) were identified as being in the CVD high risk group.
Although the follow-up survey started at the same time as Polonnaruwa, only 31 people (13.6%)
were surveyed regarding their current CVD event risk and 13 people (5.7%) were able to answer
at least some questions over the phone. The relatively low coverage in Kurunegala was mainly
due to following reasons:
The address written in the check-up registries did not have sufficient information to locate
their residence. The telephone number was not written in the check-up registries for 70% of
subjects.
Community health workers, such as PHIs and PHMs, were not involved in either
recruitment or check-up in most of the cases. Therefore, staff could not obtain their
assistance in the survey.
Table 3-3: Target population of the follow-up survey in Alawwa and Narammala MOH areas, Kurunegala
CVD event risk at check-up
No. of participants at check-ups
No. of people examined in the follow-up survey
Number of deaths
confirmed
No. of people who couldn’t be located in the survey
By phone By visiting Total (% of
coverage)
20%-<30% 94 6 11 17 (18.1%) 0 77
30%-<40% 87 3 9 12 (13.8%) 0 75
>=40% 47 4 11 15 (31.9%) 0 32
Total 228 13 31 44 (19.3%) 0 184
As shown in Table 3-4, all except one participant19 confirmed that they had improved their
CVD event risk after the check-up. Out of 44 subjects covered in this survey, all subjects who
were instructed to receive medical treatment confirmed their compliance, while 12 subjects
were instructed to modify their lifestyle without any medication.
19 Her blood glucose level was controlled after the check-up but her BP level remained high at the time of the study
and therefore her CVD event risk level was still 30-<40%.

41
Table 3-4: Current health status and treatment status
CVD risk Treatment Reduced Not
improvedContinued Not
necessary* Stopped by own will
20%-<30% 11 0 11 6 0
30%-<40% 8 1 7 5 0
>=40% 11 0 14 1 0
Total 30 1 32 12 0 Note: Treatment status includes the people who were confirmed by phone.
Most people at high risk of CVD do not know their ideal weight (86%), blood pressure (82%),
or blood glucose level (95%). Just 25% of people at high risk of CVD were able to recognize
their CVD event risk. The most common health instruction that they remembered was salt
reduction (77%), increasing the amount of daily vegetables and fruits (61%), and sugar
reduction (57%). Fewer people remembered receiving instructions to increase their physical
exercise compared with dietary instructions.
In addition to this study, the NCD cell in Kurunegala RDHS confirmed the percentage of people
who returned for a follow-up at a medical clinic. According to their data, based on a survey
from the first quarter of 2012, 78% of people at high risk of CVD are under treatment.
(4) Results in Polonnaruwa
During the survey period, 1,937 people participated in the check-ups. Out of them, 61 people
(3.1%) were identified as CVD event risk >=20%20. The survey was conducted with the
consistent assistance of Medirigiriya MOH. All PHMs visited the target subjects using the
address written in the check-up registries. They measured weight, re-calculated BMI, tested
fasting blood glucose and blood pressure.
Table 3-5 shows follow-up status by CVD risk status. It turned out that four subjects had already
passed away and another four subjects were untraceable due to change in their residences. In
Polonnaruwa, the survey coverage reached 86.9%. This high coverage was made possible since
it was relatively easy for PHMs to find the subject’s residence after their initial recruitment for
step-one screening. Having filled in the registries by themselves also facilitated the high
coverage.
20 The reason why Polonnaruwa had a lower number of people at high risk was due to the screening model.
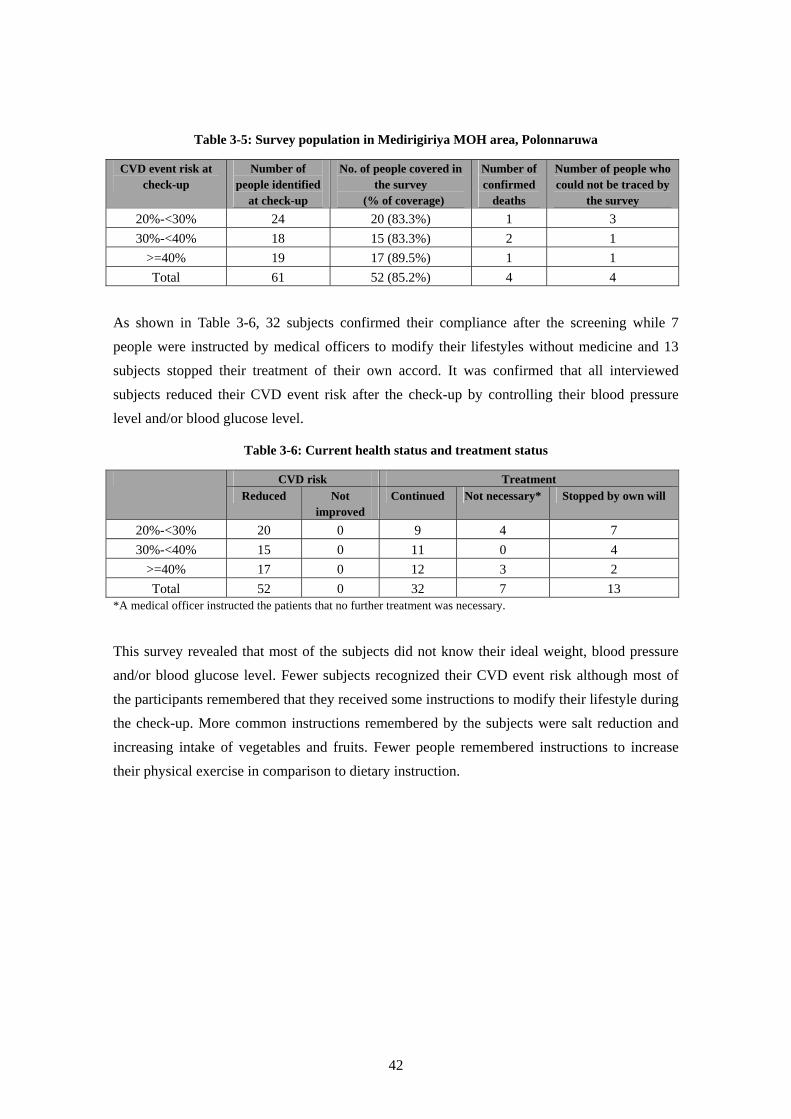
42
Table 3-5: Survey population in Medirigiriya MOH area, Polonnaruwa
CVD event risk at check-up
Number of people identified
at check-up
No. of people covered in the survey
(% of coverage)
Number of confirmed
deaths
Number of people who could not be traced by
the survey
20%-<30% 24 20 (83.3%) 1 3
30%-<40% 18 15 (83.3%) 2 1
>=40% 19 17 (89.5%) 1 1
Total 61 52 (85.2%) 4 4
As shown in Table 3-6, 32 subjects confirmed their compliance after the screening while 7
people were instructed by medical officers to modify their lifestyles without medicine and 13
subjects stopped their treatment of their own accord. It was confirmed that all interviewed
subjects reduced their CVD event risk after the check-up by controlling their blood pressure
level and/or blood glucose level.
Table 3-6: Current health status and treatment status
CVD risk Treatment
Reduced Not improved
Continued Not necessary* Stopped by own will
20%-<30% 20 0 9 4 7
30%-<40% 15 0 11 0 4
>=40% 17 0 12 3 2
Total 52 0 32 7 13 *A medical officer instructed the patients that no further treatment was necessary.
This survey revealed that most of the subjects did not know their ideal weight, blood pressure
and/or blood glucose level. Fewer subjects recognized their CVD event risk although most of
the participants remembered that they received some instructions to modify their lifestyle during
the check-up. More common instructions remembered by the subjects were salt reduction and
increasing intake of vegetables and fruits. Fewer people remembered instructions to increase
their physical exercise in comparison to dietary instruction.
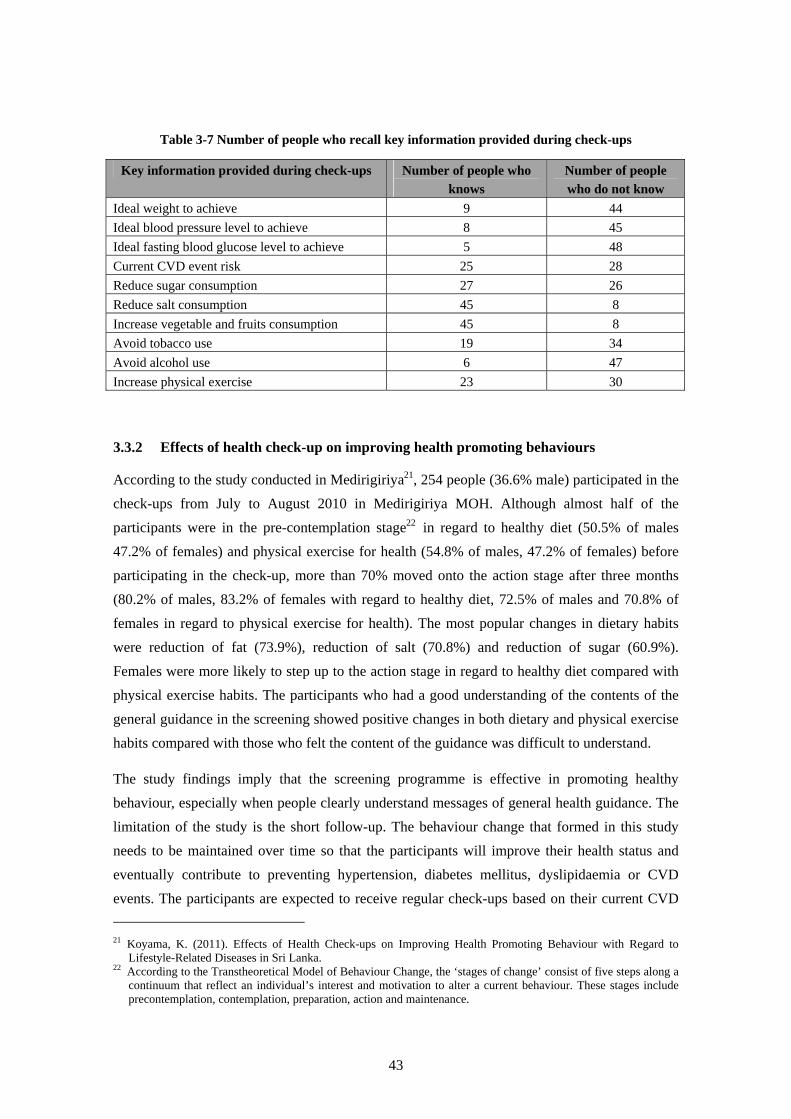
43
Table 3-7 Number of people who recall key information provided during check-ups
Key information provided during check-ups Number of people who
knows
Number of people
who do not know
Ideal weight to achieve 9 44
Ideal blood pressure level to achieve 8 45
Ideal fasting blood glucose level to achieve 5 48
Current CVD event risk 25 28
Reduce sugar consumption 27 26
Reduce salt consumption 45 8
Increase vegetable and fruits consumption 45 8
Avoid tobacco use 19 34
Avoid alcohol use 6 47
Increase physical exercise 23 30
3.3.2 Effects of health check-up on improving health promoting behaviours
According to the study conducted in Medirigiriya21, 254 people (36.6% male) participated in the
check-ups from July to August 2010 in Medirigiriya MOH. Although almost half of the
participants were in the pre-contemplation stage22 in regard to healthy diet (50.5% of males
47.2% of females) and physical exercise for health (54.8% of males, 47.2% of females) before
participating in the check-up, more than 70% moved onto the action stage after three months
(80.2% of males, 83.2% of females with regard to healthy diet, 72.5% of males and 70.8% of
females in regard to physical exercise for health). The most popular changes in dietary habits
were reduction of fat (73.9%), reduction of salt (70.8%) and reduction of sugar (60.9%).
Females were more likely to step up to the action stage in regard to healthy diet compared with
physical exercise habits. The participants who had a good understanding of the contents of the
general guidance in the screening showed positive changes in both dietary and physical exercise
habits compared with those who felt the content of the guidance was difficult to understand.
The study findings imply that the screening programme is effective in promoting healthy
behaviour, especially when people clearly understand messages of general health guidance. The
limitation of the study is the short follow-up. The behaviour change that formed in this study
needs to be maintained over time so that the participants will improve their health status and
eventually contribute to preventing hypertension, diabetes mellitus, dyslipidaemia or CVD
events. The participants are expected to receive regular check-ups based on their current CVD
21 Koyama, K. (2011). Effects of Health Check-ups on Improving Health Promoting Behaviour with Regard to
Lifestyle-Related Diseases in Sri Lanka. 22 According to the Transtheoretical Model of Behaviour Change, the ‘stages of change’ consist of five steps along a
continuum that reflect an individual’s interest and motivation to alter a current behaviour. These stages include precontemplation, contemplation, preparation, action and maintenance.

44
risk status and hence it would be ideal to monitor how regular check-ups contributes to their
health seeing behaviour and health status.
3.4 Health Guidance Model
3.4.1 General health guidance
It is presumed that health guidance to mobilize people to healthier lifestyles is essential for
NCD prevention. In the NPP period, the health guidance component has covered establishing
health guidance methodology, tools, a training program and monitoring system. From the
beginning of the project, the health promotion/health guidance (HP/HG) subgroup spent many
hours preparing guiding principles and initial tools for general health guidance to be conducted
after the screening. After consecutive meetings and discussions, a draft flip chart was developed
by the second year for pilot testing. This flip chart was used for group guidance after the general
CVD screening and it was modified repeatedly until it was approved by JCC at the end of the 3rd
year of the project. By that time, the general health guidance using the flip chart had become an
integral part of the screening, and had become widely prevalent among institutions in the pilot
areas. The basic strategy for the general health guidance is below in Table 3-8.
Table 3-8: General health guidance strategy
Target Participants of CVD screening
Contents General information on CVD and risk factors
How to assess own risk status
How to reduce the risk level
Conductors Trained health staff
Timing After CVD screening (first risk assessment)
Approach
One conductor for 20 to 30 people
Desirably include mutual communication or group
discussion
Duration Sufficient time to cover the topic (45 to 60 minutes)
3.4.2 Follow-up health guidance
Having developed a strategy for general health guidance, the focus shifted to the follow-up
health guidance for high risk populations, how to implement this, and what the details should be.
The discussion continued between the Health Education Bureau (HEB), NCD Unit, RDHS and
MO/NCDs of Kurunegala and Polonnaruwa, DDG Planning, and the JICA team. All the
members agreed that follow-up health guidance should be provided for people at higher risk,
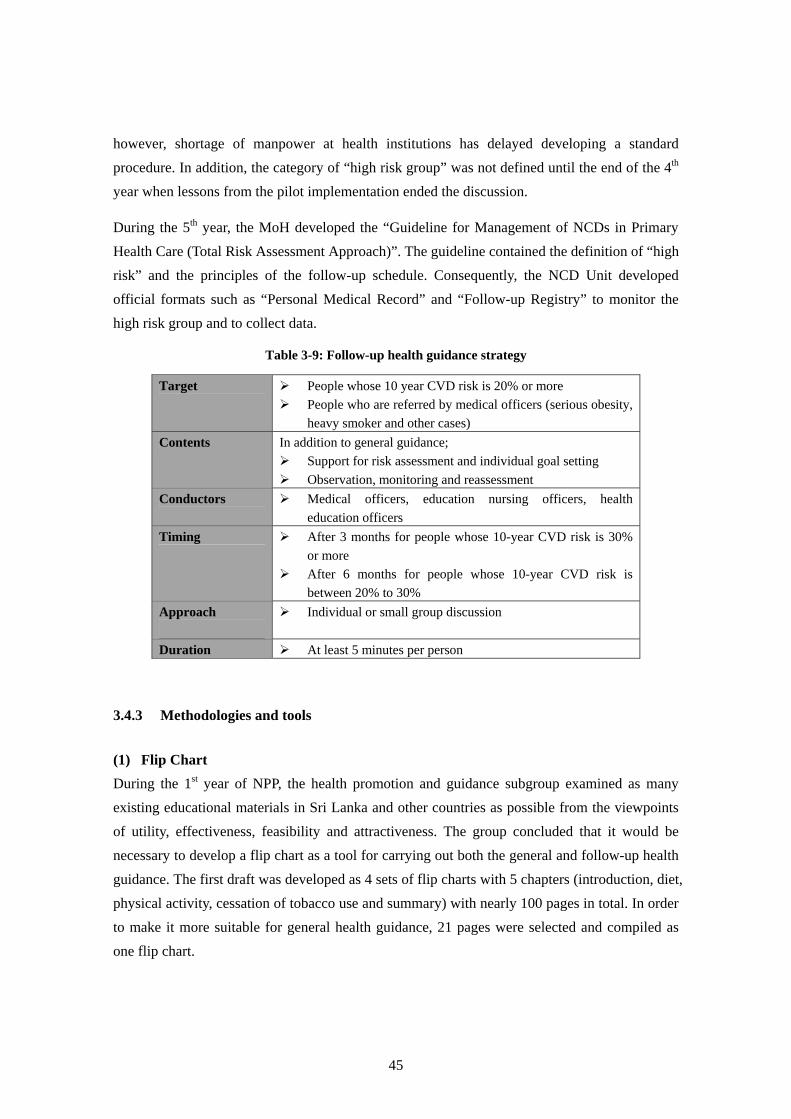
45
however, shortage of manpower at health institutions has delayed developing a standard
procedure. In addition, the category of “high risk group” was not defined until the end of the 4th
year when lessons from the pilot implementation ended the discussion.
During the 5th year, the MoH developed the “Guideline for Management of NCDs in Primary
Health Care (Total Risk Assessment Approach)”. The guideline contained the definition of “high
risk” and the principles of the follow-up schedule. Consequently, the NCD Unit developed
official formats such as “Personal Medical Record” and “Follow-up Registry” to monitor the
high risk group and to collect data.
Table 3-9: Follow-up health guidance strategy
Target People whose 10 year CVD risk is 20% or more
People who are referred by medical officers (serious obesity,
heavy smoker and other cases)
Contents In addition to general guidance;
Support for risk assessment and individual goal setting
Observation, monitoring and reassessment
Conductors Medical officers, education nursing officers, health
education officers
Timing After 3 months for people whose 10-year CVD risk is 30%
or more
After 6 months for people whose 10-year CVD risk is
between 20% to 30%
Approach
Individual or small group discussion
Duration At least 5 minutes per person
3.4.3 Methodologies and tools
(1) Flip Chart
During the 1st year of NPP, the health promotion and guidance subgroup examined as many
existing educational materials in Sri Lanka and other countries as possible from the viewpoints
of utility, effectiveness, feasibility and attractiveness. The group concluded that it would be
necessary to develop a flip chart as a tool for carrying out both the general and follow-up health
guidance. The first draft was developed as 4 sets of flip charts with 5 chapters (introduction, diet,
physical activity, cessation of tobacco use and summary) with nearly 100 pages in total. In order
to make it more suitable for general health guidance, 21 pages were selected and compiled as
one flip chart.
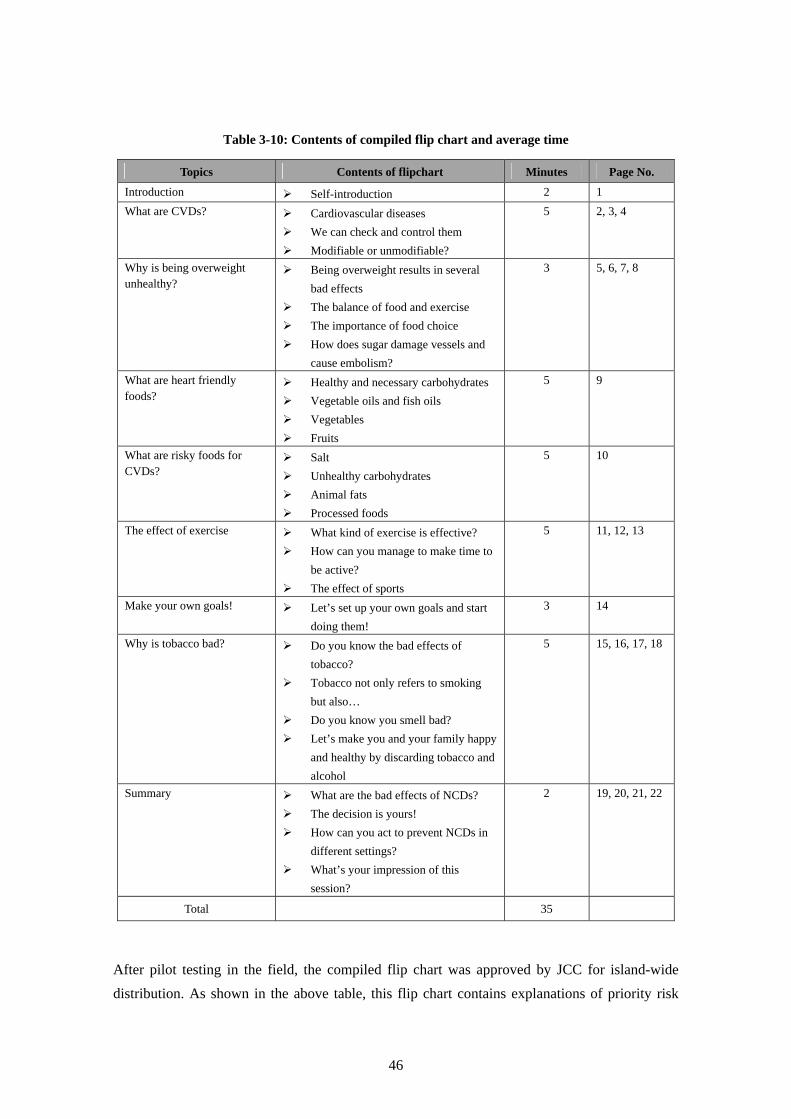
46
Table 3-10: Contents of compiled flip chart and average time
Topics Contents of flipchart Minutes Page No.
Introduction Self-introduction 2 1
What are CVDs?
Cardiovascular diseases
We can check and control them
Modifiable or unmodifiable?
5 2, 3, 4
Why is being overweight unhealthy?
Being overweight results in several
bad effects
The balance of food and exercise
The importance of food choice
How does sugar damage vessels and
cause embolism?
3 5, 6, 7, 8
What are heart friendly foods?
Healthy and necessary carbohydrates
Vegetable oils and fish oils
Vegetables
Fruits
5 9
What are risky foods for CVDs?
Salt
Unhealthy carbohydrates
Animal fats
Processed foods
5 10
The effect of exercise
What kind of exercise is effective?
How can you manage to make time to
be active?
The effect of sports
5 11, 12, 13
Make your own goals!
Let’s set up your own goals and start
doing them!
3 14
Why is tobacco bad?
Do you know the bad effects of
tobacco?
Tobacco not only refers to smoking
but also…
Do you know you smell bad?
Let’s make you and your family happy
and healthy by discarding tobacco and
alcohol
5 15, 16, 17, 18
Summary
What are the bad effects of NCDs?
The decision is yours!
How can you act to prevent NCDs in
different settings?
What’s your impression of this
session?
2 19, 20, 21, 22
Total 35
After pilot testing in the field, the compiled flip chart was approved by JCC for island-wide
distribution. As shown in the above table, this flip chart contains explanations of priority risk

47
factors for CVDs as well as ways to prevent them. It is designed to be used with interactive
dialogue or discussion in order to make participants recognise their own problems.
(2) Flip chart guidebook
As described above, the first draft of the flip chart had nearly 100 pages. Additionally, it had
facilitator’s pages on the back that instructed users on how the front page should be explained to
the audience. These instructions were developed during the 1st and 2nd years with consecutive
consultations among many experts, however in the process of finalisation, the text on the back
of the pages was removed to avoid the problem of health guidance conductors reading the text
and not communicating with the audience.
Instead, these texts were compiled into the flip chart guidebook, with pages that show both front
and back side of chart on one page. The purposes of this guidebook are 1) to review and
self-study how to conduct the general health guidance with the flip chart, 2) to deepen the
understanding of CVD prevention and health guidance and 3) to be applied to the follow-up
health guidance.
(3) Other tools
As shown in Annex 6, NPP developed aiding materials and tools for BMI measurement, healthy
diet and physical exercise with contributions from local and international experts. In addition,
tools for primary care facilities and public health settings were developed in collaboration with
the Director, Policy Analysis and Development, MoH.
3.4.4 Training module and mechanisms
The Health Education Bureau (HEB) has taken the initiative in implementing the training
programme for health guidance. They provided two training of trainers (TOTs) sessions for
health guidance during the 2nd year to train relevant health professionals in pilot areas in
conducting general health guidance activities. The first training focused on providing general
NCD knowledge and skills for using the flip chart, and the other was designed to strengthen the
communication skills of those health guidance providers. Both of these were intensive trainings
taking 2 to 3 days. In order to evaluate the initial training and to identify the contents of further
training needs, HEB conducted a skill assessment one year after the TOTs. Based on its results
and with consultation with respective MO/NCDs, the assessment team identified several topics
to be reinforced.
Consultant physicians in the pilot areas conducted specialised trainings related to NCDs, a
physiotherapist provided training on physical exercise, the Nutrition Division of the Ministry
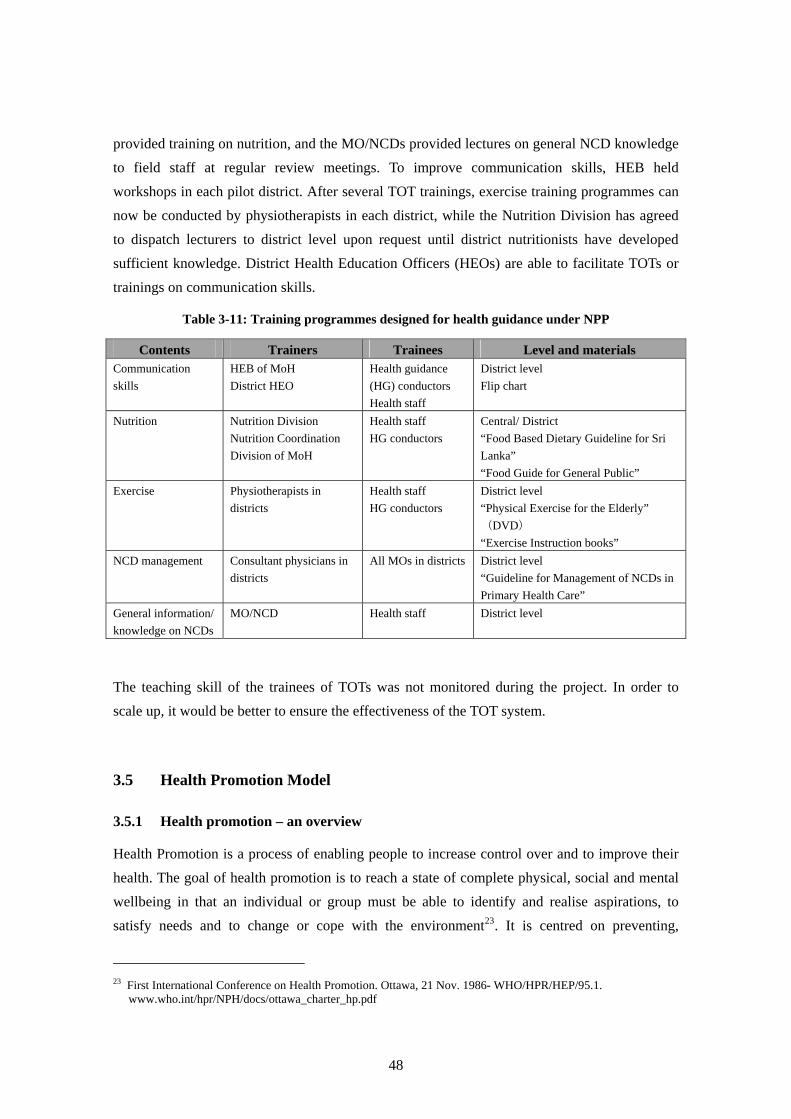
48
provided training on nutrition, and the MO/NCDs provided lectures on general NCD knowledge
to field staff at regular review meetings. To improve communication skills, HEB held
workshops in each pilot district. After several TOT trainings, exercise training programmes can
now be conducted by physiotherapists in each district, while the Nutrition Division has agreed
to dispatch lecturers to district level upon request until district nutritionists have developed
sufficient knowledge. District Health Education Officers (HEOs) are able to facilitate TOTs or
trainings on communication skills.
Table 3-11: Training programmes designed for health guidance under NPP
Contents Trainers Trainees Level and materials Communication
skills
HEB of MoH
District HEO
Health guidance
(HG) conductors
Health staff
District level
Flip chart
Nutrition Nutrition Division
Nutrition Coordination
Division of MoH
Health staff
HG conductors
Central/ District
“Food Based Dietary Guideline for Sri
Lanka”
“Food Guide for General Public”
Exercise Physiotherapists in
districts
Health staff
HG conductors
District level
“Physical Exercise for the Elderly”
(DVD)
“Exercise Instruction books”
NCD management Consultant physicians in
districts
All MOs in districts
District level
“Guideline for Management of NCDs in
Primary Health Care”
General information/
knowledge on NCDs
MO/NCD Health staff
District level
The teaching skill of the trainees of TOTs was not monitored during the project. In order to
scale up, it would be better to ensure the effectiveness of the TOT system.
3.5 Health Promotion Model
3.5.1 Health promotion – an overview
Health Promotion is a process of enabling people to increase control over and to improve their
health. The goal of health promotion is to reach a state of complete physical, social and mental
wellbeing in that an individual or group must be able to identify and realise aspirations, to
satisfy needs and to change or cope with the environment23. It is centred on preventing,
23 First International Conference on Health Promotion. Ottawa, 21 Nov. 1986- WHO/HPR/HEP/95.1.
www.who.int/hpr/NPH/docs/ottawa_charter_hp.pdf
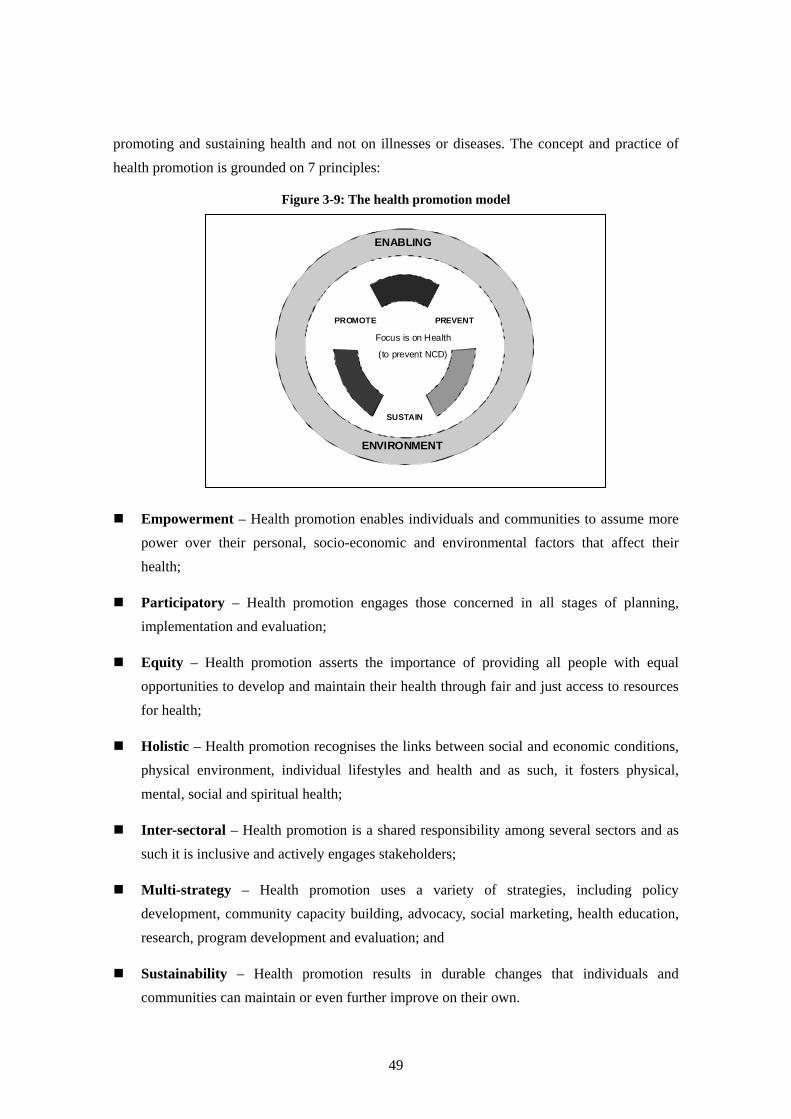
49
promoting and sustaining health and not on illnesses or diseases. The concept and practice of
health promotion is grounded on 7 principles:
Figure 3-9: The health promotion model
Empowerment – Health promotion enables individuals and communities to assume more
power over their personal, socio-economic and environmental factors that affect their
health;
Participatory – Health promotion engages those concerned in all stages of planning,
implementation and evaluation;
Equity – Health promotion asserts the importance of providing all people with equal
opportunities to develop and maintain their health through fair and just access to resources
for health;
Holistic – Health promotion recognises the links between social and economic conditions,
physical environment, individual lifestyles and health and as such, it fosters physical,
mental, social and spiritual health;
Inter-sectoral – Health promotion is a shared responsibility among several sectors and as
such it is inclusive and actively engages stakeholders;
Multi-strategy – Health promotion uses a variety of strategies, including policy
development, community capacity building, advocacy, social marketing, health education,
research, program development and evaluation; and
Sustainability – Health promotion results in durable changes that individuals and
communities can maintain or even further improve on their own.
PREVENT
SUSTAIN
PROMOTE
Focus is on Health
(to prevent NCD)
ENABLING
ENVIRONMENT
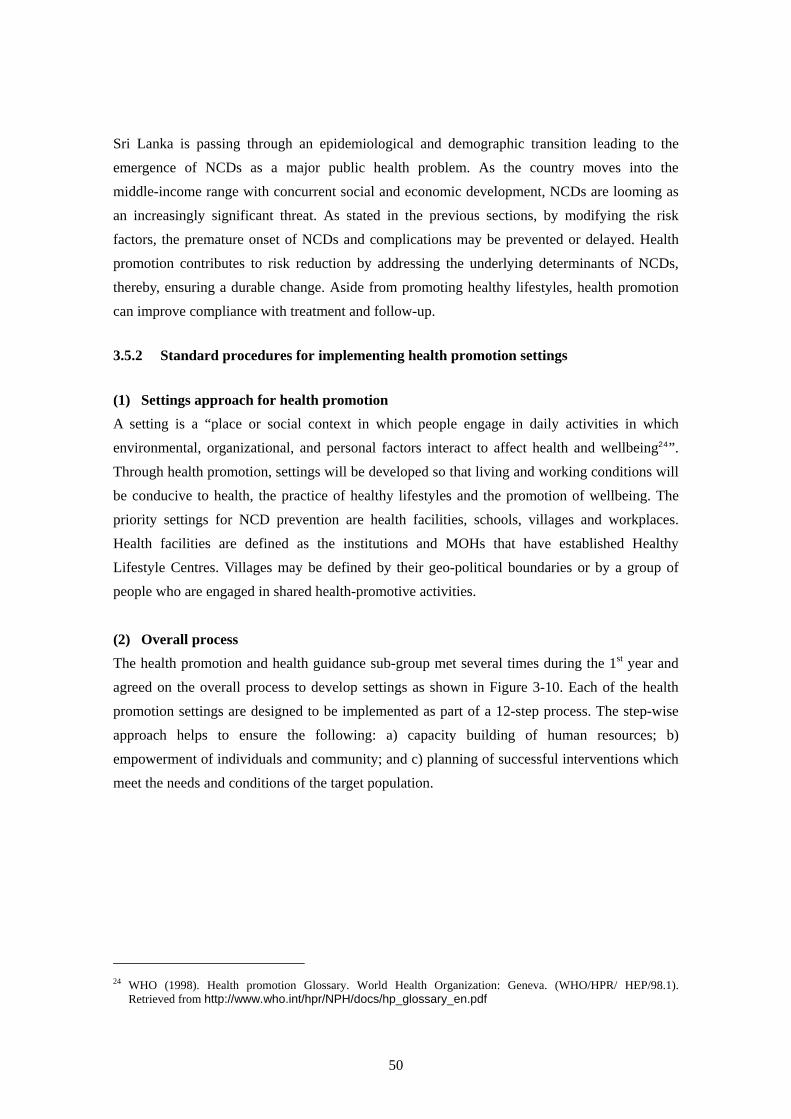
50
Sri Lanka is passing through an epidemiological and demographic transition leading to the
emergence of NCDs as a major public health problem. As the country moves into the
middle-income range with concurrent social and economic development, NCDs are looming as
an increasingly significant threat. As stated in the previous sections, by modifying the risk
factors, the premature onset of NCDs and complications may be prevented or delayed. Health
promotion contributes to risk reduction by addressing the underlying determinants of NCDs,
thereby, ensuring a durable change. Aside from promoting healthy lifestyles, health promotion
can improve compliance with treatment and follow-up.
3.5.2 Standard procedures for implementing health promotion settings
(1) Settings approach for health promotion
A setting is a “place or social context in which people engage in daily activities in which
environmental, organizational, and personal factors interact to affect health and wellbeing24”.
Through health promotion, settings will be developed so that living and working conditions will
be conducive to health, the practice of healthy lifestyles and the promotion of wellbeing. The
priority settings for NCD prevention are health facilities, schools, villages and workplaces.
Health facilities are defined as the institutions and MOHs that have established Healthy
Lifestyle Centres. Villages may be defined by their geo-political boundaries or by a group of
people who are engaged in shared health-promotive activities.
(2) Overall process
The health promotion and health guidance sub-group met several times during the 1st year and
agreed on the overall process to develop settings as shown in Figure 3-10. Each of the health
promotion settings are designed to be implemented as part of a 12-step process. The step-wise
approach helps to ensure the following: a) capacity building of human resources; b)
empowerment of individuals and community; and c) planning of successful interventions which
meet the needs and conditions of the target population.
24 WHO (1998). Health promotion Glossary. World Health Organization: Geneva. (WHO/HPR/ HEP/98.1).
Retrieved from http://www.who.int/hpr/NPH/docs/hp_glossary_en.pdf

51
Figure 3-10: Health promotion process - 12 steps
Central/
Provincial
Develop guidelines and advocate authorities
Human resources and policy development
District STEP 1 Inception Meeting
STEP 2 TOT for Resource Group
STEP 3 Advocacy for stakeholders & leaders
Setting
STEP 4 Training for grass-roots health workers
STEP 5 Setting formation and leaders/community
orientation
STEP 6 Training HP workers
STEP 7 Situation assessment
STEP 8 Issues/priority/target setting
STEP 9 Develop and disseminate plans
STEP 10 Implementation of activities
STEP 11 Monitoring and evaluation
SETP 12 Review and adjust
The 12 steps procedure and its intended outputs are as follows:
Step 1 – Inception meeting: At the beginning of the process, organise an inception meeting to
explain the purpose and concept of health promotion, introduce the roles/responsibilities of
management structures for health promotion at district level, select members of the management
structure at district level and decide on participants for the training of trainers (TOT).
Step 2 - TOT for Resource Group: The TOT aims to develop human resources in the district
with sufficient knowledge/skills for health promotion such as self-improvement, advocacy,
resource mobilization, program management, marketing and evidence-based information. The
resource group is expected to implement health promotion interventions and train others in
health promotion approaches in preventing NCDs in their respective districts. As other outputs
of the TOT, priority issues of health promotion will be discussed, district plans will be
developed and behavioural indicators will be agreed upon which are locally relevant, specific
and measurable.
Step 3 - Advocacy for stakeholders & leaders: Because a supportive social environment is an
essential part of health promotion, advocacy for the involvement of district level stakeholders
needs to be undertaken through workshops or meetings. Also, indicators and guidelines should
be agreed on.
SEE
PLAN
DO
SEE
52
Step 4 - Training for grass-roots health workers: In stages, basic knowledge of health
promotion will be provided to the grass-roots health workers.
Step 5 - Setting formation and leaders/community orientation: Identify appropriate settings
and a leader for each setting. Then, advocate for health promotion to the settings’ leaders and
members.
Step 6 - Training for setting HP workers: Identify setting-level health promotion workers who
will be trained by the resource group on basic knowledge of health promotion.
Step 7 - Situation assessment (community diagnosis): In order to plan effective interventions,
the needs, resources and constraints of the target population must be understood. At each setting,
local norms and positive/negative behaviours (lifestyles) will be assessed while the underlying
determinants of negative behaviours are understood. Also, local stakeholders will be analysed.
The target population may need to be segmented by age, occupation, sex and socio-economic
conditions.
Step 8 - Issues/priority/target setting: Based on results of the assessment, important health
promotion issues and key messages will be identified while behavioural indicators and targets to
be achieved will be reviewed and refined. The generic key messages are attached as Annex 5.
Step 9 - Develop and disseminate plans: An implementation plan will be developed to achieve
the target based on the situation assessment. Once the plan is developed, the members of the
settings will be oriented and mobilised. If necessary, networks will be developed with new
partners.
Step 10 - Implementation of activities: The planned activities will be implemented with the
participation of the setting members and key messages will be marketed.
Step 11 - Monitoring and evaluation: Regular monitoring and review will be conducted. Aside
from the outcome indicators, the process should be assessed and evidence-based information
generated. Results of evaluations should be shared with stakeholders and reflected in the
subsequent plans. Responsibilities will be delegated to setting members when evaluating.
Step 12 – Review and adjust: After a review of the monitoring/evaluation results, the plan and
steps will be adjusted accordingly. Emphasis should be put on empowering setting members to
pay attention to any other emerging or re-emerging health problems.
3.5.3 Implementing health promotion activities
The implementation structure shown in Figure 3-11 may be established at the district level.

53
Figure 3-11: Coordination and management structures
Several basic principles were considered in designing the structures. 1) the management
structure should include non-heath sectors because the health promotion process involves
coordinated actions with non-health sectors such as the education and business sectors; 2) in
order to increase potential for sustainability, the resource group at the district level will be
expected to provide training and instructions for the implementation of health promotion under
the supervision of the steering committee; 3) each setting will decide a setting leader and assign
setting-level health promotion workers who will be supervised by the resource group.
Focal points for health promotion related to NCDs should be designated as:
RDHS office – Medical Officer Non-Communicable Diseases;
MOH office – Medical Officer of Health;
Divisional health care institutions – the head of institution; and
Higher level hospitals (BH) – Medical Officer Public Health or health education nurses
3.5.4 Training of trainers (TOT)
From the end of the 1st year to the 2nd year, NPP implemented a TOT with the technical
assistance from the Foundation for Health Promotion. Between March and October 2009, two
six-session TOT trainings were conducted in Kurunegala and Polonnaruwa districts, with 19 and
21 persons receiving the training in each district, respectively. The purpose of the trainings was
to provide knowledge and skills to the resource groups for implementing health promotion
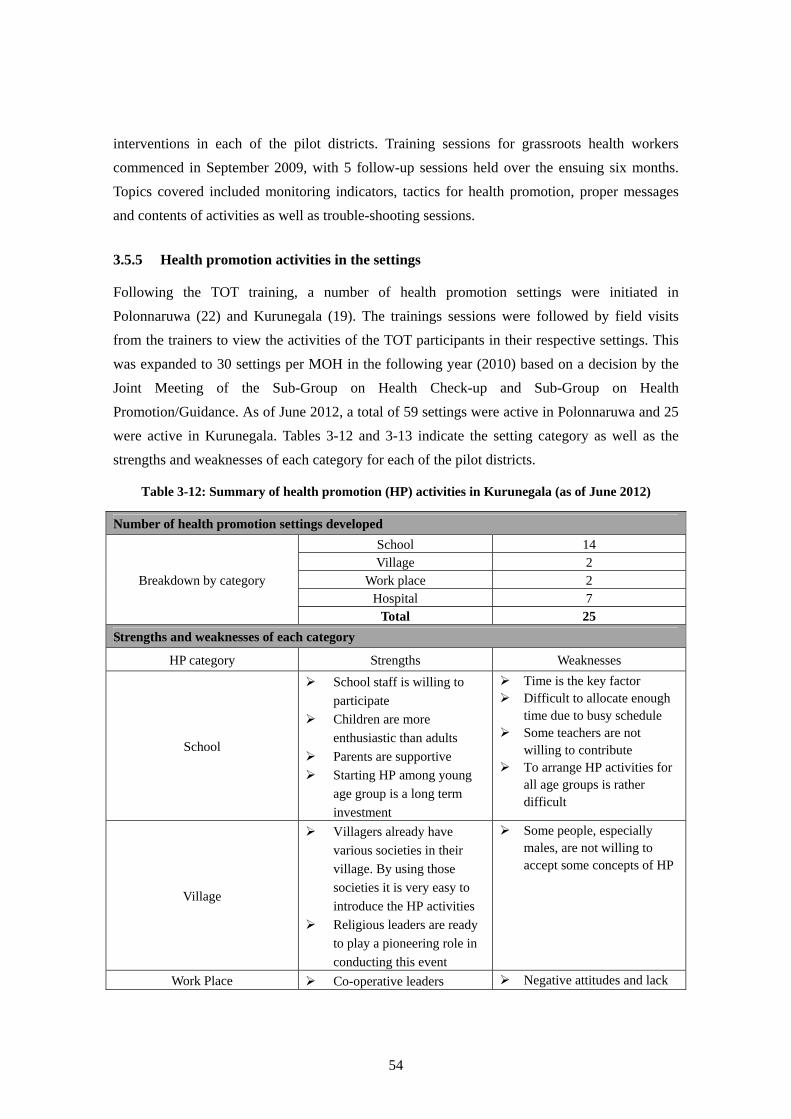
54
interventions in each of the pilot districts. Training sessions for grassroots health workers
commenced in September 2009, with 5 follow-up sessions held over the ensuing six months.
Topics covered included monitoring indicators, tactics for health promotion, proper messages
and contents of activities as well as trouble-shooting sessions.
3.5.5 Health promotion activities in the settings
Following the TOT training, a number of health promotion settings were initiated in
Polonnaruwa (22) and Kurunegala (19). The trainings sessions were followed by field visits
from the trainers to view the activities of the TOT participants in their respective settings. This
was expanded to 30 settings per MOH in the following year (2010) based on a decision by the
Joint Meeting of the Sub-Group on Health Check-up and Sub-Group on Health
Promotion/Guidance. As of June 2012, a total of 59 settings were active in Polonnaruwa and 25
were active in Kurunegala. Tables 3-12 and 3-13 indicate the setting category as well as the
strengths and weaknesses of each category for each of the pilot districts.
Table 3-12: Summary of health promotion (HP) activities in Kurunegala (as of June 2012)
Number of health promotion settings developed
Breakdown by category
School 14 Village 2
Work place 2 Hospital 7
Total 25
Strengths and weaknesses of each category
HP category Strengths Weaknesses
School
School staff is willing to
participate
Children are more
enthusiastic than adults
Parents are supportive
Starting HP among young
age group is a long term
investment
Time is the key factor Difficult to allocate enough
time due to busy schedule Some teachers are not
willing to contribute To arrange HP activities for
all age groups is rather difficult
Village
Villagers already have
various societies in their
village. By using those
societies it is very easy to
introduce the HP activities
Religious leaders are ready
to play a pioneering role in
conducting this event
Some people, especially males, are not willing to accept some concepts of HP
Work Place Co-operative leaders Negative attitudes and lack
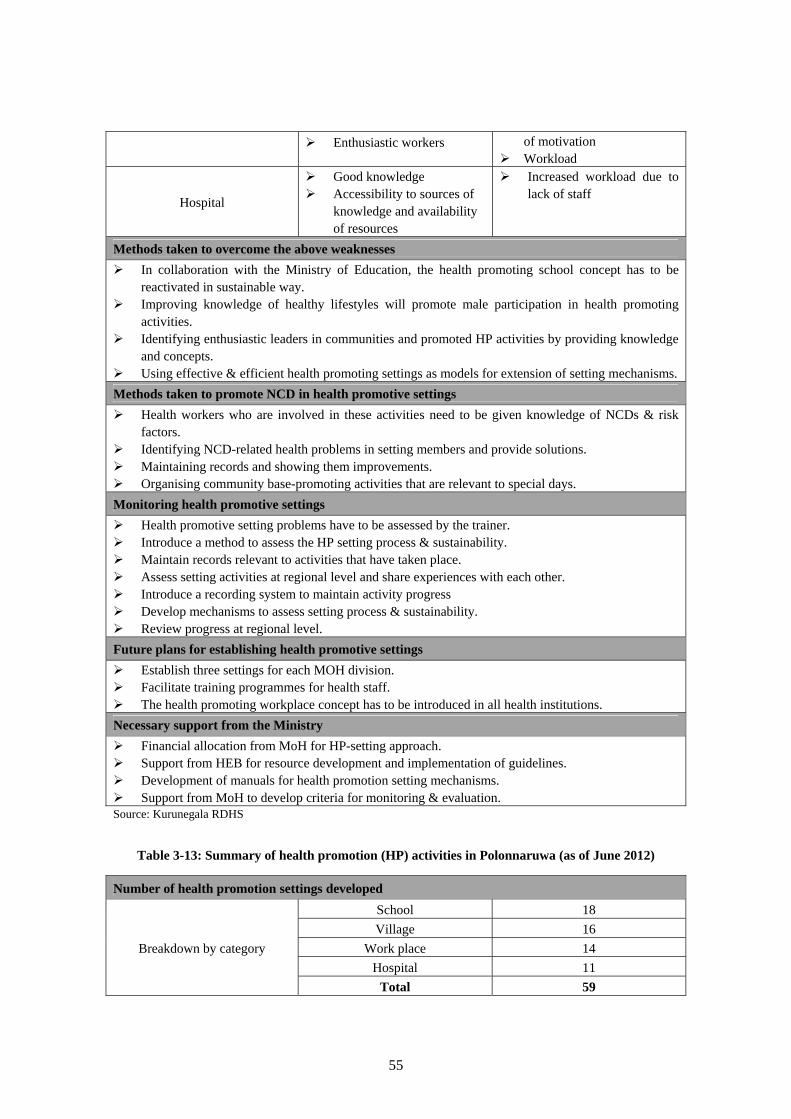
55
Enthusiastic workers of motivation Workload
Hospital
Good knowledge Accessibility to sources of
knowledge and availability of resources
Increased workload due to lack of staff
Methods taken to overcome the above weaknesses
In collaboration with the Ministry of Education, the health promoting school concept has to be reactivated in sustainable way.
Improving knowledge of healthy lifestyles will promote male participation in health promoting activities.
Identifying enthusiastic leaders in communities and promoted HP activities by providing knowledge and concepts.
Using effective & efficient health promoting settings as models for extension of setting mechanisms.
Methods taken to promote NCD in health promotive settings
Health workers who are involved in these activities need to be given knowledge of NCDs & risk factors.
Identifying NCD-related health problems in setting members and provide solutions. Maintaining records and showing them improvements. Organising community base-promoting activities that are relevant to special days.
Monitoring health promotive settings
Health promotive setting problems have to be assessed by the trainer. Introduce a method to assess the HP setting process & sustainability. Maintain records relevant to activities that have taken place. Assess setting activities at regional level and share experiences with each other. Introduce a recording system to maintain activity progress Develop mechanisms to assess setting process & sustainability. Review progress at regional level.
Future plans for establishing health promotive settings
Establish three settings for each MOH division. Facilitate training programmes for health staff. The health promoting workplace concept has to be introduced in all health institutions.
Necessary support from the Ministry
Financial allocation from MoH for HP-setting approach. Support from HEB for resource development and implementation of guidelines. Development of manuals for health promotion setting mechanisms. Support from MoH to develop criteria for monitoring & evaluation. Source: Kurunegala RDHS
Table 3-13: Summary of health promotion (HP) activities in Polonnaruwa (as of June 2012)
Number of health promotion settings developed
Breakdown by category
School 18
Village 16
Work place 14
Hospital 11
Total 59

56
Strengths and weaknesses of each category
HP category Strengths Weaknesses
School
Principals and teachers were
willing to promote activities
Children were more
enthusiastic to take part
compared with adults
Difficulties faced in time
allocation
Village
The already existing
community gatherings are
the grounds for HP settings
Negative attitudes,
especially regarding
females doing exercises
Workload at the times of
harvesting
Work Place
Co-operative leaders
Enthusiastic workers
Negative attitudes and lack
of motivation
Workload
Hospital
Good knowledge
Ability to access sources of
knowledge and availability
of resources
Increased workload due to
lack of staff
Methods taken to overcome the above weaknesses
In schools, after discussing with the principals, let them allocate the time and decide on the
frequency.
In villages and workplaces, help to overcome negative attitudes and social norms by giving
continuous health education through field workers. Give them the opportunity to take part in health
promotion activities in order to obtain knowledge and skills. Volunteers helped in many activities to
overcome these problems.
Methods taken to promote NCD prevention in health promotive settings
Giving the community skills and knowledge through health care workers and volunteers.
Introducing self-monitoring methods.
Encouraging HP settings by organizing small competitive activities.
Advising organisation of gatherings of members of HP settings to have their own discussions
regarding how to sustain the setting and activities.
Arranging meetings on a regional basis to discuss different HP settings in which one or two
members from each HP setting can participate.
Monitoring health promotive settings
In meetings, let each setting member present their HP activities, problems they faced and the
strategies they think of. Then help them to discuss and choose the best solution.
Provide opportunities to local setting members to learn how to maintain personal records as well as
group data and go through them in meetings.
Future plans for establishing health promotive settings
Continuously conduct programmes targeting health care workers and volunteers to ensure the
knowledge and skills are maintained with regard to health promotion.
Expand health promotion settings to more places with the help of MOH and staff.
Ensure that each setting has sufficient resources to conduct their programmes.
Start HP settings in each institution, gathering the staff and assisting them through HLC staff.
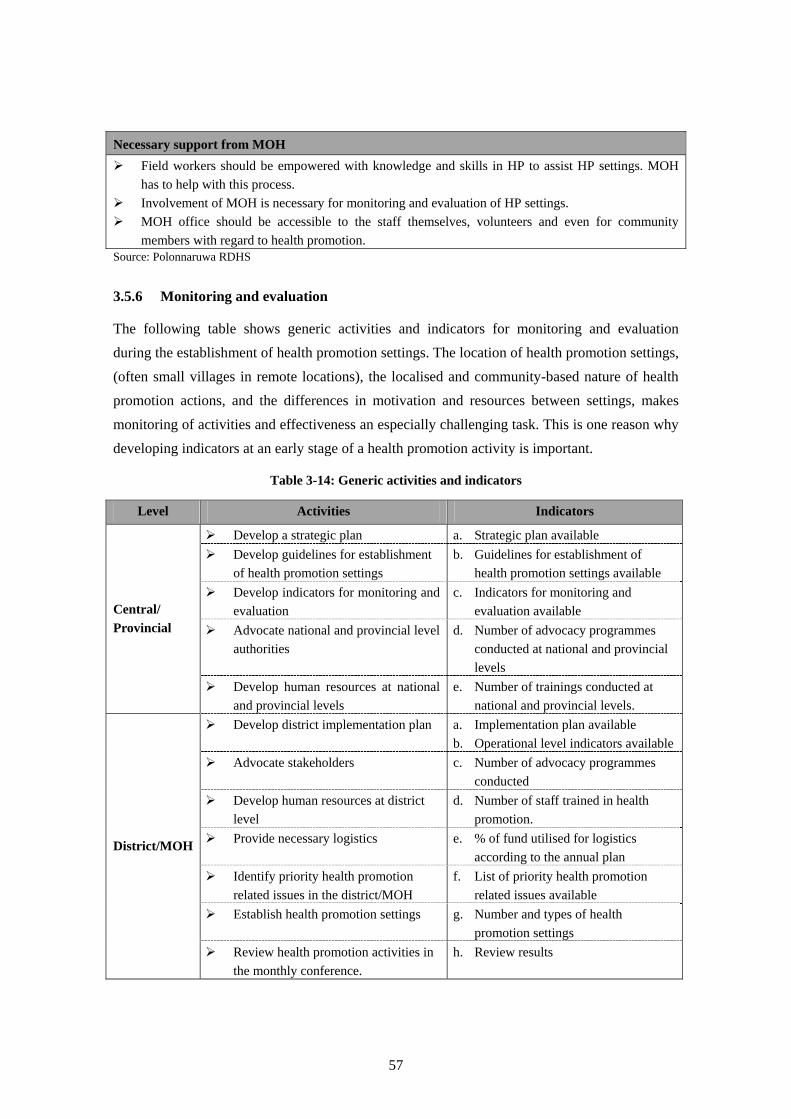
57
Necessary support from MOH
Field workers should be empowered with knowledge and skills in HP to assist HP settings. MOH
has to help with this process.
Involvement of MOH is necessary for monitoring and evaluation of HP settings.
MOH office should be accessible to the staff themselves, volunteers and even for community
members with regard to health promotion. Source: Polonnaruwa RDHS
3.5.6 Monitoring and evaluation
The following table shows generic activities and indicators for monitoring and evaluation
during the establishment of health promotion settings. The location of health promotion settings,
(often small villages in remote locations), the localised and community-based nature of health
promotion actions, and the differences in motivation and resources between settings, makes
monitoring of activities and effectiveness an especially challenging task. This is one reason why
developing indicators at an early stage of a health promotion activity is important.
Table 3-14: Generic activities and indicators
Level Activities Indicators
Central/
Provincial
Develop a strategic plan a. Strategic plan available
Develop guidelines for establishment
of health promotion settings
b. Guidelines for establishment of
health promotion settings available
Develop indicators for monitoring and
evaluation
c. Indicators for monitoring and
evaluation available
Advocate national and provincial level
authorities
d. Number of advocacy programmes
conducted at national and provincial
levels
Develop human resources at national
and provincial levels
e. Number of trainings conducted at
national and provincial levels.
District/MOH
Develop district implementation plan a. Implementation plan available
b. Operational level indicators available
Advocate stakeholders c. Number of advocacy programmes
conducted
Develop human resources at district
level
d. Number of staff trained in health
promotion.
Provide necessary logistics e. % of fund utilised for logistics
according to the annual plan
Identify priority health promotion
related issues in the district/MOH
f. List of priority health promotion
related issues available
Establish health promotion settings g. Number and types of health
promotion settings
Review health promotion activities in
the monthly conference.
h. Review results
58
From September to November 2010, NPP conducted a monitoring survey among the health
promotion settings in order to identify their activities. Among the findings of the survey were:
i) From March 2009 to November 2010 (18 months), more than thirty (30) settings were approached by volunteer health promoters and started activities related to NCD prevention;
ii) On September 2010, twenty-four (24) settings continued their activities related to NCD prevention;
iii) Number of participants in all the settings were five-hundred and seventy-four (574) people, among which were in 224 in Kurunegala and 346 in Polonnaruwa;
iv) Average number of members per one setting was eighteen (18);
v) Setting members generally meet once per month for activities;
vi) Most popular activity types are, in order of frequency, 1) gardening for cultivating vegetables and fruits, 2) guidance for healthy life styles, 3) doing exercises together such as brisk walking, and, 4) measuring BMI;
vii) Under 39 year-olds as well as those in their forties comprise one third of total participants, while those in their fifties comprise 10~15%;
viii) Proportion of male participants is slightly higher in Kurunegala than in Polonnaruwa.
This survey also revealed the following challenges felt by trained health promoters:
i) Difficulty in allotting time to visit settings within routine work schedule.
ii) Coordination with competing entities to organise activities related to NCD prevention, e.g. Department of Ayurveda.
iii) Difficulty in raising awareness about and giving explanations of NCD prevention to people.
iv) Difficulty in involving male participants, and involving the broader community.
v) Lack of adequate spaces for physical exercises.
vi) Lack of measuring equipment for weight and height (BMI).
These challenges were also reiterated at the occasion of refresher training offered by NPP in
December 2010. As a response, NPP started working on a resource book for setting facilitators
in collaboration with the Health Education Bureau and the Foundation for Health Promotion.
The results from the monitoring survey provided a basis for the development of additional
training materials (see next section).
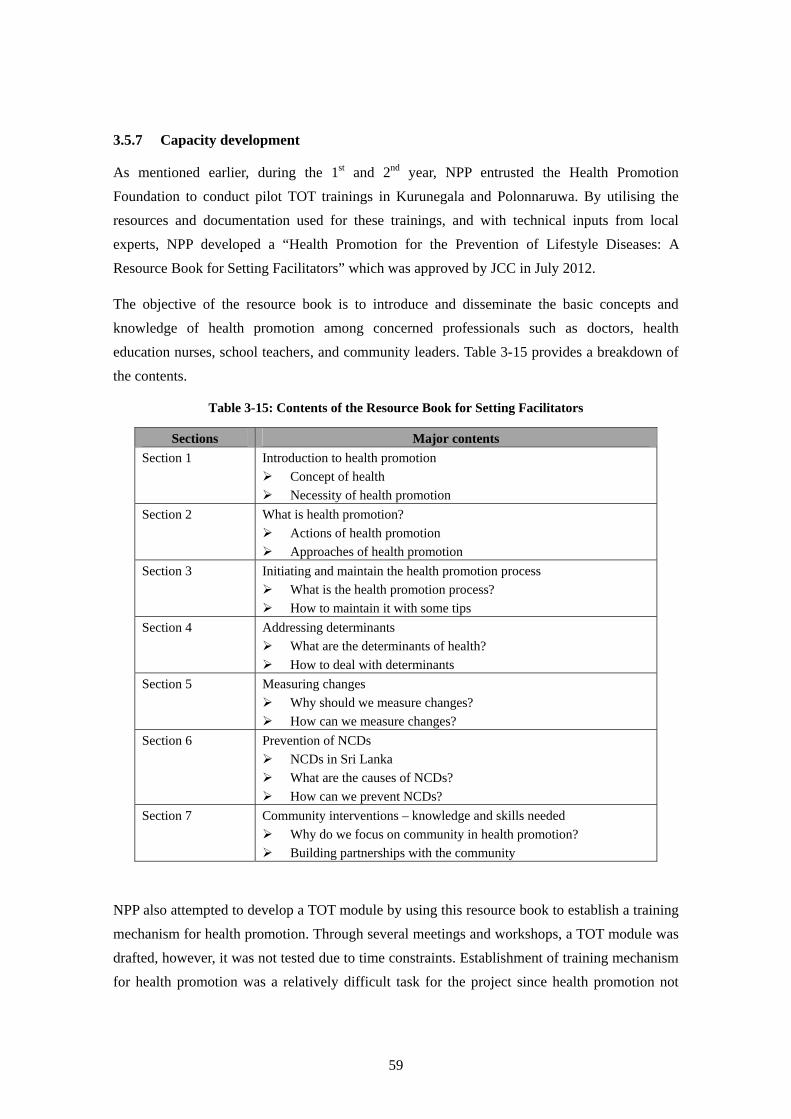
59
3.5.7 Capacity development
As mentioned earlier, during the 1st and 2nd year, NPP entrusted the Health Promotion
Foundation to conduct pilot TOT trainings in Kurunegala and Polonnaruwa. By utilising the
resources and documentation used for these trainings, and with technical inputs from local
experts, NPP developed a “Health Promotion for the Prevention of Lifestyle Diseases: A
Resource Book for Setting Facilitators” which was approved by JCC in July 2012.
The objective of the resource book is to introduce and disseminate the basic concepts and
knowledge of health promotion among concerned professionals such as doctors, health
education nurses, school teachers, and community leaders. Table 3-15 provides a breakdown of
the contents.
Table 3-15: Contents of the Resource Book for Setting Facilitators
Sections Major contents
Section 1 Introduction to health promotion
Concept of health
Necessity of health promotion
Section 2 What is health promotion?
Actions of health promotion
Approaches of health promotion
Section 3 Initiating and maintain the health promotion process
What is the health promotion process?
How to maintain it with some tips
Section 4 Addressing determinants
What are the determinants of health?
How to deal with determinants
Section 5 Measuring changes
Why should we measure changes?
How can we measure changes?
Section 6 Prevention of NCDs
NCDs in Sri Lanka
What are the causes of NCDs?
How can we prevent NCDs?
Section 7 Community interventions – knowledge and skills needed
Why do we focus on community in health promotion?
Building partnerships with the community
NPP also attempted to develop a TOT module by using this resource book to establish a training
mechanism for health promotion. Through several meetings and workshops, a TOT module was
drafted, however, it was not tested due to time constraints. Establishment of training mechanism
for health promotion was a relatively difficult task for the project since health promotion not

60
only covers NCD prevention but also all aspects of health. The development of health
promotion settings is not prescriptive in that community action emanates from a holistic
participant-centred assessment of the situation as well as a better understanding of the
underlying determinants of health and NCD risk factors through critical analysis. Nevertheless,
many stakeholders in the Ministry have recognised the need for resources for health promotion
training under the NCD policy.
3.6 IEC and the Social Marketing Model
The fourth model for NCD prevention is to disseminate information on the importance of NCD
prevention and invite people to HLCs. During the project, NPP produced the following
materials to strengthen advocacy for NCD prevention: billboards and posters were prepared
with cooperation from Mr. Sidath Wettimuny, a former cricket player. In addition, 25 digital BP
monitors were distributed in public places in Colombo, Kurunegala and Polonnaruwa for
awareness-raising.
Billboard in Colombo
Posters for Healthy Lifestyle Centre Digital BP monitor for public use
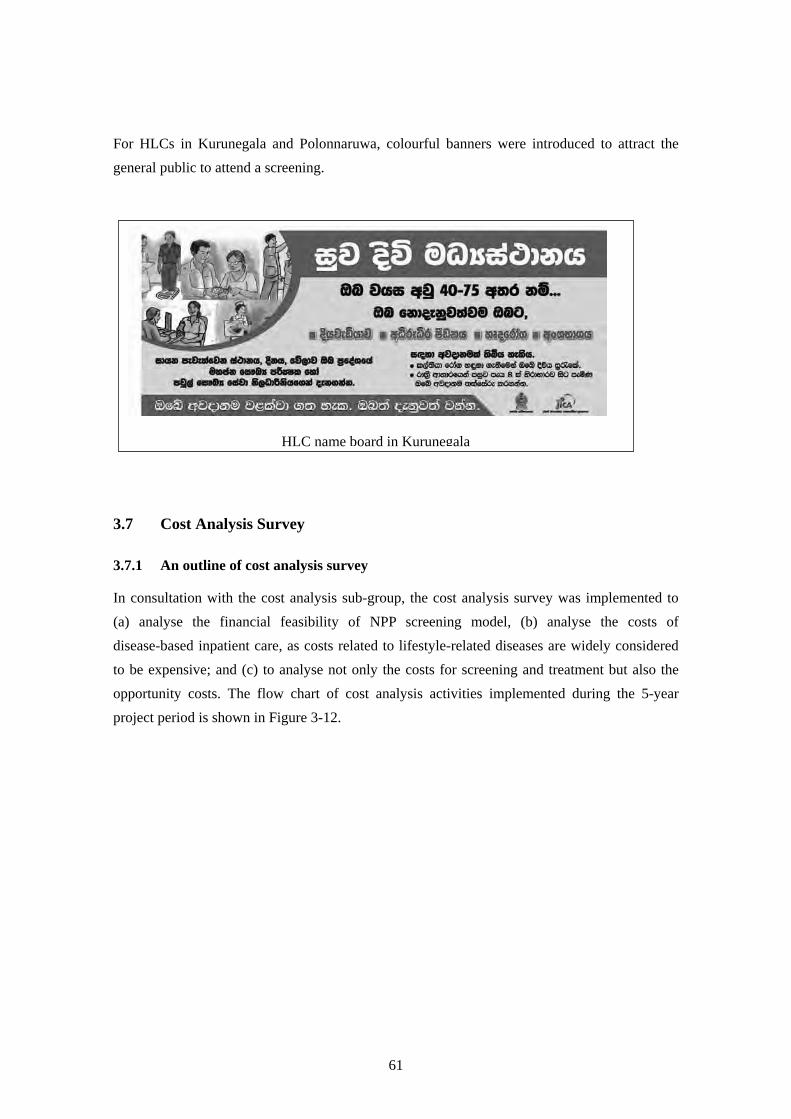
61
For HLCs in Kurunegala and Polonnaruwa, colourful banners were introduced to attract the
general public to attend a screening.
3.7 Cost Analysis Survey
3.7.1 An outline of cost analysis survey
In consultation with the cost analysis sub-group, the cost analysis survey was implemented to
(a) analyse the financial feasibility of NPP screening model, (b) analyse the costs of
disease-based inpatient care, as costs related to lifestyle-related diseases are widely considered
to be expensive; and (c) to analyse not only the costs for screening and treatment but also the
opportunity costs. The flow chart of cost analysis activities implemented during the 5-year
project period is shown in Figure 3-12.
HLC name board in Kurunegala

62
Figure 3-12: Cost analysis study flow chart
1
st year 2
nd year 3
rd year 4
th year 5
th year
An information collection system and a survey implementation system related to a cost analysis survey are developed.
The appropriateness and feasibility of the intervention strategy is analyzed from the aspect of cost. Inpatient care costs are analyzed, as costs related to NCDs are considered expensive. The analysis includes losses in household income (loss of work opportunities), as well as costs necessary for health checkups and treatment.
Cost for NCD measures
Cost of illness
Output 2 : Intervention guidelines and manuals are formulated based on available evidence and related literatures.
Cost analysis/health finance seminar
Cost analysis/health finance seminar
Preliminary calculation of the cost
of nation-wide expansion and human
resources
This enables the acquisition of cost information, one of the important elements for considering NCD preventive measures. The Ministry of Health needs to use this data in a practical way rather than an academic way.
Data collection
Data analysis
The cost analysis can be generally divided into 2 categories: costs required for the actual
interventions (i.e. introducing screening and health guidance activities for preventing NCDs)
and the costs of illness.
The survey on the intervention cost was carried out separately in Kurunegala District and
Polonnaruwa District, as they have introduced different screening models. The intervention cost
was divided into 2 groups: direct costs, such as those for personnel, supplies and equipment
required for actual implementation, and indirect costs, such as those for the training of human
resources and for the establishment of the screening and health guidance programme.
The costs of illness were also divided into direct costs (hospitalization, nursing personnel,
medical personnel, treatment, tests and drugs) and indirect costs (cost of traveling to the hospital,
medication, meals, and loss of income).
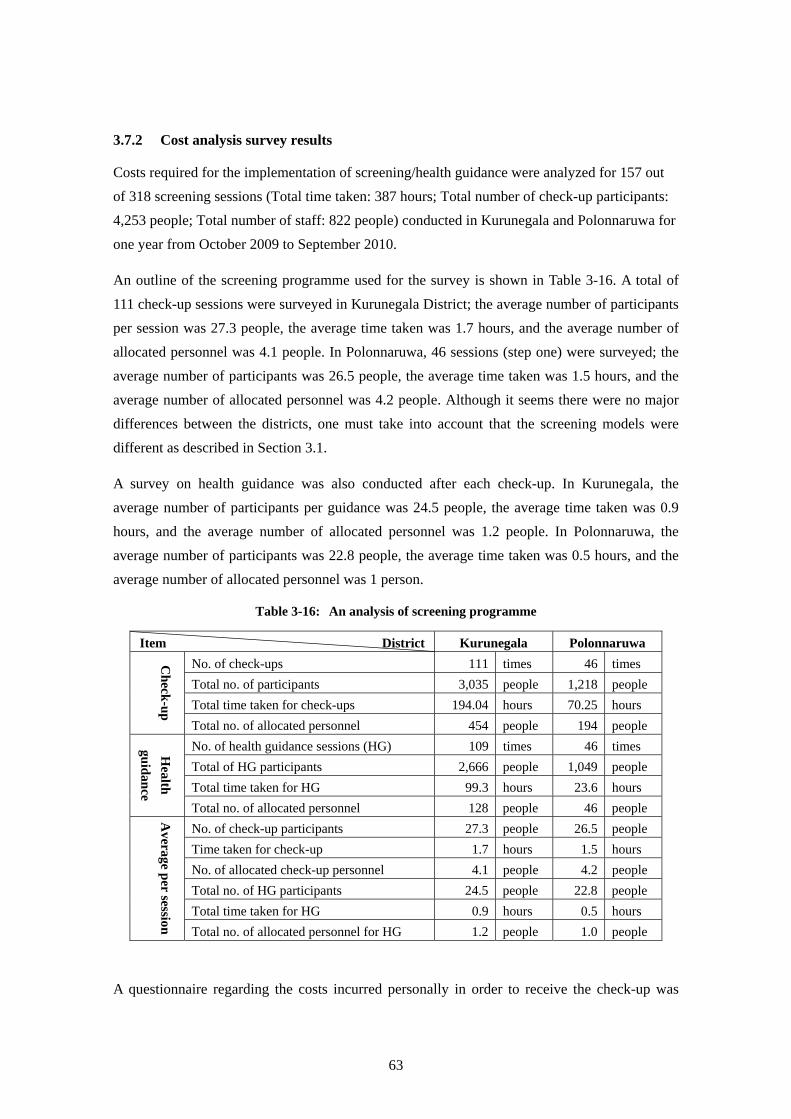
63
3.7.2 Cost analysis survey results
Costs required for the implementation of screening/health guidance were analyzed for 157 out
of 318 screening sessions (Total time taken: 387 hours; Total number of check-up participants:
4,253 people; Total number of staff: 822 people) conducted in Kurunegala and Polonnaruwa for
one year from October 2009 to September 2010.
An outline of the screening programme used for the survey is shown in Table 3-16. A total of
111 check-up sessions were surveyed in Kurunegala District; the average number of participants
per session was 27.3 people, the average time taken was 1.7 hours, and the average number of
allocated personnel was 4.1 people. In Polonnaruwa, 46 sessions (step one) were surveyed; the
average number of participants was 26.5 people, the average time taken was 1.5 hours, and the
average number of allocated personnel was 4.2 people. Although it seems there were no major
differences between the districts, one must take into account that the screening models were
different as described in Section 3.1.
A survey on health guidance was also conducted after each check-up. In Kurunegala, the
average number of participants per guidance was 24.5 people, the average time taken was 0.9
hours, and the average number of allocated personnel was 1.2 people. In Polonnaruwa, the
average number of participants was 22.8 people, the average time taken was 0.5 hours, and the
average number of allocated personnel was 1 person.
Table 3-16: An analysis of screening programme
Item District Kurunegala Polonnaruwa C
heck
-up
No. of check-ups 111 times 46 times
Total no. of participants 3,035 people 1,218 people
Total time taken for check-ups 194.04 hours 70.25 hours
Total no. of allocated personnel 454 people 194 people
Health
guidan
ce
No. of health guidance sessions (HG) 109 times 46 times
Total of HG participants 2,666 people 1,049 people
Total time taken for HG 99.3 hours 23.6 hours
Total no. of allocated personnel 128 people 46 people
Average p
er session
No. of check-up participants 27.3 people 26.5 people
Time taken for check-up 1.7 hours 1.5 hours
No. of allocated check-up personnel 4.1 people 4.2 people
Total no. of HG participants 24.5 people 22.8 people
Total time taken for HG 0.9 hours 0.5 hours
Total no. of allocated personnel for HG 1.2 people 1.0 people
A questionnaire regarding the costs incurred personally in order to receive the check-up was
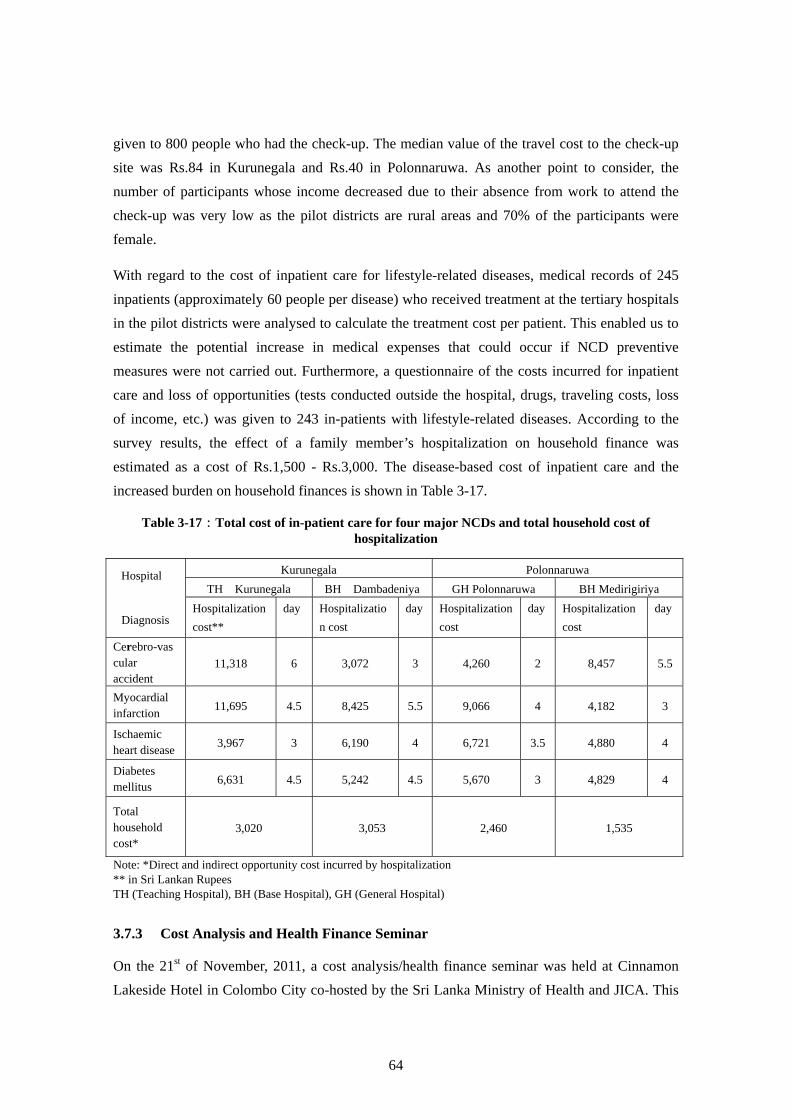
64
given to 800 people who had the check-up. The median value of the travel cost to the check-up
site was Rs.84 in Kurunegala and Rs.40 in Polonnaruwa. As another point to consider, the
number of participants whose income decreased due to their absence from work to attend the
check-up was very low as the pilot districts are rural areas and 70% of the participants were
female.
With regard to the cost of inpatient care for lifestyle-related diseases, medical records of 245
inpatients (approximately 60 people per disease) who received treatment at the tertiary hospitals
in the pilot districts were analysed to calculate the treatment cost per patient. This enabled us to
estimate the potential increase in medical expenses that could occur if NCD preventive
measures were not carried out. Furthermore, a questionnaire of the costs incurred for inpatient
care and loss of opportunities (tests conducted outside the hospital, drugs, traveling costs, loss
of income, etc.) was given to 243 in-patients with lifestyle-related diseases. According to the
survey results, the effect of a family member’s hospitalization on household finance was
estimated as a cost of Rs.1,500 - Rs.3,000. The disease-based cost of inpatient care and the
increased burden on household finances is shown in Table 3-17.
Table 3-17:Total cost of in-patient care for four major NCDs and total household cost of hospitalization
Kurunegala Polonnaruwa
TH Kurunegala BH Dambadeniya GH Polonnaruwa BH Medirigiriya
Hospitalization
cost**
day Hospitalizatio
n cost
day Hospitalization
cost
day Hospitalization
cost
day
Cerebro-vascular accident
11,318 6 3,072 3 4,260 2 8,457 5.5
Myocardial infarction
11,695 4.5 8,425 5.5 9,066 4 4,182 3
Ischaemic heart disease
3,967 3 6,190 4 6,721 3.5 4,880 4
Diabetes mellitus
6,631 4.5 5,242 4.5 5,670 3 4,829 4
Total household cost*
3,020 3,053 2,460 1,535
Note: *Direct and indirect opportunity cost incurred by hospitalization ** in Sri Lankan Rupees TH (Teaching Hospital), BH (Base Hospital), GH (General Hospital)
3.7.3 Cost Analysis and Health Finance Seminar
On the 21st of November, 2011, a cost analysis/health finance seminar was held at Cinnamon
Lakeside Hotel in Colombo City co-hosted by the Sri Lanka Ministry of Health and JICA. This
Hospital
Diagnosis
65
seminar, the second one of its kind since the commencement of the project, had two objectives:
1) to share the cost analysis survey result among a wide range of people concerned, and discuss
effective intervention methods for preventing non-communicable diseases; and 2) to examine
how to utilise the data obtained from the survey in regard to Sri Lanka’s national health
finances.
A discussion session was held after presentations, and the question of how to utilise these newly
shared survey results was raised with the participants. The following comments were obtained:
“It is the first time the results of such a survey were obtained in Sri Lanka”; “a follow-up survey
is also necessary after the check-ups”; “WHO has been experimenting with a PEN model, so
how about comparing 3 models?”; “We need to consider the fact that there are fewer male
participants more closely”; “The Ministry of Health has been investing in non-communicable
disease preventive measures with substantial budget. The obtained evidence will be very useful
for examining policies in the future”. After the seminar, a report was finalised and is included as
Annex 7.
66
CHAPTER 4 Expansion of NPP models with Healthy Lifestyle Centres
4.1 Introducing Healthy Lifestyle Centres
In Sri Lanka, new NCD cases are typically diagnosed at one of two locations: outpatient
short-term care within the outpatient department or in the hospital when they are admitted as an
inpatient. For newly diagnosed cases, no systematic procedures are in place in most institutions
to ensure that standard diagnostic and treatment procedures are followed, leaving diagnosis and
treatment dependent on the clinical awareness and training of physicians involved.
Under the NCD policy, implementing a cost-effective NCD screening program at community
level with special emphasis on cardiovascular diseases has been identified as one of the key
strategies for NCD management. The strategy proposed establishing a cost effective high risk
NCD screening programme linked with curative healthcare options and a health guidance
programme for lifestyle modifications for early detection and management of major chronic
NCDs, with a special focus on disadvantaged communities. The private health sector and
community-based organizations were encouraged to participate in NCD screening programmes
within a regulatory framework.
In September 2011, the Ministry of Health started the National NCD programme by introducing
Healthy Lifestyle Centres (HLCs) in selected primary health care institutions in all districts to
screen for the risk of non-communicable diseases and enhance subsequent management among
people aged 35 to 65 years. Guidelines for establishment of healthy lifestyle clinics, personal
health records and a management information system were formulated. This was carried out
with the consensus of relevant stakeholders involved in the NCD Control and the Prevention
Programme island-wide with the guidance of the Working Group of Non Communicable
Diseases in the Ministry of Health. The essential drug list for treatment of chronic NCDs, and a
management protocol prepared by the Policy Analysis Unit with the consultation of experts
were distributed to districts with the guidelines, personal health records and management
information system.
The HLCs are open to the public at least once a week and are intended for about 20 participants
per session. It is recommended to utilise available spaces within existing premises with the
following furniture and equipment (as shown in Table 4-1).

67
Table 4-1: Furniture and equipment for HLCs
Items Quantity
Tables 3
Chairs Not specified
TV/DVD Not specified
Display boards 2
Cupboard for health education materials Not specified
Weighing scale, height measuring instrument (stadiometer),
waist tape, mercury BP apparatus, stethoscope, glucometer,
BMI calculator, calculator and peak flow meter
Not specified
Invitation forms, registration forms, monthly summary,
personal health records, follow-up clinic guidelines, IEC
materials
Not specified
Note: equipment for checking total cholesterol if available.
4.2 Current Situation of HLCs
Although it is recommended to establish HLCs in all primary health care institutions to facilitate
access for people to benefit from the screening and health guidance services, the initial target
called for the establishment of at least one HLC in a MOH area.
By June 2012, a total number of 551 HLCs established across Sri Lanka as shown in Figure 4-1.
Figure 4-1: HLCs established by June 2012
4.3 Financial Planning for HLCs
In view of assisting MoH and PDHS to calculate the necessary budget for implementing HLCs,
NPP developed a financial simulation model by utilising the Kurunegala model.
68
4.3.1 Hypothesis for cost calculation
This simulation model requires planners to simply input the number of target population to be
screened for a specific time period. This model has been developed under the assumption that
existing facilities will be utilised effectively, and that equipment and human resources such as
doctors and nurses, as well as necessary devices and consumables as specified below, are
available.
1) Facilities and equipment: Based on the assumption that existing facilities and equipment
can be utilised for rooms, and furniture such as tables and chairs can be used for the
implementation of check-ups, and no further costs occur.
2) Check-up equipment: Weighing scales (batteries for a scale must be replaced after 2,000
times of use), stadiometer, blood pressure apparatus (renewed after 10,000 check-ups), and
simple glucometer (renewed after 5,000 times of use).
3) Consumables: Strips, needles, disposable gloves (one pair of gloves is used per person and
the daily average of people receiving a check-up is 20), invitation letters, registration and
other formats.
4) Initial cost: Training costs for personnel engaged in HLCs (holding a 2-day course twice,
with approximately 50 participants in each course), IEC materials (guidelines, screening
manuals, flip chart, flip chart guidebook, BMI chart, HLC posters, CVD posters, DVDs,
health promotion resources, physical exercise instructions, etc.).
5) Personnel cost: The cost per person is calculated based on the hourly wages of health
personnel (job category-based monthly salaries, assuming that the working hours are 8
hours a day, 22 days per month), and the number of persons receiving a check-up.
4.3.2 Simulation model
Based on the above concept, a simulation model was developed to calculate total and annual
costs to cover the entire eligible population in one MOH area. For example, if a MOH plans to
screen 13,230 eligible populations within 5 years, this MOH needs to conduct 132 screening
sessions per year with 20 participants per session. The 132 screening sessions can be
implemented by several institutions existing within the MOH but it is assumed that each session
will be conducted by one doctor and 3 nurses. The total cost for 5 years would be Rs.1,117,350
(Rs.163,470 per year with 300.000 initial cost). Human resources required in 5 years would be a
total of 880 hours for each doctor and 2,640 hours for nurses, which are converted to
Rs.474,412 (Rs.94,882 per year) in salaries (Table 4-2).
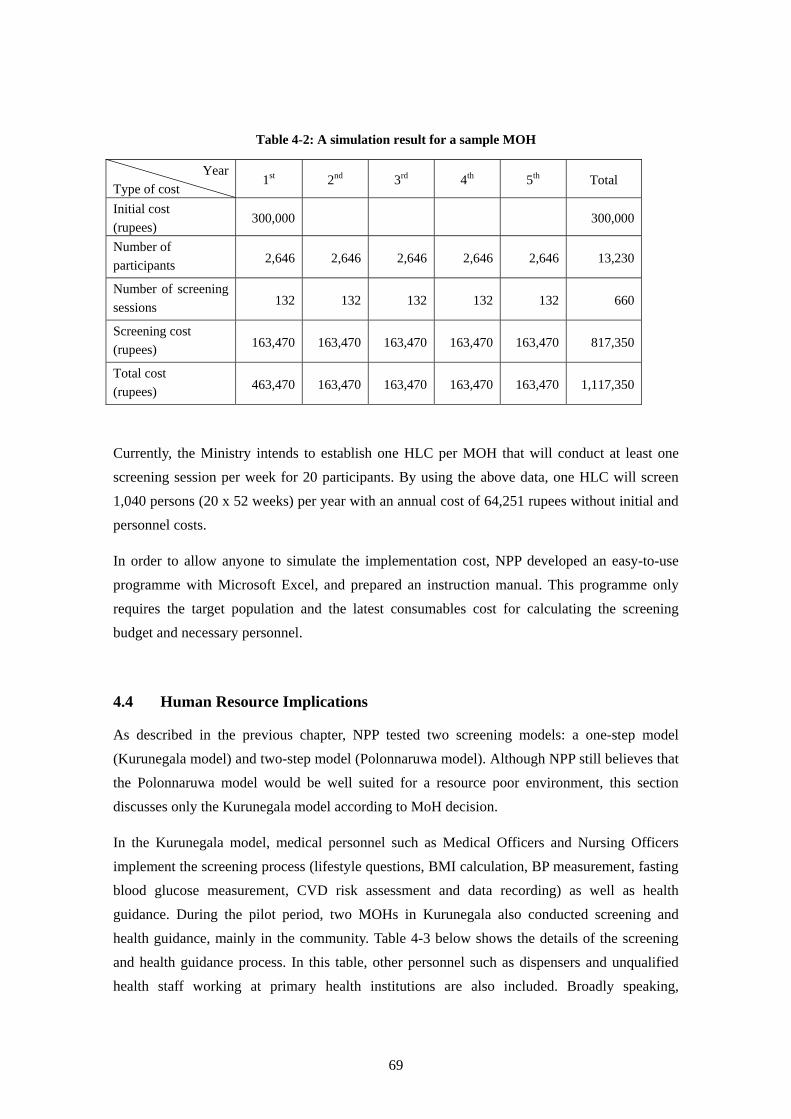
69
Table 4-2: A simulation result for a sample MOH
Year
Type of cost 1st 2nd 3rd 4th 5th Total
Initial cost
(rupees) 300,000 300,000
Number of
participants 2,646 2,646 2,646 2,646 2,646 13,230
Number of screening
sessions 132 132 132 132 132 660
Screening cost
(rupees) 163,470 163,470 163,470 163,470 163,470 817,350
Total cost
(rupees) 463,470 163,470 163,470 163,470 163,470 1,117,350
Currently, the Ministry intends to establish one HLC per MOH that will conduct at least one
screening session per week for 20 participants. By using the above data, one HLC will screen
1,040 persons (20 x 52 weeks) per year with an annual cost of 64,251 rupees without initial and
personnel costs.
In order to allow anyone to simulate the implementation cost, NPP developed an easy-to-use
programme with Microsoft Excel, and prepared an instruction manual. This programme only
requires the target population and the latest consumables cost for calculating the screening
budget and necessary personnel.
4.4 Human Resource Implications
As described in the previous chapter, NPP tested two screening models: a one-step model
(Kurunegala model) and two-step model (Polonnaruwa model). Although NPP still believes that
the Polonnaruwa model would be well suited for a resource poor environment, this section
discusses only the Kurunegala model according to MoH decision.
In the Kurunegala model, medical personnel such as Medical Officers and Nursing Officers
implement the screening process (lifestyle questions, BMI calculation, BP measurement, fasting
blood glucose measurement, CVD risk assessment and data recording) as well as health
guidance. During the pilot period, two MOHs in Kurunegala also conducted screening and
health guidance, mainly in the community. Table 4-3 below shows the details of the screening
and health guidance process. In this table, other personnel such as dispensers and unqualified
health staff working at primary health institutions are also included. Broadly speaking,
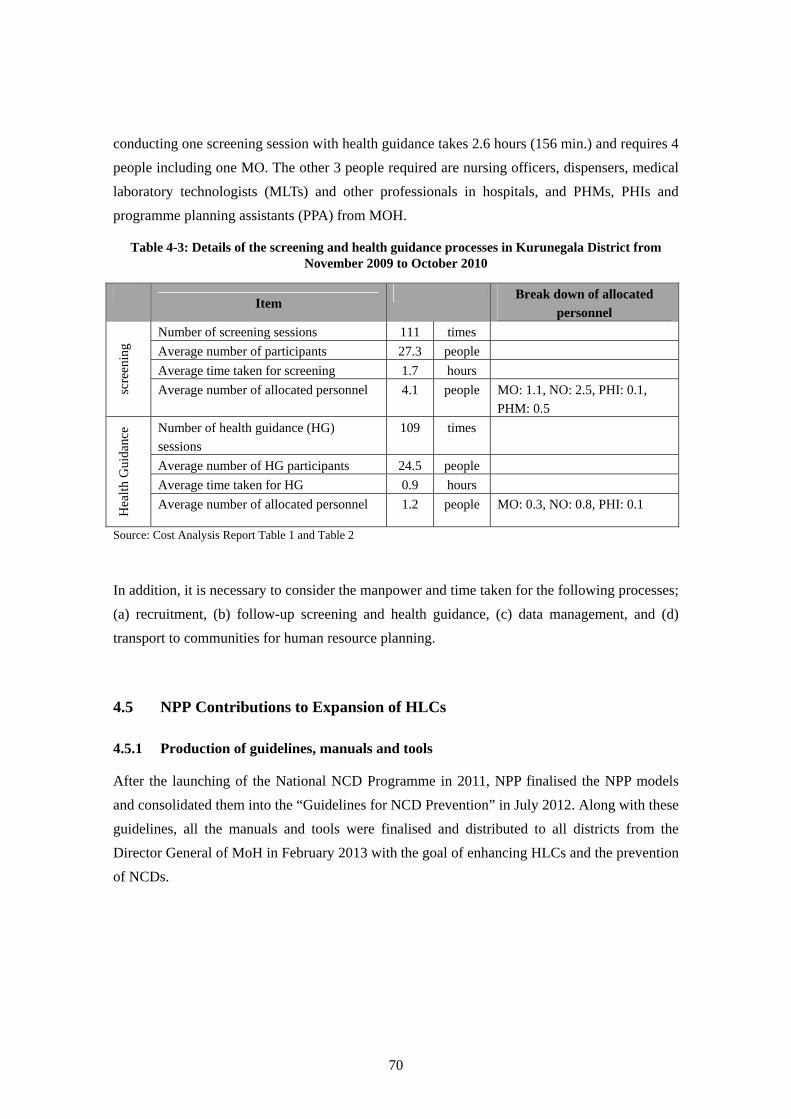
70
conducting one screening session with health guidance takes 2.6 hours (156 min.) and requires 4
people including one MO. The other 3 people required are nursing officers, dispensers, medical
laboratory technologists (MLTs) and other professionals in hospitals, and PHMs, PHIs and
programme planning assistants (PPA) from MOH.
Table 4-3: Details of the screening and health guidance processes in Kurunegala District from November 2009 to October 2010
Item
Break down of allocated
personnel
scre
enin
g
Number of screening sessions 111 times
Average number of participants 27.3 people
Average time taken for screening 1.7 hours
Average number of allocated personnel 4.1 people MO: 1.1, NO: 2.5, PHI: 0.1,
PHM: 0.5
Hea
lth
Gui
danc
e
Number of health guidance (HG)
sessions
109 times
Average number of HG participants 24.5 people
Average time taken for HG 0.9 hours
Average number of allocated personnel 1.2 people MO: 0.3, NO: 0.8, PHI: 0.1
Source: Cost Analysis Report Table 1 and Table 2
In addition, it is necessary to consider the manpower and time taken for the following processes;
(a) recruitment, (b) follow-up screening and health guidance, (c) data management, and (d)
transport to communities for human resource planning.
4.5 NPP Contributions to Expansion of HLCs
4.5.1 Production of guidelines, manuals and tools
After the launching of the National NCD Programme in 2011, NPP finalised the NPP models
and consolidated them into the “Guidelines for NCD Prevention” in July 2012. Along with these
guidelines, all the manuals and tools were finalised and distributed to all districts from the
Director General of MoH in February 2013 with the goal of enhancing HLCs and the prevention
of NCDs.

71
Table 4-4: Final production list and quantity
Material Name Language and Quantity
Sinhala Tamil Sin/Tam English
Guidelines for NCD Prevention 500
Screening Manual 4000 1500 4200
Flip Chart 1000 400
Flip Chart Guidebook 2000 800
Health Promotion Resource Book 500
Exercise Book (1) & (2) 2000
Exercise DVD (Hari Hari Uyayama) 700
Exercise DVD (Exercise for a Healthy
Future) 500
BMI calculation poster 2000
BMI calculation wheel 1000
CVD poster (Blue and pink version) 800 400
HLC poster 900 500
PHM reference card* 2000 1000 *Developed with Policy Analysis Unit
4.5.2 DVD production for HLCs
In September 2012, the MO/NCDs from all the districts gathered in Kurunegala to observe how
Kurunegala RDHS established over 100 HLCs, how the activities and data were monitored, and
how the stakeholders were trained. Based on this occasion, the NCD Unit requested NPP to
jointly produce two DVDs to facilitate HLC expansion. These final products were handed over
to MoH at the final seminar for island-wide distribution.
DVD (1): Effective Healthy Lifestyle Centres for NCD Prevention
This 120-minute DVD was produced mainly to train health personnel who will be engaged in
HLC activities. Various experts contributed to the production as indicated in Table 4-5.
Table 4-5: Contents of DVD (1)
Section Topic Contributor
Introduction What is a Healthy Lifestyle Centre? Dr. Thalatha Liyanage, Director NCD Unit
Screening
Height, weight, BMI, blood pressure
measurement, fasting blood glucose
Staff at BH Dambadeniya & Dr. Shamali
Amarasinghe, MO/NCD, RDHS
Kurunegala
CVD risk calculation Dr. Asanka Rathnayaka, former VP, BH
Dambadeniya Total risk management
Health
Guidance
Purpose and tips for health guidance Dr. D. R. D. F. C, Kanthi, deputy director,
HEB
Better nutrition and diet Dr. U. M. M. Samaranayake, Director,
Nutrition Section and 2 doctors, one
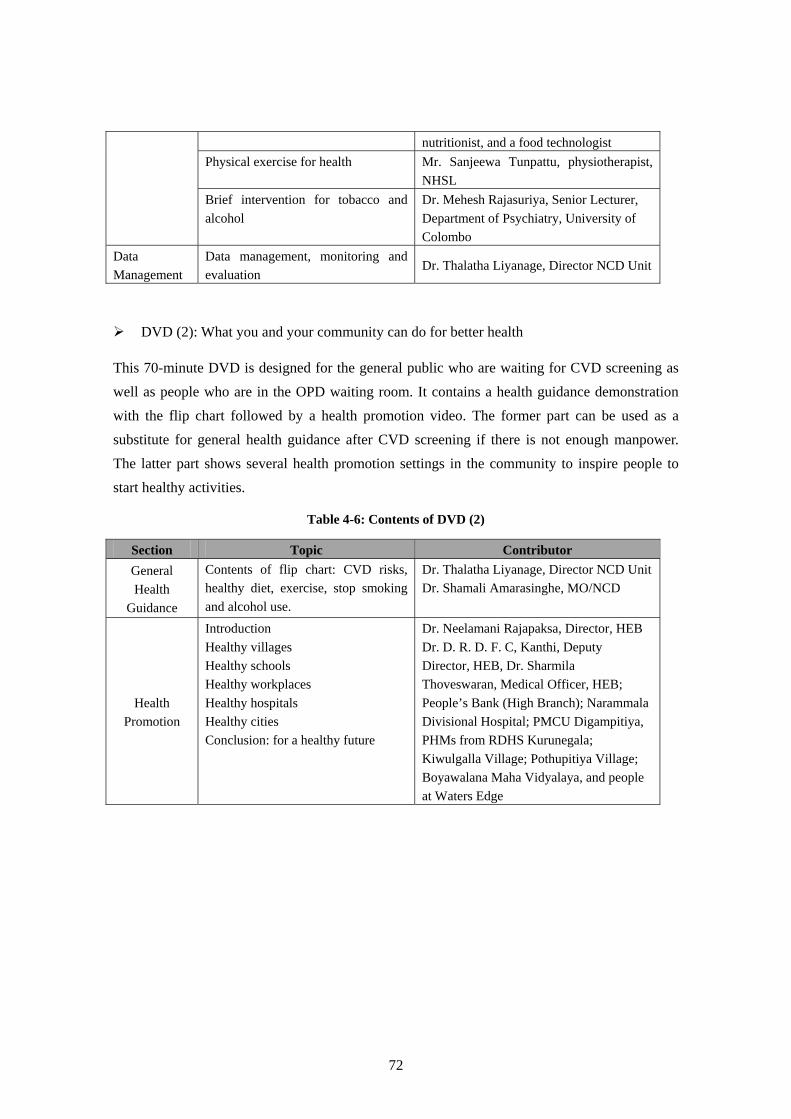
72
nutritionist, and a food technologist
Physical exercise for health Mr. Sanjeewa Tunpattu, physiotherapist,
NHSL
Brief intervention for tobacco and
alcohol
Dr. Mehesh Rajasuriya, Senior Lecturer,
Department of Psychiatry, University of
Colombo
Data
Management
Data management, monitoring and
evaluation Dr. Thalatha Liyanage, Director NCD Unit
DVD (2): What you and your community can do for better health
This 70-minute DVD is designed for the general public who are waiting for CVD screening as
well as people who are in the OPD waiting room. It contains a health guidance demonstration
with the flip chart followed by a health promotion video. The former part can be used as a
substitute for general health guidance after CVD screening if there is not enough manpower.
The latter part shows several health promotion settings in the community to inspire people to
start healthy activities.
Table 4-6: Contents of DVD (2)
Section Topic Contributor
General
Health
Guidance
Contents of flip chart: CVD risks,
healthy diet, exercise, stop smoking
and alcohol use.
Dr. Thalatha Liyanage, Director NCD Unit
Dr. Shamali Amarasinghe, MO/NCD
Health
Promotion
Introduction
Healthy villages
Healthy schools
Healthy workplaces
Healthy hospitals
Healthy cities
Conclusion: for a healthy future
Dr. Neelamani Rajapaksa, Director, HEB
Dr. D. R. D. F. C, Kanthi, Deputy
Director, HEB, Dr. Sharmila
Thoveswaran, Medical Officer, HEB;
People’s Bank (High Branch); Narammala
Divisional Hospital; PMCU Digampitiya,
PHMs from RDHS Kurunegala;
Kiwulgalla Village; Pothupitiya Village;
Boyawalana Maha Vidyalaya, and people
at Waters Edge
73
CHAPTER 5 : Lessons Learnt and Ways Forward
5.1 Lessons learnt from NPP
The NCD Prevention Project was implemented from May 2008 to March 2013 to develop NCD
prevention models for Sri Lanka with cooperation from the Japan International Cooperation
Agency. The following are some of the lessons learnt during the implementation of the project
(1) Impact of check-up models on the short-term goal for NCD check-ups
The check-up activities in Narammala, Alawwa and Medirigiriya MOH areas demonstrated that
both the two-step and one-step models can achieve their short term goals: the detection of risk
factors for CVDs and reduction of CVD risk.
Less than 3 % of check-up participants in Kurunegala and 2% in Polonnaruwa were diagnosed
as being in the CVD high risk group, based on national drug-treatment criteria. In the follow-up
survey25, 78% of the CVD high risk group in Kurunegala26 and 75% in Polonnaruwa were
confirmed to have commenced treatment and controlled their blood pressure level and/or blood
glucose levels. The behaviour survey in Polonnaruwa27 suggested that favourable behavioural
changes were observed after screening, especially when people clearly understood the message
of the general health guidance.
(2) Impact of check-up model on the long-term goal of NCD check-ups
As mentioned above, the proportion of those in the CVD high risk group in the target population
is less than 3%, Therefore it is necessary to screen a large population in order to detect many
other people at high risk who are not currently receiving treatment. The check-up activities in
Narammala, Alawwa and Medirigiriya MOH areas demonstrated that approximately 20% of the
eligible population can be screened per annum. This figure supports the strong possibility of
achieving a high level of coverage of the target population within a few years by continuing the
screening interventions. At the same time, however, it is necessary to establish a system to avoid
duplication in the check-up registry. Also in order to reduce the number of premature deaths due
to CVD, the long term goal of NCD check-ups, it is important to ensure that the regular
check-up system is based on participants’ CVD event risk status function, so that they can
improve or maintain a lower CVD event risk over subsequent years.
25 The “follow-up survey for CVD high risk people” conducted by NPP in 2012. Please see section 3.3 for detail. 26 The data is from NCD Cell in Kurunegala RDHS 27 Koyama, op.cit
74
(3) Lack of awareness of ideal levels of weight, blood pressure and blood glucose
The follow-up and Koyama surveys identified the importance of health guidance, though most
of the people in the CVD high risk group still did not know their ideal level of weight, blood
pressure or blood glucose, even after they received general health guidance. Therefore, during
the follow-up health guidance sessions, the participants should be reminded of their ideal levels.
In addition, since weight and blood pressure levels are relatively easily monitored by the people
themselves, creation of an environment in the community where the public can measure weight
and blood pressure in conjunction with health promotion activities is recommended.
(4) Importance of the Total Risk Approach
Among the check-up participants, a high prevalence of hypertension was observed in both
Kurunegala (26% in males and 25% in females) and Polonnaruwa (29% in males and 32% in
females). Prevalence of diabetes mellitus was 18% of males and 16% of females in Kurunegala.
In contrast, prevalence of members of the CVD high risk group (>=20%) was 3.0% of males
and 3.4% of females in Kurunegala and 1.6% of males and 1.9% of females in Polonnaruwa.
If hypertension is managed according to a single risk approach, mass treatment, which will not
only be costly to the government but also inadequate for CVD risk prevention, will be required.
Although the total risk management approach is relatively new to medical officers, the pilot
implementations demonstrated its necessity and feasibility. The NCD Unit should extend
trainings on this subject until the total risk approach is fixed around the country.
(5) Screening model for male working population
Lower participation rates in males were observed in both pilot districts. Although several
actions were taken to improve the male participation rate during the project period, effectiveness
was observed only when the MOH office conducted mass screenings in villages and in
workplaces. Since hospitals cannot organise such screenings during their routine work schedules,
coordination by MO/NCD at RDHS level or by the MOH office is necessary to organise
screenings at communities and workplaces.
(6) Introduction of systematic recruiting
Involvement of PHMs in NCD prevention is still controversial in the health sector. This is the
main reason why the Polonnaruwa model (two-step model) was not selected despite its cost
effectiveness and high coverage. In Polonnaruwa, high coverage was attained since systematic
recruitment was implemented by PHMs who knew the population composition of the area. In a
less populated area with limited health facilities and resources, introduction of a systematic
recruitment model with utilisation of MCH centres may be necessary to increase screening

75
coverage as well as equity of access to screening programmes.
(7) Extension of continuous support to health promotion setting leaders
In 2009, six consecutive sessions for health promotion setting leaders were conducted and 38
settings in total were established. In September 2010, 24 settings were still active with 574
members and were meeting once a month on average for health promotion activities. The
original settings retained high motivation and interest in health promotion due to regular
follow-up by the members of the Foundation for Health Promotion. However, other settings
without regular follow-up have had a higher tendency to stop activities. This result indicates that
continuous support is necessary to maintain health promotion settings; however, NPP could not
present a durable model in view of shortage of manpower in the current health system.
5.2 Review of Recommendations Made During the Terminal Evaluation
Under the JICA technical cooperation scheme, the terminal evaluation is conducted six months
before the actual termination and provides recommendations to follow. This section reviews the
recommendations made in the joint evaluation report between the government of Sri Lanka and
JICA, and their current status.
(1) Recommendation 1: Implementation of follow-up guidance for high risk group
members
As stated in the joint evaluation report, the Project has already achieved all planned activities
and almost all indicators for the Project purpose reached the targets. However, the 2nd indicator
for the Project purpose (coverage of follow-up guidance for high risk people) has not been
measured because the criteria for the high-risk group had not been fully defined until May 2012.
Thus, it is recommended to collect as much data as possible for this indicator in the remaining
period.
Status: During the project period, NPP was unable to collect sufficient data. The NCD unit,
however, introduced a follow-up registry format and instructed all MO/NCDs to implement and
report on annual basis. Once data is accumulated in the follow-up registry, the NCD unit should
be able to retrieve the necessary information, although some people may instead opt for private
clinics.
(2) Recommendation 2: Continuation of the Ragama Health Study
The Ragama Health Study has provided valuable information and is the first reliable cohort
76
study implemented in a developing country. Thus, the University of Kelaniya is recommended
to seek a funding source to continue this cohort study for as long as possible. Also, to enhance
quality of the survey, the University of Kelaniya is recommended to analyse following points:
To investigate the relevance of the target population as representative of the general
population in the country, the demographic data of the population should be compared to
those of other studies in the country.
To analyse the relationship between risk factors and health status outcomes of participants
(incidence of CVD etc.), all necessary data should be collected.
Status: University of Kelaniya is still seeking funding to continue the cohort survey. Meanwhile,
University of Kelaniya is continuing its follow-up of the RHS population by phone to confirm
any CVD events. The background data of the population was compared with the Census Data of
Population and Housing 2001 and the Sri Lanka Diabetes and Cardiovascular Study (SLDCS)28,
a cross sectional survey in seven out of nine provinces from 2005 to 2006. The proportion of
Christians (36.7%) is higher while Buddhists (61.0%), Hindus (0.5%), and Muslims (1.1%) are
lower in the RHS population in comparison with the national census (Christians 6.9%,
Buddhists 76.7%, Hindus 7.9%, and Muslims 8.5%). The proportion of those with Sinhalese
ethnicity (95.4%) is higher in the RHS population than the national census (81.9%), while other
ethnicities are much less proportionate – especially the proportion of Tamils (1.6% in the RHS
population; 9.5% in the national census) and Muslims (1.1% in the RHS population; 8.0% in the
national census). Compared with SLDCS, the proportion of tertiary and higher educated in the
RHS population is relatively large (19.2% in the RHS population; 2.9% in SLDCS), while the
proportion of those with no formal schooling and until primary education is lower (8.2% in the
RHS population; 24.0% in SLDCS). The proportion of education to secondary level is almost
the same in both studies (72.1% in the RHS population; 73.1% in SLDCS).
The proportion of the RHS population with high monthly family income is also higher in the
population compared with SLDCS (Rs. 25,000 and above is 15.7% in the RHS population;
5.8% in SLDCS). The demographic differences may be because the study targets an urban
population while SLDCS targets both urban and rural populations. The Project suggested further
analysis is necessary on the relationship between risk factors and CVD events to University of
Kelaniya, especially on the impact of comorbidity of hypertension, diabetes, and dyslipidaemia
on CVD events and any characteristics among those in younger age groups who had incidence
of dyslipidaemia.
28 Katulanda et al. Metabolic syndrome among Sri Lankan adults: prevalence, patterns and correlates. Diabetology &
Metabolic Syndrome. 2012
77
(3) Recommendation 3: Evidence collection for NCD prevention
The Ministry of Health has realised the importance of surveys to obtain evidence-based
information for implementing strategies for NCD prevention and has already initiated certain
important measures in this regard. Thus, the MoH is recommended to enhance activities to
conduct significant surveys based on its strategic directions.
Status: As stated in Chapter 1, the NCD unit is planning to implement NCD risk factor
surveillance in the near future. In addition to this survey, the NCD unit should be able to obtain
necessary data and key information through a newly introduced data collection and management
system as stated in Chapter 3.
(4) Recommendation 4: Reduce treatment default cases
The Project successfully implemented the activities in the pilot areas to develop models of the
health check-ups, but there are still cases where people are missing out on receiving proper
treatment. It is crucial for the preventive strategy of NCDs to treat all cases of those who are
found to have diseases by health check-up and MoH is recommended to develop mechanisms to
reduce missing cases. The Project is recommended to provide technical assistance in the
remaining period.
Status: Results of the follow-up survey for people in the CVD high risk group were shared
among the relevant stakeholders to reduce treatment defaulters. The Project assisted RDHS
Kurunegala and Polonnaruwa to conduct training for medical officers on management of NCDs
in order to ensure follow-up on those people with high risk of CVDs. Several training sessions
for supportive staff were also held in both Kurunegala and Polonnaruwa to enhance the keeping
of proper records in the registry as well as to improve the monitoring system of people at high
risk. Supportive staff have started to evaluate BMI for all follow-up patients as well as people
who are interested in monitoring their BMI to encourage continuous lifestyle modification.
(5) Recommendation 5: Human resource development for island-wide expansion
For island-wide expansion of NCD prevention measures by utilizing HLCs, it is crucial to
develop a sustainable structure for developing human resources. Thus, the MoH is
recommended to develop a plan for the establishment of a training structure for human
resources in HLCs, including management of health check-ups and health education. The
Project is recommended to provide technical assistance in the remaining period.
Status: The NCD Unit has conducted several trainings for MO/NCDs on major topics for NCD
prevention. For establishing HLCs, the NCD Unit organised a study tour for MO/NCDs to see
how RDHS Kurunegala established and maintained HLCs in the district. In addition to the
78
training conducted by the NCD Unit, the Education, Training and Research (ET&R)
Department conducted health promotion training for MO/NCDs in November 2012. However,
since there was not enough time to develop a training structure for human resources for all
HLCs in the country, NPP decided to produce DVDs for health personnel who are involving
screening and health guidance activities at HLCs, as well as for the general public, as reported
in Chapter 4.
(6) Recommendation 6: Health promotion strategies
For health promotion activities, although there are a certain number of bottlenecks in expanding
settings and activities nationwide, the MoH is recommended to carefully design a long-term
strategy to enhance health promotion activities nationwide, while considering the importance of
community ownership of the process. The Project is recommended to provide technical
assistance in the remaining period.
Status: Based on the Resource Book for Setting Leaders that was produced by NPP, a long-term
strategy to enhance health promotion activities was discussed among relevant stakeholders
within the Ministry. During the meeting, the necessity of TOT module was discussed and NPP
subsequently developed a draft module to train the MO/NCDs, other medical officers and nurses,
as well as health education officers, to become trainers of setting leaders. However, due to time
constraints, the module is still at the draft stage waiting for pilot testing.
5.3 Ways Forward
Considering the lessons learnt from NPP, the current status of the Ministry’s effort, and the
international environment, the following recommendations are made from the Project for further
promotion of NCD prevention in Sri Lanka.
(1) Increase the number of para-medical personnel
Non-communicable disease management requires more medical professionals than
communicable diseases. Various professions such as public health workers, socio-medical
workers, physiotherapists, occupational therapists and nutritionists will be required in larger
numbers. A strong demand for health guidance is stressed in the project, and demand for house
visits for NCD-related healthcare as well as physiotherapy for post-stroke rehabilitation will
increase in the very near future. In consideration of the duration of training of new staff in these
areas, planning for an increase in the number of para-medical personnel is essential.

79
(2) Re-consider the terms of reference for public health workers
In Sri Lanka, no professional category has yet been officially assigned to promote healthy
lifestyles or general knowledge of NCDs, or to provide care for vulnerable residents such as the
elderly and the disabled. During the project period, utilisation of PHMs for NCD prevention has
often been discussed without reaching a consensus. NPP recognised the need for either
increasing the number of PHMs and revising their TOR to extend their services to all
generations or establishing other new categories of public health workers for NCDs.
(3) Introduce the total risk assessment approach into the medical faculty curriculum.
Concepts such as “total risk assessment approach” and “population-based approach” only work
when all physicians working for primary, secondary and tertiary level health institutions follow
the same guidelines and play their separate roles, respectively. That is why all medical students
as well as graduates should learn about them as part of the national health policy.
(4) Enhance communication skills
In NCD management, behaviour change is the key to controlling diseases. Therefore, not only
medical officers but also nursing officers and other health staff including public health staff
need to obtain the skills for mobilising and encouraging people for better compliance. The
concepts of “life skills” as well as health promotion need to be introduced and emphasised in all
curriculums.
(5) Monitor impact of screening
The effects of screening on those who had lower CVD risk were not surveyed in this
programme. Since a shift of mean blood pressure, blood glucose level, and other risk factors in
the population distribution is one of the best ways to reduce the overall CVD burden29, it is
recommended to monitor the impact of screening through these shifts of mean value of the main
risk factors in the population.
(6) Strengthen NCD surveillance system
Considering the time gap between screening and mortality data, it is recommended to establish
alternative methods of monitoring trends, such as by establishing sentinel surveillance sites to
track CVD risk factor levels in populations so that the NCD Unit can ensure the effectiveness of
the intervention strategy. By introducing the sentinel surveillance system, the burden of data
29 MacMahon S, Neal B, Rodgers A. Hypertension- time to move on. Lancet 2005; 365:1108-09 Comment. Measuring progress on NCDs: one goal and five targets. www.thelancet.com Vol. 380. October 13,
2012
80
collection at the screening site (which often tends to increase due to the professional curiosity of
the district/central level) can be significantly reduced to ensure the quality of limited data that is
collected, such as addresses and telephones number to trace participants.
5.4 Acknowledgements
During the 5 years’ implementation of NPP, so many ideas, approaches, and methodologies have
been tested with great contributions of medical officers of health, PHIs, PHMs and other staff of
MOH Narammala, MOH Alawwa, and MOH Medirigiriya; visiting physicians, medical
superintendents, medical officers in charge, doctors, nursing officers, and supportive staff of
Base Hospital Dambadeniya, Base Hospital Medirigiriya, divisional hospitals of Narammala,
Alawwa, Nawathalwatta, and PMCU Boyawalana, Welikare, Udumulla, Ambagaswewa,
Wijayapura and Diwulankadawala. The pilot implementations would not have been so
successful without the active involvement of Dr. Nihal Edirisinghe, Dr. Shamali Amarasinghe,
Dr. Ranga Chandrasena, and Dr. Indika Udaya Kumara, and RDHS of Kurunegala and
Polonnaruwa, as well as PDHS of North West and North Central provinces.
In addition to the above, NPP extends sincere gratitude to the Director General of Health
Services, all Deputy Director Generals, Directors, Deputy Directors of the Ministry of Health;
Universities of Colombo, Kelaniya, Rajaratha, and Wayamba; Ceylon College of Physicians,
College of community Physicians, College of General Practitioners, Health Promotion
Foundation, Sri Lanka Medical Association, Nilogi Lanka, the World Health Organization and
the World Bank for their support in the Joint Coordinating Meetings.
Finally, the JICA team wishes to express special thanks to Dr. Wimal Jayantha, Deputy Director
General, Planning, Dr. Thalatha Liyanage, Director NCD, and the former Director NCDs whose
support was essential for project implementation.
81
References
Abeywardena, M.Y. (2003). Dietary fats, carbohydrates and vascular disease: Sri Lankan perspectives, Elsevier Ireland Ltd.
Beaglehole, R., Bonita, R., Horton, R., Ezzati M., Bhala N., Amuyunzu-Nyamongo M. (2012). Measuring progress on NCDs: one goal and five targets. Lancet, 380(9850):1283-5.
Department of Census and Statistics, Sri Lanka, (2001). Population and Housing 2001, Retrieved from http://www.statistics.gov.lk.
Department of Census and Statistics, Sri Lanka, (2012). Census of Population and Housing 2012. Retrieved from http://www.statistics.gov.lk
Engelgau, M., Okamoto, K., Navaratne, K.V., & Gopalan, S. (2010). Prevention and control of selected chronic NCDs in Sri Lanka: Policy options and action, Working Paper No: 57563. The World Bank.
Faculty of Medicine, University of Kelaniya (2009). NCD Prevention Project: Ragama Health Study follow-up risk factor survey. Annual Report 2009.
Faculty of Medicine, University of Kelaniya (2010). NCD Prevention Project: Ragama Health Study follow-up risk factor survey. Annual Report 2010.
Faculty of Medicine, University of Kelaniya (2012). NCD Prevention Project: Ragama Health Study: In-Depth Analysis.
Ibrahim, M. Mohsen, Damasceno, A. (2012). Hypertension in developing countries. Lancet, 380(9841), 611-619.
Jayawardena, R., Swaminathan, S., Byrne, Nuala M. et al., (2012). Development of a food frequency questionnaire for Sri Lankan adults. Nutrition Journal, 11(1),63.
JICA, Ministry of Health, Nutrition & Welfare, the Democratic Socialist Republic of Sri Lanka. (2002). Master Plan Study for Strengthening Health System in the Democratic Socialist Republic of Sri Lanka.
Katulanda P., Constantine G.R., Mahesh J.G., Sheriff R., Seneviratne R.D., Wijeratne S., et al. (2008). Prevalence and projections of diabetes and pre-diabetes in adults in Sri Lanka - Sri Lanka Diabetes, Cardiovascular Study (SLDCS). Diabet Med. 25(9): 1062-9.
Katulanda P., Ranasinghe P., Jayawardana R., Sheriff, R & Matthews, D.R. (2012). Metabolic syndrome among Sri Lankan adults: Prevalence, patterns and correlates. Diabetology & Metabolic Syndrome 4(1), 24.
Koyama, K. (2011). Effects of Health Check-ups on Improving Health Promoting Behaviour with Regard to Lifestyle-Related Diseases in Sri Lanka.
82
MacMahon, S., Neal, B.. & Rodgers, A. Hypertension- time to move on. Lancet, 365(9646),1108-09.
Ministry of Health (2011). Country Report, Regional Meeting on Health and Development Challenges of Noncommunicable Diseases, 1-4 March 2011, Jakarta.
Ministry of Health (2012). Abstracts of non communicable diseases and prevalence of risk factors in Sri Lanka, published from 1990 – 2012.
MoH, (2008). Risk Factor Surveillance.
Ministry of Health, Nutrition Division (2011). Food based dietary guidelines for Sri Lankans.
Misra A., Khurana L., Isharwal S. & Bhardwaj S., South Asian diets and insulin resistance. Br. J Nutrition 2009, 101(4), 465-473.
Pathmeswaran, et al. (2009). Ragama Health Study: Analysis of baseline survey.
WHO (2012). Report of the Formal Meeting of Member States to conclude the work on the Comprehensive Global Monitoring Framework, including indicators, and a set of voluntary global targets for the prevention and control of noncommunicable diseases, November 21, 2012. World Health Organization.
WHO. (1986). The Ottawa charter on health promotion. (WHO/HPR/HEP/95.1). Ottawa: The World Health Organization.
WHO (1998). Health promotion Glossary. World Health Organization: Geneva. (WHO/HPR/ HEP/98.1). Retrieved from http://www.who.int/hpr/NPH/docs/hp_glossary_en.pdf
Wijewardene, K., Mohideen M.R., Mendis S., Fernando D.S., Kulathilaka, T., Weerasekara, D., et al. (2005). Prevalence of hypertension, diabetes, and obesity: baseline findings of a population-based survey in four Provinces in Sri Lanka. Ceylon Medical Journal, 50(2): 62-70.
World Bank, Project Information Document (Appraisal Stage) - Sri Lanka - Second Health Sector Development Project –Report No: PIDA556. Retrieved from http://www-wds.worldbank.org.
World Bank, 2011, Sri Lanka Health Sector Development Project – Report No. ICR1842
ANNEXS
Annex 1: PDM Version 4
Annex 2: Sri Lankan Counterparts
Annex 3: Dispatch of Japanese Experts
Annex 4: List of Equipment
Annex 5: Counterpart Trainings in Japan
Annex 6: NPP guidelines, manuals and tools
Annex 7: Cost Analysis Report
Annex 1: PDM Version 4
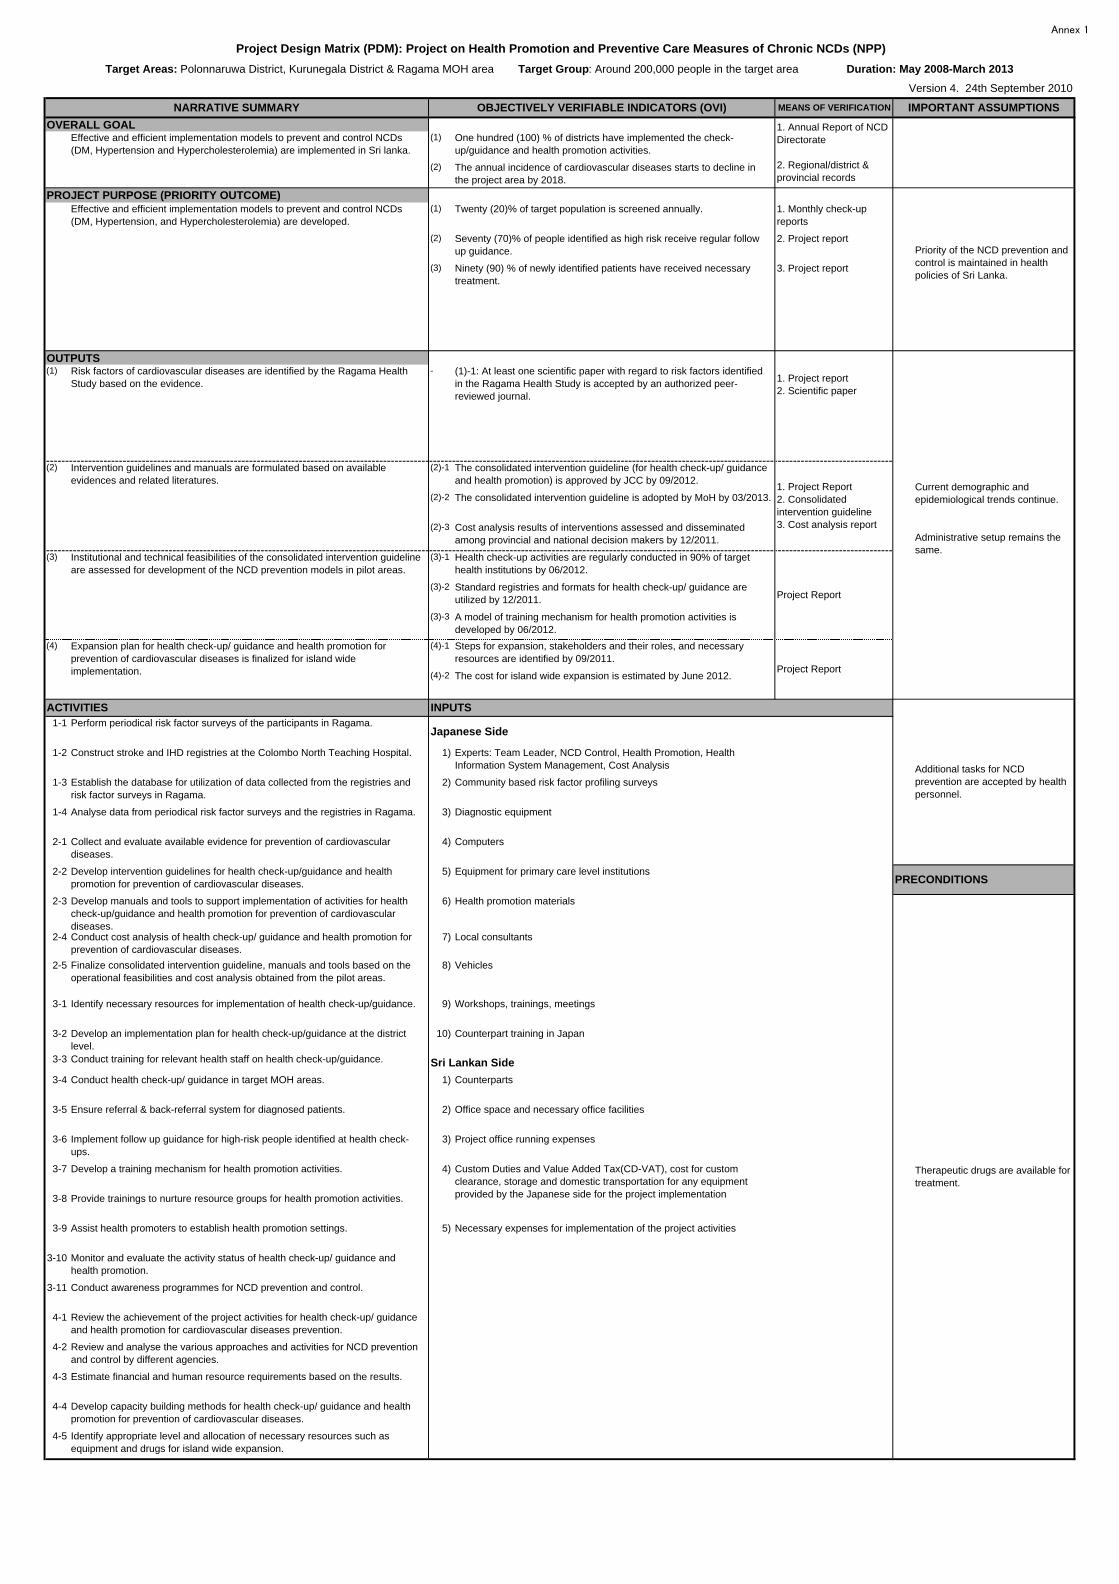
Annex 1
(1) One hundred (100) % of districts have implemented the check-up/guidance and health promotion activities.
(2) The annual incidence of cardiovascular diseases starts to decline inthe project area by 2018.
(1) Twenty (20)% of target population is screened annually.
(2) Seventy (70)% of people identified as high risk receive regular followup guidance.
(3) Ninety (90) % of newly identified patients have received necessarytreatment.
3. Project report
(1) Risk factors of cardiovascular diseases are identified by the Ragama HealthStudy based on the evidence.
- (1)-1: At least one scientific paper with regard to risk factors identifiedin the Ragama Health Study is accepted by an authorized peer-reviewed journal.
(2) (2)-1 The consolidated intervention guideline (for health check-up/ guidanceand health promotion) is approved by JCC by 09/2012.
(2)-2 The consolidated intervention guideline is adopted by MoH by 03/2013.
(2)-3 Cost analysis results of interventions assessed and disseminatedamong provincial and national decision makers by 12/2011.
(3) (3)-1 Health check-up activities are regularly conducted in 90% of targethealth institutions by 06/2012.
(3)-2 Standard registries and formats for health check-up/ guidance areutilized by 12/2011.
(3)-3 A model of training mechanism for health promotion activities isdeveloped by 06/2012.
(4) (4)-1 Steps for expansion, stakeholders and their roles, and necessaryresources are identified by 09/2011.
(4)-2 The cost for island wide expansion is estimated by June 2012.
1-1 Perform periodical risk factor surveys of the participants in Ragama.Japanese Side
1-2 Construct stroke and IHD registries at the Colombo North Teaching Hospital. 1) Experts: Team Leader, NCD Control, Health Promotion, HealthInformation System Management, Cost Analysis
1-3 Establish the database for utilization of data collected from the registries andrisk factor surveys in Ragama.
2) Community based risk factor profiling surveys
1-4 Analyse data from periodical risk factor surveys and the registries in Ragama. 3) Diagnostic equipment
2-1 Collect and evaluate available evidence for prevention of cardiovasculardiseases.
4) Computers
2-2 Develop intervention guidelines for health check-up/guidance and healthpromotion for prevention of cardiovascular diseases.
5) Equipment for primary care level institutions
2-3 Develop manuals and tools to support implementation of activities for healthcheck-up/guidance and health promotion for prevention of cardiovasculardiseases.
6) Health promotion materials
2-4 Conduct cost analysis of health check-up/ guidance and health promotion forprevention of cardiovascular diseases.
7) Local consultants
2-5 Finalize consolidated intervention guideline, manuals and tools based on theoperational feasibilities and cost analysis obtained from the pilot areas.
8) Vehicles
3-1 Identify necessary resources for implementation of health check-up/guidance. 9) Workshops, trainings, meetings
3-2 Develop an implementation plan for health check-up/guidance at the districtlevel.
10) Counterpart training in Japan
3-3 Conduct training for relevant health staff on health check-up/guidance.
3-4 Conduct health check-up/ guidance in target MOH areas. 1) Counterparts
3-5 Ensure referral & back-referral system for diagnosed patients. 2) Office space and necessary office facilities
3-6 Implement follow up guidance for high-risk people identified at health check-ups.
3) Project office running expenses
3-7 Develop a training mechanism for health promotion activities. 4)
3-8 Provide trainings to nurture resource groups for health promotion activities.
3-9 Assist health promoters to establish health promotion settings. 5) Necessary expenses for implementation of the project activities
3-10 Monitor and evaluate the activity status of health check-up/ guidance andhealth promotion.
3-11 Conduct awareness programmes for NCD prevention and control.
4-1 Review the achievement of the project activities for health check-up/ guidanceand health promotion for cardiovascular diseases prevention.
4-2 Review and analyse the various approaches and activities for NCD preventionand control by different agencies.
4-3 Estimate financial and human resource requirements based on the results.
4-4 Develop capacity building methods for health check-up/ guidance and healthpromotion for prevention of cardiovascular diseases.
4-5 Identify appropriate level and allocation of necessary resources such asequipment and drugs for island wide expansion.
IMPORTANT ASSUMPTIONS
OVERALL GOAL
Project Design Matrix (PDM): Project on Health Promotion and Preventive Care Measures of Chronic NCDs (NPP)
NARRATIVE SUMMARY OBJECTIVELY VERIFIABLE INDICATORS (OVI) MEANS OF VERIFICATION
PRECONDITIONS
Target Areas: Polonnaruwa District, Kurunegala District & Ragama MOH area Target Group: Around 200,000 people in the target area Duration: May 2008-March 2013
1. Annual Report of NCDDirectorate
2. Regional/district &provincial records
Version 4. 24th September 2010
Effective and efficient implementation models to prevent and control NCDs(DM, Hypertension, and Hypercholesterolemia) are developed.
1. Project report2. Scientific paper
PROJECT PURPOSE (PRIORITY OUTCOME)
Effective and efficient implementation models to prevent and control NCDs(DM, Hypertension and Hypercholesterolemia) are implemented in Sri lanka.
Institutional and technical feasibilities of the consolidated intervention guidelineare assessed for development of the NCD prevention models in pilot areas.
Therapeutic drugs are available fortreatment.
Current demographic andepidemiological trends continue.
Administrative setup remains thesame.
Sri Lankan Side
Intervention guidelines and manuals are formulated based on availableevidences and related literatures.
Project Report
1. Project Report2. Consolidatedintervention guideline3. Cost analysis report
OUTPUTS
Project Report
Custom Duties and Value Added Tax(CD-VAT), cost for customclearance, storage and domestic transportation for any equipmentprovided by the Japanese side for the project implementation
Additional tasks for NCDprevention are accepted by healthpersonnel.
ACTIVITIES INPUTS
Expansion plan for health check-up/ guidance and health promotion forprevention of cardiovascular diseases is finalized for island wideimplementation.
1. Monthly check-upreports
2. Project reportPriority of the NCD prevention andcontrol is maintained in healthpolicies of Sri Lanka.

Annex 2: Sri Lankan Counterparts
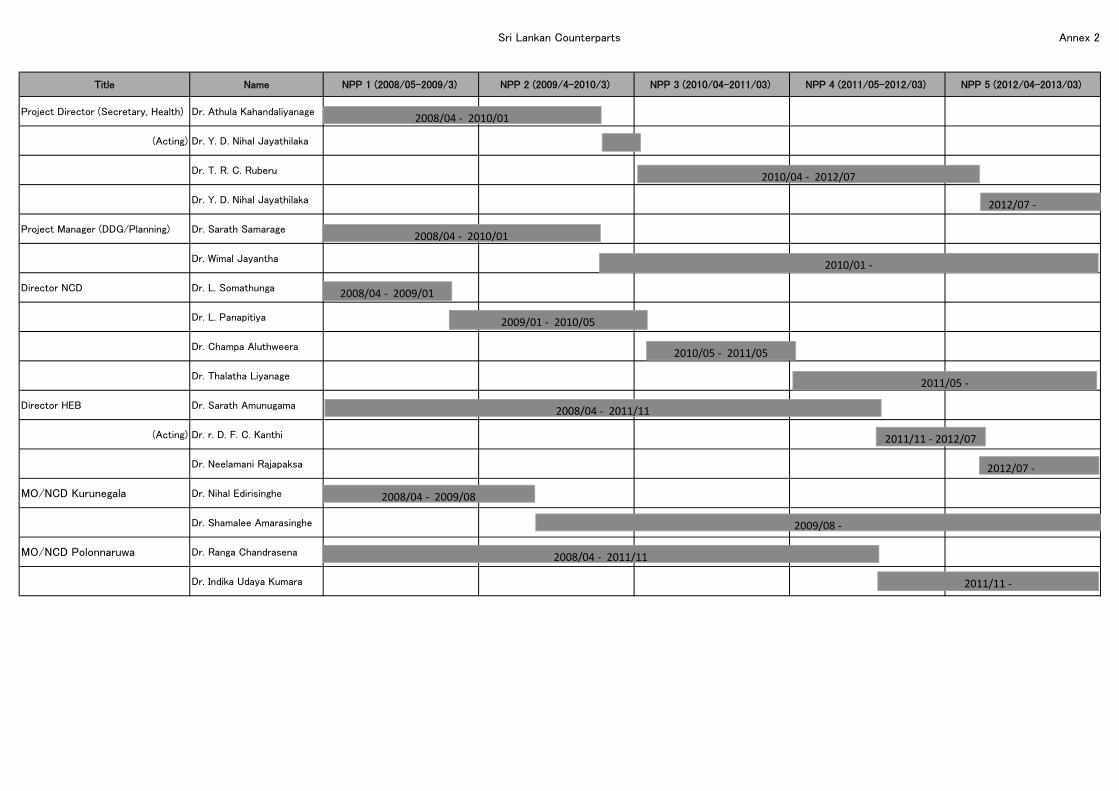
Sri Lankan Counterparts Annex 2
Title Name NPP 1 (2008/05-2009/3) NPP 2 (2009/4-2010/3) NPP 3 (2010/04-2011/03) NPP 4 (2011/05-2012/03) NPP 5 (2012/04-2013/03)
Project Director (Secretary, Health) Dr. Athula Kahandaliyanage
(Acting) Dr. Y. D. Nihal Jayathilaka
Dr. T. R. C. Ruberu
Dr. Y. D. Nihal Jayathilaka
Project Manager (DDG/Planning) Dr. Sarath Samarage
Dr. Wimal Jayantha
Director NCD Dr. L. Somathunga
Dr. L. Panapitiya
Dr. Champa Aluthweera
Dr. Thalatha Liyanage
Director HEB Dr. Sarath Amunugama
(Acting) Dr. r. D. F. C. Kanthi
Dr. Neelamani Rajapaksa
MO/NCD Kurunegala Dr. Nihal Edirisinghe
Dr. Shamalee Amarasinghe
MO/NCD Polonnaruwa Dr. Ranga Chandrasena
Dr. Indika Udaya Kumara
2012/07 ‐
2010/04 ‐ 2012/07
2008/04 ‐ 2010/01
2008/04 ‐ 2010/01
2010/01 ‐
2008/04 ‐ 2009/01
2009/01 ‐ 2010/05
2010/05 ‐ 2011/05
2011/05 ‐
2008/04 ‐ 2011/11
2011/11 ‐ 2012/07
2012/07 ‐
2011/11 ‐
2008/04 ‐ 2011/11
2008/04 ‐ 2009/08
2009/08 ‐

Annex 3: Dispatch of Japanese Experts

Name Position/Expertise 2008 2009 2010 2011 2012 Total
1 K. NishinoTeam leader/NCD prevention/Healthpromotion
3.7 3.5 4.0 5.5 6.6 23.3
2 F. Flores Deputy team leader/NCD prevention 4.4 4.4 0.0 0.0 0.0 8.8
3 Y. Ogawa Deputy team leader/Health promotion 0.0 0.5 3.7 0.3 0.0 4.5
4 T. Murayama Deputy team leader/Clinical epidemiology 3.0 4.7 4.4 4.4 6.5 23.0
5 R. SataHealth information systemmanagement/Health guidance
0.0 0.0 3.2 5.6 6.4 15.2
6 Y. Kamiya Clinical epidemiology/NCD prevention 1.6 0.7 1.0 1.3 0.6 5.2
7 T. Sugimoto Cost Analysis 0.7 1.3 1.4 1.5 0.8 5.7
8 K. WatanabeHealth promotion/Health informationsystem management
3.5 1.7 0.0 0.0 0.0 5.2
9 Y. Uchida Health finance 0.0 0.3 0.0 0.3 0.0 0.6
10 A. Tatera Counterpart training coordination 1.0 1.0 0.0 0.0 0.0 2.0
11 A. Iwata Counterpart training coordination 0.0 0.0 0.5 0.5 0.0 1.0
Total 17.9 18.1 18.2 19.4 20.9 94.5
Dispatch of Japanese Experts
Annex 3

Annex 4: List of Equipment
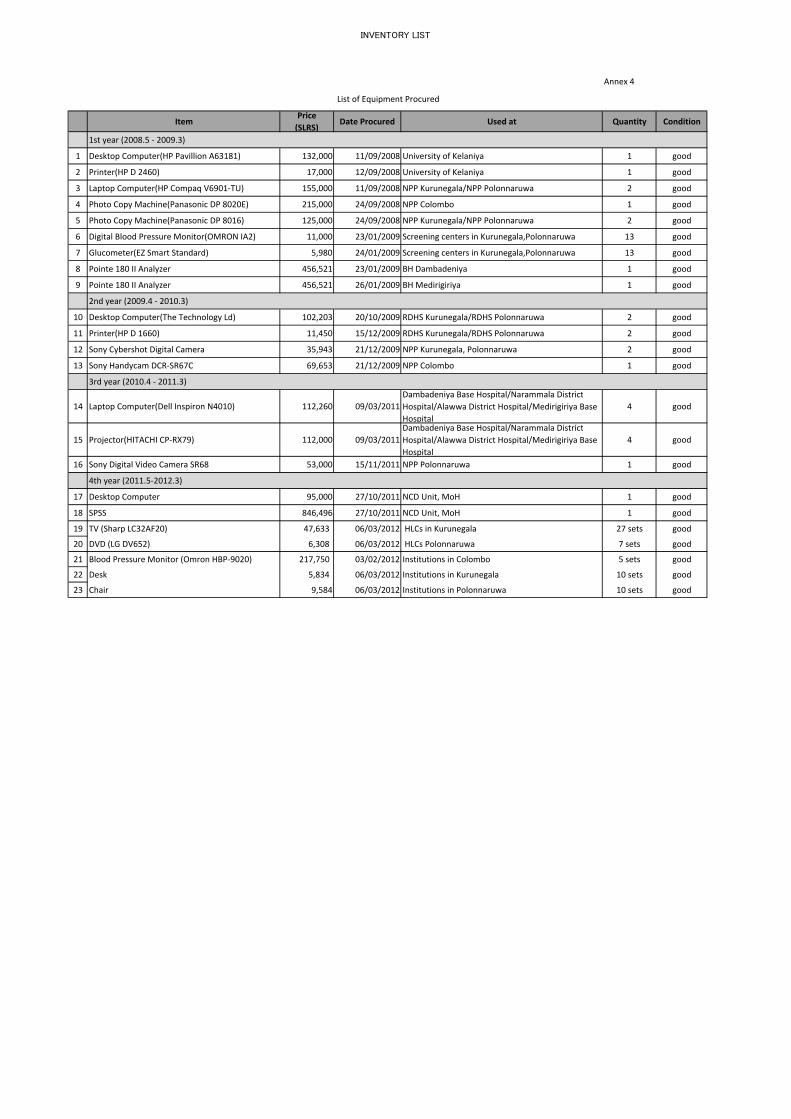
INVENTORY LIST
Annex 4
ItemPrice
(SLRS)Date Procured Used at Quantity Condition
1st year (2008.5 ‐ 2009.3)
1 Desktop Computer(HP Pavillion A63181) 132,000 11/09/2008 University of Kelaniya 1 good
2 Printer(HP D 2460) 17,000 12/09/2008 University of Kelaniya 1 good
3 Laptop Computer(HP Compaq V6901‐TU) 155,000 11/09/2008 NPP Kurunegala/NPP Polonnaruwa 2 good
4 Photo Copy Machine(Panasonic DP 8020E) 215,000 24/09/2008 NPP Colombo 1 good
5 Photo Copy Machine(Panasonic DP 8016) 125,000 24/09/2008 NPP Kurunegala/NPP Polonnaruwa 2 good
6 Digital Blood Pressure Monitor(OMRON IA2) 11,000 23/01/2009 Screening centers in Kurunegala,Polonnaruwa 13 good
7 Glucometer(EZ Smart Standard) 5,980 24/01/2009 Screening centers in Kurunegala,Polonnaruwa 13 good
8 Pointe 180 II Analyzer 456,521 23/01/2009 BH Dambadeniya 1 good
9 Pointe 180 II Analyzer 456,521 26/01/2009 BH Medirigiriya 1 good
2nd year (2009.4 ‐ 2010.3)
10 Desktop Computer(The Technology Ld) 102,203 20/10/2009 RDHS Kurunegala/RDHS Polonnaruwa 2 good
11 Printer(HP D 1660) 11,450 15/12/2009 RDHS Kurunegala/RDHS Polonnaruwa 2 good
12 Sony Cybershot Digital Camera 35,943 21/12/2009 NPP Kurunegala, Polonnaruwa 2 good
13 Sony Handycam DCR‐SR67C 69,653 21/12/2009 NPP Colombo 1 good
3rd year (2010.4 ‐ 2011.3)
14 Laptop Computer(Dell Inspiron N4010) 112,260 09/03/2011
Dambadeniya Base Hospital/Narammala District
Hospital/Alawwa District Hospital/Medirigiriya Base
Hospital
4 good
15 Projector(HITACHI CP‐RX79) 112,000 09/03/2011
Dambadeniya Base Hospital/Narammala District
Hospital/Alawwa District Hospital/Medirigiriya Base
Hospital
4 good
16 Sony Digital Video Camera SR68 53,000 15/11/2011 NPP Polonnaruwa 1 good
4th year (2011.5‐2012.3)
17 Desktop Computer 95,000 27/10/2011 NCD Unit, MoH 1 good
18 SPSS 846,496 27/10/2011 NCD Unit, MoH 1 good
19 TV (Sharp LC32AF20) 47,633 06/03/2012 HLCs in Kurunegala 27 sets good
20 DVD (LG DV652) 6,308 06/03/2012 HLCs Polonnaruwa 7 sets good
21 Blood Pressure Monitor (Omron HBP‐9020) 217,750 03/02/2012 Institutions in Colombo 5 sets good
22 Desk 5,834 06/03/2012 Institutions in Kurunegala 10 sets good
23 Chair 9,584 06/03/2012 Institutions in Polonnaruwa 10 sets good
List of Equipment Procured
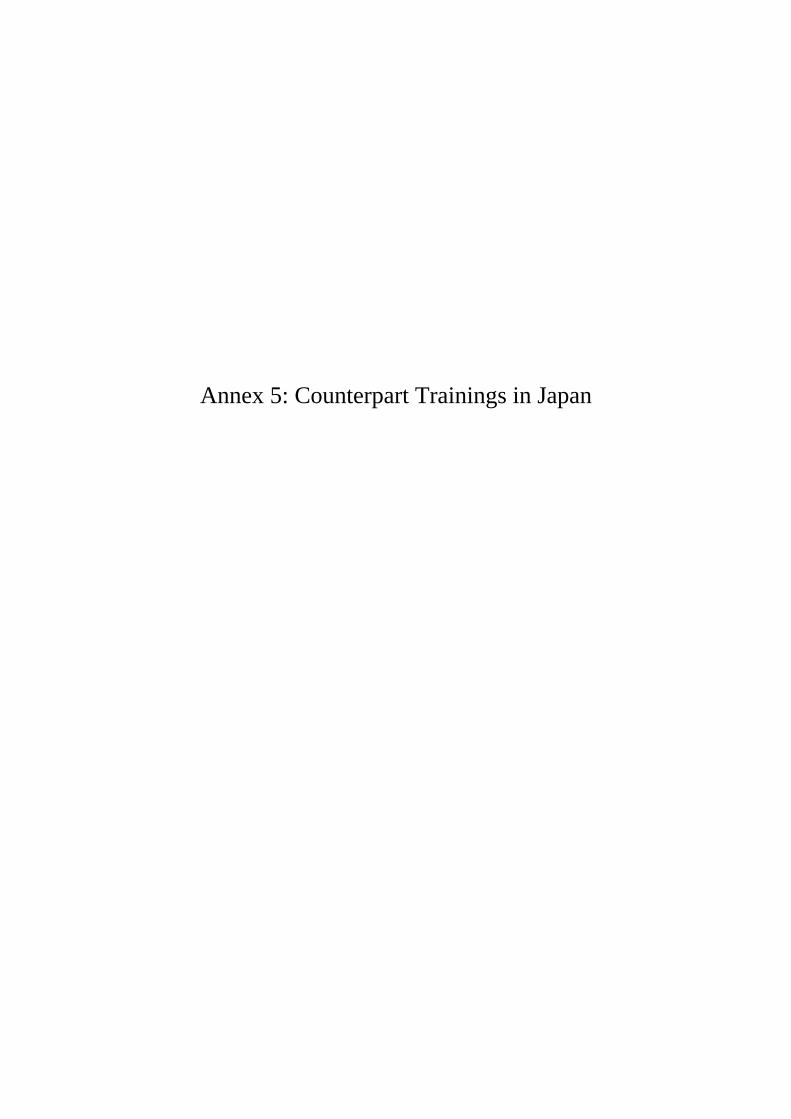
Annex 5: Counterpart Trainings in Japan
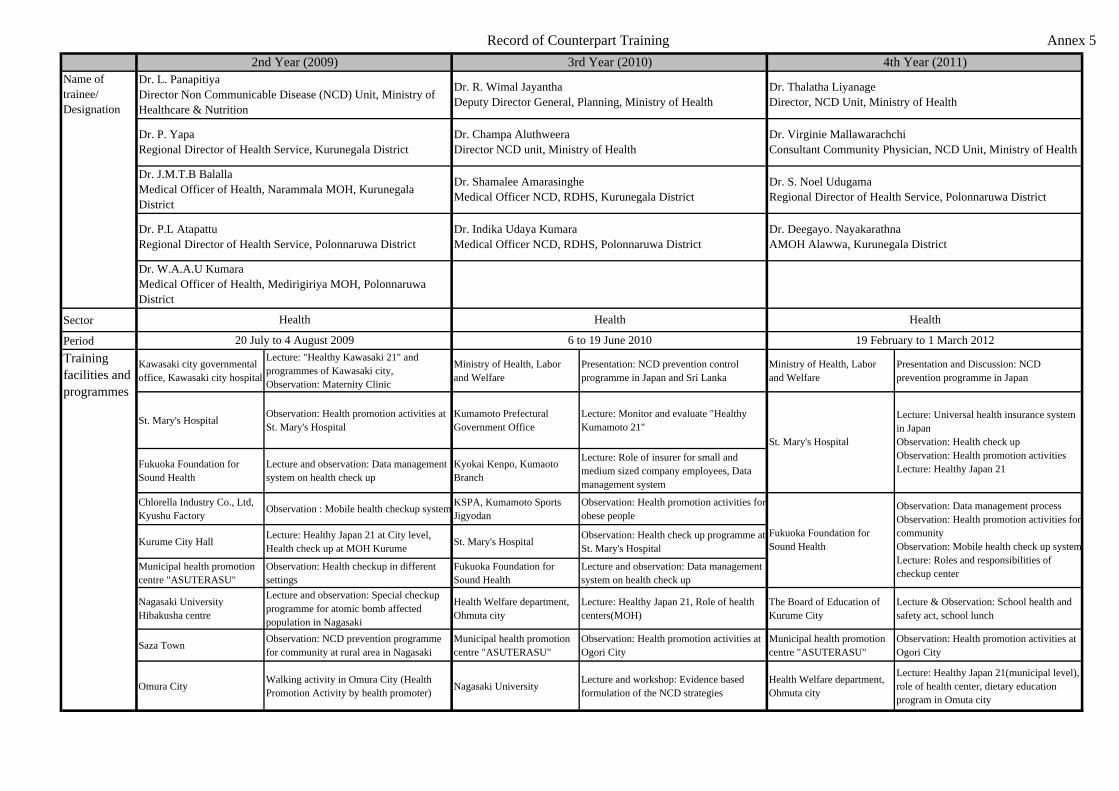
Record of Counterpart Training Annex 5
Sector
Period
Kawasaki city governmentaloffice, Kawasaki city hospital
Lecture: "Healthy Kawasaki 21" andprogrammes of Kawasaki city,Observation: Maternity Clinic
Ministry of Health, Laborand Welfare
Presentation: NCD prevention controlprogramme in Japan and Sri Lanka
Ministry of Health, Laborand Welfare
Presentation and Discussion: NCDprevention programme in Japan
St. Mary's HospitalObservation: Health promotion activities atSt. Mary's Hospital
Kumamoto PrefecturalGovernment Office
Lecture: Monitor and evaluate "HealthyKumamoto 21"
Fukuoka Foundation forSound Health
Lecture and observation: Data managementsystem on health check up
Kyokai Kenpo, KumaotoBranch
Lecture: Role of insurer for small andmedium sized company employees, Datamanagement system
Chlorella Industry Co., Ltd,Kyushu Factory
Observation : Mobile health checkup systemKSPA, Kumamoto SportsJigyodan
Observation: Health promotion activities forobese people
Kurume City HallLecture: Healthy Japan 21 at City level,Health check up at MOH Kurume
St. Mary's HospitalObservation: Health check up programme atSt. Mary's Hospital
Municipal health promotioncentre "ASUTERASU"
Observation: Health checkup in differentsettings
Fukuoka Foundation forSound Health
Lecture and observation: Data managementsystem on health check up
Nagasaki UniversityHibakusha centre
Lecture and observation: Special checkupprogramme for atomic bomb affectedpopulation in Nagasaki
Health Welfare department,Ohmuta city
Lecture: Healthy Japan 21, Role of healthcenters(MOH)
The Board of Education ofKurume City
Lecture & Observation: School health andsafety act, school lunch
Saza TownObservation: NCD prevention programmefor community at rural area in Nagasaki
Municipal health promotioncentre "ASUTERASU"
Observation: Health promotion activities atOgori City
Municipal health promotioncentre "ASUTERASU"
Observation: Health promotion activities atOgori City
Omura CityWalking activity in Omura City (HealthPromotion Activity by health promoter)
Nagasaki UniversityLecture and workshop: Evidence basedformulation of the NCD strategies
Health Welfare department,Ohmuta city
Lecture: Healthy Japan 21(municipal level),role of health center, dietary educationprogram in Omuta city
20 July to 4 August 2009 6 to 19 June 2010 19 February to 1 March 2012
Trainingfacilities andprogrammes
St. Mary's Hospital
Lecture: Universal health insurance systemin JapanObservation: Health check upObservation: Health promotion activitiesLecture: Healthy Japan 21
Fukuoka Foundation forSound Health
Observation: Data management processObservation: Health promotion activities forcommunityObservation: Mobile health check up systemLecture: Roles and responsibilities ofcheckup center
Dr. W.A.A.U KumaraMedical Officer of Health, Medirigiriya MOH, PolonnaruwaDistrict
Health Health Health
2nd Year (2009) 3rd Year (2010) 4th Year (2011)Name oftrainee/Designation
Dr. L. PanapitiyaDirector Non Communicable Disease (NCD) Unit, Ministry ofHealthcare & Nutrition
Dr. R. Wimal JayanthaDeputy Director General, Planning, Ministry of Health
Dr. Thalatha LiyanageDirector, NCD Unit, Ministry of Health
Dr. P. YapaRegional Director of Health Service, Kurunegala District
Dr. Champa AluthweeraDirector NCD unit, Ministry of Health
Dr. Virginie MallawarachchiConsultant Community Physician, NCD Unit, Ministry of Health
Dr. J.M.T.B BalallaMedical Officer of Health, Narammala MOH, KurunegalaDistrict
Dr. Shamalee AmarasingheMedical Officer NCD, RDHS, Kurunegala District
Dr. S. Noel UdugamaRegional Director of Health Service, Polonnaruwa District
Dr. P.L AtapattuRegional Director of Health Service, Polonnaruwa District
Dr. Indika Udaya KumaraMedical Officer NCD, RDHS, Polonnaruwa District
Dr. Deegayo. NayakarathnaAMOH Alawwa, Kurunegala District

Annex 6: NPP guidelines, manuals and tools
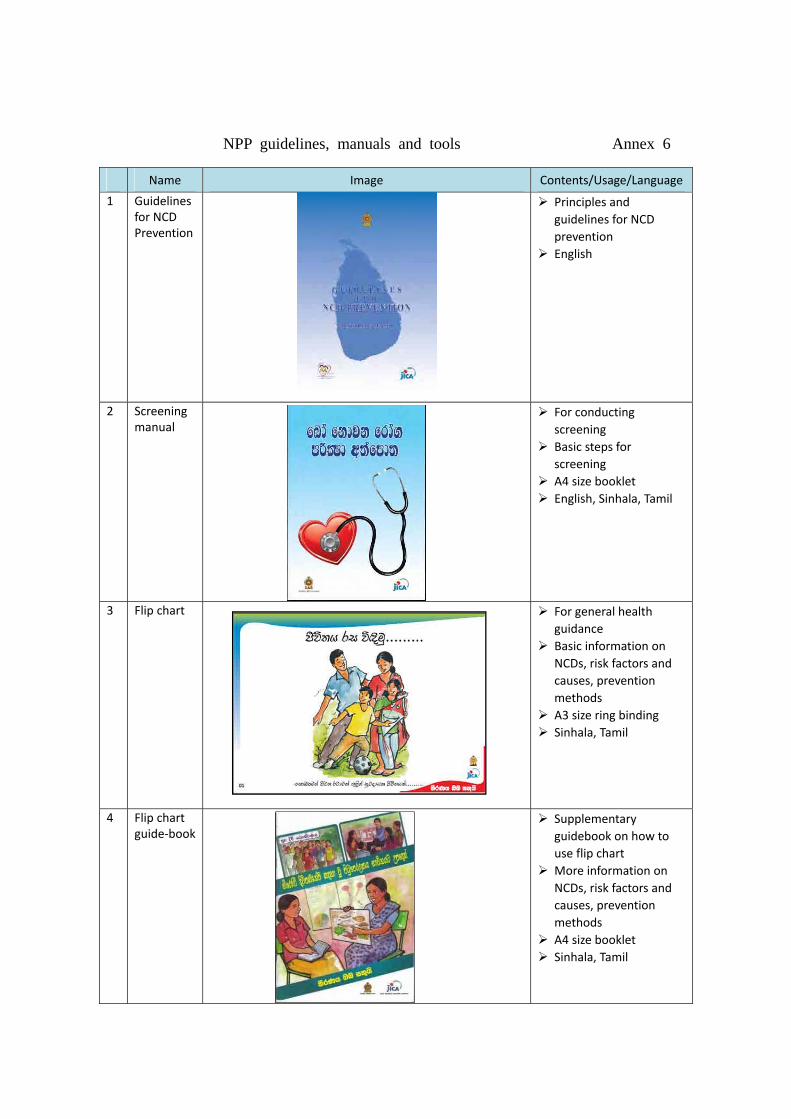
NPP guidelines, manuals and tools Annex 6
Name Image Contents/Usage/Language
1 Guidelines for NCD Prevention
Principles and guidelines for NCD
prevention
English
2 Screening manual
For conducting screening
Basic steps for screening
A4 size booklet English, Sinhala, Tamil
3 Flip chart For general health guidance
Basic information on
NCDs, risk factors and
causes, prevention
methods
A3 size ring binding Sinhala, Tamil
4 Flip chart guide‐book
Supplementary
guidebook on how to
use flip chart
More information on
NCDs, risk factors and
causes, prevention
methods
A4 size booklet Sinhala, Tamil

5 Self‐check calendar
For individual monitoring of physical
exercise, diet and
smoking cessation (2012
calendar)
For follow up and health promotion
18 x 23 inches
6
Stickers for health record (or exercise book)
For monitoring
individual
improvements on
physical exercise, diet,
smoking cessation and
alcohol intake.
For follow up and health promotion
Seven varieties 7 Exercise
DVD Easy physical exercise
with instruction
Suitable for elderly people
For showing at HLCs, OPD waiting rooms and
special events
DVD
8 Exercise instruction book
Stretching and light exercises for health
Suitable for exercise workshop with
instructor
Original booklet was developed by
Kumamoto Sports
Promotion Association
and Asuterasu (Ogori
city) in Japan
A4size

9 BMI poster For easy calculation of BMI
Suitable for the wall of health institutions,
MOHs and workplaces
36 x 48 inches
10 BMI wheel For easy calculation of BMI
Suitable for community
screening
Not as accurate as BMI
chart
6 x 6 inches
11 Food based dietary guidelines for Sri Lanka
For medical officers to
understand nutrition
and diet (published by
the Nutrition Division,
Ministry of Health,
2011)
Including key messages
for improving diet
A5 size booklet
12 Food guide for general public
Suitable for field workers to use in a
nutrition session
Easy reference on nutrition and diet
(published by the
Nutrition Division, 2010)
A5 size booklet
13 PHM reference card
Suitable for PHMs to
provide nutrition
guidance for general
public
Recommended daily
nutrition intake for each
generation, function of
each nutrient, BMI
calculation formula,

health guidance
messages. A4 size leaflet (4 faces)
14 Nutrition flash card
Food photograph cards with explanation of
nutrients
Suitable for PHMs to
discuss about menu
planning
82 cards
15 NCD posters
General message on
NCD risk factors (blue)
and healthy lifestyle to
prevent these risks
(pink)
Suitable for health institutions, MOH and
workplaces
Sinhala, Tamil
16 Poster for healthy lifestyle
Health is the best wealth
Health information for
general public
Encourage public to visit Healthy Lifestyle Centres
Suitable to be posted in health institutions and
MOH offices
Sinhala, Tamil
17 Health promotion resource book for setting facilitators
General information on
health promotion with
specific emphasis on
NCDs
Suitable for health professionals, school
teachers and setting
leaders
A4 size booklet English
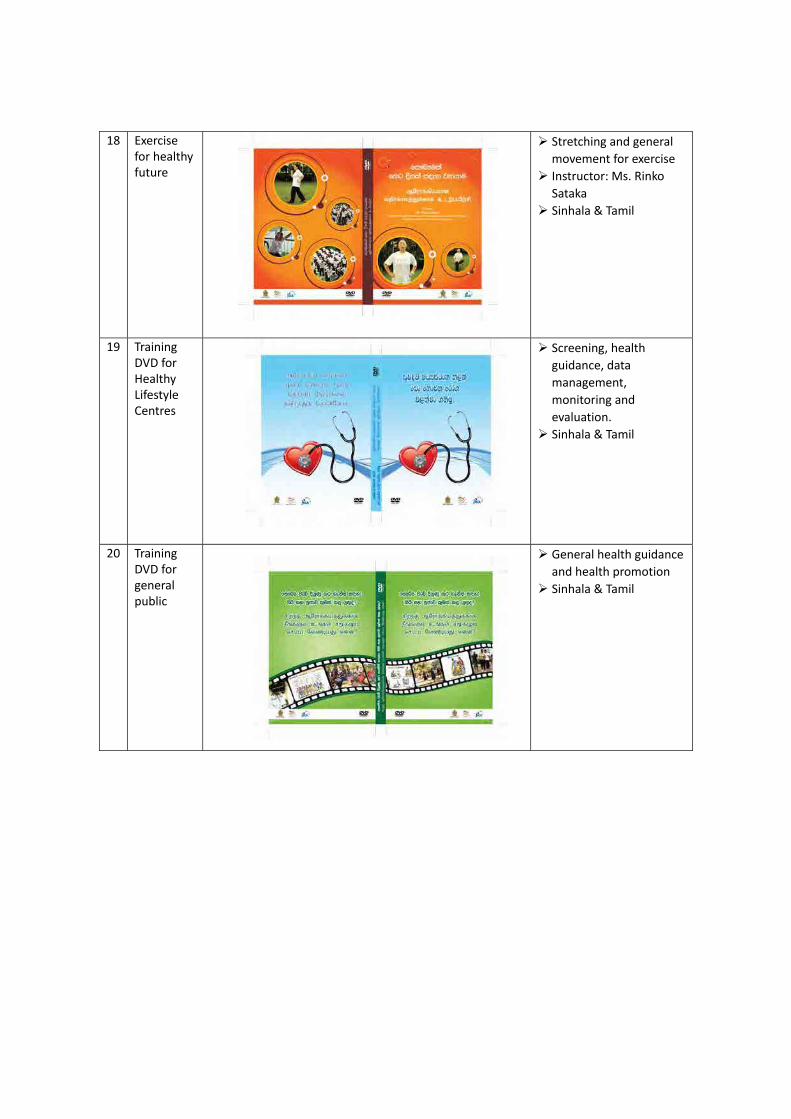
18 Exercise for healthy future
Stretching and general movement for exercise
Instructor: Ms. Rinko
Sataka
Sinhala & Tamil
19 Training DVD for Healthy Lifestyle Centres
Screening, health guidance, data
management,
monitoring and
evaluation.
Sinhala & Tamil
20 Training DVD for general public
General health guidance
and health promotion
Sinhala & Tamil

Annex 7: Cost Analysis Report
Cost Analysis Report NCD Prevention Project
December 2011
Ministry of Health
Japan International Cooperation Agency
Cost Analysis Report
NCD Prevention Project
December 2011
Dr. Anuradhani Kasturiratne
Dr. Lasantha Ranwala
Mr. Takao Sugimoto
i
Table of Contents Table of Contents ······································································································ i
List of Tables ·········································································································· iii
Introduction ············································································································ vi
Report 1 Cost analysis : Third Year of the NCD Prevention Project
1 An outline of the cost analysis process ······································································ 1
2 Study of check-up costs (provisional calculation based on cost accounting) ······················ 1
2.1 Study method ····························································································· 1
2.2 Analysis of check-up costs ············································································· 2
2.3 Details of the check-up process in practice ························································ 2
2.4 Differences in check-up systems in the 2 pilot areas
(Kurunegala and Polonnaruwa Districts) ·························································· 3
2.5 Review of the personnel costs incurred in the check-up process ···························· 5
2.6 Estimation of the check-up system based on the study ········································ 6
2.7 Cost analysis for check-ups ··········································································· 8
2.8 Costs incurred by participants in having the check-up ········································ 12
3 Costs of Illness study ·························································································· 13
3.1 Study method ··························································································· 14
3.2 Costs of Illness incurred by hospitalization ······················································ 14
3.3 Analysis of direct and indirect costs to inpatients ··············································· 18
4 Future Activities ································································································· 19
Report 2: Cost of participation in the health check-up component of the
Non-communicable Disease Prevention Project (NPP) and Cost of hospitalization for selected
non-communicable disease in Kurunegala and Polonnaruwa districts
1 Introduction ............................................................................................................................. 27
1.1 Background .................................................................................................................. 27
1.2 Non-communicable disease Prevention (NPP) Project ............................................... 27
1.3 Justification .................................................................................................................. 28
1.4 Objectives .................................................................................................................... 28
1.5 General Objective: ....................................................................................................... 28
1.6 Specific Objectives: ...................................................................................................... 28

ii
2 Methods .................................................................................................................................. 29
2.1 Study design: ................................................................................................................ 29
2.2 Study setting: ................................................................................................................ 29
2.3 Study period: ................................................................................................................ 29
2.4 Study population: .......................................................................................................... 29
2.5 Sample size: ................................................................................................................. 31
2.6 Sampling: ..................................................................................................................... 32
2.7 Data collection instruments: ......................................................................................... 32
2.8 Data collection: ............................................................................................................. 33
2.9 Data analysis: ............................................................................................................... 33
2.10 Administrative considerations: ................................................................................... 33
2.11 Ethical considerations: ............................................................................................... 33
3 Results .................................................................................................................................... 34
3.1 Cost of participation in the health check-up programme of the NPP Project ............... 34
3.2 Household costs of hospitalization for four major non-communicable diseases
in Sri Lanka ................................................................................................................. 38
3.3 Cost of in-patient care for four major non-communicable diseases
in Sri Lanka ................................................................................................................. 46
1) Cerebro-vascular accidents (CVA) ............................................................................... 47
2) Myocardial infarction ..................................................................................................... 48
3) Ischaemic Heart Disease .............................................................................................. 49
4) Diabetes mellitus .......................................................................................................... 50
4 Discussion ................................................................................................................................ 51
4.1 Cost of participation in the health check-up programme of the NPP Project ............... 51
4.2 Household cost of hospitalization for four major non-communicable diseases
in Sri Lanka ................................................................................................................ 53
4.3 Cost of in-patient care for four major non-communicable diseases
in Sri Lanka ................................................................................................................ 56
1) Cerebro-vascular accident (CVA) ................................................................................. 57
2) Myocardial infarction ..................................................................................................... 58
3) Ischaemic Heart Disease .............................................................................................. 58
4) Diabetes mellitus .......................................................................................................... 59
iii
List of Tables
Report 1 Cost analysis : Third Year of the NCD Prevention Project
Table 1 Details of the check-up processes ................................................................................... 3
Table 2 Personnel in charge of different activities at the two study sites ..................................... 5
Table 3 Personnel cost per check-up/health guidance participant ............................................... 6
Table 4 An average check-up system .......................................................................................... 6
Table 5 Check-up plan and annual results ................................................................................... 7
Table 6 Simulation of annual check-up results based on the averages
determined by the study.................................................................................................. 7
Table 7 Annual total No. of hours spent on check-ups and Health Guidance
by personnel (estimate) .................................................................................................. 8
Table 8 Costs necessary for the implementation of check-ups
(the value unit is Sri Lanka rupee) .................................................................................. 9
Table 9 Simulation 1) .................................................................................................................. 10
Table 10 Simulation 2) ................................................................................................................ 10
Table 11 Time spent on the implementation of check-ups ......................................................... 11
Table 12 Disaggregated cost information relating to implementation of check-ups ................... 12
Table 13 No. of survey subjects ................................................................................................. 12
Table 14 Costs incurred by participants to have a check-up (Rs.) ............................................. 13
Table 15 Income loss for participants as a result of having a check-up (Rs.) ............................ 13
Table 16 No. of BHTs in the target illness-based and hospital-based study .............................. 15
Table 17 Basic cost of hospitalization per internal medicine patient per day
at BH Marawila (for 2009) .......................................................................................... 16
Table 18 Hospitalization cost per Cerebro-vascular accident patient ........................................ 17
Table 19 Hospitalization cost per Myocardial infarction patient ................................................. 17
Table 20 Hospitalization cost per Ischemic heart disease patient .............................................. 18
Table 21 Hospitalization cost per Diabetes mellitus patient ....................................................... 18
Table 22 No. of surveyed patients per hospital .......................................................................... 18
Table 23 Travel cost incurred due to hospitalization (Rs.) ......................................................... 19
Table 24 Travel cost incurred by the patient’s family for hospital visits (Rs.) ............................. 19
Table 25 Impact of hospitalization on household finances (Rs.) ................................................ 19

iv
Report 2 Cost of participation in the health check-up component of the
Non-communicable Disease Prevention Project (NPP) and Cost of hospitalization for selected
non-communicable disease in Kurunegala and Polonnaruwa districts
Table 1 Distribution of participants by MOH area ·························································· 34
Table 2 Distance to the check-up centre by district ························································ 34
Table 3 Age distribution of the participants ·································································· 35
Table 4 Sex distribution of the participants ·································································· 35
Table 5 Distribution of participants by occupational category ··········································· 35
Table 6 Distribution of participants by educational level and district ·································· 36
Table 7 Distribution of participants by monthly family income ·········································· 36
Table 8 Distribution of participants by family size ·························································· 36
Table 9 Distribution of participants by mode of transport used to come to
the check-up centre ···················································································· 37
Table 10 Cost of traveling to the check-up centre ························································· 37
Table 11 Incidental expenses incurred due to participation in the check-up ························· 37
Table 12 Total direct cost of participation in the check-up ··············································· 38
Table 13 Loss of income due to participation in the check-up ·········································· 38
Table 14 Total loss of income to the family due to participation in the check-up ··················· 38
Table 15 Distribution of patients by district and hospital ················································· 38
Table 16 Age distribution of the participants ································································ 39
Table 17 Sex distribution of the participants ································································· 39
Table 18 Distribution of participants by occupational category ········································· 39
Table 19 Distribution of participants by educational level ················································ 40
Table 20 Distribution of participants by monthly family income ········································· 40
Table 21 Distribution of participants by family size ························································ 40
Table 22 Distribution of participants by mode of transport used to come to hospital ·············· 41
Table 23 Distribution of participants by the expected mode of transport to
go back on discharge················································································· 41
Table 24 Travel cost of hospitalization by district ·························································· 41
Table 25 Travel cost of hospitalization by hospital ························································· 42
Table 26 Loss of income and costs due to accompanying the patient to hospital
by district and hospital·············································································· 42
Table 27 Costs incurred by the household for visiting the patient in hospital by
district and hospital ················································································· 42
v
Table 28 Costs incurred by the household for keeping a companion by
district and hospital ················································································· 43
Table 29 Costs incurred by the household for food bought for consumption
of the patient by district and hospital ··························································· 43
Table 30 Cost of medications for the patient by district and hospital ·································· 44
Table 31 Cost of laboratory investigation of the patient by district and hospital ···················· 44
Table 32 Loss of income by the patient’s household by district and hospital ························ 45
Table 33 Total direct household cost of hospitalization by district and hospital ···················· 45
Table 34 Total household cost (direct and indirect) of hospitalization
by district and hospital·············································································· 46
Table 35 Distribution of patients by hospital and disease ················································ 46
Table 36 Median duration of stay (interquartile range) by hospital and disease ···················· 47
Table 37 Median cost of different elements of in-patient care for
Cerebro-vascular accident ········································································ 47
Table 38 Accommodation cost of Cerebro-vascular accident by hospital ···························· 48
Table 39 Total cost of in-patient care for Cerebro-vascular accident by hospital ·················· 48
Table 40 Median cost of different elements of in-patient care for
Myocardial infarction ················································································ 48
Table 41 Accommodation cost of Myocardial infarction by hospital ··································· 49
Table 42 Total cost of in-patient care for Myocardial infarction by hospital ·························· 49
Table 43 Median cost of different elements of in-patient care for
ischaemic heart disease ··········································································· 49
Table 44 Accommodation cost of ischaemic heart disease by hospital ······························ 50
Table 45 Total cost of in-patient care for ischaemic heart disease by hospital ····················· 50
Table 46 Median cost of different elements of in-patient care for Diabetes mellitus ··············· 50
Table 47 Accommodation cost of Diabetes mellitus by hospital ········································ 51
Table 48 Total cost of in-patient care for Diabetes mellitus by hospital ······························ 51
vi
Introduction
Background
The Ministry of Health (MoH) of Sri Lanka initiated the “Project on Health Promotion and
Preventive Measures of Chronic NCDs” (or NCD Prevention Project or NPP) as one of its major
undertakings to address the growing health and economic burden of chronic non-communicable
diseases. The NPP is one of the Health Master Plan priorities and a follow up to the
“Evidence-Based Management (EBM) Study” that was supported by the Japan International
Cooperation Agency (JICA). Based on a request from the government of Sri Lanka, JICA
dispatched the preparatory mission in December 2007, and the Record of Discussion (R/D) was
signed on the 27th of February 2008 between Mrs. Noriko Suzuki, Resident Representative of
JICA Sri Lanka Office and Dr. Athula Kahandaliyanage, Secretary of the Ministry of Health. The
five-year Technical Assistant Project officially commenced on May 12, 2008 with the arrival of
Japanese experts.
Project Purpose & Overall Goals
The Purpose of this five-year project (2008 – 2013) is to develop “effective and efficient
implementation models to prevent and control NCDs (DM, Hypertension, and
hypercholesterolemia)”. The models developed by NPP are designed to initiate appropriate
deployment of human resources and health infrastructure and thereby contribute to island-wide
implementation in the future.
Outputs
With the following four outputs, the NPP is expected to achieve the Project Purpose:
Output 1: Risk factors of cardiovascular diseases are identified in the Ragama Health Study
based on the evidence.
Output 2: Intervention guidelines and manuals are formulated based on available evidence and
related literatures.
Output 3: Institutional and technical feasibilities of the consolidated intervention guidelines are
assessed for development of the NCD prevention models in pilot areas.
Output 4: Expansion plan for health check-up/ guidance and health promotion for prevention of
cardiovascular diseases is finalized for island wide implementation.
Cost Analysis of Third Year Activities
The cost analysis is a designated activity to achieve Output 2 of the project.

vii
The costs required for the implementation of medical check-ups, the number of health and
medical personnel required to carry out these check-ups and the costs involved in training the
personnel, were calculated for the third year, based on the past results of the project. The
check-ups were conducted in two districts of the project’s target area: the North Central Province
and North Western Province over the last two years. The objective of these activities was to
enable us to tentatively calculate the financial and human resources necessary for broader
scaled-up implementation
Systemic and household Cost analysis
Following the advice of Prof. Amala de Silva (Department of Economics, University of Colombo),
we requested Dr. Lasantha Ranwala (a student at the Postgraduate Institute of Medicine) to
determine the costs required for check-ups, and Dr. Anuradhani Kasturiratne (a lecturer in the
Department of Public Health, University of Kelaniya) to determine the costs of illness and indirect
costs related to check-ups, as the components of costing NCD prevention. Both doctors were
qualified to carry out this study, as they had previously been involved in hospital

viii
department-based and illness-based cost accounting during the Development Study PhaseⅡ- on
Evidence-based Management for Health System Development in Sri Lanka “Category 2:
Improvement of Hospital Finance with Cost Accounting and Development of Information System”
- implemented from October 2005 to October 2007.
I would like to thank Dr. R.W.Jayantha, DDG/Planning, and Dr.Thalatha Liyanage, Director/NCD
for supporting our study. And special thanks to all authors and research assistants for their serious
manner to research work.
Takao Sugimoto
Person in Charge of Cost Analysis for NPP

2
Report 1
Cost Analysis
Third Year of the NCD Prevention Project
Lasantha Ranwala
Takao Sugimoto
A study conducted for Japan International Cooperation Agency
2010
1
1 An outline of the cost analysis process
The cost analysis process can generally be divided into two categories of costs: costs required for
the check-ups, and costs of illness.
We carried out the study of costing the check-ups separately for the two pilot districts (Kurunegala
and Polonnaruwa Districts), as they had introduced different check-up systems. Two different
types of cost were collated: direct costs, such as costs of personnel, supplies and equipment
required for the actual implementation of check-ups, and indirect costs, borne in training the
human resources involved in the check-ups, and for the establishment of a check-up program.
Also, assuming that the costs of illness will be used for a cost-benefit analysis at a later stage, we
tabulated the costs, dividing them into direct costs (hospitalization, medical personnel, nursing
personnel, treatment, tests and drugs) and indirect costs (cost of travelling to the hospital,
medication costs borne by patients, cost of meals, and loss of income).
Calculating costs of illness is important in this study because if patients are not screened and
early intervention undertaken patients will end up with episodes of hospitalization that are
expensive to both the health system and households.
Such cost accounting exercises, incorporating costing studies of specific diseases, could
contribute to quantitative, evidence based decision making. As these special cost studies will be
based on speculative accounting, the results will never be completely accurate. The data and
background information available for the calculation of costs or for utilization in the accounting
process are however fundamental. At a practical level, the key to correct decision-making
depends on how precisely appropriate information regarding activities can be gathered.
2 Study of check-up costs (provisional calculation based on cost accounting)
2.1 Study method
【Check-ups】
The pilot implementation of check-ups started in July 2009. For this analysis, we utilized data from
the most recent time period after the activity went on line: November 2009 to October 2010. For
the analysis, we were able to obtain key data regarding the check-ups and health guidance,
including how long they took and who implemented them, using the “NCD Check-up Observation
Report (Annex 1) prepared by a Project Officer (PO) attending the check-up session. Based on
this data, check-up costs were calculated which reflected the actual purchase prices of equipment
2
and supplies. As POs either did not attend or prepare reports for some check-up sessions, we
could only analyse the reports of around half the check-up sessions implemented during the
relevant period (111 sessions in Kurunegala and 46 sessions in Polonnaruwa).
【Training】
We calculated the costs incurred in the five training sessions targeted at check-up staff held prior
to the check-up activity.
【Other costs】
We surveyed past records to obtain stationery costs and the costs borne in printing the check-up
manual and the assessment table.
【Indirect costs】
We estimated the costs incurred by check-up participants (travel cost to and from the check-up
site, eating-out cost, income lost by participating in a check-up, and other costs incurred due to
the check-up). As these data can only be obtained by interviewing the check-up participants, we
employed research assistants and proceeded with a survey of 400 people in each district; a total
of 800 people.
2.2 Analysis of check-up costs
There are two methods of cost analysis: one is to divide costs into direct costs and indirect costs;
the other is to divide costs into fixed costs and variable costs. In this survey, we tried to calculate
not only the costs directly related to check-ups, but also the costs indirectly borne as a result of
conducting the check-ups. Moreover, as it was necessary to perform an analysis to determine
both the budget and manpower necessary to expand this project to the national level, we decided
to separate the costs into two types: fixed costs used for the implementation of check-ups
irrespective of participant numbers, and variable costs that are directly linked to individual
check-up participants. Fixed costs included costs such as the expenditure on the building,
furnishings and personnel, Variable costs estimated per participant coverage expenditure on
medical materials, consumables and stationary. However, while we consider personnel costs to
be a fixed cost, they may also be considered a variable cost. The study involves simulations
formulated through recalculating costs based on the study findings regarding the actual time
spent on screening individual participants.
2.3 Details of the check-up process in practice
Details relating to the screening process, as observed at the two sites, are given in Table 1. The
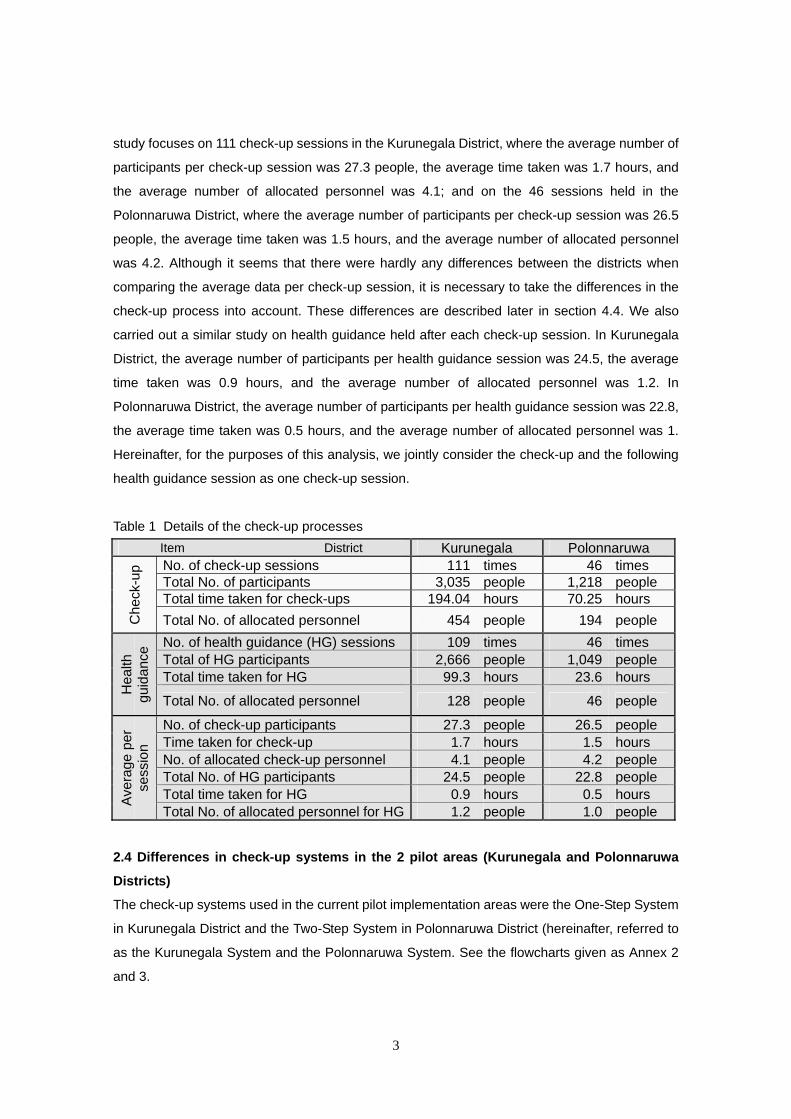
3
study focuses on 111 check-up sessions in the Kurunegala District, where the average number of
participants per check-up session was 27.3 people, the average time taken was 1.7 hours, and
the average number of allocated personnel was 4.1; and on the 46 sessions held in the
Polonnaruwa District, where the average number of participants per check-up session was 26.5
people, the average time taken was 1.5 hours, and the average number of allocated personnel
was 4.2. Although it seems that there were hardly any differences between the districts when
comparing the average data per check-up session, it is necessary to take the differences in the
check-up process into account. These differences are described later in section 4.4. We also
carried out a similar study on health guidance held after each check-up session. In Kurunegala
District, the average number of participants per health guidance session was 24.5, the average
time taken was 0.9 hours, and the average number of allocated personnel was 1.2. In
Polonnaruwa District, the average number of participants per health guidance session was 22.8,
the average time taken was 0.5 hours, and the average number of allocated personnel was 1.
Hereinafter, for the purposes of this analysis, we jointly consider the check-up and the following
health guidance session as one check-up session.
Table 1 Details of the check-up processes
2.4 Differences in check-up systems in the 2 pilot areas (Kurunegala and Polonnaruwa
Districts)
The check-up systems used in the current pilot implementation areas were the One-Step System
in Kurunegala District and the Two-Step System in Polonnaruwa District (hereinafter, referred to
as the Kurunegala System and the Polonnaruwa System. See the flowcharts given as Annex 2
and 3.
Item District Kurunegala Polonnaruwa
Che
ck-u
p No. of check-up sessions 111 times 46 times
Total No. of participants 3,035 people 1,218 people Total time taken for check-ups 194.04 hours 70.25 hours
Total No. of allocated personnel 454 people 194 people
Hea
lth
guid
ance
No. of health guidance (HG) sessions 109 times 46 times Total of HG participants 2,666 people 1,049 people Total time taken for HG 99.3 hours 23.6 hours
Total No. of allocated personnel 128 people 46 people
Ave
rage
per
se
ssio
n
No. of check-up participants 27.3 people 26.5 people Time taken for check-up 1.7 hours 1.5 hours No. of allocated check-up personnel 4.1 people 4.2 people Total No. of HG participants 24.5 people 22.8 people Total time taken for HG 0.9 hours 0.5 hours Total No. of allocated personnel for HG 1.2 people 1.0 people

4
In both systems, check-up participants were aged between 40 and 75, with no previous history of
Diabetes, hypertension, Ischemic heart disease or stroke. However, the screening processes
adopted in the Kurunegala System and Polonnaruwa System were different in some ways. Firstly,
in the Kurunegala System, medical personnel such as doctors and nurses implemented the
check-ups mainly at medical facilities such as Base Hospitals and Divisional Hospitals. In the
Polonnaruwa System, Public Health Inspectors (PHIs) and Public Health Midwives (PHMs)
implemented the check-ups mainly at primary care facilities such as Health Centers and Central
Dispensaries. In other words, in the Kurunegala System the check-up participants had to travel to
the facilities to receive the check-up, whereas in the Polonnaruwa System the check-up
implementers visited the areas where the check-up participants lived.
Both check-up implementation systems were established by effectively utilizing the existing
facilities, equipment, and personnel. As these new NCD prevention measures effectively utilize
the existing resources, it is highly feasible that a similar strategy can be promoted at national-level
on the completion of this pilot project. In cost analysis, the method of calculating fixed costs such
as the costs of the facility, equipment and personnel have a great bearing on the outcomes. Use
of existing facilities, equipment and personnel would minimize the fixed costs incurred by the
check-up process.
Secondly, there were 5 check-up items implemented in both systems: ① Blood pressure
measurement, ② BMI measurement, ③ Smoking history, ④ Lifestyle-related disease history, and
⑤ Blood glucose measurement using a Glucometer. In the Kurunegala System, all the items were
examined in a single event. However, in the Polonnaruwa System, Items ①~④ were examined
locally at a primary care facility in each area, and only the participants who were determined to be
in need of further testing had blood pressure measurement, a blood glucose measurement and a
family history interview at a clinic where such tests are conducted on a regular basis. This is the
reason the Kurunegala System is referred to as a “One-Step System” and the Polonnaruwa
System the “Two-Step System”.
This cost analysis only covers group check-ups in the study, not the clinic tests in the case of the
Polonnaruwa System (i.e., the second step of the Two-Step System), as it is difficult to calculate
the cost of just a few check-up participants seeking regular services in existing operating clinics.
However as the direct cost of the blood glucose test using a glucometer can be calculated per
participant, we included this cost in the analysis.
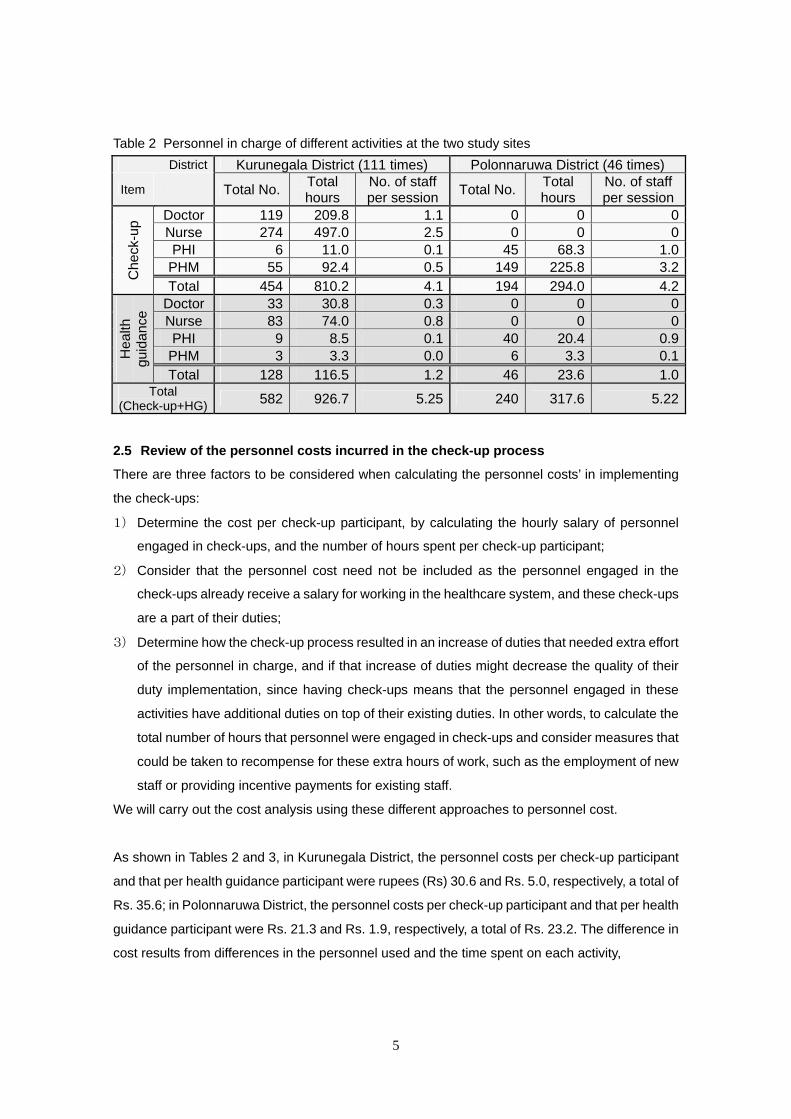
5
Table 2 Personnel in charge of different activities at the two study sites
District Kurunegala District (111 times) Polonnaruwa District (46 times)
Item Total No. Total hours
No. of staff per session
Total No.Total hours
No. of staff per session
Che
ck-u
p Doctor 119 209.8 1.1 0 0 0
Nurse 274 497.0 2.5 0 0 0PHI 6 11.0 0.1 45 68.3 1.0
PHM 55 92.4 0.5 149 225.8 3.2 Total 454 810.2 4.1 194 294.0 4.2
Hea
lth
guid
ance
Doctor 33 30.8 0.3 0 0 0Nurse 83 74.0 0.8 0 0 0PHI 9 8.5 0.1 40 20.4 0.9
PHM 3 3.3 0.0 6 3.3 0.1 Total 128 116.5 1.2 46 23.6 1.0
Total (Check-up+HG) 582 926.7 5.25 240 317.6 5.22
2.5 Review of the personnel costs incurred in the check-up process
There are three factors to be considered when calculating the personnel costs’ in implementing
the check-ups:
1) Determine the cost per check-up participant, by calculating the hourly salary of personnel
engaged in check-ups, and the number of hours spent per check-up participant;
2) Consider that the personnel cost need not be included as the personnel engaged in the
check-ups already receive a salary for working in the healthcare system, and these check-ups
are a part of their duties;
3) Determine how the check-up process resulted in an increase of duties that needed extra effort
of the personnel in charge, and if that increase of duties might decrease the quality of their
duty implementation, since having check-ups means that the personnel engaged in these
activities have additional duties on top of their existing duties. In other words, to calculate the
total number of hours that personnel were engaged in check-ups and consider measures that
could be taken to recompense for these extra hours of work, such as the employment of new
staff or providing incentive payments for existing staff.
We will carry out the cost analysis using these different approaches to personnel cost.
As shown in Tables 2 and 3, in Kurunegala District, the personnel costs per check-up participant
and that per health guidance participant were rupees (Rs) 30.6 and Rs. 5.0, respectively, a total of
Rs. 35.6; in Polonnaruwa District, the personnel costs per check-up participant and that per health
guidance participant were Rs. 21.3 and Rs. 1.9, respectively, a total of Rs. 23.2. The difference in
cost results from differences in the personnel used and the time spent on each activity,
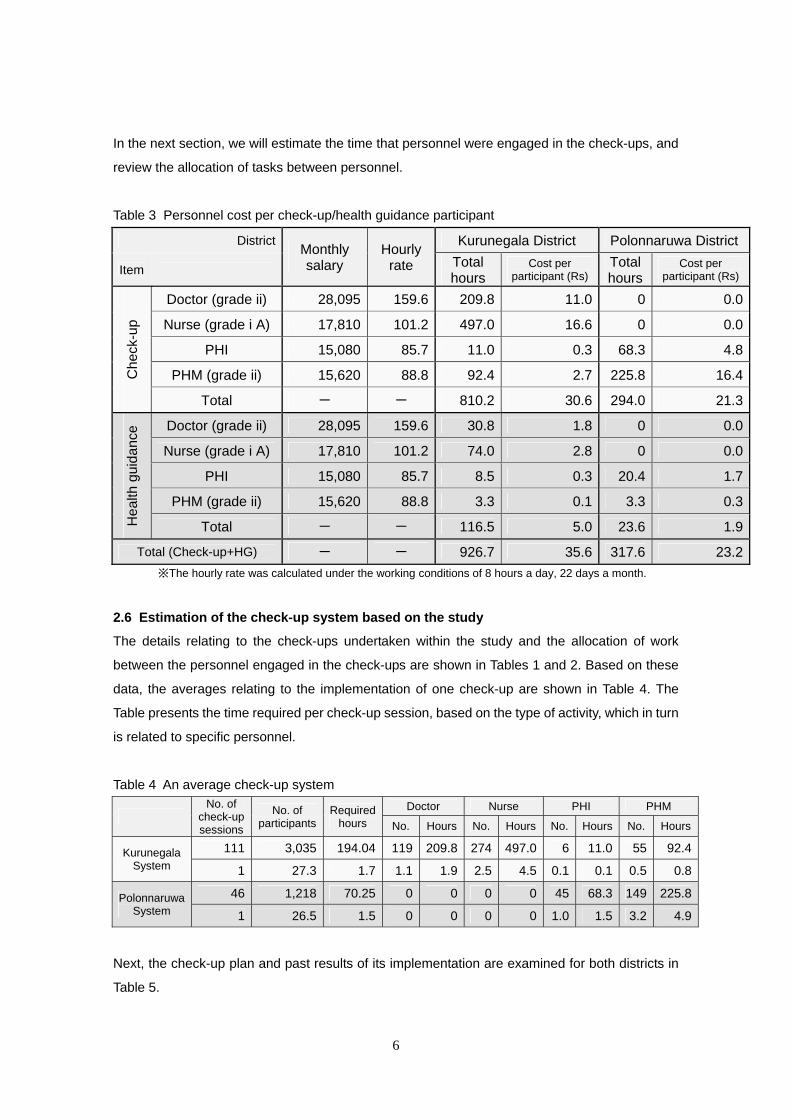
6
In the next section, we will estimate the time that personnel were engaged in the check-ups, and
review the allocation of tasks between personnel.
Table 3 Personnel cost per check-up/health guidance participant
District Monthly salary
Hourly rate
Kurunegala District Polonnaruwa District
Item Total hours
Cost per participant (Rs)
Total hours
Cost per participant (Rs)
Che
ck-u
p
Doctor (grade ii) 28,095 159.6 209.8 11.0 0 0.0
Nurse (grade i A) 17,810 101.2 497.0 16.6 0 0.0
PHI 15,080 85.7 11.0 0.3 68.3 4.8
PHM (grade ii) 15,620 88.8 92.4 2.7 225.8 16.4
Total - - 810.2 30.6 294.0 21.3
Hea
lth g
uid
anc
e Doctor (grade ii) 28,095 159.6 30.8 1.8 0 0.0
Nurse (grade i A) 17,810 101.2 74.0 2.8 0 0.0
PHI 15,080 85.7 8.5 0.3 20.4 1.7
PHM (grade ii) 15,620 88.8 3.3 0.1 3.3 0.3
Total - - 116.5 5.0 23.6 1.9
Total (Check-up+HG) - - 926.7 35.6 317.6 23.2
※The hourly rate was calculated under the working conditions of 8 hours a day, 22 days a month.
2.6 Estimation of the check-up system based on the study
The details relating to the check-ups undertaken within the study and the allocation of work
between the personnel engaged in the check-ups are shown in Tables 1 and 2. Based on these
data, the averages relating to the implementation of one check-up are shown in Table 4. The
Table presents the time required per check-up session, based on the type of activity, which in turn
is related to specific personnel.
Table 4 An average check-up system
No. of
check-up sessions
No. of participants
Required hours
Doctor Nurse PHI PHM
No. Hours No. Hours No. Hours No. Hours
Kurunegala System
111 3,035 194.04 119 209.8 274 497.0 6 11.0 55 92.4
1 27.3 1.7 1.1 1.9 2.5 4.5 0.1 0.1 0.5 0.8
Polonnaruwa System
46 1,218 70.25 0 0 0 0 45 68.3 149 225.8
1 26.5 1.5 0 0 0 0 1.0 1.5 3.2 4.9
Next, the check-up plan and past results of its implementation are examined for both districts in
Table 5.

7
Table 5 Check-up plan and annual results
This pilot project was established as a
5-year check-up implementation plan,
targeting the population aged between
40 and 75 with no past history of
NCDs.
The plan was implemented in July
2009. Table 5 shows the records for
one year from October 2009 to
September 2010. As can be seen, the project has been implemented according to plan in
Polonnaruwa District, while in Kurunegala District the project has been implemented much faster
than planned. If check-ups are continuously conducted in Kurunegala District at the present pace,
the target population will all be covered approximately within 3 and a half years instead of the
planned 5 years. We estimate the costs for the check-up system based on the average check-up
system. The check-up plan as implemented in both pilot districts and the implementation situation
are shown in Tables 4 and 5.
Table 6 Simulation of annual check-up results based on the averages determined by the study
Kurunegala System
No.of
check-ups No. of
participantsRequired
hours Doctor Nurse
No. Hours No. Hours
Average of study 1 27.3 1.7 1.1 1.9 3.0 5.4 Annual results 227 6,674 385.9 250 429 681 1,226
Polonnaruwa System
No.of
check-ups No. of
participantsRequired
hours PHI PHM
No. Hours No. Hours
Average of study 1 26.5 1.5 1.0 1.5 3.2 4.9 Annual results 91 2,351 136.5 91 135 291 447
In the Kurunegala System, PHIs and PHMs were included as check-up implementers, but only
accounted for 0.6 personnel (see Table 4) so they were grouped with the nurses in this simulation
exercise.
In the Kurunegala System, a total of 429 hours by doctors and 1,226 hours by nurses were spent
implementing a total of 227 check-up sessions in one year. In the Polonnaruwa System, a total of
135 hours by PHIs and 447 hours by PHMs were spent implementing a total of 91 check-up
sessions in one year. Furthermore, the time spent on Health Guidance implemented after the
check-up is shown in Table 7. As described previously, one of the key points in cost analysis is
how we take this time spent into account in the form of personnel costs.
Kurunegala District
Polonnaruwa District
Pla
n
Population aged 40-75 35,983 16,849Check-up target
population 24,173 11,596Estimated No. of annual
check-up participants 4,835 2,319
Res
ults
No. of annual check-ups 227 91
No. of annual check-up participants 6,674 2,351

8
Table 7 Annual total No. of hours spent on check-ups and Health Guidance by personnel
(estimate)
District Type of job Check-up HG Total
Kurunegala Doctor 429 64 493Nurse 1,226 175 1,401
Polonnaruwa PHI 135 40 175PHM 447 6 453
2.7 Cost analysis for check-ups
As we utilized the existing buildings and furnishings for check-ups, and did not purchase anything
new, we do not need to consider their costs. The same approach as applied in this pilot project,
will be adopted in other areas of the country in the future.
All the devices utilized during the project were considered to be variable costs, and the costs per
check-up participant were calculated on the basis of estimated service life (times used). In the
Kurunegala System, blood pressure was often measured using a mercury manometer which the
doctor was already using at the medical facility, but the cost was calculated as that of a digital
sphygmomanometer in this analysis (as this was the chosen method for this project).
We considered that the blood glucose test was conducted on all participants in the Kurunegala
System and 20% of the number of first step participants in the Polonnaruwa System. This too was
calculated as a variable cost.
The initial costs listed in Table 8 are the implementation costs incurred in starting up the project.
As the materials produced for this project can be utilized in other areas and over time, only
printing cost will have to be borne in implementing the check-up nationally in the future. The
number of training sessions for check-up implementers was 3 sessions in Polonnaruwa and twice
in Kurunegala. The extra session in Polonnaruwa was due holding a training session for Step 2.
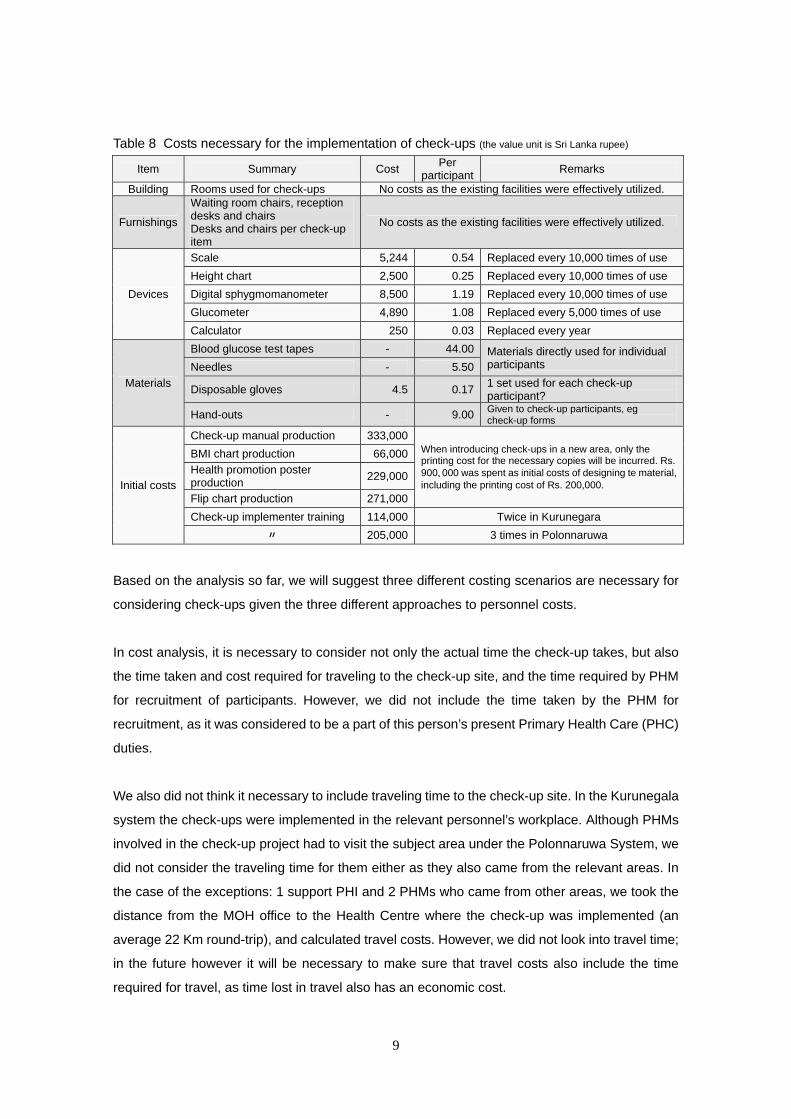
9
Table 8 Costs necessary for the implementation of check-ups (the value unit is Sri Lanka rupee)
Item Summary Cost Per
participantRemarks
Building Rooms used for check-ups No costs as the existing facilities were effectively utilized.
Furnishings
Waiting room chairs, reception desks and chairs Desks and chairs per check-up item
No costs as the existing facilities were effectively utilized.
Devices
Scale 5,244 0.54 Replaced every 10,000 times of use
Height chart 2,500 0.25 Replaced every 10,000 times of use
Digital sphygmomanometer 8,500 1.19 Replaced every 10,000 times of use
Glucometer 4,890 1.08 Replaced every 5,000 times of use
Calculator 250 0.03 Replaced every year
Materials
Blood glucose test tapes - 44.00 Materials directly used for individual participants Needles - 5.50
Disposable gloves 4.5 0.171 set used for each check-up participant?
Hand-outs - 9.00 Given to check-up participants, eg check-up forms
Initial costs
Check-up manual production 333,000When introducing check-ups in a new area, only the printing cost for the necessary copies will be incurred. Rs. 900、000 was spent as initial costs of designing te material, including the printing cost of Rs. 200,000.
BMI chart production 66,000
Health promotion poster production
229,000
Flip chart production 271,000
Check-up implementer training 114,000 Twice in Kurunegara
〃 205,000 3 times in Polonnaruwa
Based on the analysis so far, we will suggest three different costing scenarios are necessary for
considering check-ups given the three different approaches to personnel costs.
In cost analysis, it is necessary to consider not only the actual time the check-up takes, but also
the time taken and cost required for traveling to the check-up site, and the time required by PHM
for recruitment of participants. However, we did not include the time taken by the PHM for
recruitment, as it was considered to be a part of this person’s present Primary Health Care (PHC)
duties.
We also did not think it necessary to include traveling time to the check-up site. In the Kurunegala
system the check-ups were implemented in the relevant personnel’s workplace. Although PHMs
involved in the check-up project had to visit the subject area under the Polonnaruwa System, we
did not consider the traveling time for them either as they also came from the relevant areas. In
the case of the exceptions: 1 support PHI and 2 PHMs who came from other areas, we took the
distance from the MOH office to the Health Centre where the check-up was implemented (an
average 22 Km round-trip), and calculated travel costs. However, we did not look into travel time;
in the future however it will be necessary to make sure that travel costs also include the time
required for travel, as time lost in travel also has an economic cost.

10
Simulation 1) Calculation of staff salaries per check-up participant
Although all this money
was not actually spent
during the pilot
implementation, we
calculated the allocated
cost per check-up
participant by converting
the personnel cost into an
hourly rate. Also, the travel
cost by Polonnaruwa
personnel was calculated
just for this exercise. In the case of Kurunegala District, Rs. 2,667,000 is necessary for
check-ups for the target population of 24,173 people. In the case of Polonnaruwa District, Rs.
1,208,000 is necessary for the target population of 11,596 people. Based on these results,
when simulating the check-up costs for other districts, initial costs need to be added to
variable costs per participant and multiplied by the target population. For instance, the cost
necessary to implement check-ups for a target population of 20,000 people using the
Kurunegala System is Rs. 97.4 × 20,000 people + Rs. 314,000 = Rs.2,262,000
Simulation 2) Exclusion of costs which do not actually increase spending, such as staff salaries,
from the total
With the assumption that check-ups can be implemented as a new project utilizing the
existing manpower, only the costs that were actually spent on the pilot implementation of
check-ups need to be estimated.
In Kurunegala District, Rs.
1,807,000 is necessary for
check-ups for the target
population of 24,173 people, and
in Polonnaruwa District, Rs.
940,000 is necessary for the
target population of 11,596
people.
In this case, the cost necessary to implement check-ups of a target population of 20,000
people using the Kurunegala System is Rs. 61.8 × 20,000 people + Rs. 314,000, for a total of
Table 9 Simulation 1) (Unit: Sri Lanka rupee)
Item Kurunegala
District Polonnaruwa
District
Va
riab
le c
ost
s
Total material cost (C×A) 1,492,924 127,672
Total personnel cost (D×A) 860,559 269,027
Step 2 (E×B) - 117,759
Traveling cost - 289,080
Total 2,353,483 803,538
Average per participant 98 70
Initi
al
cost
s Training cost 114,000 205,000
Cost for preparation of material
200,000 200,000
Total 314,000 405,000
Total cost for check-up implementation 2,667,483 1,208,538
Table 10 Simulation 2) (Unit: Sri Lanka rupee)
Item Kurunegala
District Polonnaruwa
District
Va
riab
le c
ost
s
Total variable cost (C×A) 1,492,924 127,672
Step 2 (E×B) - 117,759
Traveling cost - 289,080
Total 1,492,924 534,511
An average per participant 62 47
Initi
al
cost
s
Training cost 114,000 205,000
Fabrication cost 200,000 200,000
Total 314,000 405,000
Total cost for check-up implementation
1,806,986 939,511
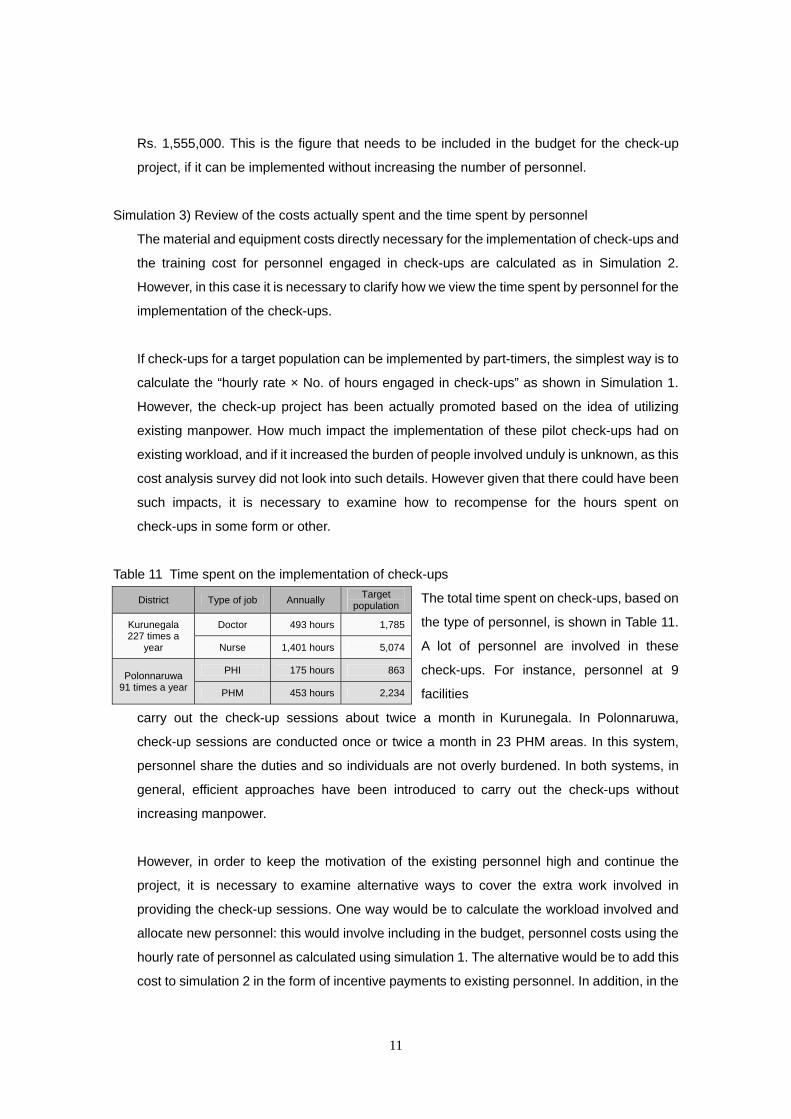
11
Rs. 1,555,000. This is the figure that needs to be included in the budget for the check-up
project, if it can be implemented without increasing the number of personnel.
Simulation 3) Review of the costs actually spent and the time spent by personnel
The material and equipment costs directly necessary for the implementation of check-ups and
the training cost for personnel engaged in check-ups are calculated as in Simulation 2.
However, in this case it is necessary to clarify how we view the time spent by personnel for the
implementation of the check-ups.
If check-ups for a target population can be implemented by part-timers, the simplest way is to
calculate the “hourly rate × No. of hours engaged in check-ups” as shown in Simulation 1.
However, the check-up project has been actually promoted based on the idea of utilizing
existing manpower. How much impact the implementation of these pilot check-ups had on
existing workload, and if it increased the burden of people involved unduly is unknown, as this
cost analysis survey did not look into such details. However given that there could have been
such impacts, it is necessary to examine how to recompense for the hours spent on
check-ups in some form or other.
Table 11 Time spent on the implementation of check-ups
The total time spent on check-ups, based on
the type of personnel, is shown in Table 11.
A lot of personnel are involved in these
check-ups. For instance, personnel at 9
facilities
carry out the check-up sessions about twice a month in Kurunegala. In Polonnaruwa,
check-up sessions are conducted once or twice a month in 23 PHM areas. In this system,
personnel share the duties and so individuals are not overly burdened. In both systems, in
general, efficient approaches have been introduced to carry out the check-ups without
increasing manpower.
However, in order to keep the motivation of the existing personnel high and continue the
project, it is necessary to examine alternative ways to cover the extra work involved in
providing the check-up sessions. One way would be to calculate the workload involved and
allocate new personnel: this would involve including in the budget, personnel costs using the
hourly rate of personnel as calculated using simulation 1. The alternative would be to add this
cost to simulation 2 in the form of incentive payments to existing personnel. In addition, in the
District Type of job Annually Target
population
Kurunegala 227 times a
year
Doctor 493 hours 1,785
Nurse 1,401 hours 5,074
Polonnaruwa 91 times a year
PHI 175 hours 863
PHM 453 hours 2,234

12
case of the PHMs in Polonnaruwa the travel costs would also need to be included in the
budget.
Table 12 Disaggregated cost information relating to implementation of check-ups
Table 12 provides disaggregated
costing data relating to the
check-ups as determined in this
study as such information could be
utilized for various simulations and
cost-benefit exercises in the future.
2.8 Costs incurred by participants in having the check-up
【Survey method】
In order to figure out the costs incurred by check-up participants, a survey was conducted for 400
participants each, a total of 800 participants in both districts. The surveyed areas were
Narammala and Alawwa in Kurunegala District and Medirigiriya in the Polonnaruwa District and
the numbers of subjects surveyed in each area are shown in Table 13.
Table 13 No. of survey subjects
The questionnaire included issues such as age,
gender, occupation, highest level of education
achieved, family income, the number of family
members living together, the method and cost of
traveling to and from the check-up site, the cost
of lunch incurred by attending the check-up, and any income lost by the participant or the family
due to the check-up.
【Preliminary survey results】
We are presently carrying out a detailed analysis of these survey results. Therefore, in this report
Item Kurunegala District Polonnaruwa District
A Check-up target population
24,173 People 11,596 People
B Step 2 subjects - 2,319 People
C Variable costs per participant
61.76 Rs 11.01 Rs
D Personnel cost per participant
35.6 Rs 23.2 Rs
E Blood glucose (Step 2)
- 50.78 Rs
F Traveling cost per session
- 660 Rs.
G Training cost 114,000 Rs 205,000 Rs
H Fabrication cost 200,000 Rs 200,000 Rs
I No. of doctors 1,785 Hours
J No. of hours spent by nurses
5,698 Hours
K PHI hours 863 Hours
L PHM hours 2,234 Hours
MOH area No. of survey subjects
Ratio
Narammala 250 people 31.2% Alawwa 150 people 18.8% Medirigiriya 400 people 50.0%
Total 800 people 100.0%

13
we will provide only the preliminary results here, such as the types and amounts of costs incurred
by check-up participants.
Table 14 Costs incurred by participants to have a check-up (Rs.)
The costs directly incurred by
participants in having a check-up are
shown in Table 14. The main cost
was the travel cost between home
and the check-up implementation facility. The costs also included the cost of lunch as they usually
eat lunch at home but had to eat out in order to participate in the check-up. There were sizeable
differences in the findings between the districts, such as the number of people who had to pay
such costs (Kurunegala 329 people (329/400; 82%), Polonnaruwa 92 people (92/400; 23%), and
the amount of costs incurred (Polonnaruwa Rs. 40 and double that in Kurunegala (Rs. 84). The
reason for this difference in costs is the difference in systems: Check-up participants had to travel
to major health facilities in the Kurunegala System, but check-up implementers visited and
conducted check-ups in the area where participants lived in the Polonnaruwa System.
Table 15 Income loss for participants as a result of having a check-up (Rs.)
Table 15 shows costs relating to
participants who had to take a day off
for the check-up. In most cases, the
loss of income was for participants
themselves, but the data also includes income losses in the case of accompanying family
members – if this occurred. As the target areas in both districts have a high ratio of farmers, and
approx. 70% of the study subjects were women, the relevant number was only 65 people
(65/400;16%) in Kurunegara and 15 people (15/400;4%) in the Polonnaruwa District.
The data relating to the costs incurred by the health system in implementing the check-up
systems and the costs borne by the participants in the check-ups in accessing such a service in
the two districts are presented above. This cost information will be utilized in carrying out more
detailed analyses below.
3 Costs of Illness study
Calculating costs of illness is important in this study because if patients are not screened and
early intervention undertaken patients will end up with episodes of hospitalization that are
District Median Interquartile
range
Kurunegala (n=329) 84.00 30.00-130.00
Polonnaruwa (n=92) 40.00 23.75-50.00
District Median Interquartile
range
Kurunegala (n=65) 325.00 150.0-450.0
Polonnaruwa (n=15) 250.00 200.0-825.0

14
expensive to both health system and households.
3.1 Study method
【Target diseases within the study】
As originally stated, the NCD Prevention Project Goal is “To establish an effective and efficient
implementation strategy for the prevention of Non-Communicable Diseases (Diabetes,
hypertension, Ischemic heart disease, stroke and dyslipidemia). The study targeted 4 types of
illness: ① Cerebro-vascular accident ② Myocardial infarction ③ Ischemic heart disease and ④
Diabetes mellitus. Hospitalization costs resulting from these types of illness were calculated in
this study.
【Direct costs】
The target hospitals were Kurunegala Teaching Hospital (TH Kurunegala) (1535 beds) and the
Dambadeniya Base Hospital B (BH Dambadeniya) (169 beds) in the Kurunegala District and the
Polonnaruwa General Hospital (GH Polonnaruwa) (603 beds) and the Medirigiliya Base Hospital
B (BH Medirigiliya) (191 beds) in the Polonnaruwa District. We analysed 30 Bed Head Tickets
(BHT - patient medical records) from each district and 60 for each illness to calculate the
hospitalization cost. As step-down cost accounting (see Annex 4) had already been introduced in
two hospitals in the Northwestern Province, TH Kurunegala and BH Marawila and monthly data
were available in tabulated form for these hospitals, we decided to utilize this cost information as
proxies in calculating basic hospitalization costs (accommodation costs) and for cost of diagnostic
testing, for the four hospitals in our sample.
【Direct and Indirect costs to patients】
We estimated the direct costs to patients such as travel cost and the indirect cost due to loss of
earnings due to hospitalization. These costs were calculated based on the distance between
home and the medical facility, unofficial hours spent on nursing care, and the duration of days-off
work. As such data can only be obtained by interviewing patients, the 243 interviews (TH
Kurunegala 85, BH Dambadeniya 37, GH Polonnaruwa 96, BH Mwedirigiriya 25) were carried out
by research assistants. See Table 20
3.2 Costs of Illness incurred by hospitalization
【BHT analysis】
The number of BHTs studied at the four target hospitals is shown in Table 16. Initially, we planned
to analyse 20 BHTs from each of the tertiary care institutions (the Teaching Hospital and the
General Hospital) and 10 BHTs from each of the secondary care institutions (the Base Hospitals).
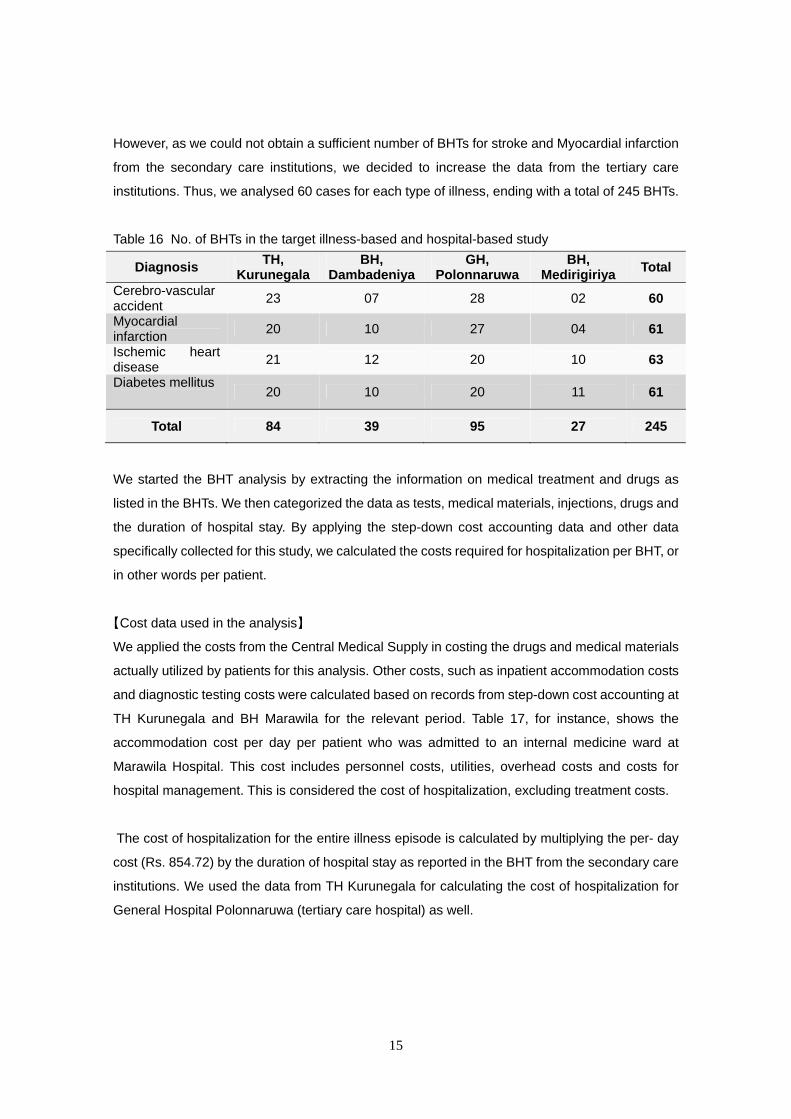
15
However, as we could not obtain a sufficient number of BHTs for stroke and Myocardial infarction
from the secondary care institutions, we decided to increase the data from the tertiary care
institutions. Thus, we analysed 60 cases for each type of illness, ending with a total of 245 BHTs.
Table 16 No. of BHTs in the target illness-based and hospital-based study
Diagnosis TH,
Kurunegala BH,
DambadeniyaGH,
PolonnaruwaBH,
Medirigiriya Total
Cerebro-vascular accident
23 07 28 02 60
Myocardial infarction
20 10 27 04 61
Ischemic heart disease
21 12 20 10 63
Diabetes mellitus 20 10 20 11 61
Total 84 39 95 27 245
We started the BHT analysis by extracting the information on medical treatment and drugs as
listed in the BHTs. We then categorized the data as tests, medical materials, injections, drugs and
the duration of hospital stay. By applying the step-down cost accounting data and other data
specifically collected for this study, we calculated the costs required for hospitalization per BHT, or
in other words per patient.
【Cost data used in the analysis】
We applied the costs from the Central Medical Supply in costing the drugs and medical materials
actually utilized by patients for this analysis. Other costs, such as inpatient accommodation costs
and diagnostic testing costs were calculated based on records from step-down cost accounting at
TH Kurunegala and BH Marawila for the relevant period. Table 17, for instance, shows the
accommodation cost per day per patient who was admitted to an internal medicine ward at
Marawila Hospital. This cost includes personnel costs, utilities, overhead costs and costs for
hospital management. This is considered the cost of hospitalization, excluding treatment costs.
The cost of hospitalization for the entire illness episode is calculated by multiplying the per- day
cost (Rs. 854.72) by the duration of hospital stay as reported in the BHT from the secondary care
institutions. We used the data from TH Kurunegala for calculating the cost of hospitalization for
General Hospital Polonnaruwa (tertiary care hospital) as well.
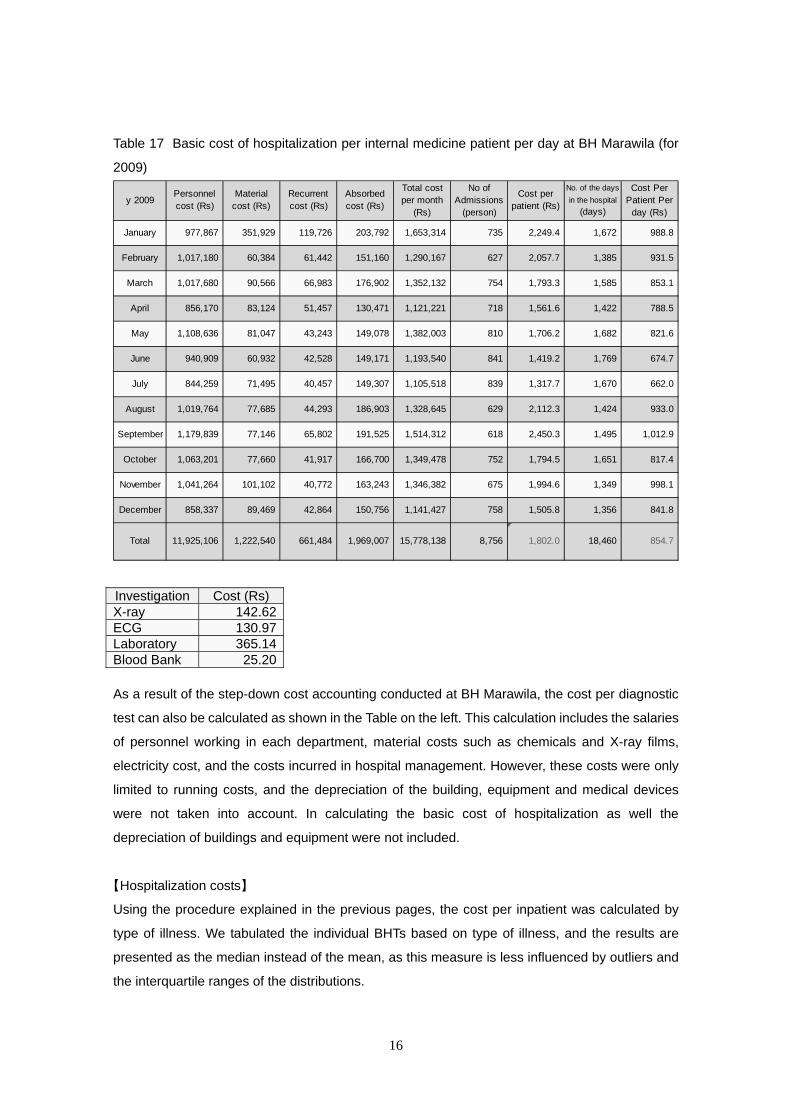
16
Table 17 Basic cost of hospitalization per internal medicine patient per day at BH Marawila (for
2009)
y 2009Personnelcost (Rs)
Materialcost (Rs)
Recurrentcost (Rs)
Absorbedcost (Rs)
Total costper month
(Rs)
No ofAdmissions
(person)
Cost perpatient (Rs)
No. of the days
in the hospital
(days)
Cost PerPatient Per
day (Rs)
January 977,867 351,929 119,726 203,792 1,653,314 735 2,249.4 1,672 988.8
February 1,017,180 60,384 61,442 151,160 1,290,167 627 2,057.7 1,385 931.5
March 1,017,680 90,566 66,983 176,902 1,352,132 754 1,793.3 1,585 853.1
April 856,170 83,124 51,457 130,471 1,121,221 718 1,561.6 1,422 788.5
May 1,108,636 81,047 43,243 149,078 1,382,003 810 1,706.2 1,682 821.6
June 940,909 60,932 42,528 149,171 1,193,540 841 1,419.2 1,769 674.7
July 844,259 71,495 40,457 149,307 1,105,518 839 1,317.7 1,670 662.0
August 1,019,764 77,685 44,293 186,903 1,328,645 629 2,112.3 1,424 933.0
September 1,179,839 77,146 65,802 191,525 1,514,312 618 2,450.3 1,495 1,012.9
October 1,063,201 77,660 41,917 166,700 1,349,478 752 1,794.5 1,651 817.4
November 1,041,264 101,102 40,772 163,243 1,346,382 675 1,994.6 1,349 998.1
December 858,337 89,469 42,864 150,756 1,141,427 758 1,505.8 1,356 841.8
Total 11,925,106 1,222,540 661,484 1,969,007 15,778,138 8,756 1,802.0 18,460 854.7
As a result of the step-down cost accounting conducted at BH Marawila, the cost per diagnostic
test can also be calculated as shown in the Table on the left. This calculation includes the salaries
of personnel working in each department, material costs such as chemicals and X-ray films,
electricity cost, and the costs incurred in hospital management. However, these costs were only
limited to running costs, and the depreciation of the building, equipment and medical devices
were not taken into account. In calculating the basic cost of hospitalization as well the
depreciation of buildings and equipment were not included.
【Hospitalization costs】
Using the procedure explained in the previous pages, the cost per inpatient was calculated by
type of illness. We tabulated the individual BHTs based on type of illness, and the results are
presented as the median instead of the mean, as this measure is less influenced by outliers and
the interquartile ranges of the distributions.
Investigation Cost (Rs) X-ray 142.62 ECG 130.97 Laboratory 365.14 Blood Bank 25.20
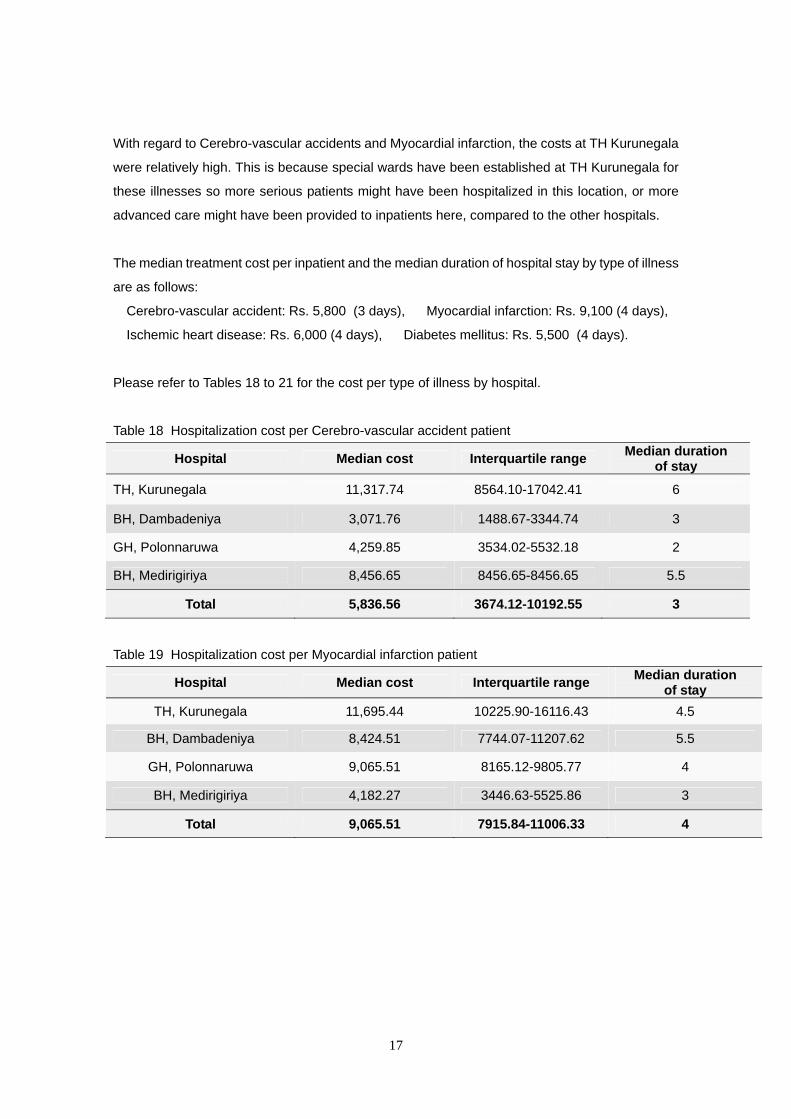
17
With regard to Cerebro-vascular accidents and Myocardial infarction, the costs at TH Kurunegala
were relatively high. This is because special wards have been established at TH Kurunegala for
these illnesses so more serious patients might have been hospitalized in this location, or more
advanced care might have been provided to inpatients here, compared to the other hospitals.
The median treatment cost per inpatient and the median duration of hospital stay by type of illness
are as follows:
Cerebro-vascular accident: Rs. 5,800 (3 days), Myocardial infarction: Rs. 9,100 (4 days),
Ischemic heart disease: Rs. 6,000 (4 days), Diabetes mellitus: Rs. 5,500 (4 days).
Please refer to Tables 18 to 21 for the cost per type of illness by hospital.
Table 18 Hospitalization cost per Cerebro-vascular accident patient
Hospital Median cost Interquartile range Median duration
of stay
TH, Kurunegala 11,317.74 8564.10-17042.41 6
BH, Dambadeniya 3,071.76 1488.67-3344.74 3
GH, Polonnaruwa 4,259.85 3534.02-5532.18 2
BH, Medirigiriya 8,456.65 8456.65-8456.65 5.5
Total 5,836.56 3674.12-10192.55 3
Table 19 Hospitalization cost per Myocardial infarction patient
Hospital Median cost Interquartile range Median duration
of stay
TH, Kurunegala 11,695.44 10225.90-16116.43 4.5
BH, Dambadeniya 8,424.51 7744.07-11207.62 5.5
GH, Polonnaruwa 9,065.51 8165.12-9805.77 4
BH, Medirigiriya 4,182.27 3446.63-5525.86 3
Total 9,065.51 7915.84-11006.33 4

18
Table 20 Hospitalization cost per Ischemic heart disease patient
Hospital Median cost Interquartile range Median duration
of stay
TH, Kurunegala 3,967.13 3242.67-8770.08 3
BH, Dambadeniya 6,189.69 3233.45-7250.27 4
GH, Polonnaruwa 6,721.17 5829.48-7987.18 3.5
BH, Medirigiriya 4,879.93 4232.06-5710.18 4
Total 5,967.58 3922.86-7669.58 4
Table 21 Hospitalization cost per Diabetes mellitus patient
Hospital Median cost Interquartile range Median duration
of stay
TH, Kurunegala 6,631.46 2750.24-8705.12 4.5
BH, Dambadeniya 5,242.30 2864.02-7518.12 4.5
GH, Polonnaruwa 5,670.02 5228.54-8282.96 3
BH, Medirigiriya 4,829.28 2371.42-6795.99 4
Total 5,462.44 4227.22-7860.67 4
3.3 Analysis of household costs of hospitalization
【Survey method】
We conducted a survey on costs incurred due to hospitalization and the opportunity loss from
such an event. The survey involved 243 inpatients who had been admitted to the selected
hospitals due to lifestyle-related diseases.
Table 22 No. of surveyed patients per hospital
Data was collected on age,
gender, occupation, the
highest level of education,
family income, the number of
family members living
together, the method and
cost of traveling to and from
the medical facility, any loss
of income for the participant or the family due to the hospitalization, the cost of meals, the cost of
diagnostic testing conducted at private medical institutions, and other costs incurred due to
hospitalization.
District Hospital No. of
subjects Ratio
Kurunegala TH, Kurunegala 85 people 35.0%
BH, Dambadeniya 37 people 15.2%
Polonnaruwa GH, Polonnaruwa 96 people 39.5%
BH, Medirigiriya 25 people 10.3%
Total 243 people 100.0%

19
【A summary of the survey results】
Here we will provide a summary of the costs incurred by an inpatient and their family as a result of
hospitalization.
Table 23 Travel cost incurred due to hospitalization (Rs.)
The main cost incurred due to
hospitalization is the travel cost to
visit the hospital. Travel costs can
be divided into that spent by the
patient and the family. Table 23 shows the total traveling costs incurred by patients.
Table 24 Travel cost incurred by the patient’s family for hospital visits (Rs.)
Table 24 shows the total traveling
cost spent by the patient’s family
to visit the patient in hospital.
We can add the costs spent by inpatients and their families in the course of hospitalization. In
addition, we can also add the potential income loss which occurs due to the hospital stay. Table 25
shows the total of the direct and indirect costs incurred by patients and their families as a result of
hospitalization: Rs. 3,036 in the Kurunegala District and Rs.2,165 in the Polonnaruwa District.
Table 25 Impact of hospitalization on household finances (Rs.)
4 Future Activities
These cost analysis-related activities were carried out based on the contents of the First
Conference conducted by the Cost Analysis Sub-working Group of the NCD prevention project
(held on 18th December 2008 at the NCD Conference Room of the Ministry of Health). An outline
of the discussions is as follows:
① This sub-working group will analyse the intervention strategy, focusing not only the costs
directly incurred by the implementation of check-ups, but also from the viewpoint of the costs
District Median Interquartile
range
Kurunegala (n=122) 400.0 60.0-1000.0Polonnaruwa (n=121) 362.0 180.0-750.0
Total 390.0 100.0-800.0
District Median Interquartile
range
Kurunegala (n=122) 506.0 200.0-1112.5Polonnaruwa (n=121) 525.0 300.0-885.0
Total 510.0 264.0-950.0
District Median Interquartile
range
Kurunegala (n=122) 3,036.5 1722.0-5725.2Polonnaruwa (n=121) 2,165.0 1285.0-3460.0
Total 2,640.0 1450.0-4520.0
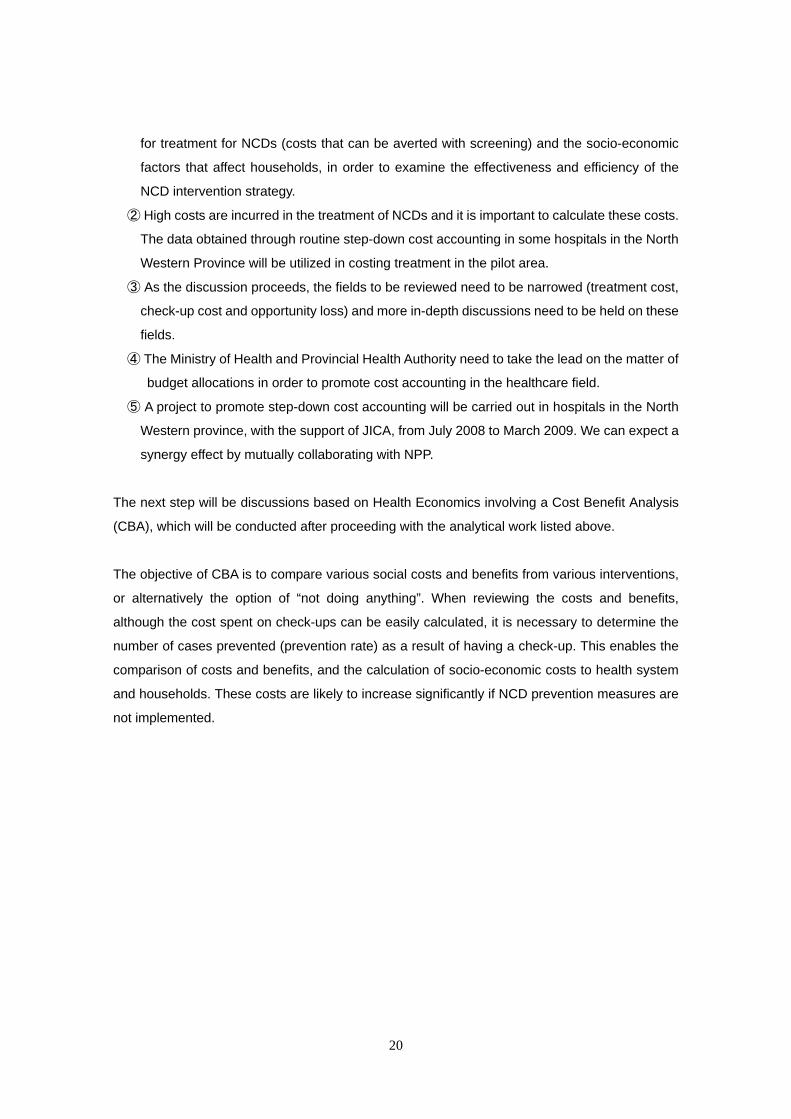
20
for treatment for NCDs (costs that can be averted with screening) and the socio-economic
factors that affect households, in order to examine the effectiveness and efficiency of the
NCD intervention strategy.
② High costs are incurred in the treatment of NCDs and it is important to calculate these costs.
The data obtained through routine step-down cost accounting in some hospitals in the North
Western Province will be utilized in costing treatment in the pilot area.
③ As the discussion proceeds, the fields to be reviewed need to be narrowed (treatment cost,
check-up cost and opportunity loss) and more in-depth discussions need to be held on these
fields.
④ The Ministry of Health and Provincial Health Authority need to take the lead on the matter of
budget allocations in order to promote cost accounting in the healthcare field.
⑤ A project to promote step-down cost accounting will be carried out in hospitals in the North
Western province, with the support of JICA, from July 2008 to March 2009. We can expect a
synergy effect by mutually collaborating with NPP.
The next step will be discussions based on Health Economics involving a Cost Benefit Analysis
(CBA), which will be conducted after proceeding with the analytical work listed above.
The objective of CBA is to compare various social costs and benefits from various interventions,
or alternatively the option of “not doing anything”. When reviewing the costs and benefits,
although the cost spent on check-ups can be easily calculated, it is necessary to determine the
number of cases prevented (prevention rate) as a result of having a check-up. This enables the
comparison of costs and benefits, and the calculation of socio-economic costs to health system
and households. These costs are likely to increase significantly if NCD prevention measures are
not implemented.

21
Annex 1
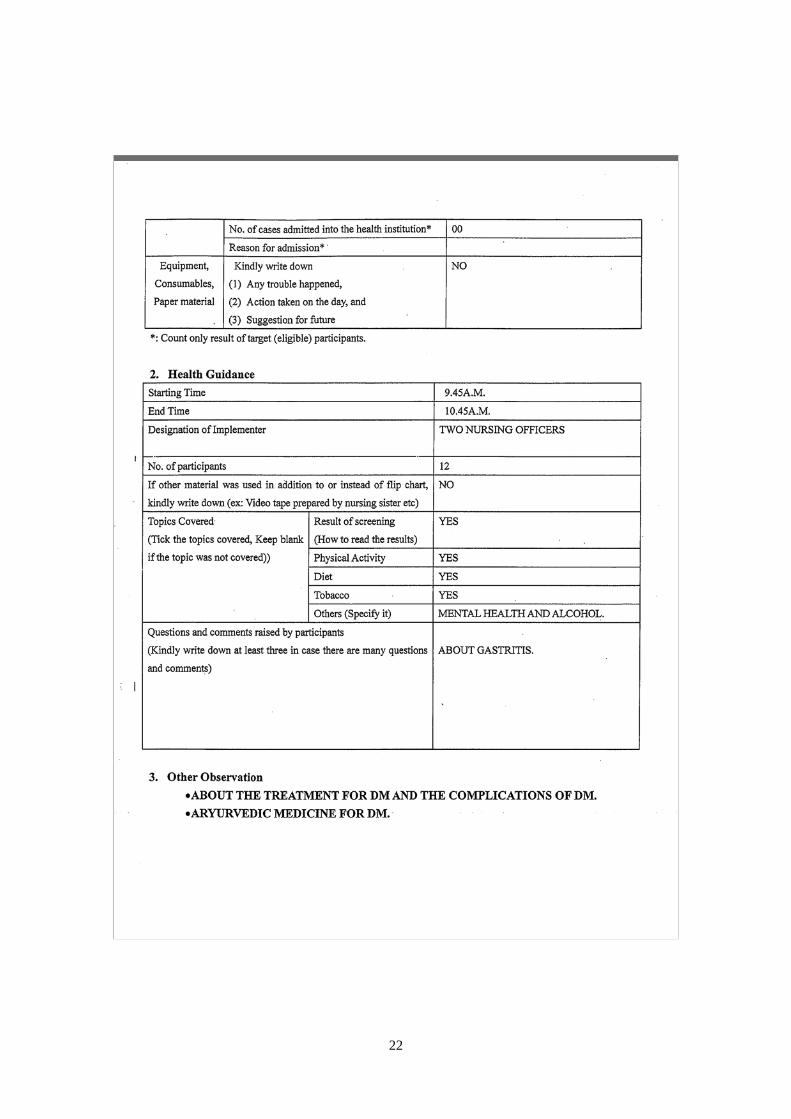
22
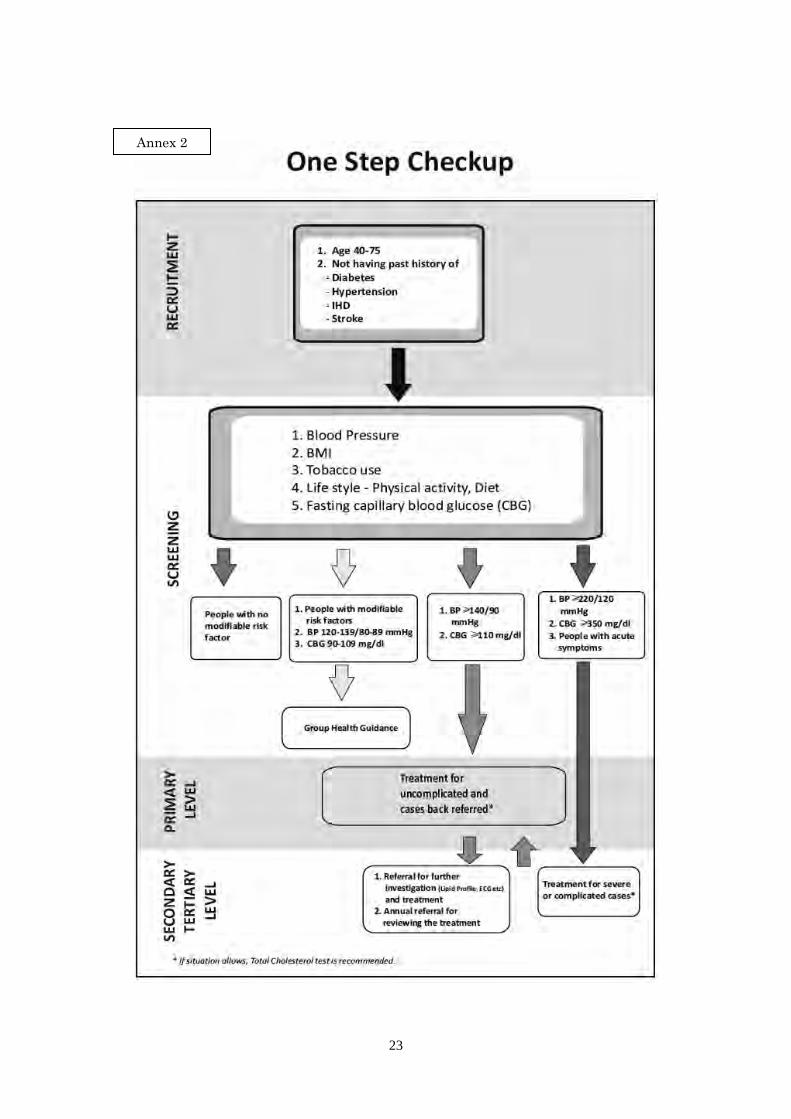
23
Annex 2
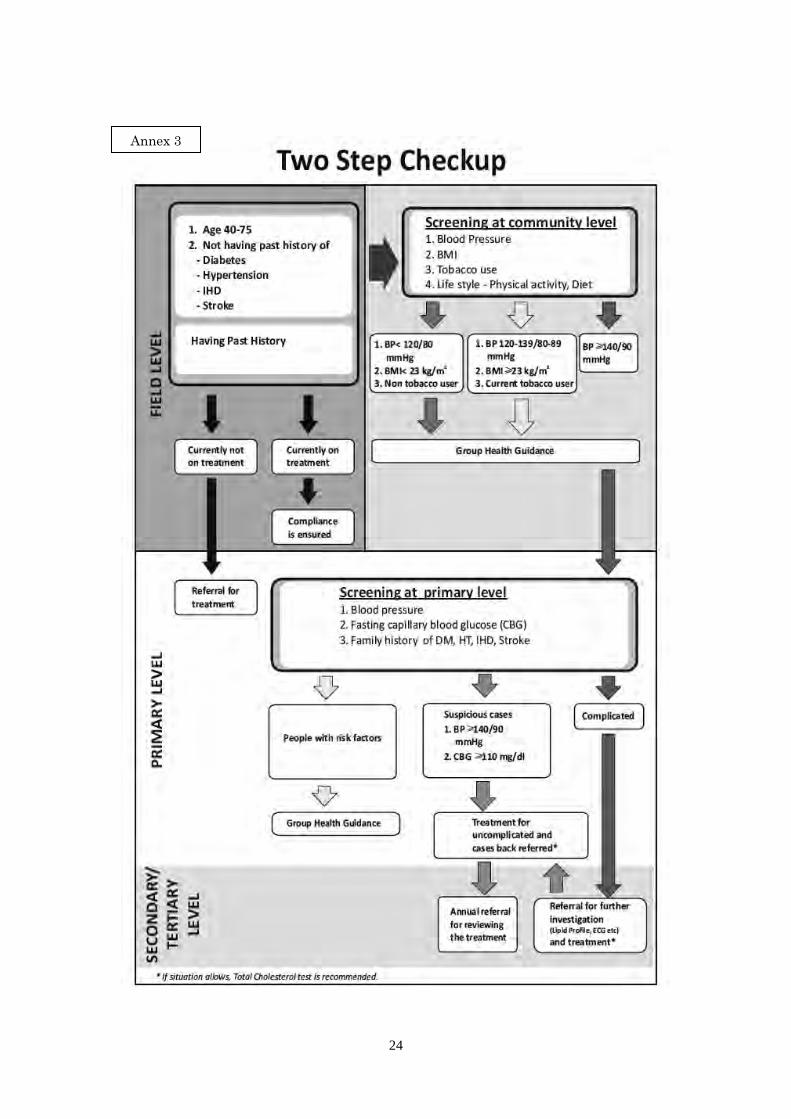
24
Annex 3

25
THE STEP‐DOWN APPROACH
The step‐down cost accounting system here involves three levels
of classification: from the more general to the more specific in
allocating costs to final Cost Centres .
A Cos t Centre can be defined a s “a production or service location,
function, activity or item of equipment for which costs are
accumulated”.
The analysis of hospital costs was designed to accumulate costs by
department or Cost Centre. The Cos t Centres demarcated in this
analysis were of three types :
overheads (to accumulate overhead costs
including administrative costs that are then sha
red out among the patient‐related Cost
Centres ); intermediate (those that provide
support, e.g., diagnostic services , to the final
Cos t Centres ) and final (example medical
departments that provide” final” services
directly to patients, e.g., wards, outpatient
clinics).
Overhead Cos t Centre
Intermediate
Cos t C entre
Final Cost Centre
Cost to be abs orbe d based on the servic e provid
DIAGRAMMATIC IMAGE OF STEP‐DOWN COST ACCOUNTING
The ‘step‐down’ approach is used, whereby costs are allocated to
Cost Centres starting with each Cos t Centre’s direct costs and then
apportioning the indirect costs , ma king sure that each cost is
ultimately allocated to the relevant final Cos t Centre.
Source: Resource book 1 Cost Accounting, Final report Volume2,
The Development Study on Evidence‐Based Management for the
Health System in Sri Lanka, September 2007, Global Link
Management, Inc.
Annex 4

26
Report 2
Cost of participation in the health check-up component of the NCD Prevention Project (NPP) and
Cost of hospitalization for selected NCDs in the Kurunegala and Polonnaruwa districts
Anuradhani Kasturiratne Takao Sugimoto Amala de Silva
A study conducted for Japan International Cooperation Agency 2010
27
1 Introduction
1.1 Background
Non-Communicable diseases (NCDs) are a priority public health problem in Sri Lanka. Ischaemic
heart disease has been the commonest cause of death in hospital over the last three decades
(Ministry of Health, 2008). The number of reported cases of Ischaemic heart disease and
Myocardial infarction is increasing annually (Constantine et al., 1999). Cerebro-vascular events
are among the six leading causes of death (Gunawardena, 1999). Hypertension and Diabetes are
the commonest chronic diseases seen in the ambulatory care setting. Rates of hospitalization due
to these two conditions are observed to be rapidly increasing (Premaratne et al., 2005). High
prevalence of insulin resistance and type 2 Diabetes mellitus in South Asians is well documented
and is considered to be an important cause of elevated vascular risk (Tziomalos et al., 2008)
Screening is one of the strategies adopted worldwide for prevention of NCDs. Screening can be
used in both primary prevention and secondary prevention. Early detection and modification of
risk factors is a strategy of primary prevention. The subjects are free of disease at this point in
time, but they may have risk factors for development of NCDs. A screening programme will
actively look for risk factors and form a basis for appropriate lifestyle modification activities
implemented at both population and individual levels to control these risk factors. Screening for
early identification of NCDs is a strategy of secondary prevention. In this strategy, subjects are
screened for asymptomatic disease using simple and quick screening methods. Those detected
to have the disease(s) can be referred for treatment and follow-up, which will control progression
of the condition and improve patient outcome through preventing complications. Multiple
screening methods incorporated into a single screening programme targeting both risk factors
and asymptomatic disease is appropriate for population level screening in Sri Lanka.
1.2 Non-communicable disease Prevention (NPP) Project
The Non-communicable Disease Prevention Project (NPP) currently conducted by the Ministry of
Health and funded by the Japan International Cooperation Agency has a component on screening
the general population for NCDs and risk factors. This component is currently implemented in the
Medirigiriya Medical Officer of Health (MOH) area in the Polonnaruwa district and Alawwa and
Narammala MOH areas in the Kurunegala district by regional health authorities. Members of the
general population aged between 40-75 years who reside in the three MOH areas, are invited to
participate in the screening programme (health check-up). Appointments for the check-up are
issued by the public health field staff or health staff of hospitals. Check-ups are conducted at a
centre close to the participants’ residence. At the check-up, screening for hypertension, obesity

28
and Diabetes mellitus is conducted. Screened subjects who are positive are referred for medical
care and follow up in the referral centres in the district where specialist care is available. Health
education on prevention of NCDs is given in-group sessions.
1.3 Justification
The health check-up programme requires considerable resources for its implementation. Cost of
in-service training of health staff, maintaining overheads and provision of technical support are
important elements of the programme’s cost. Continued implementation and expansion of health
check-ups should be based on its ability to improve the outcomes of targeted NCDs, contributing
to cost containment in curative and rehabilitative care. To evaluate the effectiveness of the health
check-up programme, estimates of the household cost of participation in the health check-up as
well as the cost of managing important NCDs in hospital and the economic burden of
hospitalisation on the household (the outcomes that could result from the alternative scenario of
non-screening) are prerequisites. The systemic cost of conducting the health check-ups is
presented in the paper by T. Sugimoto in this same compendium.
1.4 Objectives
This study is undertaken with the following objectives
1.5 General Objective:
To determine the household cost of participation in the health check-up component of the NCD
Prevention Project (NPP) and
To determine the household and health system cost of hospitalisation for selected NCDs in
referral hospitals in the Polonnaruwa and Kurunegala districts
1.6 Specific Objectives:
1 To determine the direct and indirect household costs of participation in health check-ups.
2 To determine the direct and indirect household costs of hospitalisation for selected
non-communicable diseases i.e. Diabetes mellitus, Myocardial infarction, Ischaemic heart
disease and Cerebor-vascular in selected referral hospitals in the Polonnaruwa and
Kurunegala districts.
3 To determine the cost incurred by the hospital/state health sector for treatment of selected
non-communicable diseases i.e. Diabetes mellitus, Myocardial infarction, Ischaemic heart
disease and Stroke in selected referral hospitals in the Polonnaruwa and Kurunegala
districts.

29
2 Methods
2.1 Study design:
This study is a descriptive cross sectional study with two components.
Component one: This component was conducted prospectively in health check-up centres in the
Polonnaruwa and Kurunegala districts. Participants of the health check-up programme were the
study subjects. Data were collected by trained pre-intern medical officers using an
interviewer-administered questionnaire in Sinhala. Different household cost components were
identified. Both direct and indirect costs of participating in the health check-ups were assessed.
Component two: This component was conducted prospectively in four referral hospitals
including the main hospitals in the two districts. Patients admitted for treatment of the diseases of
interest were followed up during their entire hospital stay. The household cost of hospitalisation
was estimated based on data obtained from interviews with patients and/ or relatives/carers. Data
on clinical management of the patients were extracted from the Bed Head Ticket as well as from
health personnel involved in the treatment of the patient.
2.2 Study setting:
Component one was conducted in health check-up centres in Medirigiriya, Alawwa and
Narammala MOH areas. Component two was conducted at the General Hospitals, Kurunegala
and Polonnaruwa and Base Hospitals, Dambadeniya and Medirigiriya.
2.3 Study period:
The study was conducted from August to December 2010.
2.4 Study population:
Component one: Participants of the NPP health check-up component in the Medirigiriya,
Alawwa and Narammala MOH areas
Component two: Subjects who received in-patient care in the relevant hospitals during the
period between August and December 2010, for the following conditions:
1. Cerebro-vascular
2. Acute Myocardial infarction
3. Ischaemic Heart Disease
4. Diabetes mellitus
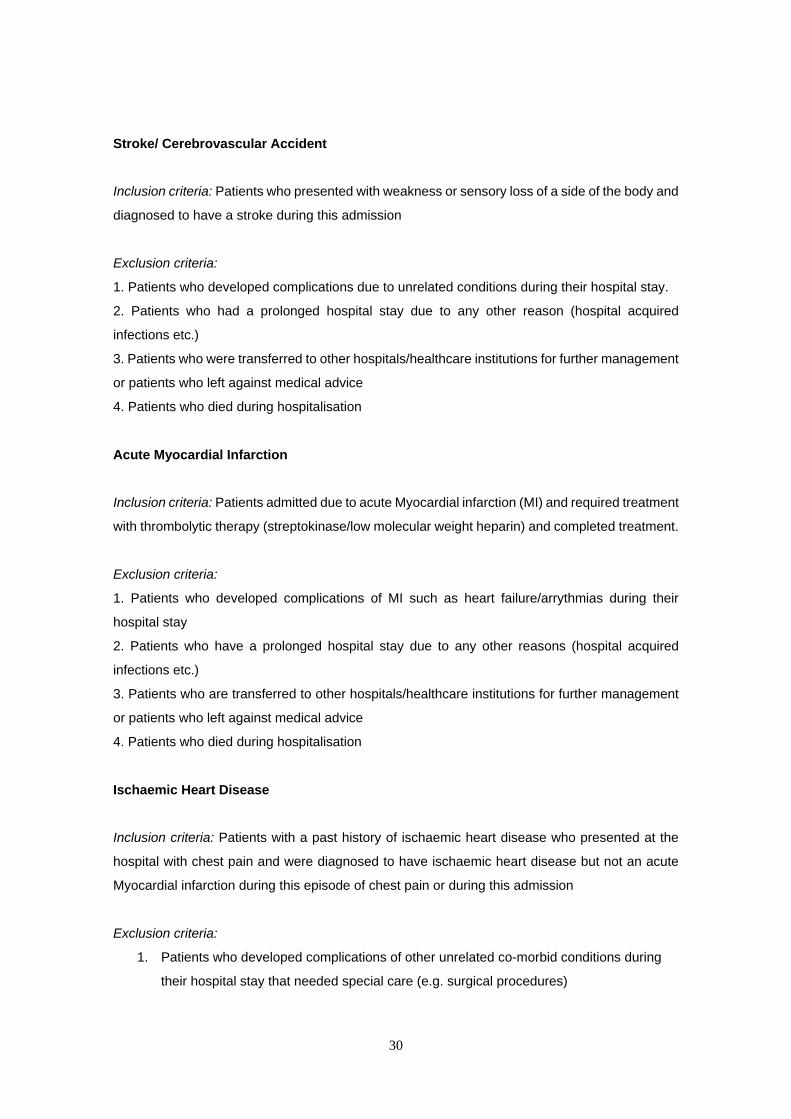
30
Stroke/ Cerebrovascular Accident
Inclusion criteria: Patients who presented with weakness or sensory loss of a side of the body and
diagnosed to have a stroke during this admission
Exclusion criteria:
1. Patients who developed complications due to unrelated conditions during their hospital stay.
2. Patients who had a prolonged hospital stay due to any other reason (hospital acquired
infections etc.)
3. Patients who were transferred to other hospitals/healthcare institutions for further management
or patients who left against medical advice
4. Patients who died during hospitalisation
Acute Myocardial Infarction
Inclusion criteria: Patients admitted due to acute Myocardial infarction (MI) and required treatment
with thrombolytic therapy (streptokinase/low molecular weight heparin) and completed treatment.
Exclusion criteria:
1. Patients who developed complications of MI such as heart failure/arrythmias during their
hospital stay
2. Patients who have a prolonged hospital stay due to any other reasons (hospital acquired
infections etc.)
3. Patients who are transferred to other hospitals/healthcare institutions for further management
or patients who left against medical advice
4. Patients who died during hospitalisation
Ischaemic Heart Disease
Inclusion criteria: Patients with a past history of ischaemic heart disease who presented at the
hospital with chest pain and were diagnosed to have ischaemic heart disease but not an acute
Myocardial infarction during this episode of chest pain or during this admission
Exclusion criteria:
1. Patients who developed complications of other unrelated co-morbid conditions during
their hospital stay that needed special care (e.g. surgical procedures)
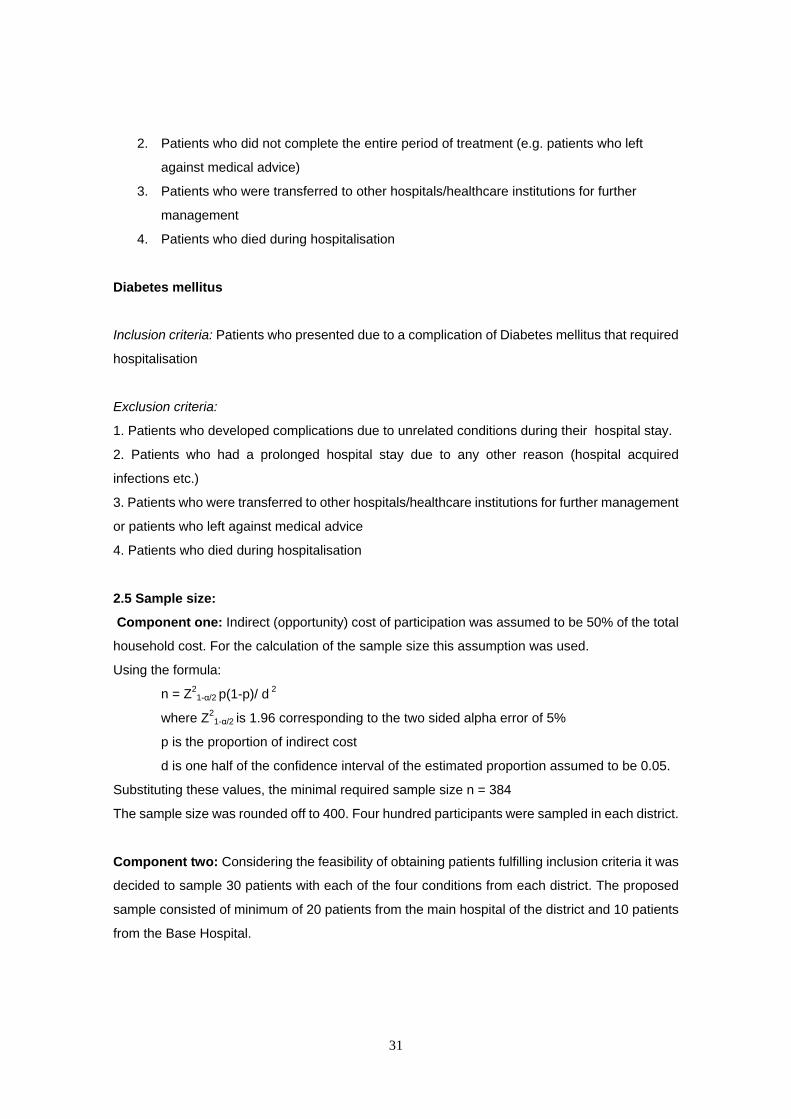
31
2. Patients who did not complete the entire period of treatment (e.g. patients who left
against medical advice)
3. Patients who were transferred to other hospitals/healthcare institutions for further
management
4. Patients who died during hospitalisation
Diabetes mellitus
Inclusion criteria: Patients who presented due to a complication of Diabetes mellitus that required
hospitalisation
Exclusion criteria:
1. Patients who developed complications due to unrelated conditions during their hospital stay.
2. Patients who had a prolonged hospital stay due to any other reason (hospital acquired
infections etc.)
3. Patients who were transferred to other hospitals/healthcare institutions for further management
or patients who left against medical advice
4. Patients who died during hospitalisation
2.5 Sample size:
Component one: Indirect (opportunity) cost of participation was assumed to be 50% of the total
household cost. For the calculation of the sample size this assumption was used.
Using the formula:
n = Z21-α/2 p(1-p)/ d 2
where Z21-α/2 is 1.96 corresponding to the two sided alpha error of 5%
p is the proportion of indirect cost
d is one half of the confidence interval of the estimated proportion assumed to be 0.05.
Substituting these values, the minimal required sample size n = 384
The sample size was rounded off to 400. Four hundred participants were sampled in each district.
Component two: Considering the feasibility of obtaining patients fulfilling inclusion criteria it was
decided to sample 30 patients with each of the four conditions from each district. The proposed
sample consisted of minimum of 20 patients from the main hospital of the district and 10 patients
from the Base Hospital.
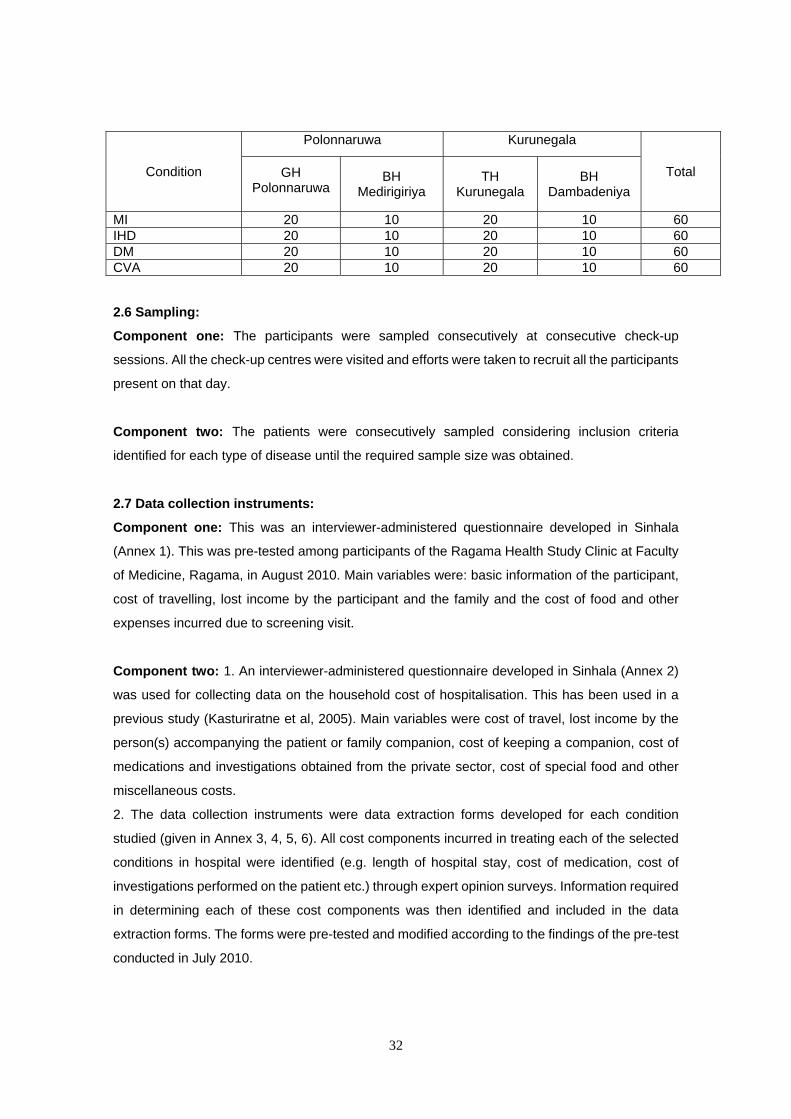
32
Condition
Polonnaruwa Kurunegala
Total GH Polonnaruwa
BH Medirigiriya
TH Kurunegala
BH Dambadeniya
MI 20 10 20 10 60 IHD 20 10 20 10 60 DM 20 10 20 10 60 CVA 20 10 20 10 60
2.6 Sampling:
Component one: The participants were sampled consecutively at consecutive check-up
sessions. All the check-up centres were visited and efforts were taken to recruit all the participants
present on that day.
Component two: The patients were consecutively sampled considering inclusion criteria
identified for each type of disease until the required sample size was obtained.
2.7 Data collection instruments:
Component one: This was an interviewer-administered questionnaire developed in Sinhala
(Annex 1). This was pre-tested among participants of the Ragama Health Study Clinic at Faculty
of Medicine, Ragama, in August 2010. Main variables were: basic information of the participant,
cost of travelling, lost income by the participant and the family and the cost of food and other
expenses incurred due to screening visit.
Component two: 1. An interviewer-administered questionnaire developed in Sinhala (Annex 2)
was used for collecting data on the household cost of hospitalisation. This has been used in a
previous study (Kasturiratne et al, 2005). Main variables were cost of travel, lost income by the
person(s) accompanying the patient or family companion, cost of keeping a companion, cost of
medications and investigations obtained from the private sector, cost of special food and other
miscellaneous costs.
2. The data collection instruments were data extraction forms developed for each condition
studied (given in Annex 3, 4, 5, 6). All cost components incurred in treating each of the selected
conditions in hospital were identified (e.g. length of hospital stay, cost of medication, cost of
investigations performed on the patient etc.) through expert opinion surveys. Information required
in determining each of these cost components was then identified and included in the data
extraction forms. The forms were pre-tested and modified according to the findings of the pre-test
conducted in July 2010.
33
2.8 Data collection:
Component one: Data collection was conducted over a period of three months by pre-intern
medical officers. They visited the health check-up centres and conducted sampling of participants
and data collection.
Component two: Data collection was conducted over a period of three months by pre-intern
medical officers. They visited the medical wards of the hospitals and conducted sampling of
participants and data collection. Information needed to estimate the household cost of
hospitalisation was collected using the interviewer-administered questionnaire.
The information needed to determine the cost of treatment incurred by the hospital and the health
system were extracted from the BHT. Clinical opinions were sought from the clinicians for
estimating certain cost items.
2.9 Data analysis:
Questionnaires and data extraction forms were checked for completeness before data entry. Data
were entered in Epi Data 3.1b and analysis was done using SPSS version 16. The cost of each
item was determined and added up to calculate the cost of each component. Then the total cost
incurred was calculated. Costs were usually described using median and interquartile range. In
some situations median and range was used to describe the data.
2.10 Administrative considerations:
Permission to conduct the study was obtained from provincial and regional health authorities of
the two districts as well as the heads of institutions where the study was conducted. Permission
was also obtained from the Consultant Physicians in charge of each ward from which patients
were recruited for component 2.
2.11 Ethical considerations:
Component one: Individuals were recruited only after informed written consent (consent form -
Annex 7) was obtained and the data collected was used only for the purpose of research. They
were informed that their participation was entirely voluntary and that their decision to participate or
not would not affect the services provided at the check-up and their subsequent follow-up.
Component two: Patients were recruited only after informed written consent was obtained from
the patient (consent form- Annex 8). When the patient was unable to give consent due to being
too ill, consent was obtained from a first degree relative. They were informed that their
participation was entirely voluntary and that their decision to participate or not would not affect the
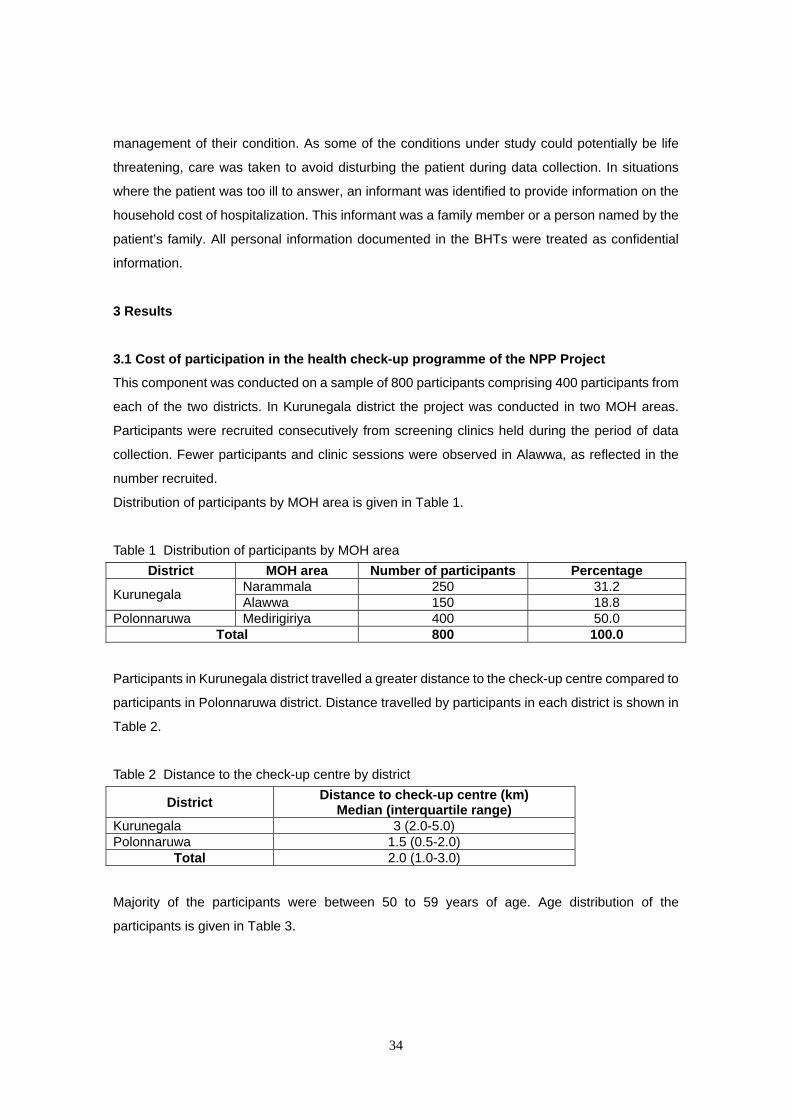
34
management of their condition. As some of the conditions under study could potentially be life
threatening, care was taken to avoid disturbing the patient during data collection. In situations
where the patient was too ill to answer, an informant was identified to provide information on the
household cost of hospitalization. This informant was a family member or a person named by the
patient’s family. All personal information documented in the BHTs were treated as confidential
information.
3 Results
3.1 Cost of participation in the health check-up programme of the NPP Project
This component was conducted on a sample of 800 participants comprising 400 participants from
each of the two districts. In Kurunegala district the project was conducted in two MOH areas.
Participants were recruited consecutively from screening clinics held during the period of data
collection. Fewer participants and clinic sessions were observed in Alawwa, as reflected in the
number recruited.
Distribution of participants by MOH area is given in Table 1.
Table 1 Distribution of participants by MOH area
District MOH area Number of participants Percentage
Kurunegala Narammala 250 31.2 Alawwa 150 18.8
Polonnaruwa Medirigiriya 400 50.0 Total 800 100.0
Participants in Kurunegala district travelled a greater distance to the check-up centre compared to
participants in Polonnaruwa district. Distance travelled by participants in each district is shown in
Table 2.
Table 2 Distance to the check-up centre by district
District Distance to check-up centre (km)
Median (interquartile range) Kurunegala 3 (2.0-5.0) Polonnaruwa 1.5 (0.5-2.0)
Total 2.0 (1.0-3.0)
Majority of the participants were between 50 to 59 years of age. Age distribution of the
participants is given in Table 3.

35
Table 3 Age distribution of the participants
Age category Number Percentage < 40 years 15 1.9 40-49 years 260 32.5 50-59 years 307 38.4 60-69 years 164 20.5 ≥ 70 years 54 6.8 Total 800 100.00
Study participants were predominantly female, comprising 68% of the total sample. In Kurunegala
females comprised 79.7% of the sample compared to 62.3% in Polonnaruwa.
Table 4 Sex distribution of the participants
Sex category Number Percentage Male 257 32.1 Female 543 67.9
Total 800 100.00
Occupations were classified according to International Standard classification of Occupation
(ISCO). The largest occupational group participating in the check-up were agricultural workers
(22.2%). Few people were engaged in sedentary occupations. The distribution of participants by
occupational group is given in Table 5.
Table 5 Distribution of participants by occupational category
Occupation category Number Percentage Legislators, senior officials and managers 0 0 Professionals 9 1.1 Technicians and associate professionals 10 1.3 Clerks 6 0.8 Service and shop and market sales workers 27 3.4 Skilled agricultural and fishery workers 178 22.2 Craft and related workers 20 2.5 Plant and machine operators and assemblers 14 1.7 Elementary occupations 37 4.6 Unemployed 499 62.4
Total 800 100.0
Approximately 71% of the participants were educated above grade 8 in Kurunegala district as
compared to 48% in Polonnaruwa district. Only 0.7% of the participants had received higher
education. The group who had not received any formal education comprised 2% in Kurunegala
district compared to 7.2% in Polonnaruwa district. The educational level of the participants by
district is given in Table 6.

36
Table 6 Distribution of participants by educational level and district
District Educational level Number Percentage Kurunegala
No formal education 8 2.0 < Grade 5 47 11.7 Passed Grade 5 63 15.7 Passed Grade 8 130 32.6 Passed G.C.E Ordinary Level 86 21.6 Passed G.C.E. Advanced Level 63 15.7 Higher education 3 0.7
Total 400 100.0 Polonnaruwa
No formal education 29 7.2 < Grade 5 102 25.5 Passed Grade 5 78 19.6 Passed Grade 8 121 30.2 Passed G.C.E Ordinary Level 58 14.6 Passed G.C.E. Advanced Level 9 2.2 Higher education 3 0.7
Total 400 100.0
About 21% of the participants reported that their monthly family income was less than Rs.
5,000.00. Only 22% reported a monthly family income above Rs. 20,000.00. The income
distribution of respondents is given in Table 7.
Table 7 Distribution of participants by monthly family income
Educational level Number Percentage No formal education 44 5.5 < Grade 5 169 21.1 Passed Grade 5 147 18.4 Passed Grade 8 248 31.0 Passed G.C.E Ordinary Level 135 16.9 Passed G.C.E. Advanced Level 52 6.5 Higher education 5 0.6
Total 800 100.0
The family size of the participants ranged from 1-11. Median family size was 4 (interquartile range
3-5). Distribution of participants by family size is shown in Table 8.
Table 8 Distribution of participants by family size
Family size Number Percentage 1-4 members 442 55.2 5-8 members 354 44.3 ≥ 9 members 4 0.5
Total 800 100.0
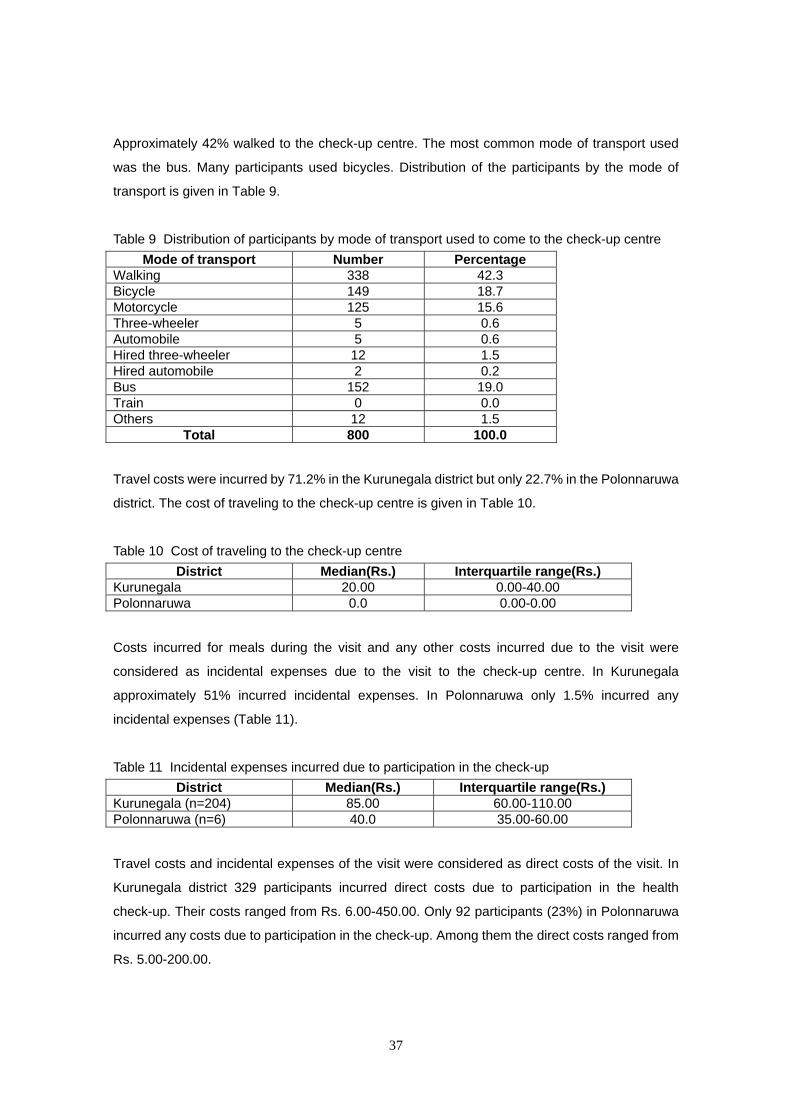
37
Approximately 42% walked to the check-up centre. The most common mode of transport used
was the bus. Many participants used bicycles. Distribution of the participants by the mode of
transport is given in Table 9.
Table 9 Distribution of participants by mode of transport used to come to the check-up centre
Mode of transport Number Percentage Walking 338 42.3 Bicycle 149 18.7 Motorcycle 125 15.6 Three-wheeler 5 0.6 Automobile 5 0.6 Hired three-wheeler 12 1.5 Hired automobile 2 0.2 Bus 152 19.0 Train 0 0.0 Others 12 1.5
Total 800 100.0
Travel costs were incurred by 71.2% in the Kurunegala district but only 22.7% in the Polonnaruwa
district. The cost of traveling to the check-up centre is given in Table 10.
Table 10 Cost of traveling to the check-up centre
District Median(Rs.) Interquartile range(Rs.) Kurunegala 20.00 0.00-40.00 Polonnaruwa 0.0 0.00-0.00
Costs incurred for meals during the visit and any other costs incurred due to the visit were
considered as incidental expenses due to the visit to the check-up centre. In Kurunegala
approximately 51% incurred incidental expenses. In Polonnaruwa only 1.5% incurred any
incidental expenses (Table 11).
Table 11 Incidental expenses incurred due to participation in the check-up
District Median(Rs.) Interquartile range(Rs.) Kurunegala (n=204) 85.00 60.00-110.00 Polonnaruwa (n=6) 40.0 35.00-60.00
Travel costs and incidental expenses of the visit were considered as direct costs of the visit. In
Kurunegala district 329 participants incurred direct costs due to participation in the health
check-up. Their costs ranged from Rs. 6.00-450.00. Only 92 participants (23%) in Polonnaruwa
incurred any costs due to participation in the check-up. Among them the direct costs ranged from
Rs. 5.00-200.00.
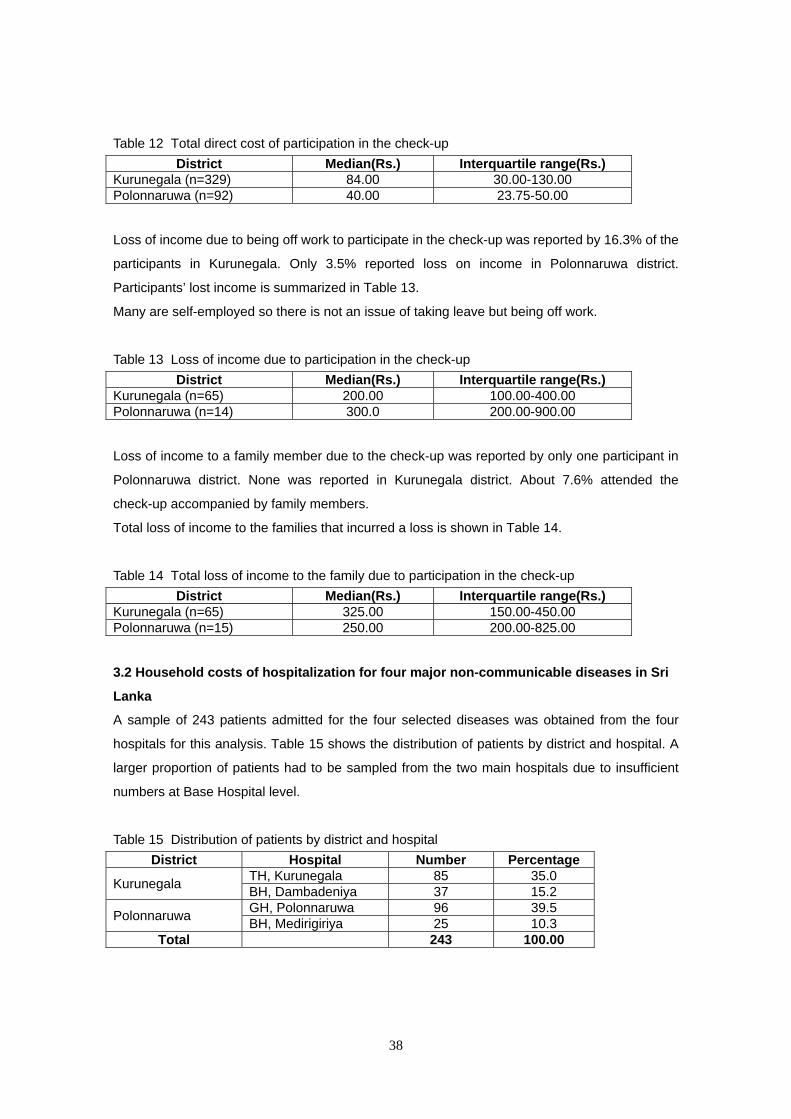
38
Table 12 Total direct cost of participation in the check-up
District Median(Rs.) Interquartile range(Rs.) Kurunegala (n=329) 84.00 30.00-130.00 Polonnaruwa (n=92) 40.00 23.75-50.00
Loss of income due to being off work to participate in the check-up was reported by 16.3% of the
participants in Kurunegala. Only 3.5% reported loss on income in Polonnaruwa district.
Participants’ lost income is summarized in Table 13.
Many are self-employed so there is not an issue of taking leave but being off work.
Table 13 Loss of income due to participation in the check-up
District Median(Rs.) Interquartile range(Rs.) Kurunegala (n=65) 200.00 100.00-400.00 Polonnaruwa (n=14) 300.0 200.00-900.00
Loss of income to a family member due to the check-up was reported by only one participant in
Polonnaruwa district. None was reported in Kurunegala district. About 7.6% attended the
check-up accompanied by family members.
Total loss of income to the families that incurred a loss is shown in Table 14.
Table 14 Total loss of income to the family due to participation in the check-up
District Median(Rs.) Interquartile range(Rs.) Kurunegala (n=65) 325.00 150.00-450.00 Polonnaruwa (n=15) 250.00 200.00-825.00
3.2 Household costs of hospitalization for four major non-communicable diseases in Sri
Lanka
A sample of 243 patients admitted for the four selected diseases was obtained from the four
hospitals for this analysis. Table 15 shows the distribution of patients by district and hospital. A
larger proportion of patients had to be sampled from the two main hospitals due to insufficient
numbers at Base Hospital level.
Table 15 Distribution of patients by district and hospital
District Hospital Number Percentage
Kurunegala TH, Kurunegala 85 35.0 BH, Dambadeniya 37 15.2
Polonnaruwa GH, Polonnaruwa 96 39.5 BH, Medirigiriya 25 10.3
Total 243 100.00
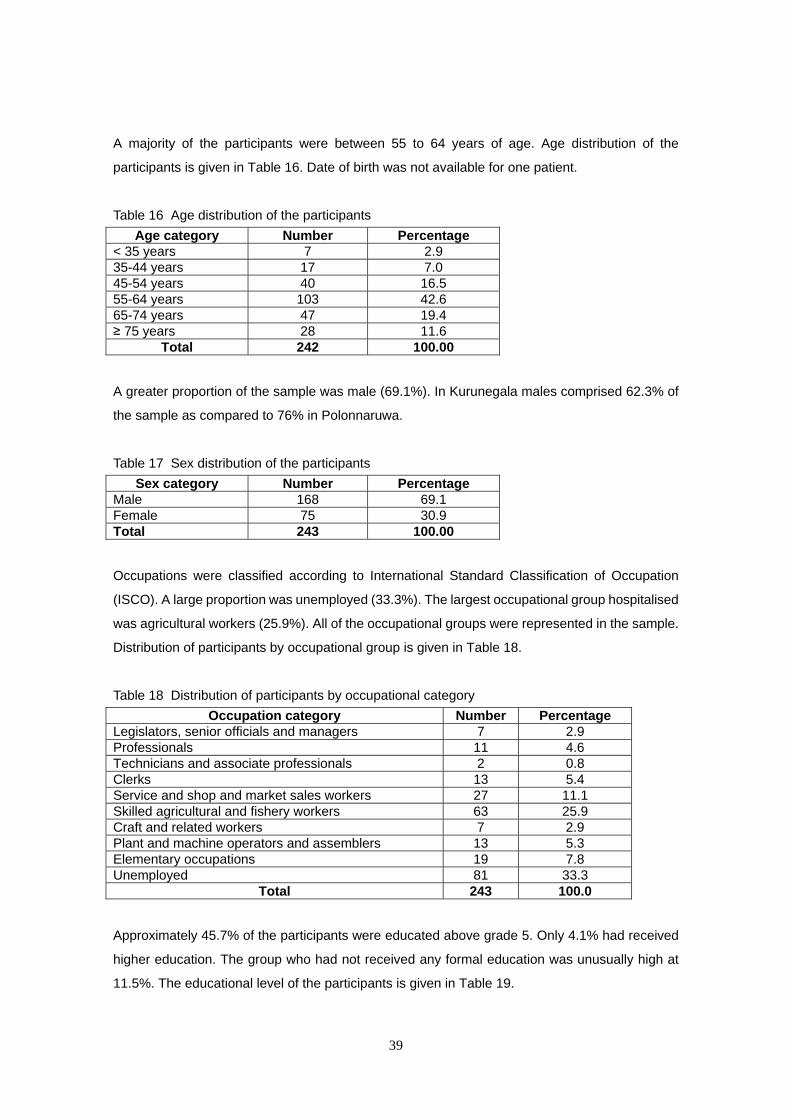
39
A majority of the participants were between 55 to 64 years of age. Age distribution of the
participants is given in Table 16. Date of birth was not available for one patient.
Table 16 Age distribution of the participants
Age category Number Percentage < 35 years 7 2.9 35-44 years 17 7.0 45-54 years 40 16.5 55-64 years 103 42.6 65-74 years 47 19.4 ≥ 75 years 28 11.6
Total 242 100.00
A greater proportion of the sample was male (69.1%). In Kurunegala males comprised 62.3% of
the sample as compared to 76% in Polonnaruwa.
Table 17 Sex distribution of the participants
Sex category Number Percentage Male 168 69.1 Female 75 30.9 Total 243 100.00
Occupations were classified according to International Standard Classification of Occupation
(ISCO). A large proportion was unemployed (33.3%). The largest occupational group hospitalised
was agricultural workers (25.9%). All of the occupational groups were represented in the sample.
Distribution of participants by occupational group is given in Table 18.
Table 18 Distribution of participants by occupational category
Occupation category Number Percentage Legislators, senior officials and managers 7 2.9 Professionals 11 4.6 Technicians and associate professionals 2 0.8 Clerks 13 5.4 Service and shop and market sales workers 27 11.1 Skilled agricultural and fishery workers 63 25.9 Craft and related workers 7 2.9 Plant and machine operators and assemblers 13 5.3 Elementary occupations 19 7.8 Unemployed 81 33.3
Total 243 100.0
Approximately 45.7% of the participants were educated above grade 5. Only 4.1% had received
higher education. The group who had not received any formal education was unusually high at
11.5%. The educational level of the participants is given in Table 19.

40
Table 19 Distribution of participants by educational level
Educational level Number Percentage No formal education 28 11.5 < Grade 5 53 21.8 Passed Grade 5 51 21.0 Passed Grade 8 45 18.5 Passed G.C.E Ordinary Level 43 17.7 Passed G.C.E. Advanced Level 13 5.4 Higher education 10 4.1
Total 243 100.0
About 8.6% of the participants reported that their monthly family income was less than Rs.
50,000.00. About 35.8% reported a monthly family income above Rs. 20,000.00. Income
distribution is shown in Table 20.
Table 20 Distribution of participants by monthly family income
Family income Number Percentage < Rs. 5000 21 8.7 Rs. 5000-9999 64 26.3 Rs. 10000-19999 71 29.2 Rs. 20000-34999 52 21.4 Rs. 35000-49999 17 7.0 ≥ Rs. 50000 18 7.4
Total 243 100.0
The family size of the participants ranged from 1-8. Median family size was 4 (interquartile range
3-5). Distribution of participants by family size is shown in Table 21.
Table 21 Distribution of participants by family size
Family size Number Percentage 1-4 members 132 54.3 5-8 members 111 45.7 ≥ 9 members 0 0.0
Total 243 100.0
Over 55% arrived at the screening centre in a hired three-wheeler. About 16.9% used the bus.
About 11% of the participants used their own three-wheeler. Distribution of the participants by the
mode of transport is given in Table 22.
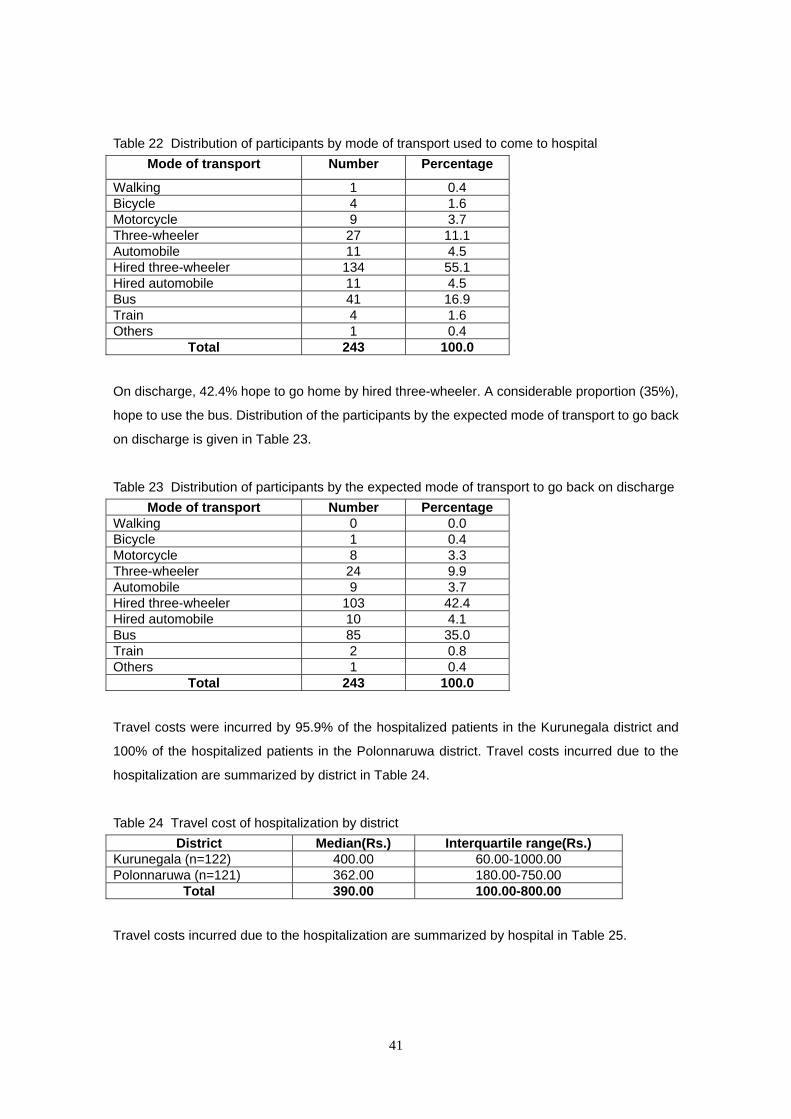
41
Table 22 Distribution of participants by mode of transport used to come to hospital
Mode of transport Number Percentage
Walking 1 0.4 Bicycle 4 1.6 Motorcycle 9 3.7 Three-wheeler 27 11.1 Automobile 11 4.5 Hired three-wheeler 134 55.1 Hired automobile 11 4.5 Bus 41 16.9 Train 4 1.6 Others 1 0.4
Total 243 100.0
On discharge, 42.4% hope to go home by hired three-wheeler. A considerable proportion (35%),
hope to use the bus. Distribution of the participants by the expected mode of transport to go back
on discharge is given in Table 23.
Table 23 Distribution of participants by the expected mode of transport to go back on discharge
Mode of transport Number Percentage Walking 0 0.0 Bicycle 1 0.4 Motorcycle 8 3.3 Three-wheeler 24 9.9 Automobile 9 3.7 Hired three-wheeler 103 42.4 Hired automobile 10 4.1 Bus 85 35.0 Train 2 0.8 Others 1 0.4
Total 243 100.0
Travel costs were incurred by 95.9% of the hospitalized patients in the Kurunegala district and
100% of the hospitalized patients in the Polonnaruwa district. Travel costs incurred due to the
hospitalization are summarized by district in Table 24.
Table 24 Travel cost of hospitalization by district
District Median(Rs.) Interquartile range(Rs.) Kurunegala (n=122) 400.00 60.00-1000.00 Polonnaruwa (n=121) 362.00 180.00-750.00
Total 390.00 100.00-800.00
Travel costs incurred due to the hospitalization are summarized by hospital in Table 25.

42
Table 25 Travel cost of hospitalization by hospital
Hospital Median(Rs.) Interquartile range(Rs.) TH, Kurunegala (n=85) 500.00 100.00-1080.00 DH, Dambadeniya (n=37) 200.00 36.00-600.00 GH, Polonnaruwa (n=96) 400.00 200.00-850.00 BH, Medirigiriya (n=25) 260.00 80.00-550.00
Total 390.00 100.00-800.00
Loss of income and costs incurred by the patient’s household due to accompanying the patient to
hospital are summarized in Table 26 by district and hospital.
Table 26 Loss of income and costs due to accompanying the patient to hospital by district and
hospital
District Median (Rs.)
(interquartile range)Hospital
Median (Rs.) (interquartile range)
Kurunegala (n=122)
0.00 (0.00-300.00)
TH, Kurunegala (n=85) 0.00 (0.00-0.00)
DH, Dambadeniya (n=37)
0.00 (0.00-00.00)
Polonnaruwa (n=121)
0.00 (0.00-50.00)
GH, Polonnaruwa (n=96)
0.00 (0.00-50.00)
BH, Medirigiriya (n=25) 0.00 (0.00-30.00)
Total 0.00
(0.00-60.00) Total
0.00 (0.00-60.00)
Overall 91.8% of households (90.2% in Kurunegala and 93.4% in Polonnaruwa) incurred a cost
for visiting the patient. Costs incurred by the patient’s household for visiting the patient in hospital
are summarized in Table 27 by district and hospital. Travel costs incurred for bringing food to the
patient from home are also included.
Table 27 Costs incurred by the household for visiting the patient in hospital by district and hospital
District Median(Rs.) (interquartile range)
Hospital Median(Rs.)
(interquartile range)
Kurunegala (n=122)
506.00 (200.00-1112.50)
TH, Kurunegala (n=85)540.00
(205.00-1300.00) DH, Dambadeniya
(n=37) 440.00
(190.00-895.00)
Polonnaruwa (n=121)
525.00 (300.00-885.00)
GH, Polonnaruwa (n=96)
550.00 (316.25-937.50)
BH, Medirigiriya (n=25)400.00
(215.00-845.00)
Total 510.00
(264.00-950.00) Total
510.00 (264.00-950.00)
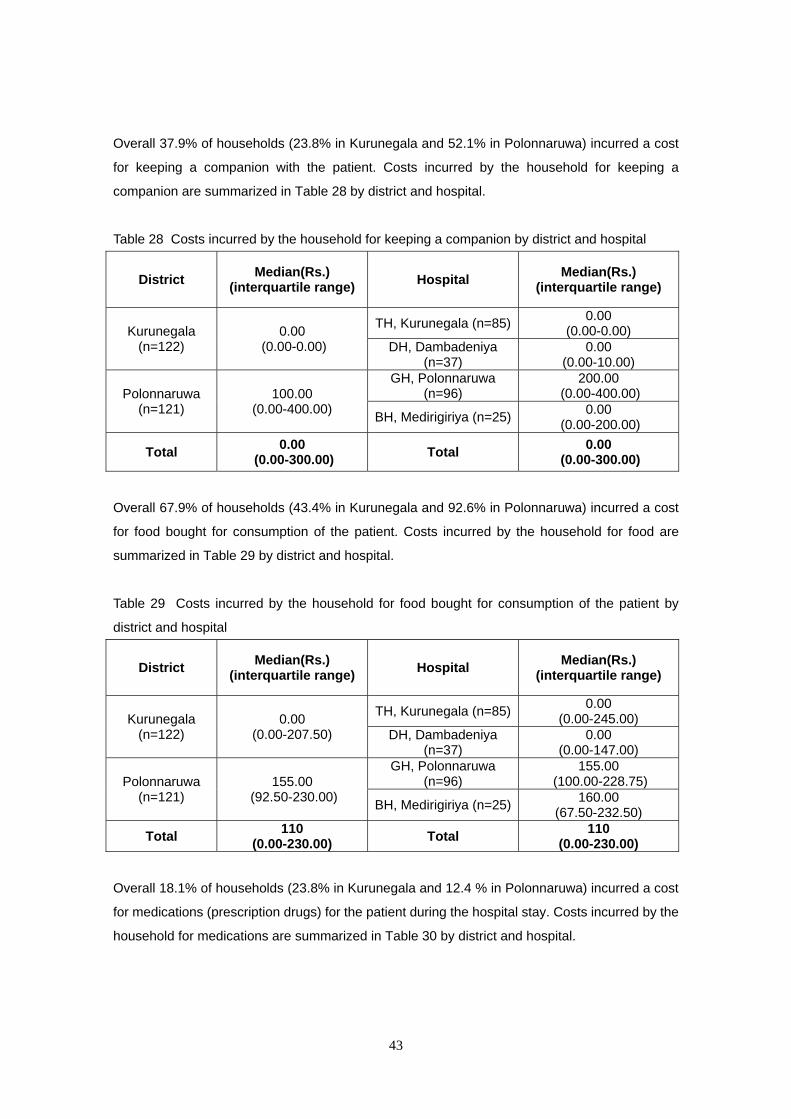
43
Overall 37.9% of households (23.8% in Kurunegala and 52.1% in Polonnaruwa) incurred a cost
for keeping a companion with the patient. Costs incurred by the household for keeping a
companion are summarized in Table 28 by district and hospital.
Table 28 Costs incurred by the household for keeping a companion by district and hospital
District Median(Rs.)
(interquartile range) Hospital
Median(Rs.) (interquartile range)
Kurunegala (n=122)
0.00 (0.00-0.00)
TH, Kurunegala (n=85)0.00
(0.00-0.00) DH, Dambadeniya
(n=37) 0.00
(0.00-10.00)
Polonnaruwa (n=121)
100.00 (0.00-400.00)
GH, Polonnaruwa (n=96)
200.00 (0.00-400.00)
BH, Medirigiriya (n=25)0.00
(0.00-200.00)
Total 0.00
(0.00-300.00) Total
0.00 (0.00-300.00)
Overall 67.9% of households (43.4% in Kurunegala and 92.6% in Polonnaruwa) incurred a cost
for food bought for consumption of the patient. Costs incurred by the household for food are
summarized in Table 29 by district and hospital.
Table 29 Costs incurred by the household for food bought for consumption of the patient by
district and hospital
District Median(Rs.)
(interquartile range) Hospital
Median(Rs.) (interquartile range)
Kurunegala (n=122)
0.00 (0.00-207.50)
TH, Kurunegala (n=85)0.00
(0.00-245.00) DH, Dambadeniya
(n=37) 0.00
(0.00-147.00)
Polonnaruwa (n=121)
155.00 (92.50-230.00)
GH, Polonnaruwa (n=96)
155.00 (100.00-228.75)
BH, Medirigiriya (n=25)160.00
(67.50-232.50)
Total 110
(0.00-230.00) Total
110 (0.00-230.00)
Overall 18.1% of households (23.8% in Kurunegala and 12.4 % in Polonnaruwa) incurred a cost
for medications (prescription drugs) for the patient during the hospital stay. Costs incurred by the
household for medications are summarized in Table 30 by district and hospital.
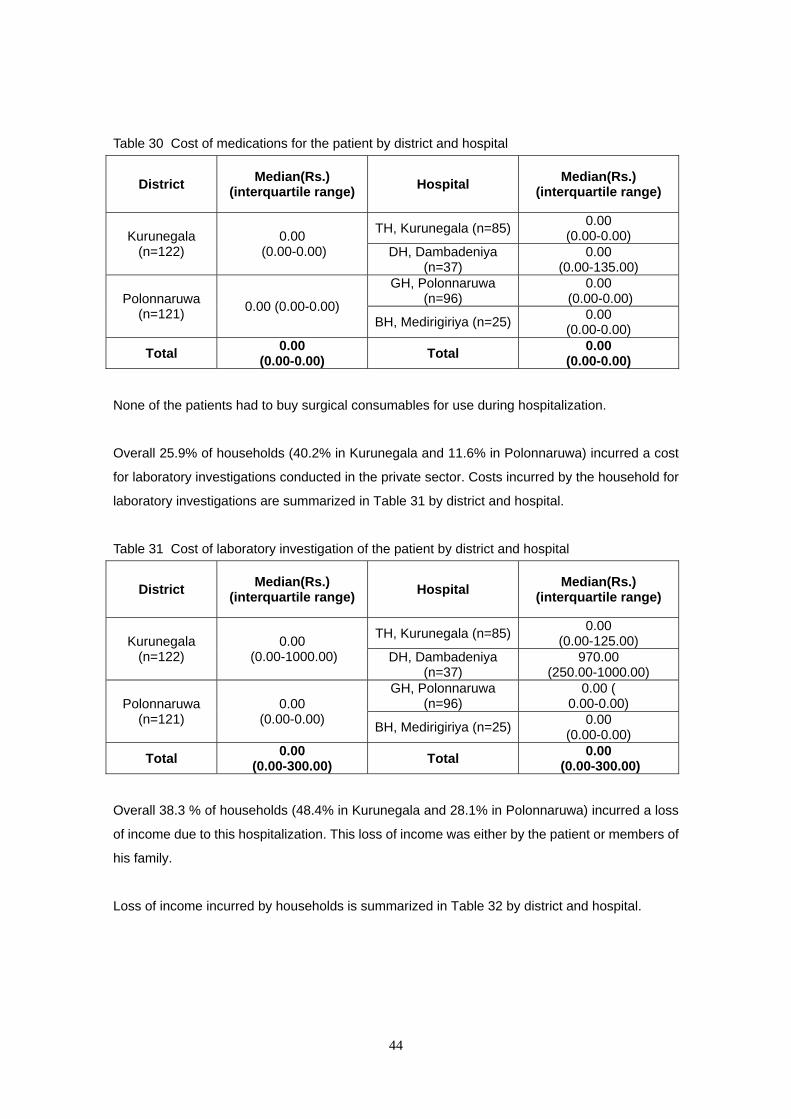
44
Table 30 Cost of medications for the patient by district and hospital
District Median(Rs.)
(interquartile range) Hospital
Median(Rs.) (interquartile range)
Kurunegala (n=122)
0.00 (0.00-0.00)
TH, Kurunegala (n=85)0.00
(0.00-0.00) DH, Dambadeniya
(n=37) 0.00
(0.00-135.00)
Polonnaruwa (n=121)
0.00 (0.00-0.00)
GH, Polonnaruwa (n=96)
0.00 (0.00-0.00)
BH, Medirigiriya (n=25)0.00
(0.00-0.00)
Total 0.00
(0.00-0.00) Total
0.00 (0.00-0.00)
None of the patients had to buy surgical consumables for use during hospitalization.
Overall 25.9% of households (40.2% in Kurunegala and 11.6% in Polonnaruwa) incurred a cost
for laboratory investigations conducted in the private sector. Costs incurred by the household for
laboratory investigations are summarized in Table 31 by district and hospital.
Table 31 Cost of laboratory investigation of the patient by district and hospital
District Median(Rs.)
(interquartile range) Hospital
Median(Rs.) (interquartile range)
Kurunegala (n=122)
0.00 (0.00-1000.00)
TH, Kurunegala (n=85)0.00
(0.00-125.00) DH, Dambadeniya
(n=37) 970.00
(250.00-1000.00)
Polonnaruwa (n=121)
0.00 (0.00-0.00)
GH, Polonnaruwa (n=96)
0.00 ( 0.00-0.00)
BH, Medirigiriya (n=25)0.00
(0.00-0.00)
Total 0.00
(0.00-300.00) Total
0.00 (0.00-300.00)
Overall 38.3 % of households (48.4% in Kurunegala and 28.1% in Polonnaruwa) incurred a loss
of income due to this hospitalization. This loss of income was either by the patient or members of
his family.
Loss of income incurred by households is summarized in Table 32 by district and hospital.

45
Table 32 Loss of income by the patient’s household by district and hospital
District Median(Rs.)
(interquartile range) Hospital
Median(Rs.) (interquartile range)
Kurunegala (n=122)
0.00 (0.00-3000.00)
TH, Kurunegala (n=85)
0.00 (0.00-3375.00)
DH, Dambadeniya (n=37)
800.00 (0.00-2750.00)
Polonnaruwa (n=121)
0.00 (0.00-550.00)
GH, Polonnaruwa (n=96)
0.00 (0.00-720.00)
BH, Medirigiriya (n=25)0.00
(0.00-0.00)
Total 0.00
(0.00-1800.00) Total 0.00 (0.00-1800.00)
All sampled patients incurred a direct household cost due to this hospitalization. Direct cost
comprised travel costs, expenses incurred by accompanying persons, cost of keeping a
companion, cost of food bought, cost of visits by family members, cost of medications bought from
the private sector, cost of investigations conducted in the private sector, cost of other material
required by the patient during hospitalization and any other incidental expenses incurred due to
the hospital stay. The total direct cost incurred by the household is summarized in Table 33 by
district and hospital.
Table 33 Total direct household cost of hospitalization by district and hospital
District Median(Rs.)
(interquartile range) Hospital
Median(Rs.) (interquartile range)
Kurunegala (n=122)
2000.00 (1009.50-3295.00)
TH, Kurunegala (n=85)
1940.00 (925.00-3575.00)
DH, Dambadeniya (n=37)
2150.00 (1036.50-3080.00)
Polonnaruwa (n=121)
1775.00 (1102.50-2857.50)
GH, Polonnaruwa (n=96)
1957.50 (1235.00-3007.50)
BH, Medirigiriya (n=25)
1040.00 (547.50-1860.00)
Total 1875.00
(1053.00-3010.00) Total
1875.00 (1053.00-3010.00)
Total cost of the hospital stay including direct household cost and indirect household cost (loss of
income by patient and other household members) is summarized in Table 34.

46
Table 34 Total household cost (direct and indirect) of hospitalization by district and hospital
District Median(Rs.)
(interquartile range) Hospital
Median(Rs.) (interquartile range)
Kurunegala (n=122)
3036.50 (1722.00-5725.25)
TH, Kurunegala (n=85)3020.00
(1671.00-5792.50) DH, Dambadeniya
(n=37) 3053.00
(1984.00-5500.50)
Polonnaruwa (n=121)
2165.00 (1285.00-3460.00)
GH, Polonnaruwa (n=96)
2460.00 (1390.00-3608.75)
BH, Medirigiriya (n=25)1535.00
(582.50-2513.50)
Total 2640.00
(1450.00-4520.00) Total
2640.00 (1450.00-4520.00)
3.3 Cost of in-patient care for four major non-communicable diseases in Sri Lanka
Data on a minimum of 30 patients admitted due to each of the selected diseases were obtained
from each district for this analysis. Table 35 shows the distribution of patients by hospital and
disease. A minimum of twenty (20) patients with the disease were obtained from the district’s
main referral hospital. The number sampled from the main referral centre had to be increased for
Cerebro-vascular accidents and Myocardial infarction because sufficient numbers were not
available at Base Hospital level.
Table 35 Distribution of patients by hospital and disease
Diagnosis TH,
Kurunegala BH,
DambadeniyaGH,
PolonnaruwaBH,
Medirigiriya Total
Cerebro-vascular accident
23 07 28 02 60
Myocardial infarction
20 10 27 04 61
Ischaemic heart disease
21 12 20 10 63
Diabetes mellitus 20 10 20 11 61
Total 84 39 95 27 245
Table 36 shows the median duration of stay by hospital and disease. The longest duration of 6
days was observed for stroke patients at TH, Kurunegala. Shortest duration of stay (2 days) was
observed for stroke patients at GH, Polonnaruwa.

47
Table 36 Median duration of stay (interquartile range) by hospital and disease
Diagnosis TH,
Kurunegala BH,
DambadeniyaGH,
PolonnaruwaBH,
Medirigiriya Total
Cerebro-vascular accident
6 (5-11)
3 (1-3)
2 (2-3)
5.5 (3-8)
3 (2-6)
Myocardial infarction
4.5 (3.75-5.25)
5.5 (4.75-6.25)
4 (4-4)
3 (3-3.75)
4 (4-5)
Ischaemic heart disease
3 (2-4)
4 (2.25-4.75)
3.5 (3-4)
4 (3-4)
4 (2-4)
Diabetes mellitus 4.5
(1.25-5.75) 4.5
(2.75-6.75) 3
(2.25-4.75) 4
(2-7) 4
(2-5)
1) Cerebro-vascular accidents (CVA)
Out of the patient-specific costs incurred in hospital, the cost of investigations was the highest.
The cost of intravenous fluids was the lowest. The cost of surgical consumable items was higher
than the cost of drugs.
Table 37 Median cost of different elements of in-patient care for Cerebro-vascular accident
Hospital Investigations Surgical
consumables IV fluids Medications
TH, Kurunegala
3704.07 (3379.70-4206.33)
161.20 (130.66-329.87)
48.64 (0-97.28)
216.14 (120.84-622.67)
BH, Dambadeniya
632.96 (501.99-644.61)
0 (0-127.70)
0 (0-0)
4.73 (0.99-8.27)
GH, Polonnaruwa 1576.29
(1066.41-2736.00)209.81
(127.70-419.61) 0
(0-48.64) 68.68
(34.05-152.69)
BH, Medirigiriya
130.97 (130.97-130.97)
339.74 (127.70-551.77)
0 (0-0)
698.29 (460.44-936.15)
Total 2398.59
(1066.41-3565.21)159.72
(127.70-419.61) 0
(0-83.82) 101.12
(33.22-274.90)
Accommodation cost of patients was highest in Teaching Hospital, Kurunegala which has a
specialized unit for the management of strokes.
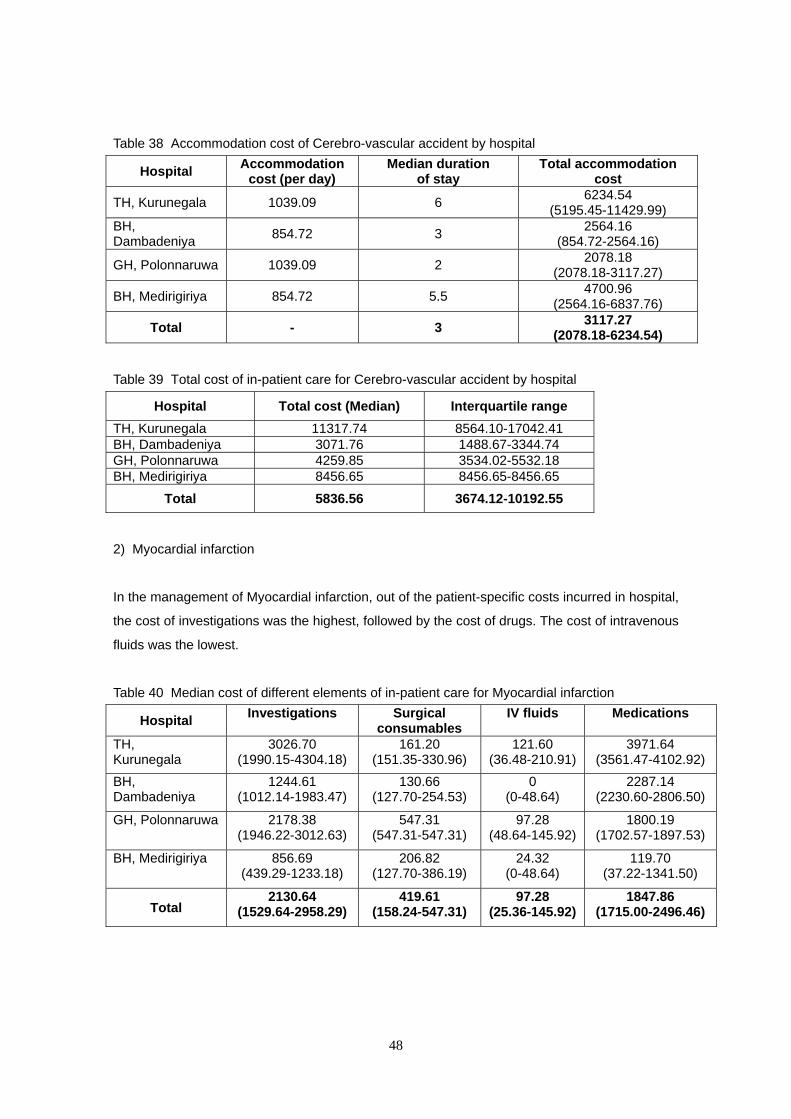
48
Table 38 Accommodation cost of Cerebro-vascular accident by hospital
Hospital Accommodation
cost (per day) Median duration
of stay Total accommodation
cost
TH, Kurunegala 1039.09 6 6234.54
(5195.45-11429.99) BH, Dambadeniya
854.72 3 2564.16
(854.72-2564.16)
GH, Polonnaruwa 1039.09 2 2078.18
(2078.18-3117.27)
BH, Medirigiriya 854.72 5.5 4700.96
(2564.16-6837.76)
Total - 3 3117.27
(2078.18-6234.54)
Table 39 Total cost of in-patient care for Cerebro-vascular accident by hospital
Hospital Total cost (Median) Interquartile range
TH, Kurunegala 11317.74 8564.10-17042.41 BH, Dambadeniya 3071.76 1488.67-3344.74 GH, Polonnaruwa 4259.85 3534.02-5532.18 BH, Medirigiriya 8456.65 8456.65-8456.65
Total 5836.56 3674.12-10192.55
2) Myocardial infarction
In the management of Myocardial infarction, out of the patient-specific costs incurred in hospital,
the cost of investigations was the highest, followed by the cost of drugs. The cost of intravenous
fluids was the lowest.
Table 40 Median cost of different elements of in-patient care for Myocardial infarction
Hospital Investigations Surgical
consumables IV fluids Medications
TH, Kurunegala
3026.70 (1990.15-4304.18)
161.20 (151.35-330.96)
121.60 (36.48-210.91)
3971.64 (3561.47-4102.92)
BH, Dambadeniya
1244.61 (1012.14-1983.47)
130.66 (127.70-254.53)
0 (0-48.64)
2287.14 (2230.60-2806.50)
GH, Polonnaruwa 2178.38 (1946.22-3012.63)
547.31 (547.31-547.31)
97.28 (48.64-145.92)
1800.19 (1702.57-1897.53)
BH, Medirigiriya 856.69 (439.29-1233.18)
206.82 (127.70-386.19)
24.32 (0-48.64)
119.70 (37.22-1341.50)
Total 2130.64
(1529.64-2958.29)419.61
(158.24-547.31) 97.28
(25.36-145.92) 1847.86
(1715.00-2496.46)
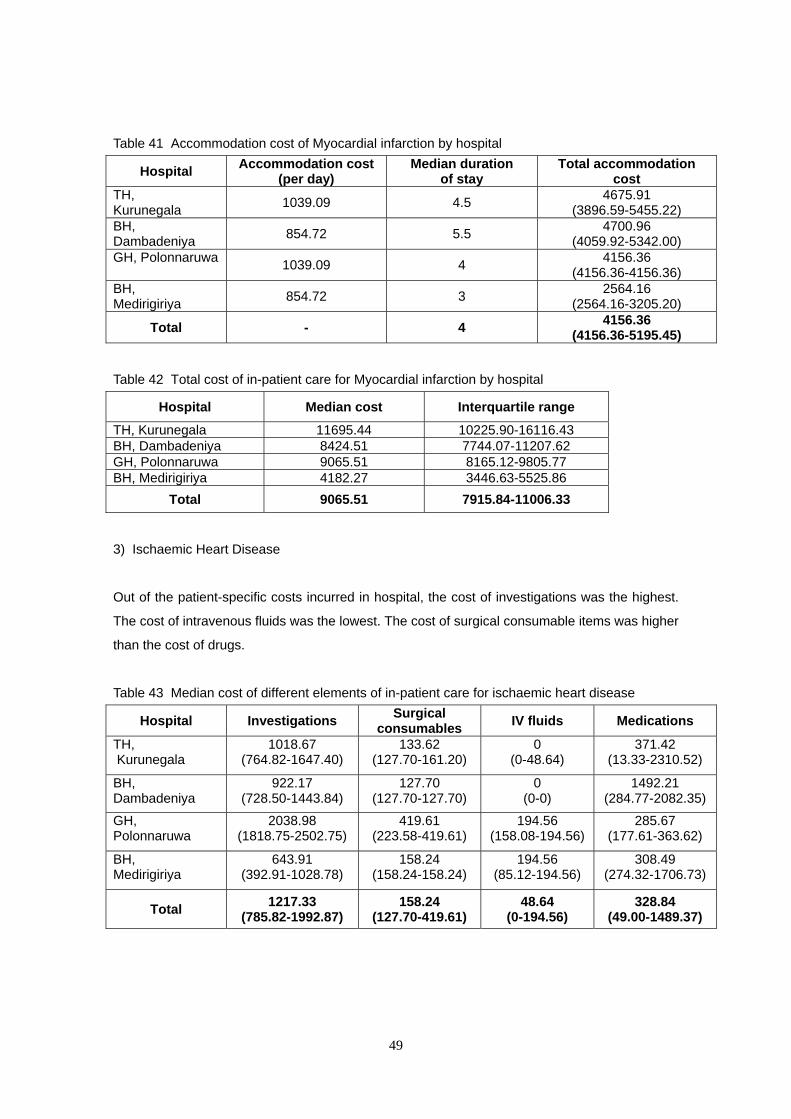
49
Table 41 Accommodation cost of Myocardial infarction by hospital
Hospital Accommodation cost
(per day) Median duration
of stay Total accommodation
cost TH, Kurunegala
1039.09 4.5 4675.91
(3896.59-5455.22) BH, Dambadeniya
854.72 5.5 4700.96
(4059.92-5342.00) GH, Polonnaruwa
1039.09 4 4156.36
(4156.36-4156.36) BH, Medirigiriya
854.72 3 2564.16
(2564.16-3205.20)
Total - 4 4156.36
(4156.36-5195.45)
Table 42 Total cost of in-patient care for Myocardial infarction by hospital
Hospital Median cost Interquartile range
TH, Kurunegala 11695.44 10225.90-16116.43 BH, Dambadeniya 8424.51 7744.07-11207.62 GH, Polonnaruwa 9065.51 8165.12-9805.77 BH, Medirigiriya 4182.27 3446.63-5525.86
Total 9065.51 7915.84-11006.33
3) Ischaemic Heart Disease
Out of the patient-specific costs incurred in hospital, the cost of investigations was the highest.
The cost of intravenous fluids was the lowest. The cost of surgical consumable items was higher
than the cost of drugs.
Table 43 Median cost of different elements of in-patient care for ischaemic heart disease
Hospital Investigations Surgical
consumables IV fluids Medications
TH, Kurunegala
1018.67 (764.82-1647.40)
133.62 (127.70-161.20)
0 (0-48.64)
371.42 (13.33-2310.52)
BH, Dambadeniya
922.17 (728.50-1443.84)
127.70 (127.70-127.70)
0 (0-0)
1492.21 (284.77-2082.35)
GH, Polonnaruwa
2038.98 (1818.75-2502.75)
419.61 (223.58-419.61)
194.56 (158.08-194.56)
285.67 (177.61-363.62)
BH, Medirigiriya
643.91 (392.91-1028.78)
158.24 (158.24-158.24)
194.56 (85.12-194.56)
308.49 (274.32-1706.73)
Total 1217.33
(785.82-1992.87) 158.24
(127.70-419.61) 48.64
(0-194.56) 328.84
(49.00-1489.37)
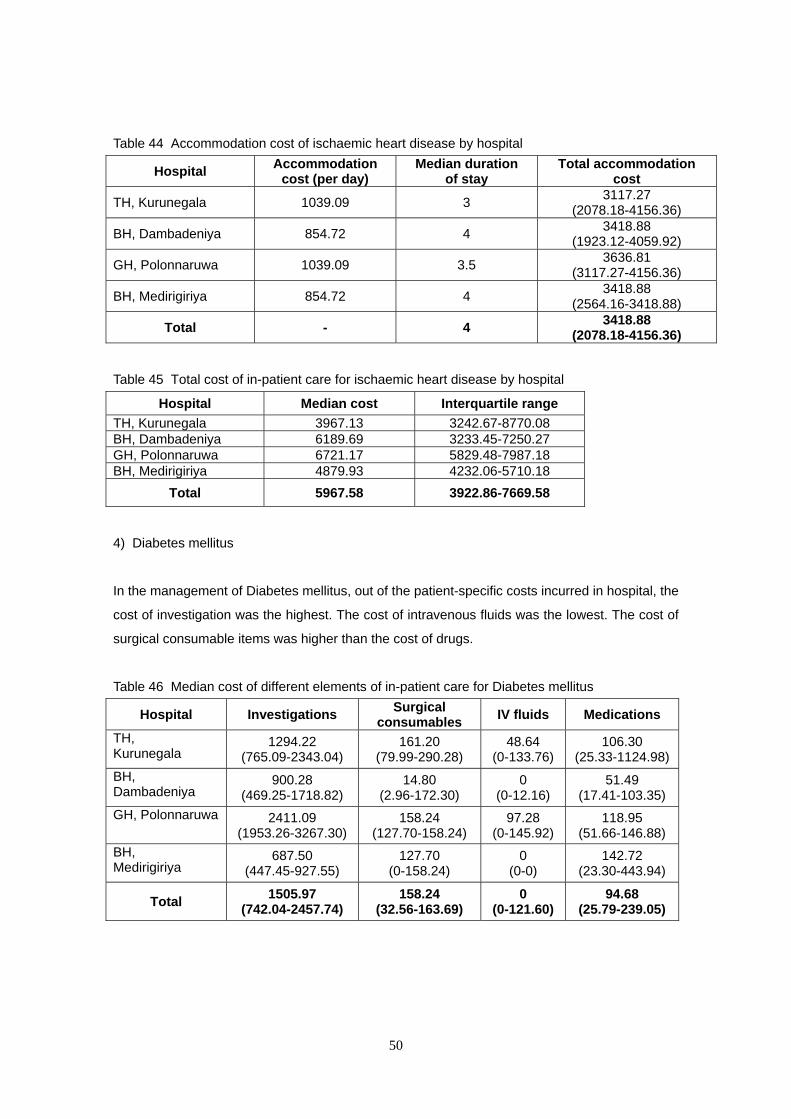
50
Table 44 Accommodation cost of ischaemic heart disease by hospital
Hospital Accommodation
cost (per day) Median duration
of stay Total accommodation
cost
TH, Kurunegala 1039.09 3 3117.27
(2078.18-4156.36)
BH, Dambadeniya 854.72 4 3418.88
(1923.12-4059.92)
GH, Polonnaruwa 1039.09 3.5 3636.81
(3117.27-4156.36)
BH, Medirigiriya 854.72 4 3418.88
(2564.16-3418.88)
Total - 4 3418.88
(2078.18-4156.36)
Table 45 Total cost of in-patient care for ischaemic heart disease by hospital
Hospital Median cost Interquartile range
TH, Kurunegala 3967.13 3242.67-8770.08 BH, Dambadeniya 6189.69 3233.45-7250.27 GH, Polonnaruwa 6721.17 5829.48-7987.18 BH, Medirigiriya 4879.93 4232.06-5710.18
Total 5967.58 3922.86-7669.58
4) Diabetes mellitus
In the management of Diabetes mellitus, out of the patient-specific costs incurred in hospital, the
cost of investigation was the highest. The cost of intravenous fluids was the lowest. The cost of
surgical consumable items was higher than the cost of drugs.
Table 46 Median cost of different elements of in-patient care for Diabetes mellitus
Hospital Investigations Surgical
consumables IV fluids Medications
TH, Kurunegala
1294.22 (765.09-2343.04)
161.20 (79.99-290.28)
48.64 (0-133.76)
106.30 (25.33-1124.98)
BH, Dambadeniya
900.28 (469.25-1718.82)
14.80 (2.96-172.30)
0 (0-12.16)
51.49 (17.41-103.35)
GH, Polonnaruwa 2411.09 (1953.26-3267.30)
158.24 (127.70-158.24)
97.28 (0-145.92)
118.95 (51.66-146.88)
BH, Medirigiriya
687.50 (447.45-927.55)
127.70 (0-158.24)
0 (0-0)
142.72 (23.30-443.94)
Total 1505.97
(742.04-2457.74) 158.24
(32.56-163.69) 0
(0-121.60)94.68
(25.79-239.05)
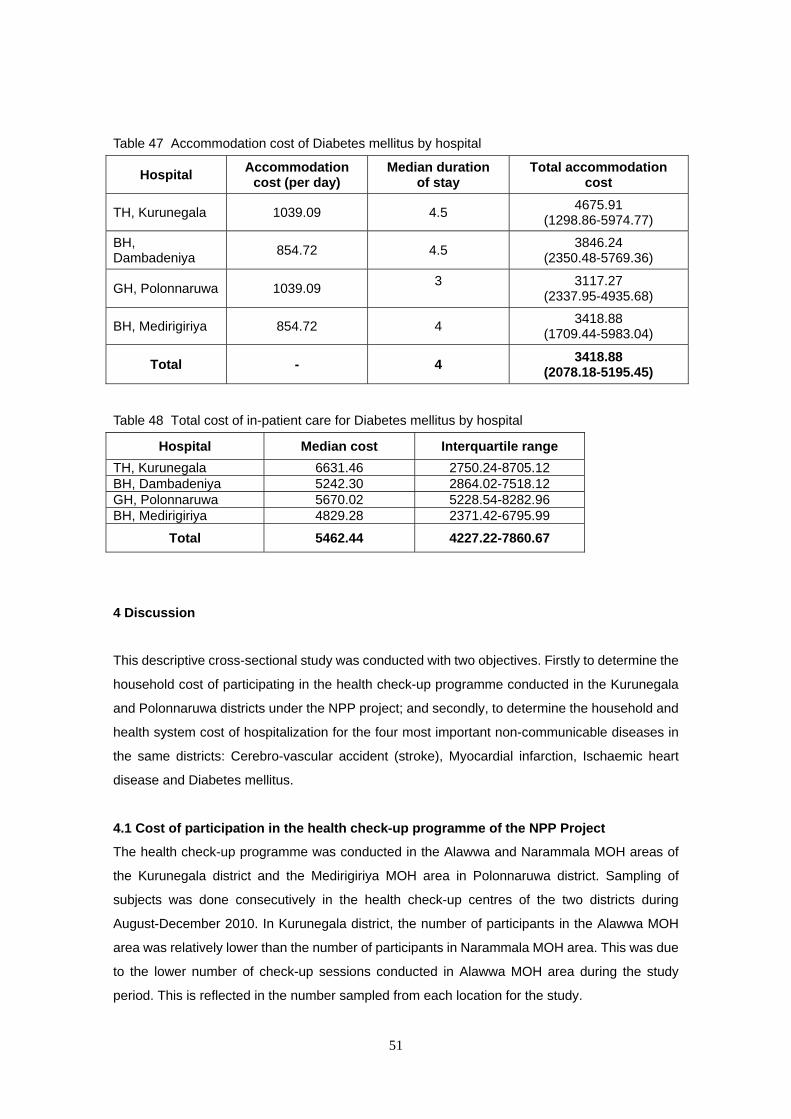
51
Table 47 Accommodation cost of Diabetes mellitus by hospital
Hospital Accommodation
cost (per day) Median duration
of stay Total accommodation
cost
TH, Kurunegala 1039.09 4.5 4675.91
(1298.86-5974.77)
BH, Dambadeniya
854.72 4.5 3846.24
(2350.48-5769.36)
GH, Polonnaruwa 1039.09 3
3117.27 (2337.95-4935.68)
BH, Medirigiriya 854.72 4 3418.88
(1709.44-5983.04)
Total - 4 3418.88
(2078.18-5195.45)
Table 48 Total cost of in-patient care for Diabetes mellitus by hospital
Hospital Median cost Interquartile range
TH, Kurunegala 6631.46 2750.24-8705.12 BH, Dambadeniya 5242.30 2864.02-7518.12 GH, Polonnaruwa 5670.02 5228.54-8282.96 BH, Medirigiriya 4829.28 2371.42-6795.99
Total 5462.44 4227.22-7860.67
4 Discussion
This descriptive cross-sectional study was conducted with two objectives. Firstly to determine the
household cost of participating in the health check-up programme conducted in the Kurunegala
and Polonnaruwa districts under the NPP project; and secondly, to determine the household and
health system cost of hospitalization for the four most important non-communicable diseases in
the same districts: Cerebro-vascular accident (stroke), Myocardial infarction, Ischaemic heart
disease and Diabetes mellitus.
4.1 Cost of participation in the health check-up programme of the NPP Project
The health check-up programme was conducted in the Alawwa and Narammala MOH areas of
the Kurunegala district and the Medirigiriya MOH area in Polonnaruwa district. Sampling of
subjects was done consecutively in the health check-up centres of the two districts during
August-December 2010. In Kurunegala district, the number of participants in the Alawwa MOH
area was relatively lower than the number of participants in Narammala MOH area. This was due
to the lower number of check-up sessions conducted in Alawwa MOH area during the study
period. This is reflected in the number sampled from each location for the study.
52
The target group for the check-up programme is the general population between 40-75 years of
age living in the respective MOH areas. A majority of the attendees at the check-ups were
between 50-59 years of age. There were a few participants under 40 years of age in the sample
indicating problems in recruitment. The differences in the pattern of health seeking-behaviour
between people of different age groups may be an underlying reason for unequal representation
of age groups. Recruitment strategies used by the health workers could have been responsible,
as the invitation to participate may have been confined to specific population groups.
A large majority of the participants (70%) were female. Female preponderance in health seeking
is well documented. Invitations for participating in health check-ups are done through the health
system. In Polonnaruwa, a public health midwives are responsible for this task whereas in
Kurunegala, participants are invited through the health institutions. A large proportion of the
sample being female reflects better health seeking behaviour, higher contact with the health
system, especially the public health midwives and higher acceptance of services by females.
Relatively few women in rural communities engage in formal occupations making it possible for
them to attend the check-ups during weekdays. In contrast, men employed in both the formal and
informal sector could have been severely under-represented due to unwillingness to participate
and difficulties in taking time off from work. The majority of those affected by NCDs, as reflected in
the statistics of the selected hospitals, were male, raising a concern about this pattern.
A majority of the participants were unemployed. Of those employed, a large proportion were
employed in the informal sector. People involved in agriculture comprised the majority of the
sample. Check-up sessions were mostly held on weekdays and many people employed in the
formal sector may not have had the opportunity to attend due to the need to apply for leave.
Others may have been reluctant to lose a day’s wages. People in occupational groups that can be
classified as sedentary (e.g. professionals, technicians as well as associate professionals and
clerks) comprised less than 5% of the sample.
Only a few participants from both districts had received higher education. Over 86% had received
secondary education in Kurunegala district as compared to only 66% in Polonnaruwa district.
Overall, participants in Kurunegala district had a higher level of educational attainment compared
to participants from Polonnaruwa district. This may reflect the differences in the educational level
of the general population in the two districts.
More than half the sample reported having a monthly family income of less than Rs. 10,000.
Ninety-five percent of the sample reported drawing an income less than Rs. 50,000. Reported
53
income by research subjects is usually considered to be an underestimate. In these two districts
many households own agricultural land and fixed assets that generate non-monetary income,
which may have been under-estimated in reported income.
Median family size was 4, comparable to results of other demographic studies conducted in Sri
Lanka in the same period.
Approximately 42% walked to the check-up centre indicating close proximity to their residences.
Over 60% walked or cycled - thereby not incurring any travel costs. The commonest mode of
transport used was the bus. The other common mode was the motorcycle. In Kurunegala a
majority incurred travel costs, while in Polonnaruwa a majority did not incur any travel costs. This
may be explained by the longer distance the participants had to travel to reach the clinic in
Kurunegala district. The differences in the social structure, rural-urban characteristics,
accessibility and common modes of travelling in the two areas could have contributed to this
difference to a lesser degree.
The other main cost item was incidental expenses incurred during the visit, which mainly included
the cost of snacks, tea and any other food bought during the visit. In Kurunegala this was
substantial. In Polonnaruwa, this was minimal. Travel costs and incidental expenses of the visit
were considered as direct costs of the visit. Total direct costs were higher in Kurunegala than in
Polonnaruwa. Median direct costs were also considerably higher in Kurunegala. This may be due
to the longer distance and relatively more urban features in Kurunegala when compared to
Polonnaruwa, resulting in greater expense.
In Kurunegala a larger proportion reported loss of income to the family due to the visit. The
amount of lost income was comparable in the two districts. Although a relatively larger proportion
of daily wage earners are living in these two districts, the informal nature of their occupations may
have limited them from identifying the amount lost due to this visit.
4.2 Household cost of hospitalization for four major non-communicable diseases in Sri
Lanka
For this component, a larger proportion of patients had to be sampled from the two main hospitals
due to insufficient numbers at base hospital level. Considering the importance and life-threatening
nature of some of the selected conditions, patients with some types of NCDs are rarely admitted
to Base Hospitals, especially in Polonnaruwa district where the facilities available at Base
Hospital level are limited.

54
More than 90% of the patients were above 45 years of age reflecting the fact that NCDs become
commoner with advancing age.
Nearly 70% of the total sample was male and the proportion of males was higher in the
Polonnaruwa district. This reflects the higher risk for NCDs in males.
In contrast to the participant profile of the check-ups, all occupational groups were represented in
this sample of patients. One third of patients were unemployed. The largest occupational group
hospitalized were agricultural workers comprising over one fourth of the total sample. Despite
agricultural work (farming) being an occupation that involves high levels of physical activity, many
farmers seem to experience NCDs. Presence of many other risk factors that predispose to
development of NCDs seem to have outweighed the advantages of an active lifestyle. The risk of
NCDs that affect every level of social class was reflected in all the occupational groups being
represented in the sample.
Nearly half of the participants were educated above grade 5, but less than 5% had received
higher education. The group who had not received any formal education was about 12%. This
appears higher than the national rates and could be due to the limitations in infrastructure in some
parts of these two districts even in the latter half of the 20th century.
About 9% of patients reported a monthly family income of less than Rs. 5,000.00 and only about
36% reported a monthly family income above Rs. 20,000.00. These reports may reflect the
economic conditions of the patients seeking in-patient care at state sector hospitals in these
districts.
Median family size was similar to that reported in the demographic surveys in Sri Lanka.
A majority of patients arrived in hospital by hired three-wheeler while a considerable proportion
used the bus. On discharge, many patients hoped to go home by hired three-wheeler while the
number hoping to use the bus was greater than the number that arrived by bus. These represent
the commonest modes of transport available for emergency and non-emergency situations in
these districts. About 11% of the participants used their own three-wheeler, reflecting the
availability of user-owned transport facilities.
Travel costs were incurred by about 96% of the hospitalized patients in the Kurunegala district
and all the patients in Polonnaruwa district. On average Rs. 400 was spent on travel. The travel
55
costs of those who had been admitted in referral centres were higher, with an average of Rs.
400-500. The lower cost of travel to Base Hospitals indicates the shorter distances involved.
Loss of patient income and costs incurred by the patient’s household due to accompanying the
patient to hospital were not substantial. This may be due to many family members being involved
in non-formal occupations and problems of estimating and quantifying the loss of income in these
occupations.
A large majority of families incurred a cost for visiting the patient in hospital or transporting food
from home. On average, visits by family members amounted to Rs. 400-500 during the entire stay
at all levels of hospitals.
The costs of keeping a companion were not substantial in these settings. 25-50% of patients had
to keep a companion. These companions were non-professional carers and could be relatives or
friends of the patient, and may not charge a fee. In these situations the cost incurred for a
companion will mainly involve the cost of travel and subsistence. This finding reflects the informal
nature of patient care practices at the institutional level.
Another important element is the food bought for consumption of the patient. Over 2/3 of families
spent money on food. The limited variation and the poor quality of the hospital diet as well as
accessibility problems in providing home cooked food would have led to food being bought from
vendors in and around the hospital premises.
Overall 12-24% of households incurred a cost for medications (prescription drugs) for the patient
during the hospital stay and about 26% of households incurred a cost for laboratory investigations
of the patient conducted in the private sector. The percentage that had to get an investigation
done from the private sector was as high as 40% in Kurunegala. These indicate a growing
problem in Sri Lankan health sector. Non-availability of necessary and important drugs for
treatment of NCDs within the hospital is a serious shortcoming at present. Lack of infrastructure
and resources to meet the demand for laboratory investigations and non-availability of modern
investigation facilities in the hospitals leads to requests for private investigations. In settings like
Kurunegala where private pharmacies and laboratories are widely available and more families
can afford these services, accessing services from the private sector is likely to be more common
in contrast to Polonnaruwa.
56
None of the patients had to buy consumable items such as intravenous cannula or injection
syringes for use during hospitalization. This is an encouraging finding in this study.
Loss of income experienced by the entire family due to hospitalization for this episode of illness
affected about 38.3 % of households. This percentage was close to 50% in the Kurunegala district.
In both these districts it can be expected that the proportion occupied in the informal sector is
greater than the proportion occupied in the formal sector. The loss of income associated with
being away from work is generally greater in the informal sector. Therefore the percentage
reporting a loss of income in this study could be an under-estimate as many patients may find it
difficult to quantify the loss of income in the informal sector, especially in the self-employed
agricultural sector.
All sampled patients incurred a direct household cost due to this hospitalization. The direct cost
comprised travel costs, expenses incurred by accompanying persons, the cost of keeping a
companion, cost of food bought, cost of visits by family members, cost of medications bought from
the private sector, cost of investigations conducted in the private sector, cost of other material
required by the patient during hospitalization and any other incidental expenses incurred due to
the hospital stay. The total direct cost of a hospitalization is around Rs. 2,000. The total cost of the
hospital stay including direct household cost and indirect household cost (loss of income by
patient and other household members) ranges from Rs. 2,000-3,000. This is a substantial
proportion of the monthly family income specially in settings where more than 60% of families
report a monthly income less than Rs. 20,000.
4.3 Cost of in-patient care for four major non-communicable diseases in Sri Lanka
The number of patients admitted due to MI and CVA was markedly small in Base Hospitals. Due
to the severity and the life-threatening nature of these conditions and improved health seeking
behaviour, patients are more likely to get admitted to a larger hospital with these conditions.
The median duration of stay was 3 days for CVA and 4 days for Myocardial infarction, ischaemic
heart disease and Diabetes mellitus. In general, after initiating treatment, management of CVA is
largely conservative and patients are discharged early. In the specialized neurology unit in
Kurunegala, hospital stay for CVA was markedly longer (6 days). Due to being one of the few
specialized neurology units in the country, this unit may get severe cases who need prolonged
care leading to a longer stay in hospital.
57
The accommodation cost of a patient in a medical ward estimated in Teaching Hospital,
Kurunegala was applied as a means of estimating costs in both Teaching Hospital, Kurunegala
and General Hospital, Polonnaruwa. The accommodation cost of a patient in a medical ward
estimated in Base Hospital, Marawila was applied for both Base Hospitals, Dambadeniya and
Medirigiriya.
The cost of intravenous fluids used in the management of the four conditions was low. There was
a wide variation in the pattern of use across hospitals even for managing the same condition. This
may have been due to differences in individual patient requirements as well as differences in
management protocols adopted across settings.
1) Cerebro-vascular accident (CVA)
Out of the patient-specific costs incurred in hospital, the highest cost was the cost of
investigations. This was higher in referral centres where advanced facilities are available. The
cost of intravenous fluids was the lowest. The cost of surgical consumable items was higher than
the cost of drugs.
The requirement to conduct CT scans in CVA patients can be considered the main reason for the
higher cost of investigations. The cost of drugs and intravenous fluids is minimal due to relatively
low cost of these items and their limited use in CVA management. The need to use many types of
surgical consumables such as urinary catheters and urine bags, intravenous cannulae and
infusion sets contribute to a relatively higher cost for surgical consumables.
The accommodation cost of patients was highest in Teaching Hospital, Kurunegala which has a
specialized neurology unit. This was due to longer duration of stay.
The total cost of a hospitalization episode for a stroke ranged from approximately Rs. 3,100 at
Base Hospital, Dambadeniya to Rs. 11,300 at the neurology unit of Teaching Hospital,
Kurunegala. The median cost across all units was approximately Rs. 5,800. The total median cost
was relatively high in Medirigiriya. In Dambadeniya, at least 25% of stroke patients were
discharged 24 hours after admission resulting in a lower median cost. Higher total cost in
Kurunegala can be attributed to advanced investigation facilities used and longer duration of stay.
The relatively higher cost observed in Medirigiriya may not be representative as only 2 patients
were included from Medirigiriya.

58
2) Myocardial infarction
In the management of Myocardial infarction, out of the patient-specific costs incurred in hospital,
the cost of investigations was the highest, followed by the cost of drugs. The cost of medication
was higher than cost of investigations in both hospitals in the Kurunegala district. The cost of
intravenous fluids was the lowest cost, overall. The number of investigations conducted on a
patient with Myocardial infarction is high. These include a number of ECGs repeated over the
hospital stay as well as many biochemical investigations. The cost of medication includes the cost
of relatively expensive thrombolytic drugs like streptokinase or low molecular weight heparins and
injectable sedatives for pain relief. Due to these reasons cost of investigations and medications
are generally high with only a slight difference depending on the setting.
The average duration of stay was over 4 days except in BH, Medirigiriya where the average stay
was 3 days. Being a life threatening condition that needs optimum care in hospital, patients with
MI would need at least 3 days in hospital.
Except for BH, Medirigiriya, the total cost of managing an MI was over Rs. 8,000 with an average
of Rs. 9,000. The lower cost in Medirigiriya may be due to the shorter duration of stay in hospital
and is limited by having only 4 patients in the sample.
3) Ischaemic Heart Disease
Out of the patient-specific costs incurred in hospital, the cost of investigations was markedly
higher. The cost of intravenous fluids was the lowest. The cost of surgical consumable items was
less than the cost of drugs.
All Ischaemic heart disease patients require investigations for the exclusion of an MI. This
investigation process will include a number of ECG repetitions and biochemical investigations
contributing to a higher cost. As the disease severity is relatively lower than CVA and MI, use of
surgical consumable items is limited in its management. Drugs used in the management of
ischaemic heart disease are mostly oral medications. Although the number of different drugs
ordered for a patient is high, their cost is relatively low.
The average total cost was around Rs. 6,000 per hospitalization across hospitals. The average
total cost was lowest in Kurunegala Teaching Hospital due to the relatively shorter duration of
stay.
59
4) Diabetes mellitus
The cost of investigation was the highest among all patient specific costs in the management of
Diabetes mellitus. The cost of surgical consumable items was higher than the cost of drugs.
Despite many patients being treated with insulin, the cost of drugs was low. This could be due to
the relatively low cost of most oral Diabetes medications.
The average total cost of a hospitalization for Diabetes was around Rs. 5,500. This cost was more
at referral centres than at base hospitals. This may be largely due to the relatively expensive
investigations and medications ordered at referral centres. In Base Hospitals, due to limited
resources these investigations and medications would be obtained from the private sector at the
expense of the patient leading to a lower cost of patient care to the state.
60
References
Constantine G, Herath J, Chang A, Suganthan P, Hewamane B, Thenabadu P. Management of
acute Myocardial infarction in general medical wards in Sri Lanka. Postgrad Med J. 1999 Dec;
75(890): 718-20.
Gunawardene N. Sri Lanka's double burden kills rich and poor alike. Health Millions. 1999
Jul-Aug;25 (4):27.
Kasturiratne A, Wickremasinghe AR, de Silva A. Morbidity pattern and household cost of
hospitalisation for non-communicable diseases (NCDs): a cross-sectional study at tertiary care
level. Ceylon Med J. 2005 Sep; 50 (3):109-13
Premaratne R, Amarasinghe A, Wickremasinghe AR . Hospitalisation trends due to selected
non-communicable diseases in Sri Lanka, 2005-2010. Ceylon Med J. 2005 Jun; 50 (2): 51-4.
Tziomalos K, Charitha N. Weerasingheb, Dimitri P. Mikhailidisa and Alexander M. Seifalian.
Vascular risk factors in South Asians. Int J Cardiol. 2008 Aug 1;128(1):5-16. Epub 2008 Feb 5.
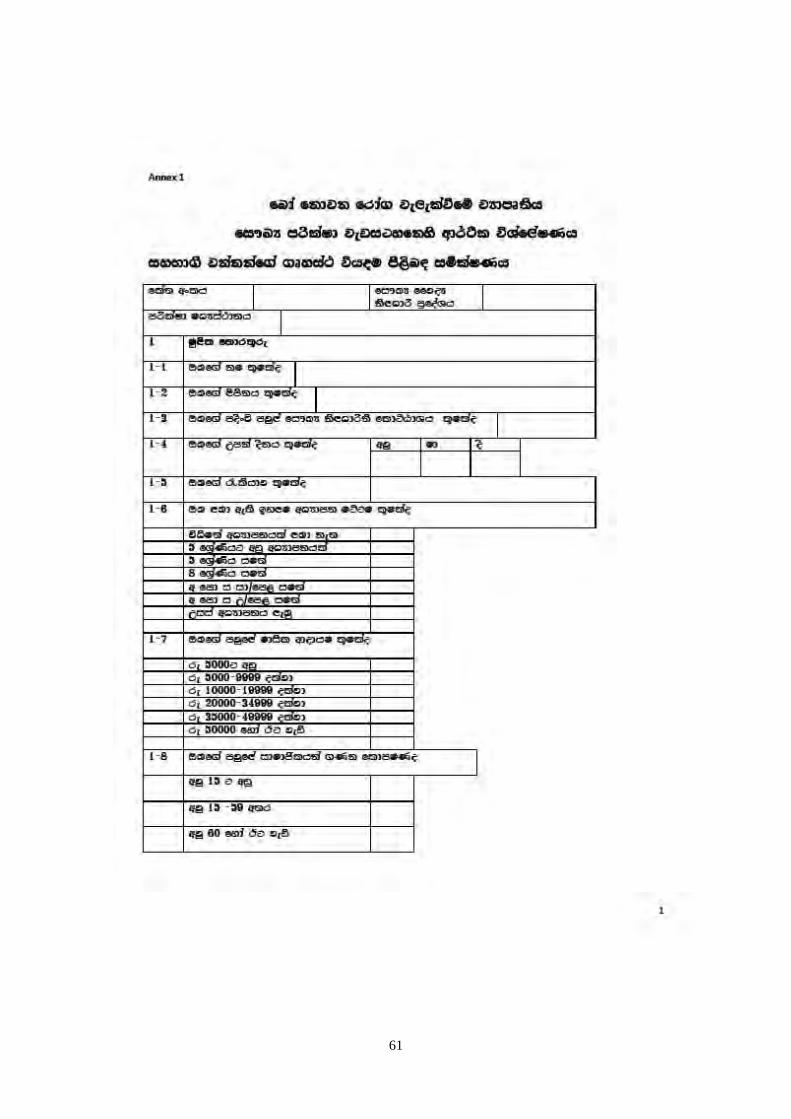
61

62

63

64
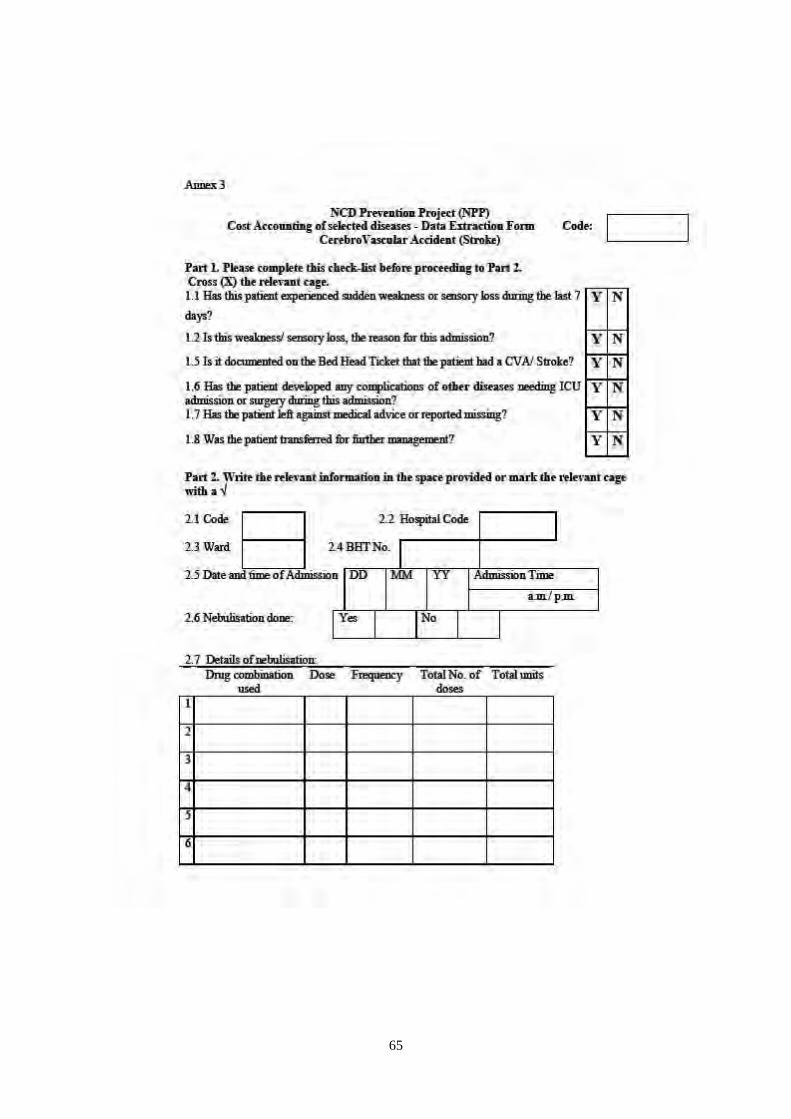
65
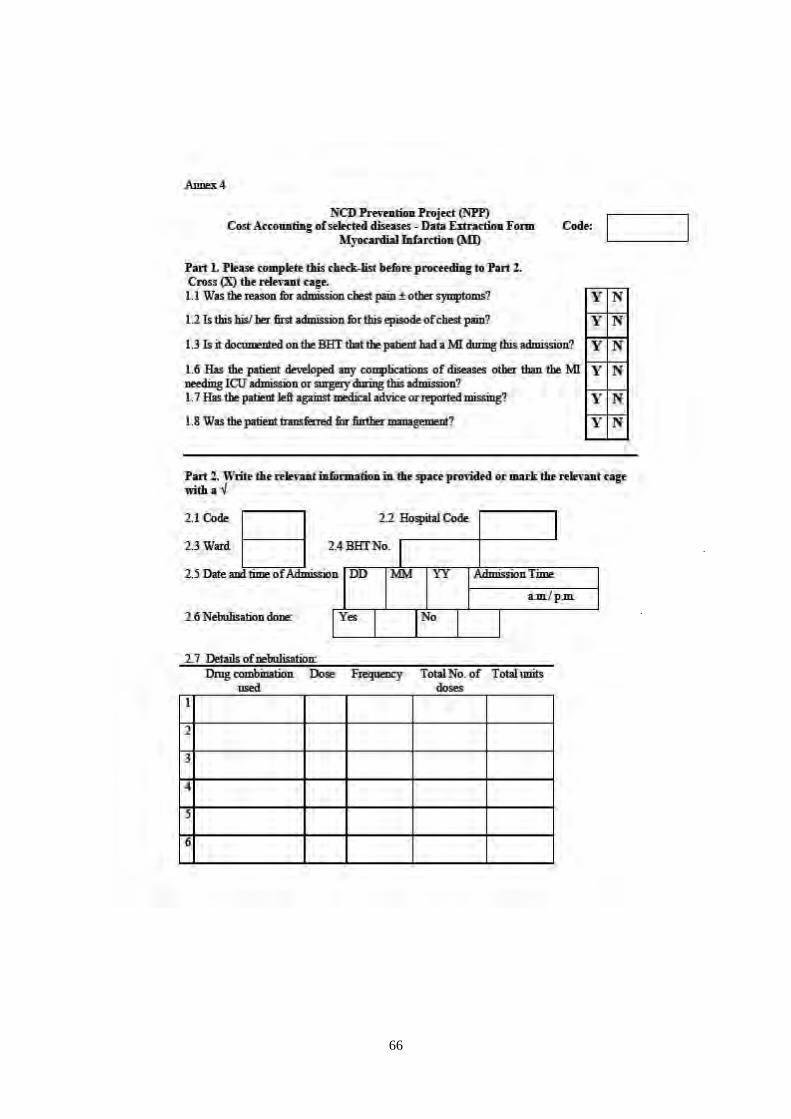
66

67

68


