
Project Profile on Non-Woven Bag (Fully Automatic)
PURPOSE OF THE DOCUMENT
The objective of the pre-feasibility is primarily to facilitate potential entrepreneurs in project
Identification for investment and in order to serve this objective; the document covers various
aspects of the project concept development, startup, marketing, and finance and business
management.
[We can modify the project capacity and project cost as per your requirement. We can also prepare
project report on any subject as per your requirement.
M/S Institute for Industrial Development A unit of
M/S Samadhan Samiti
Delhi Centre: Multi Disciplinary Training Centre,
Gandhi Darshan Rajghat, New Delhi -110002
Lucknow centre :27/1/B Gokhle Marg
Lucknow 226001
Mail : [email protected]
Web : www.iid.org.in
1
Introduction
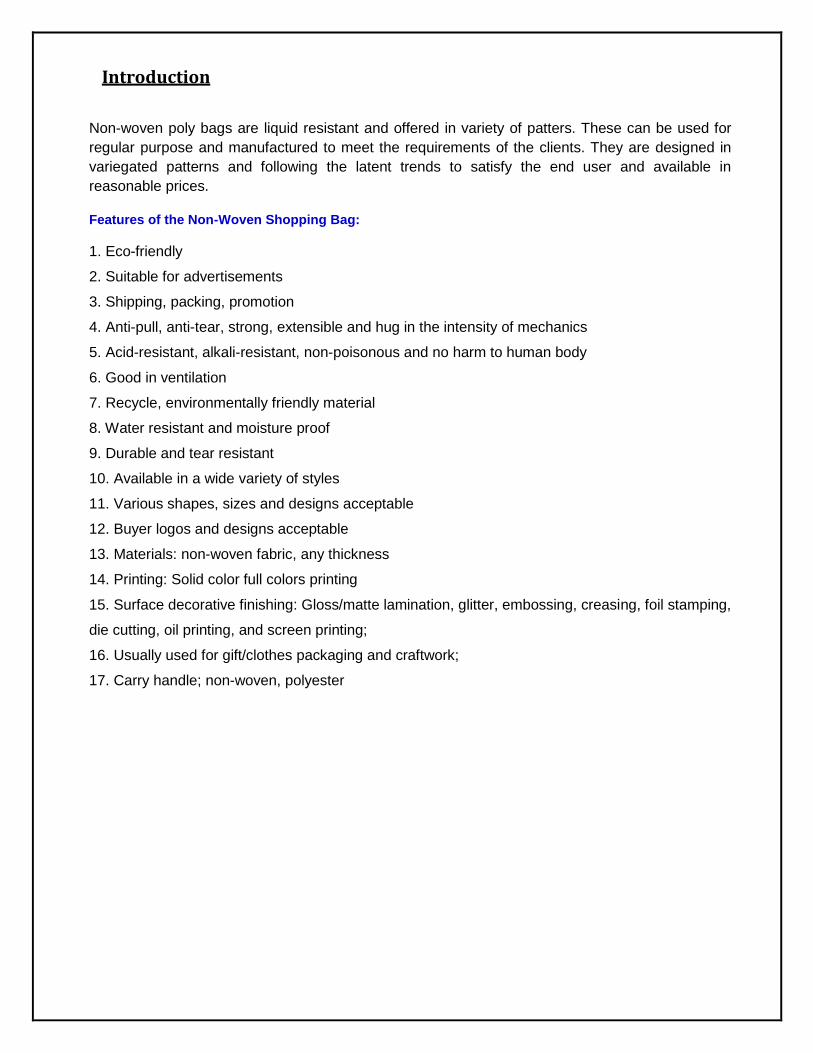
Non-woven poly bags are liquid resistant and offered in variety of patters. These can be used for
regular purpose and manufactured to meet the requirements of the clients. They are designed in
variegated patterns and following the latent trends to satisfy the end user and available in
reasonable prices.
Features of the Non-Woven Shopping Bag:
1. Eco-friendly
2. Suitable for advertisements
3. Shipping, packing, promotion
4. Anti-pull, anti-tear, strong, extensible and hug in the intensity of mechanics
5. Acid-resistant, alkali-resistant, non-poisonous and no harm to human body
6. Good in ventilation
7. Recycle, environmentally friendly material
8. Water resistant and moisture proof
9. Durable and tear resistant
10. Available in a wide variety of styles
11. Various shapes, sizes and designs acceptable
12. Buyer logos and designs acceptable
13. Materials: non-woven fabric, any thickness
14. Printing: Solid color full colors printing
15. Surface decorative finishing: Gloss/matte lamination, glitter, embossing, creasing, foil stamping,
die cutting, oil printing, and screen printing;
16. Usually used for gift/clothes packaging and craftwork;
17. Carry handle; non-woven, polyester

These ecofriendly bags can be reused as these are made from non-woven fabric and hence are
ecofriendly bags can be reused as these are made from non-woven fabric and hence are
ecofriendly. Customization in terms of thickness of the bag, sizes and shapes can be altered as per
client's requirement. These bags are also provided with modifiable side and are available with
standard carry handles or over the Shoulder handles for the easy carrying. Range of packaging
products also include a wide variety of non-woven bags which are manufactured by using good
quality eco- friendly materials like propylene.
These bags are used for serving in various purposes. Non-woven bags are 100% recyclable as
these are manufactured with a durable, liquid resisting and dehumidifying fabric which can be
recycled. Designing of Non-Woven Bags and woven inter lining fabric these bags made from finest
quality basic material. Besides the fact that these bags come in myriad shapes, sizes and volumes,
These can be availed at market leading prices.
Non-Woven Materials are used in Numerous Applications, Including
Baby diapers
Feminine hygiene
Adult incontinence products
Wet wipes
Bandages and wound dressings
Isolation gowns
Surgical gowns
Surgical drapes and covers
Surgical scrub suits
Caps
Gasoline, oil and air - including HEPA filtration
Water, coffee, tea bags
Pharmaceutical industry
Mineral processing
Liquid cartridge and bag filters
Market Potential
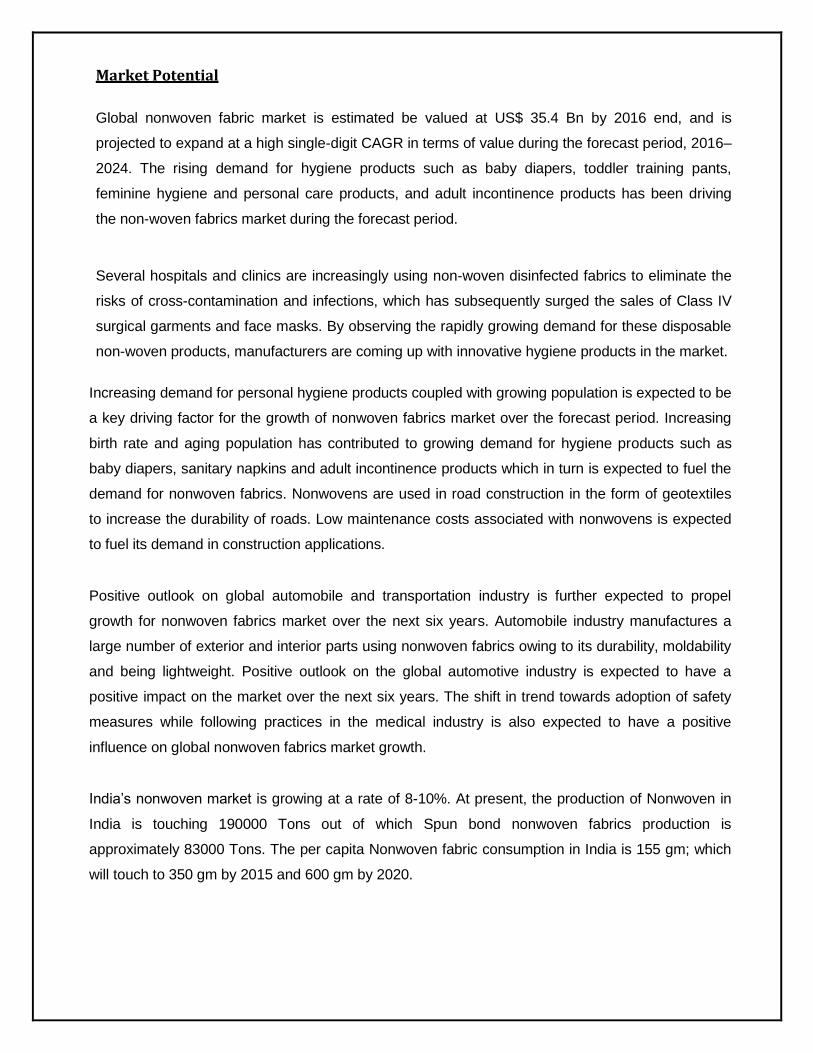
Global nonwoven fabric market is estimated be valued at US$ 35.4 Bn by 2016 end, and is
projected to expand at a high single-digit CAGR in terms of value during the forecast period, 2016–
2024. The rising demand for hygiene products such as baby diapers, toddler training pants,
feminine hygiene and personal care products, and adult incontinence products has been driving
the non-woven fabrics market during the forecast period.
Several hospitals and clinics are increasingly using non-woven disinfected fabrics to eliminate the
risks of cross-contamination and infections, which has subsequently surged the sales of Class IV
surgical garments and face masks. By observing the rapidly growing demand for these disposable
non-woven products, manufacturers are coming up with innovative hygiene products in the market.
Increasing demand for personal hygiene products coupled with growing population is expected to be
a key driving factor for the growth of nonwoven fabrics market over the forecast period. Increasing
birth rate and aging population has contributed to growing demand for hygiene products such as
baby diapers, sanitary napkins and adult incontinence products which in turn is expected to fuel the
demand for nonwoven fabrics. Nonwovens are used in road construction in the form of geotextiles
to increase the durability of roads. Low maintenance costs associated with nonwovens is expected
to fuel its demand in construction applications.
Positive outlook on global automobile and transportation industry is further expected to propel
growth for nonwoven fabrics market over the next six years. Automobile industry manufactures a
large number of exterior and interior parts using nonwoven fabrics owing to its durability, moldability
and being lightweight. Positive outlook on the global automotive industry is expected to have a
positive impact on the market over the next six years. The shift in trend towards adoption of safety
measures while following practices in the medical industry is also expected to have a positive
influence on global nonwoven fabrics market growth.
India’s nonwoven market is growing at a rate of 8-10%. At present, the production of Nonwoven in
India is touching 190000 Tons out of which Spun bond nonwoven fabrics production is
approximately 83000 Tons. The per capita Nonwoven fabric consumption in India is 155 gm; which
will touch to 350 gm by 2015 and 600 gm by 2020.
Manufacturing Process
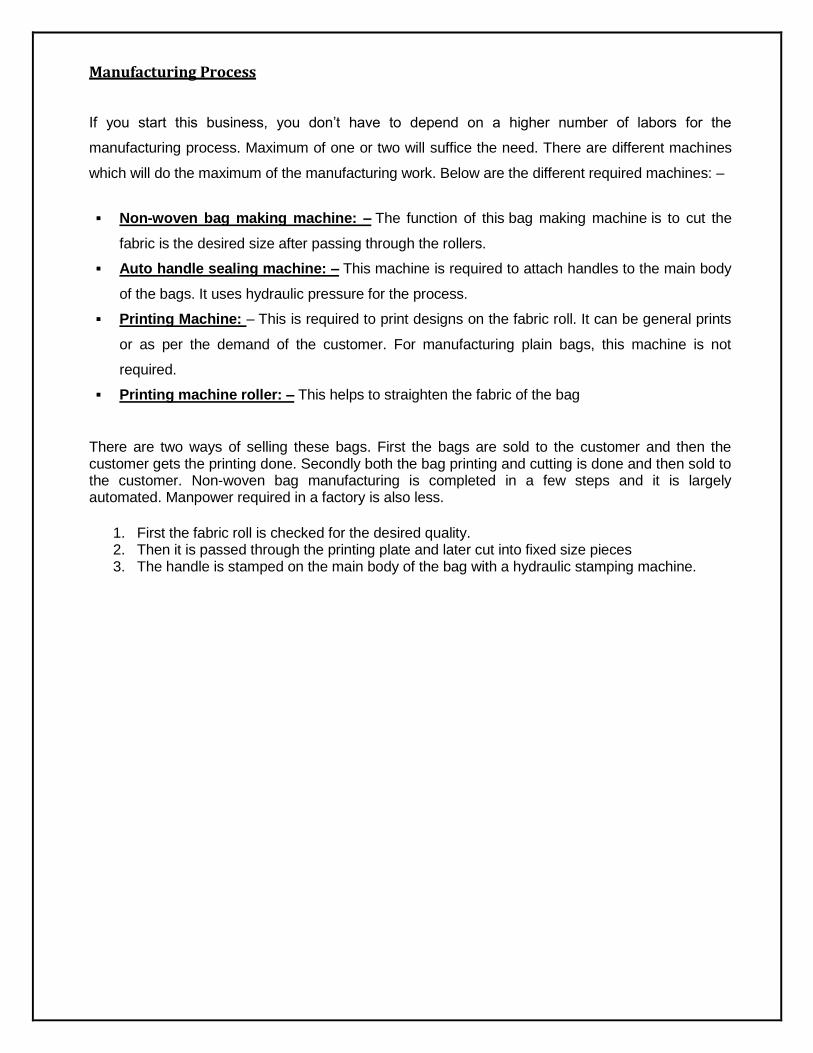
If you start this business, you don’t have to depend on a higher number of labors for the
manufacturing process. Maximum of one or two will suffice the need. There are different machines
which will do the maximum of the manufacturing work. Below are the different required machines: –
Non-woven bag making machine: – The function of this bag making machine is to cut the
fabric is the desired size after passing through the rollers.
Auto handle sealing machine: – This machine is required to attach handles to the main body
of the bags. It uses hydraulic pressure for the process.
Printing Machine: – This is required to print designs on the fabric roll. It can be general prints
or as per the demand of the customer. For manufacturing plain bags, this machine is not
required.
Printing machine roller: – This helps to straighten the fabric of the bag
There are two ways of selling these bags. First the bags are sold to the customer and then the customer gets the printing done. Secondly both the bag printing and cutting is done and then sold to the customer. Non-woven bag manufacturing is completed in a few steps and it is largely automated. Manpower required in a factory is also less.
1. First the fabric roll is checked for the desired quality. 2. Then it is passed through the printing plate and later cut into fixed size pieces 3. The handle is stamped on the main body of the bag with a hydraulic stamping machine.

Detail of raw material
NONWOVEN FABRIC- RAW MATERIAL
Nonwoven fabric is a fabric-like material made from staple fiber (short) and long fibers (continuous
long), bonded together by chemical, mechanical, heat or solvent treatment. The term is used in the
textile manufacturing industry to denote fabrics, such as felt, which are neither woven nor knitted.
Some nonwoven materials lack sufficient strength unless densified or reinforced by a backing.
In recent years, nonwovens have become an alternative to polyurethane foam.
Nonwoven fabrics are broadly defined as sheet or web structures bonded together by entangling
fiber or filaments (and by perforating films) mechanically, thermally or chemically. They are flat or
tufted porous sheets that are made directly from separate fibers, molten plastic or plastic film. They
are not made by weaving or knitting and do not require converting the fibers to yarn. Typically, a
certain percentage of recycled fabrics and oil-based materials are used in nonwoven fabrics. The
percentage of recycled fabrics vary based upon the strength of material needed for the specific use.
In addition, some nonwoven fabrics can be recycled after use, given the proper treatment and
facilities. For this reason, some consider nonwovens a more ecological fabric for certain
applications, especially in fields and industries where disposable or single use products are
important, such as hospitals, schools, nursing homes and luxury accommodations.
Nonwoven fabrics are engineered fabrics that may be single-use, have a limited life, or be very
durable. Nonwoven fabrics provide specific functions such as absorbency, liquid repellence,
resilience, stretch, softness, strength, flame retardancy, washability, cushioning, thermal insulation,
acoustic insulation, filtration, use as a bacterial barrier and sterility. These properties are often
combined to create fabrics suited for specific jobs, while achieving a good balance between product
use-life and cost. They can mimic the appearance, texture and strength of a woven fabric and can
be as bulky as the thickest paddings. In combination with other materials they provide a spectrum of
products with diverse properties, and are used alone or as components of apparel, home
furnishings, health care, engineering, industrial and consumer goods.

Non-Woven Bag License & Registration
First of all, determination of form of business. And accordingly, register the business. Apply for the Trade License/ Factory license from the Municipal Authority.
Additionally, apply for MSME Udyog Aadhaar online registration.
Obtain the GST registration.
Fire /Pollution Registration as required
Choice of a brand name of the product and secure the name with Trademark if required
Implementation Schedule
The project can be implemented in 3 to 4 months' time as detailed below:
Sr. No. Activity Time Required
(in months)
1 Acquisition of premises 1
2 Construction (if applicable) 1-2 Months
3 Procurement & installation of Plant & Machinery 1
4 Arrangement of Finance 1
5 Recruitment of required manpower 1
Total time required (some activities shall run concurrently) 3-4 Months
PROJECT ECONOMICS
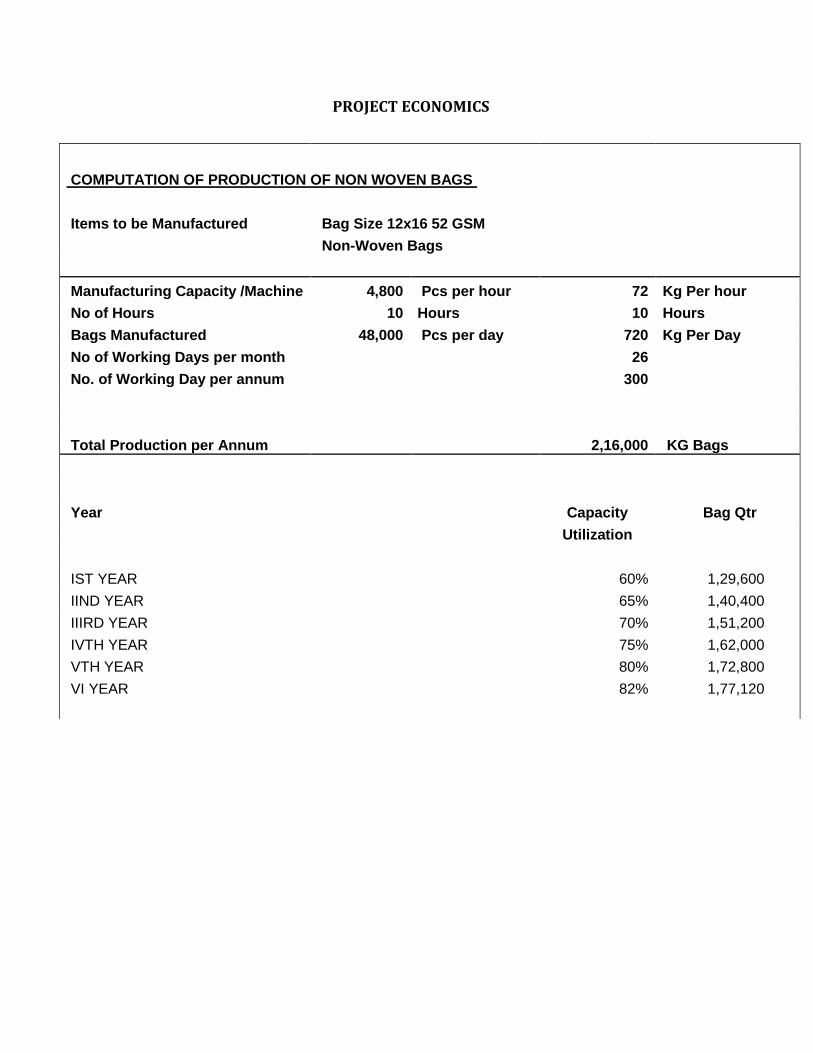
COMPUTATION OF PRODUCTION OF NON WOVEN BAGS
Items to be Manufactured Bag Size 12x16 52 GSM Non-Woven Bags
Manufacturing Capacity /Machine 4,800 Pcs per hour 72 Kg Per hour
No of Hours 10 Hours 10 Hours
Bags Manufactured 48,000 Pcs per day 720 Kg Per Day
No of Working Days per month
26
No. of Working Day per annum
300
Total Production per Annum 2,16,000 KG Bags
Year
Capacity Bag Qtr
Utilization
IST YEAR
60% 1,29,600
IIND YEAR
65% 1,40,400
IIIRD YEAR
70% 1,51,200
IVTH YEAR
75% 1,62,000
VTH YEAR
80% 1,72,800
VI YEAR 82% 1,77,120
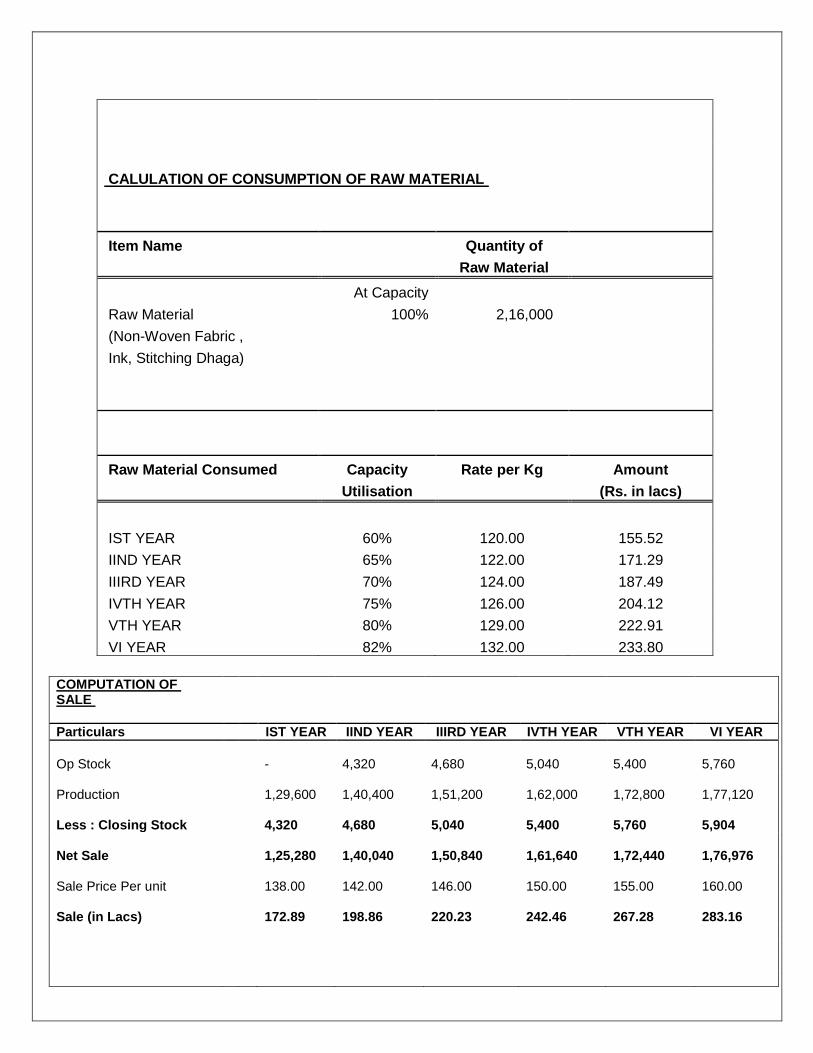
CALULATION OF CONSUMPTION OF RAW MATERIAL
Item Name Quantity of
Raw Material
At Capacity
Raw Material 100% 2,16,000 (Non-Woven Fabric ,
Ink, Stitching Dhaga)
Raw Material Consumed Capacity Rate per Kg Amount
Utilisation (Rs. in lacs)
IST YEAR 60% 120.00 155.52
IIND YEAR 65% 122.00 171.29
IIIRD YEAR 70% 124.00 187.49
IVTH YEAR 75% 126.00 204.12
VTH YEAR 80% 129.00 222.91
VI YEAR 82% 132.00 233.80
COMPUTATION OF SALE
Particulars IST YEAR IIND YEAR IIIRD YEAR IVTH YEAR VTH YEAR VI YEAR
Op Stock -
4,320
4,680
5,040
5,400
5,760
Production
1,29,600
1,40,400
1,51,200
1,62,000
1,72,800
1,77,120
Less : Closing Stock
4,320
4,680
5,040
5,400
5,760
5,904
Net Sale
1,25,280
1,40,040
1,50,840
1,61,640
1,72,440
1,76,976
Sale Price Per unit
138.00
142.00
146.00
150.00
155.00
160.00
Sale (in Lacs)
172.89
198.86
220.23
242.46
267.28
283.16

COST OF PROJECT
PROJECT AT GLANCE
COST OF PROJECT
PARTICULARS AMOUNT
Land Rented/ Owned
Building Civil Work
9.00
Plant & Machinery
18.34
Furniture & Fixtures and Other Assets
3.00
Working Capital Requirement
5.00
Total 35.34
MEANS OF FINANCE
PARTICULARS AMOUNT
Own Contribution
35.34
Total 35.34
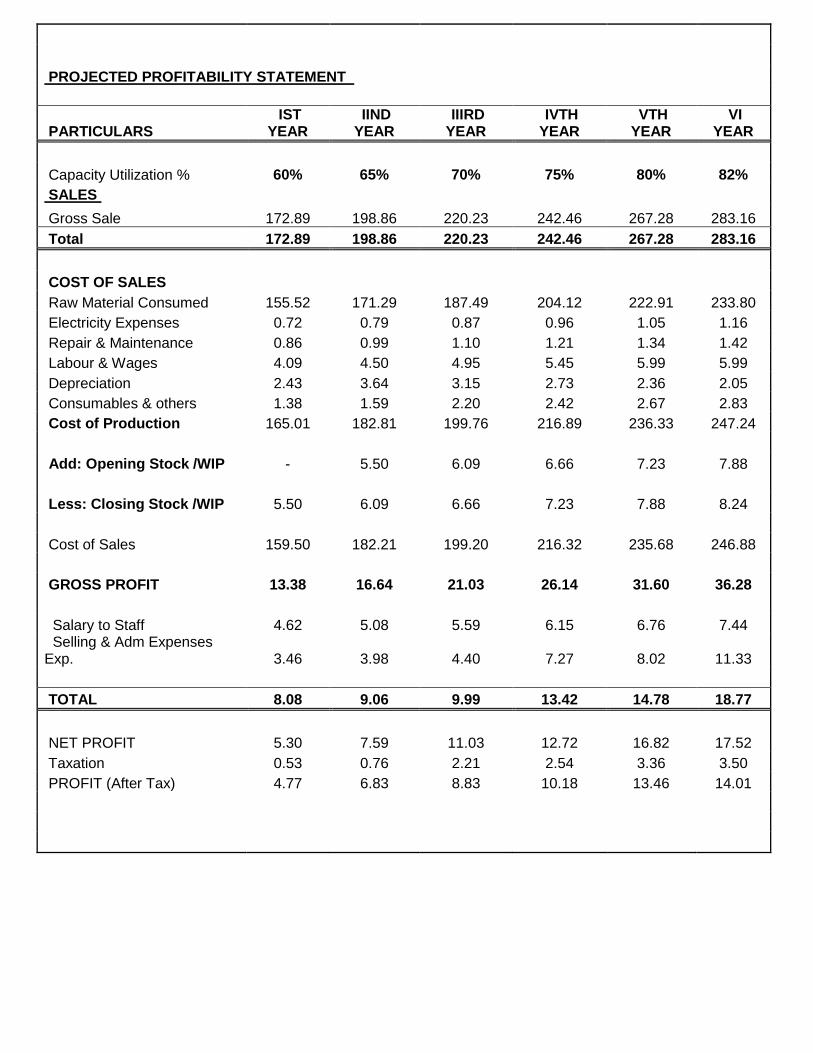
PROJECTED PROFITABILITY STATEMENT
PARTICULARS IST
YEAR IIND YEAR
IIIRD YEAR
IVTH YEAR
VTH YEAR
VI YEAR
Capacity Utilization % 60% 65% 70% 75% 80% 82%
SALES Gross Sale 172.89 198.86 220.23 242.46 267.28 283.16
Total 172.89 198.86 220.23 242.46 267.28 283.16
COST OF SALES Raw Material Consumed 155.52 171.29 187.49 204.12 222.91 233.80
Electricity Expenses 0.72 0.79 0.87 0.96 1.05 1.16
Repair & Maintenance 0.86 0.99 1.10 1.21 1.34 1.42
Labour & Wages 4.09 4.50 4.95 5.45 5.99 5.99
Depreciation 2.43 3.64 3.15 2.73 2.36 2.05
Consumables & others 1.38 1.59 2.20 2.42 2.67 2.83
Cost of Production 165.01 182.81 199.76 216.89 236.33 247.24
Add: Opening Stock /WIP - 5.50 6.09 6.66 7.23 7.88
Less: Closing Stock /WIP 5.50 6.09 6.66 7.23 7.88 8.24
Cost of Sales 159.50 182.21 199.20 216.32 235.68 246.88
GROSS PROFIT 13.38 16.64 21.03 26.14 31.60 36.28
Salary to Staff 4.62 5.08 5.59 6.15 6.76 7.44 Selling & Adm Expenses Exp. 3.46 3.98 4.40 7.27 8.02 11.33
TOTAL 8.08 9.06 9.99 13.42 14.78 18.77
NET PROFIT 5.30 7.59 11.03 12.72 16.82 17.52
Taxation 0.53 0.76 2.21 2.54 3.36 3.50
PROFIT (After Tax) 4.77 6.83 8.83 10.18 13.46 14.01
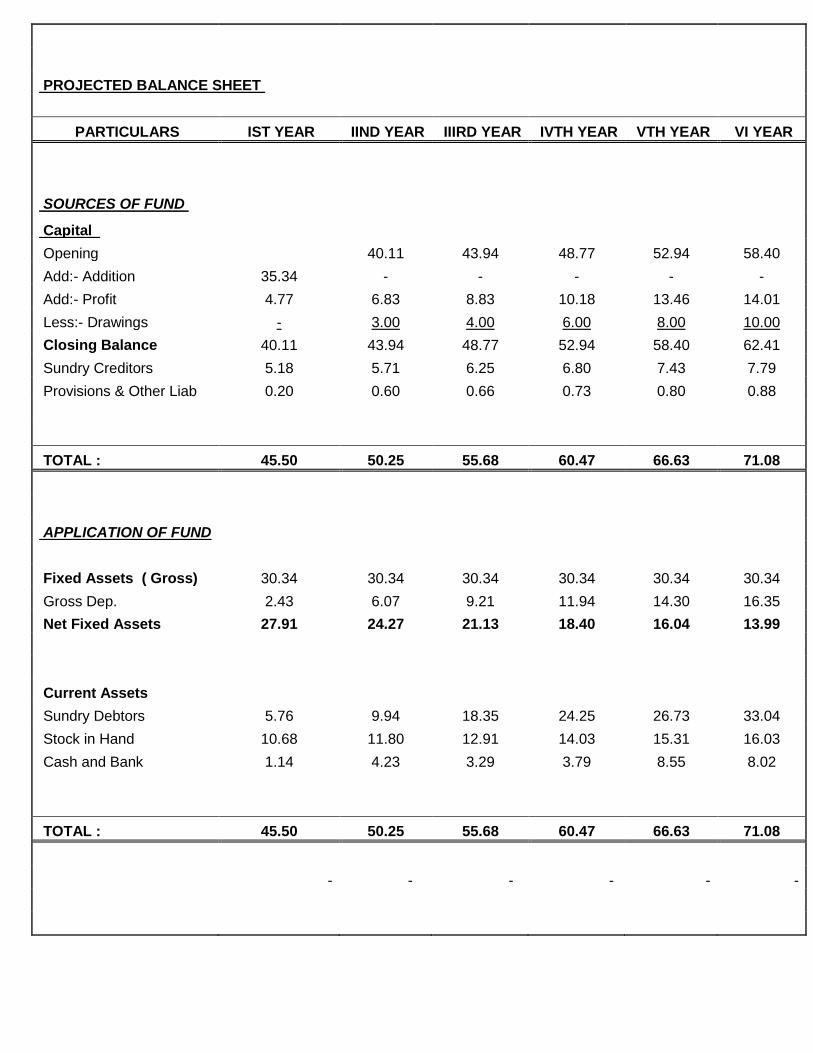
PROJECTED BALANCE SHEET
PARTICULARS IST YEAR IIND YEAR IIIRD YEAR IVTH YEAR VTH YEAR VI YEAR
SOURCES OF FUND
Capital Opening
40.11 43.94 48.77 52.94 58.40
Add:- Addition 35.34 - - - - -
Add:- Profit 4.77 6.83 8.83 10.18 13.46 14.01
Less:- Drawings - 3.00 4.00 6.00 8.00 10.00
Closing Balance 40.11 43.94 48.77 52.94 58.40 62.41
Sundry Creditors 5.18 5.71 6.25 6.80 7.43 7.79
Provisions & Other Liab 0.20 0.60 0.66 0.73 0.80 0.88
TOTAL : 45.50 50.25 55.68 60.47 66.63 71.08
APPLICATION OF FUND Fixed Assets ( Gross) 30.34 30.34 30.34 30.34 30.34 30.34
Gross Dep. 2.43 6.07 9.21 11.94 14.30 16.35
Net Fixed Assets 27.91 24.27 21.13 18.40 16.04 13.99
Current Assets Sundry Debtors 5.76 9.94 18.35 24.25 26.73 33.04
Stock in Hand 10.68 11.80 12.91 14.03 15.31 16.03
Cash and Bank 1.14 4.23 3.29 3.79 8.55 8.02
TOTAL : 45.50 50.25 55.68 60.47 66.63 71.08
- - - - - -

PROJECTED CASH FLOW STATEMENT
PARTICULARS IST YEAR IIND YEAR IIIRD YEAR IVTH YEAR VTH YEAR VI YEAR
SOURCES OF FUND
Own Margin 35.34 - - - - -
Net Profit 5.30 7.59 11.03 12.72 16.82 17.52
Depreciation & Exp. W/off 2.43 3.64 3.15 2.73 2.36 2.05
Increase in Unsecured Loan - - - - - -
Increase in Creditors 5.18 0.53 0.54 0.55 0.63 0.36
Increase in Provisions & Oth lib 0.20 0.40 0.06 0.07 0.07 0.08
TOTAL : 48.45 12.15 14.78 16.07 19.88 20.00
APPLICATION OF FUND
Increase in Fixed Assets 30.34 - - - - -
Increase in Stock 10.68 1.12 1.11 1.13 1.27 0.73
Increase in Debtors 5.76 4.18 8.41 5.89 2.48 6.31
Drawings - 3.00 4.00 6.00 8.00 10.00
Taxation 0.53 0.76 2.21 2.54 3.36 3.50
TOTAL : 47.32 9.06 15.72 15.56 15.12 20.54
Opening Cash & Bank Balance - 1.14 4.23 3.29 3.79 8.55
Add : Surplus 1.14 3.09 - 0.94 0.50 4.76 - 0.53
Closing Cash & Bank Balance 1.14 4.23 3.29 3.79 8.55 8.02
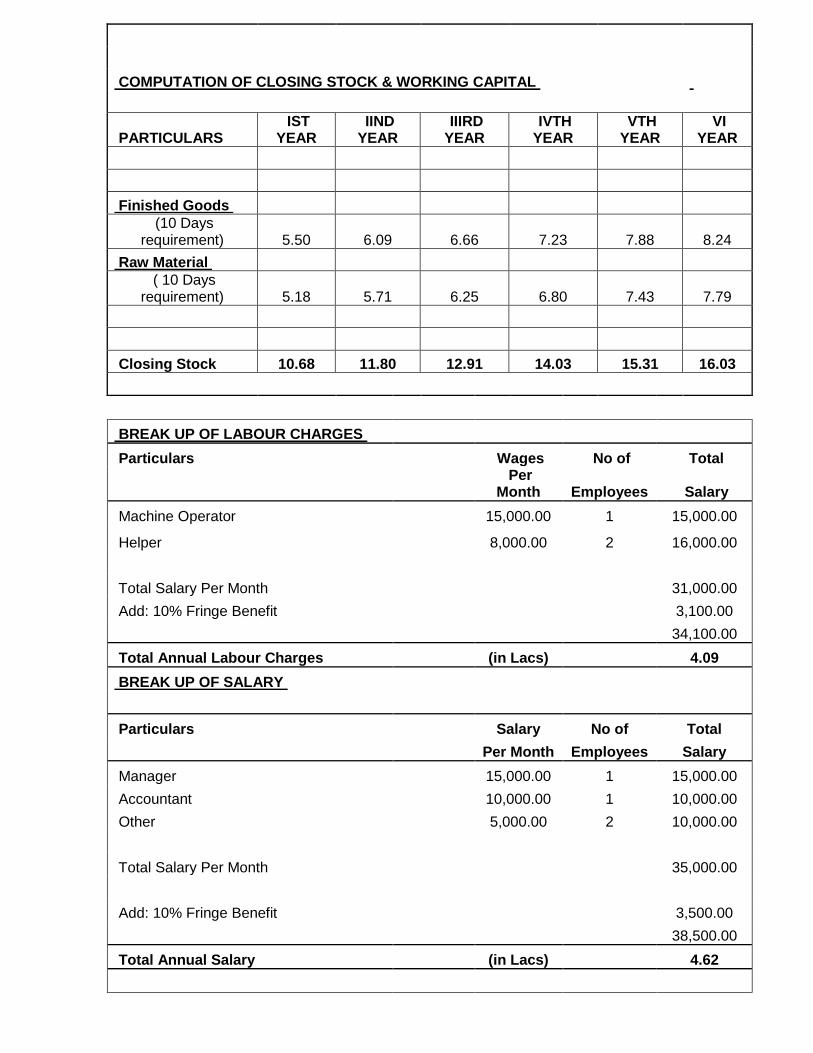
COMPUTATION OF CLOSING STOCK & WORKING CAPITAL
PARTICULARS IST
YEAR IIND YEAR
IIIRD YEAR
IVTH YEAR
VTH YEAR
VI YEAR
Finished Goods (10 Days
requirement) 5.50 6.09 6.66 7.23 7.88 8.24
Raw Material ( 10 Days
requirement) 5.18 5.71 6.25 6.80 7.43 7.79
Closing Stock 10.68 11.80 12.91 14.03 15.31 16.03
BREAK UP OF LABOUR CHARGES
Particulars Wages No of Total
Per
Month
Employees Salary
Machine Operator
15,000.00 1 15,000.00
Helper
8,000.00 2 16,000.00
Total Salary Per Month
31,000.00
Add: 10% Fringe Benefit
3,100.00
34,100.00
Total Annual Labour Charges
(in Lacs)
4.09
BREAK UP OF SALARY
Particulars
Salary No of Total
Per Month Employees Salary
Manager
15,000.00 1 15,000.00
Accountant
10,000.00 1 10,000.00
Other
5,000.00 2 10,000.00
Total Salary Per Month
35,000.00
Add: 10% Fringe Benefit
3,500.00
38,500.00
Total Annual Salary
(in Lacs)
4.62
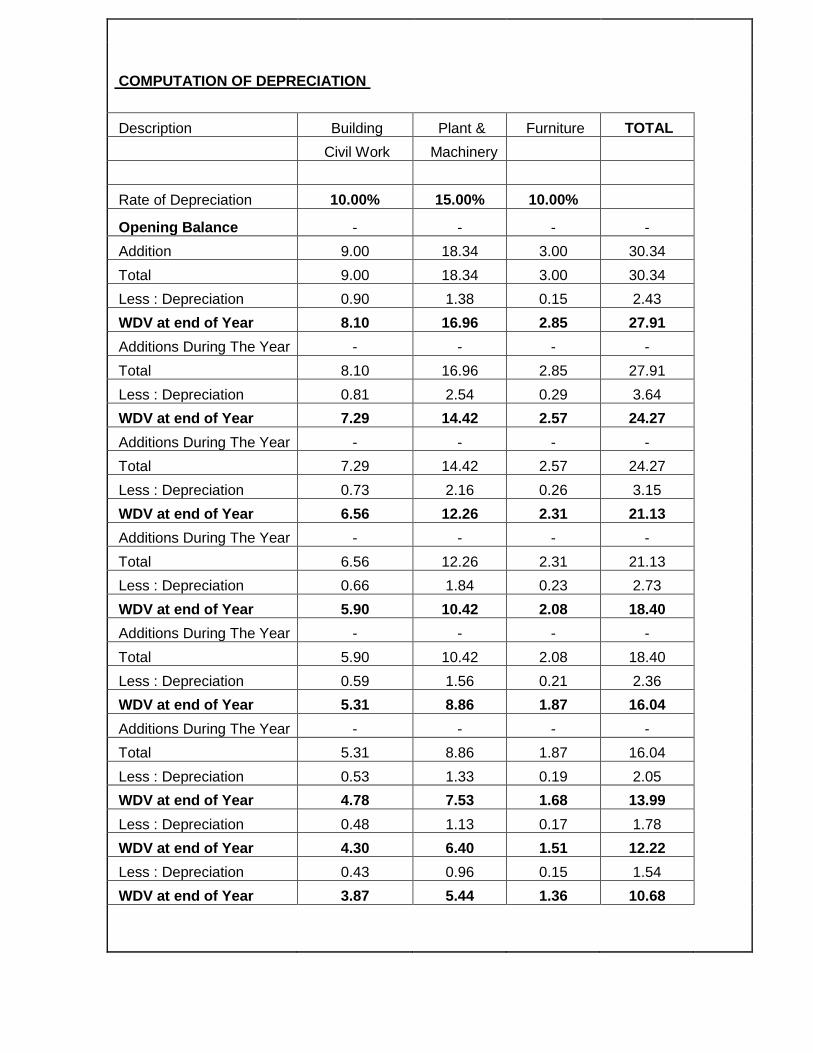
COMPUTATION OF DEPRECIATION
Description Building Plant & Furniture TOTAL
Civil Work Machinery
Rate of Depreciation 10.00% 15.00% 10.00%
Opening Balance - - - -
Addition 9.00 18.34 3.00 30.34
Total 9.00 18.34 3.00 30.34
Less : Depreciation 0.90 1.38 0.15 2.43
WDV at end of Year 8.10 16.96 2.85 27.91
Additions During The Year - - - -
Total 8.10 16.96 2.85 27.91
Less : Depreciation 0.81 2.54 0.29 3.64
WDV at end of Year 7.29 14.42 2.57 24.27
Additions During The Year - - - -
Total 7.29 14.42 2.57 24.27
Less : Depreciation 0.73 2.16 0.26 3.15
WDV at end of Year 6.56 12.26 2.31 21.13
Additions During The Year - - - -
Total 6.56 12.26 2.31 21.13
Less : Depreciation 0.66 1.84 0.23 2.73
WDV at end of Year 5.90 10.42 2.08 18.40
Additions During The Year - - - -
Total 5.90 10.42 2.08 18.40
Less : Depreciation 0.59 1.56 0.21 2.36
WDV at end of Year 5.31 8.86 1.87 16.04
Additions During The Year - - - -
Total 5.31 8.86 1.87 16.04
Less : Depreciation 0.53 1.33 0.19 2.05
WDV at end of Year 4.78 7.53 1.68 13.99
Less : Depreciation 0.48 1.13 0.17 1.78
WDV at end of Year 4.30 6.40 1.51 12.22
Less : Depreciation 0.43 0.96 0.15 1.54
WDV at end of Year 3.87 5.44 1.36 10.68
![Untitled-2 [] · 2019-07-04 · WOVEN SACK BAG CUTTING STITCHING MACHINE bcs.35 MAIN FEATURES: Suitable for PP/HDPE/BOPP Woven sack bag Equipped with servo motor for precise cutting](https://cdn.vdocument.in/doc/165x107/5f35b0a308f52b4429209d34/untitled-2-2019-07-04-woven-sack-bag-cutting-stitching-machine-bcs35-main.jpg)


