
Proposing a two-step Decision Support System (TPIS) based on Stacked ensemble classifier for early and low
cost (step-1) and final (step-2) differential diagnosis of Mycobacterium Tuberculosis from non-tuberculosis
Pneumonia
Toktam Khatibi1,2*, Ali Farahani3, Hossein Sarmadian4
1: (corresponding author) Assistant Professor, School of Industrial and Systems Engineering, Tarbiat Modares
University (TMU), Tehran , Iran, 14117-13114, email: [email protected], Phone: +982182883913
2: Assistant Professor, Hospital Management Research Center (HMRC), Iran University of Medical Sciences
(IUMS), Tehran, Iran. 3 Computational Analysis and Modeling, Louisiana Tech University, Ruston, LA, United States
4 Assistant Professor, Arak University of Medical Science, Arak, Iran.
Abstract
Background: Mycobacterium Tuberculosis (TB) is an infectious bacterial disease presenting similar symptoms to
pneumonia; therefore, differentiating between TB and pneumonia is challenging. Therefore, the main aim of this study
is proposing an automatic method for differential diagnosis of TB from Pneumonia.
Methods: In this study, a two-step decision support system named TPIS is proposed for differential diagnosis of TB
from pneumonia based on stacked ensemble classifiers. The first step of our proposed model aims at early diagnosis
based on low-cost features including demographic characteristics and patient symptoms (including 18 features). TPIS
second step makes the final decision based on the meta features extracted in the first step, the laboratory tests and
chest radiography reports. This retrospective study considers 199 patient medical records for patients suffering from
TB or pneumonia, which has been registered in a hospital in Arak, Iran.
Results: Experimental results show that TPIS outperforms the compared machine learning methods for early
differential diagnosis of pulmonary tuberculosis from pneumonia with AUC of 90.262.30 and accuracy of
91.372.08 with 95% CI and final decision making with AUC of 92.812.72 and accuracy of 93.892.81 with
95% CI.
Conclusions: The main advantage of early diagnosis is beginning the treatment procedure for confidently diagnosed
patients as soon as possible and preventing latency in treatment. Therefore, early diagnosis reduces the maturation of
late treatment of both diseases.
Keywords: Mycobacterium Tuberculosis, Pneumonia, Stacked ensemble classifier, early and low-cost differential
diagnosis
1 Background:
Mycobacterium Tuberculosis (TB) is an infectious bacterial disease which most commonly affects the lungs (1). A
person infected with TB bacteria may have no symptoms. Patients with active TB need long-course treatment. TB is
one of the top-10 causes of mortality worldwide (2) and the leading cause of death from infectious diseases (3). In
2016, about 10.4 million people contracted TB and 1.8 million died from it (2).
TB can present a wide range of symptoms, the most common being cough, blood in the sputum, fever, weight loss,
weakness, night sweats, and chest pains (1). Other symptoms of TB include chills, fatigue, malaise, swollen lymph
nodes, shortness of breath, phlegm, and loss of appetite (1).
Early detection of TB is vital for effective treatment, higher survival rate, and preventing further transmission of
mycobacterium tuberculosis. Sputum smear tests and many other diagnostic tools have been used for early diagnoses.
Blood tests and sputum tests are tedious and take a long time for analysis (4) though they are not always both necessary.

Delays from healthcare systems and from obtaining laboratory results occur frequently. (5). Previous researchers
believe that correct diagnosis of TB takes 45 days (6). Another study has reported that there the median delay of
diagnosis has been 9.9 weeks for tuberculosis detection (7).
Some TB symptoms can occur in other illnesses which affect the lungs. Pneumonia is a lung infection caused by
bacteria, viruses or fungi. It displays similar symptoms to pulmonary TB (PTB) (8). Infectious disease experts find
through experimentation that TB and pneumonia are incorrectly diagnosed interchangeably. Pinto et al. have
confirmed that misdiagnosis is common (8). This is a cause of difficulty indistinguishing TB and non-tuberculosis
Pneumonia and can lead to delay of treatment. Delay of treatment leads to reduce the patient survival rate, increased
treatment cost, and lengthened treatment time interval.
Previous studies have shown that artificial intelligence using machine learning algorithms can be helpful for accurately
diagnosing TB as soon as possible (6, 9, 10). Machine learning provides useful tools for locating hidden patterns in
data sets, which can lead to discovery of valuable knowledge.
Researchers have made remarkable efforts to predict tuberculosis or pneumonia as well as differentially diagnose TB.
Machine learning methods such as artificial neural networks (6, 11-13), decision trees (6, 14, 15), ANFIS (6), K-
nearest neighbors (16), Support vector machines (16), logistic regression (17) ,and random forests (18) are used to
differentiate.
To the best of our knowledge, distinguishing TB and Pneumonia based on machine learning methods has not been
considered in previous studies. Therefore, the main aim of this study is to propose a method for differential diagnosis
of TB and pneumonia.
Moreover, most of the previous studies have trained single classifiers on the dataset to predict tuberculosis, pneumonia
and/or differentiating between TB from other diseases. Single machine learning models may be good estimators of a
subset of patients; however, overfitting or under-fitting may occur for them, which may reduce their generalization
ability.
Ensemble classifiers can improve the prediction performance by combining the results of different single classifiers
(19). Previous studies have used ensemble classifiers with different base classifiers to predict ovarian cancer (20),
kidney stone type (21), molecular-level features of cancer (22), and so on.
A new generation of ensemble classifiers with promising results are stacked ensemble (SE) methods (23). They consist
of multiple layers of ensembles and can improve the performance of classification significantly (24). SEs are based
on meta-learners to learn from the output of the base classifiers and they provide meta learners higher generalization
ability (23). Therefore, in this study, we propose a stacked ensemble classifier for differentiating between TB and
Pneumonia and compare its performance with other common and popular ensemble classifiers including random
forests (25), Adaboost (26) and Gradient Boosting tree (27), as well as single classifiers including decision trees (28),
logistic regression, support vector machines (29) and K-nearest neighbors (30).
Different features have been considered in the previous studies for diagnosing tuberculosis or pneumonia including
the results of preliminary examination and laboratory tests (11, 12), patient symptoms and TB risk factors (17),
demographic features (gender and age), and radiological features extracted from CT-Scan images (16, 31, 32). Smear
test is a good predictor for TB detection but some TB infected patients may have negative smear test (33).
In this paper, a decision support system named TPIS based on stacked ensemble model is proposed to distinguish TB
from pneumonia in two steps: early diagnosis and final decision making. For this purpose, demographic characteristics
and patient symptoms are used for early diagnosis. The results of the laboratory tests and chest X-ray radiology reports
are used for final decision making. The steps of TPIS are detailed bellow:

- The first step aims at early diagnosis based on low-cost features including demographic characteristics, and
patients’ symptoms. For this purpose, a stacked ensemble classifier is designed.
- The second step makes the final decision based on the results of the laboratory tests, chest X-ray reports, and
meta features extracted in the first step. In this step, an ensemble layer of the classifiers is appended to the
first-step’s stacked ensemble.
The main advantage of our proposed method for differential diagnosis is preventing delay of treatment. The patient's
treatment can be started as soon as possible based on the early diagnosis of the first step of TPIS. The features used
for early diagnosis are low-cost and can be measured by physicians in their offices quickly. After that, for more
confidence, the laboratory tests and chest X-rays are requested for the potentially infected patients and final decision
making will be based on the results of the laboratory tests, chest X-ray reports, and their early diagnosis meta features.
The treatment procedure may be modified after final decision making for suspicious patients.
The main contributions of this study are outlined as:
- Proposing a DSS for early differential diagnosis of TB and pneumonia based on low-cost features without wasting
time to wait for the results of the laboratory tests and preparing radiology reports for chest X-ray
- Proposing an approach to identify potentially infected patients and requesting the laboratory tests and chest X-rays
to improve the accuracy of differential diagnosis
- Proposing a stacked ensemble method for early diagnosis based on demographic characteristics and patients’
symptoms
- Proposing a stacked ensemble method for final decision making based on the results of the laboratory tests, chest X-
ray reports, and meta features extracted by the first-step’s method
The rest of the paper is organized as follows: In section 2 the data characteristics and the main steps of the proposed
method in this research is described. The results of the experiment, including the performance measures of the model,
are reported and compared with the other classifiers in section 3. Concluding remarks and future work opportunities
are presented in section 4.
2 Methods
The main steps of analyzing data for differentiating between TB and Pneumonia is shown in Figure 1:

Figure 1- (left): the main steps of this study methodology, (right): the proposed DSS (TPIS) framework
The steps shown in Figure 1 (left) are based on the CRISP datamining methodology (34) which is one of the most
powerful methods in datamining (21). The steps are described in more detail bellow.
Data collection and description
For our collected data, disease type for each patient record is identified by a community of specialists based on sputum
smear test, sputum culture and chest radiography. The patients with high disagreement degree among the specialists
for their disease type are excluded from the study. After this filtering, 199 patients are considered in this study. Patient
medical records for patients having TB and Pneumonia were collected from infectious unit of a hospital in Arak.
Characteristics of the numeric features are listed in Table 1.
Table 1- list of the numeric features extracted from the patients' medical records
Feature name Total distribution Distribution for patients
suffering from pneumonia
Distribution for patients
suffering from TB
Min
Mea
n
Med
ian
Ma
x
Std
Min
Mea
n
med
ian
Ma
x
Std
Min
Mea
n
Med
ian
Ma
x
Std
Age 15
61.93 67 102 23.33 15 61.11 64 102 23.77 17 63.04 68 94 0.23

Feature name Total distribution Distribution for patients
suffering from pneumonia
Distribution for patients
suffering from TB
Min
Mea
n
Med
ian
Ma
x
Std
Min
Mea
n
med
ian
Ma
x
Std
Min
Mea
n
Med
ian
Ma
x
Std
white blood cell
(WBC)
3.02 8.57 7.7 27.3 3.70 3.6 8.36 7.7 19.2 3.08 3.02 8.87 7.65 27.3 4.47
Hemoglobin
5/8
13/22 12/9 65/25 4/64 5/8 13/31 13/25 19/26 2/22 7/95 13/08 12/05 65/25 6/82
Hematocrit 22/2 40/71 40/1 151/66 10/52 22/2 40/75 40/96 55/7 5/69 28/2 40/65 38/82 151/66 15/14
Neutrophil 55/78 85/83 85/66 102/58 6/61 55/78 85/39 85/53 100/2 6/56 61/42 86/50 86/56 102/58 6/67
Lymphocyte 8 70/83 72 105/27 12/83 40 69/91 70 93 11/9 8 72/22 73/5 105/27 14/068
Mean Corpuscular
Volume (MCV) -
12/31 22/34 20 78/4 11/53 4 23/34 21/83 53 10/71
-
12/31 20/84 20 78/4 12/59
C-reactive protein:
(CRP) -0/77 1/96 2 6/55 1/45 -0/77 1/88 2 4/91 1/45 -0/11 2/07 2 6/55 1/46
Erythrocyte
Sedimentation
Rate (ESR) -
11/74 35/13 27 124 29/09 -8/26 27/62 20 98 22/72
-
11/74 46/31 37 124 33/74
Table 2 lists the distribution of binary features considered in this study.
Table 2- Binary features considered in this study
Feature name Total For patients suffering
from pneumonia
For patients suffering from TB
Disease Type 199 119 80
Gender Female: 91, Male: 108 Female: 58, Male: 61 Female: 33, Male: 47
Cough No: 7, Yes: 192 No: 7, Yes: 112 No: 0, Yes: 80
Sputum Yes: 153, No:46 Yes: 87, No: 32 Yes: 66, No:14
Bloody Sputum No: 185, Yes: 14 No: 112, Yes: 7 No: 73, Yes: 7
Fever No: 81, Yes: 118 No: 47, Yes: 72 No: 34, Yes: 46

Feature name Total For patients suffering
from pneumonia
For patients suffering from TB
Shaking No: 126, Yes: 73 No: 57, Yes:62 No: 69, Yes: 11
Smoking No: 175, Yes: 24 No: 103, Yes: 16 No: 72, Yes: 8
Joint Pain No: 195, Yes: 4 No: 119, Yes: 0 No: 76, Yes: 4
Edema No: 177, Yes: 22 No: 105, Yes: 14 No: 72, Yes:8
Asthma No: 85, Yes: 114 No: 45, Yes: 74 No: 40, Yes: 40
Diabetes No: 167, Yes: 32 No: 103, Yes: 16 No: 64, Yes: 16
Cyanosis No: 195, Yes: 4 No: 117, Yes: 2 No: 78, Yes: 2
Weight Loss No: 171, Yes: 28 No: 114, Yes: 5 No: 57, Yes: 23
Weakness No: 155, Yes: 24 No: 95, Yes: 24 No: 60, Yes: 20
Lung sound Normal: 163, Abnormal: 36 Normal: 118, Abnormal: 1 Normal: 45, Abnormal: 35
Dyspnea No: 169, Yes: 30 No: 100, Yes: 19 No: 69, Yes: 11
Orthopnea No: 181, Yes: 18 No: 103, Yes: 16 No: 78, Yes: 2
Lung abnormalities in
CXR
No: 5, Yes: 174 No:1, Yes: 109 No: 4, Yes: 65
White spots (infiltrates)
in CXR
No: 9, Yes: 166 No:1, Yes: 103 No: 8, Yes: 63
For more convenience, a histogram of some binary features is shown in Figure 2.

Figure 2- histograms of some binary features
As shown in Figure 22, when the features are considered individually, differentiation is difficult, and in
each level of the binary feature, there are some patients suffering from either pneumonia or TB.
Two diagnostic tests for active tuberculosis or pulmonary tuberculosis are the sputum smear test and the
sputum smear culture. But some patients having difficulties coughing up sputum. Moreover, sputum smear
culture is a slow and expensive test, and its results depend on the quality of sputum (35). Many false
negative results in the sputum smear test show its low efficiency for diagnosis of TB. Moreover, some
infections such as HIV can lead to highly frequent negative-smear TB (36). Final diagnosis and disease
type are performed by a community of specialists based on sputum smear test, sputum culture, chest
radiography and clinical symptoms. The results of sputum smear test and smear culture are mainly used for
differential diagnosis by specialists along with other descriptors and are not included in the input features.
Balanced Sampling
For keeping and evaluating the generalization ability of the machine learning methods, the dataset should
be split into non-overlapping training and testing datasets. Training and testing datasets will be used for
training the classifiers and evaluating the trained classifiers, respectively. In this paper, balanced sampling
(37) is performed for building the training dataset to avoid the majority class bias. Balanced sampling
selects samples with equal size from each of the classes.
Data preparation and cleaning
After collecting the data, it must be preprocessed in order to generate an appropriately prepared data set.
The preprocessing tasks performed in this paper include outlier detection and removal, data transformation,
and missing value imputation.
Outliers are detected by interaction with domain experts and boxplot analysis. Outliers are data points lying
outside the whiskers of the boxplot (38).
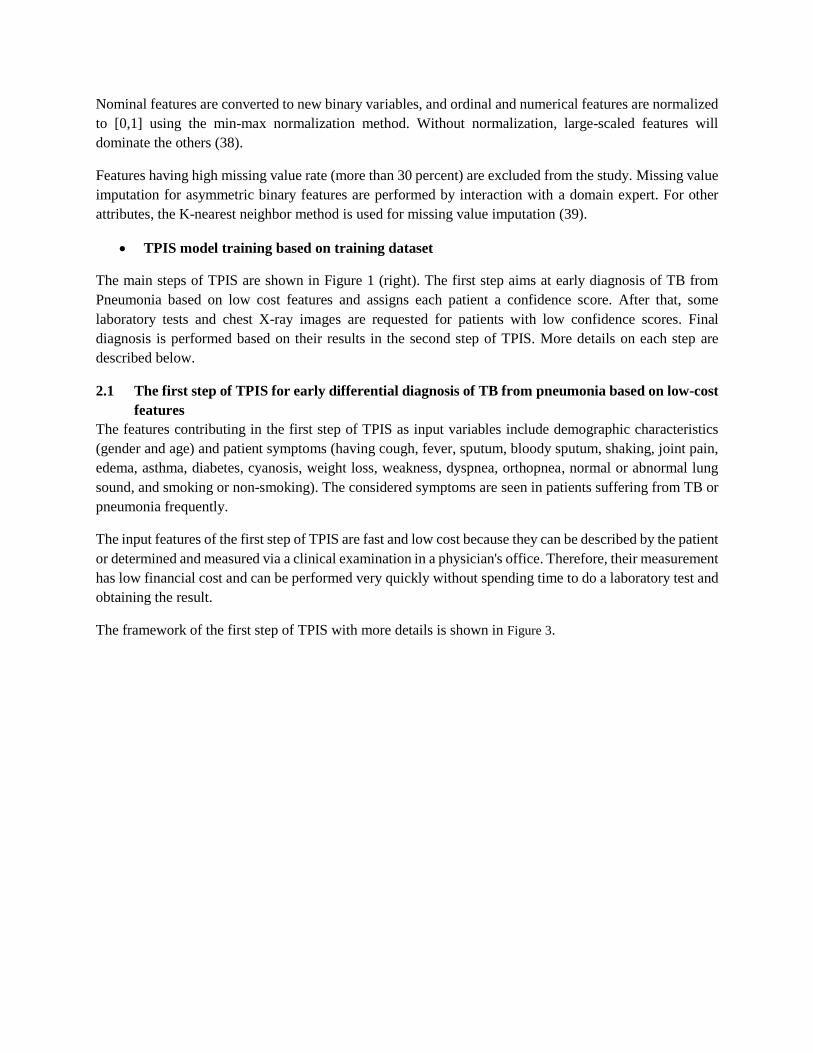
Nominal features are converted to new binary variables, and ordinal and numerical features are normalized
to [0,1] using the min-max normalization method. Without normalization, large-scaled features will
dominate the others (38).
Features having high missing value rate (more than 30 percent) are excluded from the study. Missing value
imputation for asymmetric binary features are performed by interaction with a domain expert. For other
attributes, the K-nearest neighbor method is used for missing value imputation (39).
TPIS model training based on training dataset
The main steps of TPIS are shown in Figure 1 (right). The first step aims at early diagnosis of TB from
Pneumonia based on low cost features and assigns each patient a confidence score. After that, some
laboratory tests and chest X-ray images are requested for patients with low confidence scores. Final
diagnosis is performed based on their results in the second step of TPIS. More details on each step are
described below.
2.1 The first step of TPIS for early differential diagnosis of TB from pneumonia based on low-cost
features
The features contributing in the first step of TPIS as input variables include demographic characteristics
(gender and age) and patient symptoms (having cough, fever, sputum, bloody sputum, shaking, joint pain,
edema, asthma, diabetes, cyanosis, weight loss, weakness, dyspnea, orthopnea, normal or abnormal lung
sound, and smoking or non-smoking). The considered symptoms are seen in patients suffering from TB or
pneumonia frequently.
The input features of the first step of TPIS are fast and low cost because they can be described by the patient
or determined and measured via a clinical examination in a physician's office. Therefore, their measurement
has low financial cost and can be performed very quickly without spending time to do a laboratory test and
obtaining the result.
The framework of the first step of TPIS with more details is shown in Figure 3.
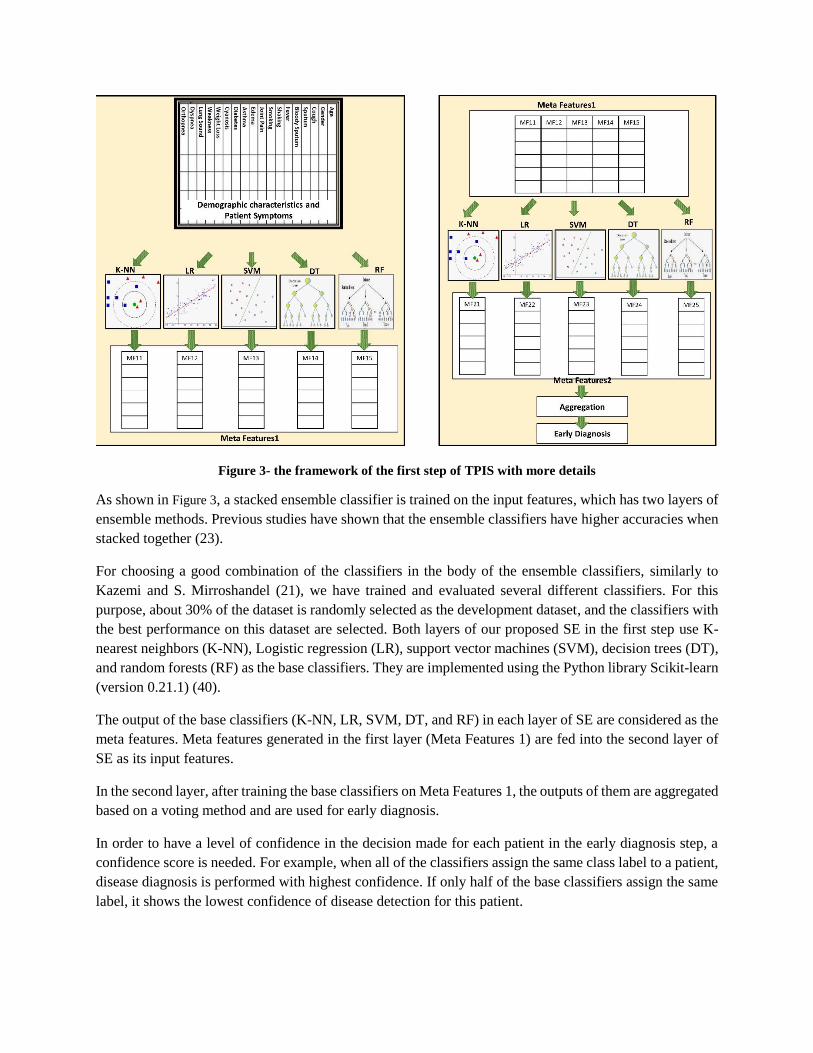
Figure 3- the framework of the first step of TPIS with more details
As shown in Figure 3, a stacked ensemble classifier is trained on the input features, which has two layers of
ensemble methods. Previous studies have shown that the ensemble classifiers have higher accuracies when
stacked together (23).
For choosing a good combination of the classifiers in the body of the ensemble classifiers, similarly to
Kazemi and S. Mirroshandel (21), we have trained and evaluated several different classifiers. For this
purpose, about 30% of the dataset is randomly selected as the development dataset, and the classifiers with
the best performance on this dataset are selected. Both layers of our proposed SE in the first step use K-
nearest neighbors (K-NN), Logistic regression (LR), support vector machines (SVM), decision trees (DT),
and random forests (RF) as the base classifiers. They are implemented using the Python library Scikit-learn
(version 0.21.1) (40).
The output of the base classifiers (K-NN, LR, SVM, DT, and RF) in each layer of SE are considered as the
meta features. Meta features generated in the first layer (Meta Features 1) are fed into the second layer of
SE as its input features.
In the second layer, after training the base classifiers on Meta Features 1, the outputs of them are aggregated
based on a voting method and are used for early diagnosis.
In order to have a level of confidence in the decision made for each patient in the early diagnosis step, a
confidence score is needed. For example, when all of the classifiers assign the same class label to a patient,
disease diagnosis is performed with highest confidence. If only half of the base classifiers assign the same
label, it shows the lowest confidence of disease detection for this patient.
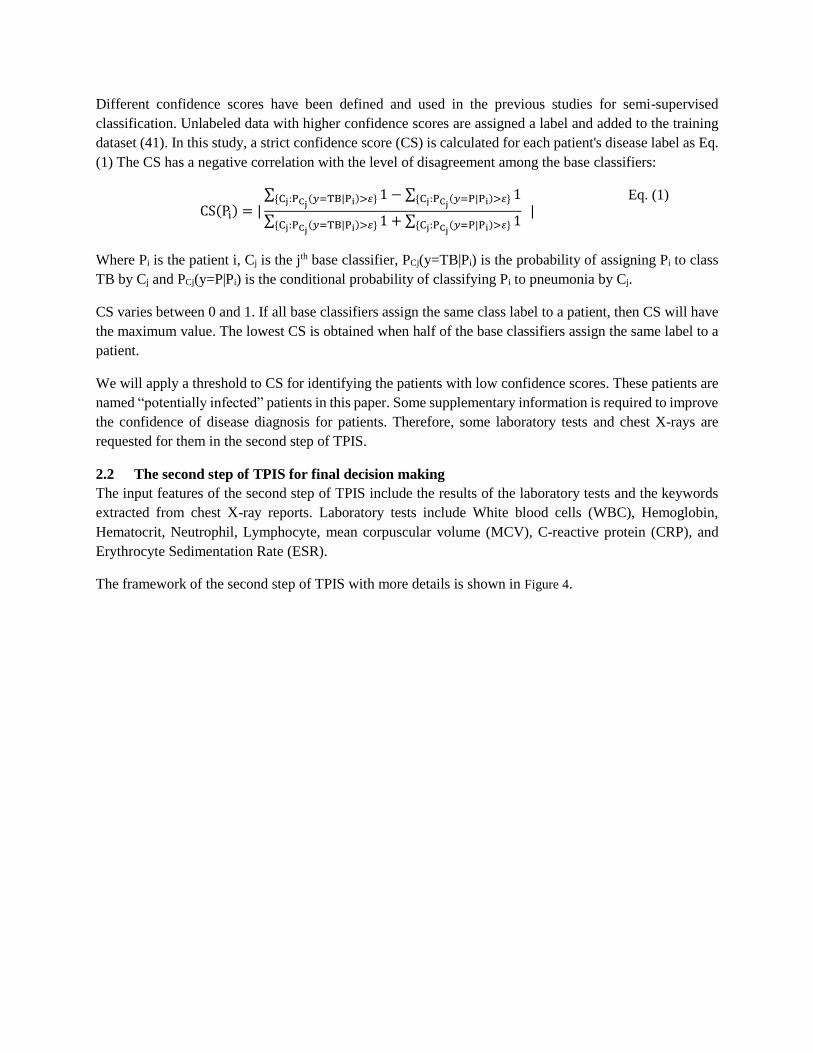
Different confidence scores have been defined and used in the previous studies for semi-supervised
classification. Unlabeled data with higher confidence scores are assigned a label and added to the training
dataset (41). In this study, a strict confidence score (CS) is calculated for each patient's disease label as Eq.
(1) The CS has a negative correlation with the level of disagreement among the base classifiers:
CS(Pi) = |
∑ 1{Cj:PCj(𝑦=TB|Pi)>𝜀} − ∑ 1{Cj:PCj
(𝑦=P|Pi)>𝜀}
∑ 1{Cj:PCj(𝑦=TB|Pi)>𝜀} + ∑ 1{Cj:PCj
(𝑦=P|Pi)>𝜀} |
Eq. (1)
Where Pi is the patient i, Cj is the jth base classifier, PCj(y=TB|Pi) is the probability of assigning Pi to class
TB by Cj and PCj(y=P|Pi) is the conditional probability of classifying Pi to pneumonia by Cj.
CS varies between 0 and 1. If all base classifiers assign the same class label to a patient, then CS will have
the maximum value. The lowest CS is obtained when half of the base classifiers assign the same label to a
patient.
We will apply a threshold to CS for identifying the patients with low confidence scores. These patients are
named “potentially infected” patients in this paper. Some supplementary information is required to improve
the confidence of disease diagnosis for patients. Therefore, some laboratory tests and chest X-rays are
requested for them in the second step of TPIS.
2.2 The second step of TPIS for final decision making
The input features of the second step of TPIS include the results of the laboratory tests and the keywords
extracted from chest X-ray reports. Laboratory tests include White blood cells (WBC), Hemoglobin,
Hematocrit, Neutrophil, Lymphocyte, mean corpuscular volume (MCV), C-reactive protein (CRP), and
Erythrocyte Sedimentation Rate (ESR).
The framework of the second step of TPIS with more details is shown in Figure 4.

Figure 4- the framework of the second step of TPIS with more details
As shown in Figure 4, an ensemble classifier consisting of K-NN, LR, SVM, DT, and RF is trained in the
second step. The input features include the results of the laboratory tests, the keywords extracted from chest
X-ray reports, and meta features extracted from the second layer of the stacked ensemble model (Meta
Features 2) in the first step of TPIS. Final decision making is performed by majority voting of the outputs
of the base classifiers in this step.

3 Results
For evaluating and validating the proposed model for differential diagnosis of TB from pneumonia, some
performance measurements should be calculated including Accuracy, Precision, Recall, F-Score, and Area
under the ROC curve (AUC).
Accuracy calculates how many data records are classified correctly as Eq. (2):
Accuracy =
TP + TN
N
Eq. (2)
TP and TN are true positive and true negative data records and N is the number of all data records. Positive
and negative classes are TB and pneumonia, respectively.
Precision measures the fraction of the real positive instances among the predicted positive ones as Eq.(3).
Precision =TP
TP + FP
Eq. (3)
Recall denotes how many data records belonging to positive class are classified correctly as Eq. (4):
Recall =
TP
TP + FN
Eq. (4)
FP and FN are false positive and false negative data records.
F-Score is the harmonic average of Precision and Recall as Eq. (5):
F − Score = 2
Precision ∗ Recall
Precision + Recall
Eq. (5)
ROC (Receiver Operating Curve) is a probability graphical plot showing the discriminative power of the
binary classifier by changing the threshold. AUC measures the area under ROC. It tells how much the
model can distinguish between classes. The higher the AUC, the better the model is at predicting two
classes.
For evaluating and validating our proposed method, different combinations of the demographic
characteristics, patient symptoms, the results of the laboratory tests and X-ray reports, and the meta features
extracted in the first step of TPIS are considered as shown in Table 3. Different feature sets have been used
in this study for evaluation of the classifiers.
Table 3- description of feature sets
Feature set name Included features
FS1 Symptoms and demographic features

Feature set name Included features
FS2 The results of the laboratory tests and the keywords extracted
from radiology report on chest X-ray image
FS3 Meta features (MetaFeatures2) obtained by our proposed early
diagnosis model
FS4 The union of FS2 and FS3
FS5 The union of FS1 and FS2
The evaluation framework used in this study is shown in
Figure 5.

Figure 5- the evaluation framework used in this study
As shown in Figure 5, the evaluation framework used in this study consists of two modules, (a) and (b):
- (a) Evaluation framework for early differential diagnosis of TB and pneumonia:
o Only demographic characteristics and patient symptoms are fed to the classifiers as input
variables. The performance of the first step module of TPIS is compared with other single
classifiers such as DT, LR and SVM, and ensemble methods such as RF. Adaboost were
implemented using Python library Scikit-learn (version 0.21.1), and Gradient Boosting
Tree (GBT) was implemented using Microsoft’s software ‘LightGBM’ with a Python
wrapper (42). The results of the comparison are listed in Table 4.
- (b) Evaluation framework for final decision making:
o The second step of TPIS is trained by feeding it FS4. FS4 features consist of meta features
(FS3) extracted by the first step of TPIS, the results of the laboratory tests, and the keywords
extracted from the radiology reports on chest X-ray images (FS2). The performance of the
second step of TPIS is compared to single classifiers such as DT, LR, and SVM, and
ensemble methods such as RF, Adaboost, and GBT. The input features fed to the compared
classifiers are the features of FS1, FS2, FS4, or FS5. The performance measures for these
classifiers are listed in Table 5 and Table 6.
Table 4- Comparing the performance of different classifiers for early differential diagnosis of TB and
pneumonia with CI 95% based on symptoms and demographic features (FS1)
Model Accuracy AUC Precision Recall F-Score
Decision Tree 89.002.69 84.582.58 80.232.41 94.172.36 86.642.42

Model Accuracy AUC Precision Recall F-Score
LR 87.502.93 86.462.36 78.792.29 91.672.73 84.752.03
SVM 87.752.86 86.412.36 78.532.17 93.122.45 85.202.91
RF 89.52.85 88.853.96 82.302.40 92.082.32 86.922.43
Adaboost 86.122.05 85.742.88 76.252.52 92.012.27 83.392.35
GBT 85.872.43 84.652.97 76.202.66 91.182.47 83.022.52
The first layer of the
first step of TPIS
90.622.19 89.582.32 83.612.79 95.232.70 88.491.79
The second layer of
the first step of TPIS
91.372.08 90.262.30 83.612.61 96.042.27 89.392.56
As shown in Table 4, the first step of TPIS outperforms the compared classifiers for early disease diagnosis.
Table 5- Comparing the performance of different classifiers for final differential diagnosis of TB and
pneumonia with CI 95% based on the features in FS4
Model Accuracy AUC Precision Recall F-Score
Decision
Tree
92.541.15 91.451.37 88.101.46 92.842.17 90.412.02
LR 92.481.45 91.431.65 88.102.53 92.661.10 90.321.93
SVM 92.661.77 91.912.31 88.292.76 92.952.35 90.562.61
Adaboost 91.391.40 90.221.46 86.521.07 91.521.59 88.951.13
GBT 90.811.08 90.061.84 86.151.95 90.251.88 88.151.92
RF 92.672.12 91.872.40 88.422.08 92.801.97 90.562.21
The second
step of TPIS
93.962.81 92.812.72 90.632.61 93.752.03 92.162.38
As illustrated by Table 5, the best performance for final decision making is obtained by TPIS. The classifiers
trained on different feature sets are compared, as listed in Table 6.
Table 6- Comparing the performance of different classifiers for final differential diagnosis of TB and
pneumonia with CI 95% based on different features

Features Model Accuracy AUC Precision Recall F-Score
FS2 DT 87.501.13 82.500.99 78.391.32 92.501.08 84.861.25
LR 88.051.03 84.871.01 78.871.12 93.500.95 85.560.98
SVM 88.201.26 84.871.22 79.571.26 92.621.33 85.601.27
Adaboost 85.001.57 81.761.39 75.631.19 89.111.61 81.821.46
GBT 84.430.92 80.880.88 75.981.17 88.320.72 81.691.04
RF 89.001.18 85.041.18 81.481.22 91.831.06 86.351.12
FS3 DT 90.181.91 89.331.27 84.072.01 91.391.30 87.581.77
LR 90.661.72 89.401.17 84.552.14 92.181.65 88.201.82
SVM 91.451.59 89.692.42 85.661.85 93.001.54 89.181.59
Adaboost 91.081.26 89.451.49 85.321.64 92.341.60 88.691.63
GBT 90.021.55 89.211.24 83.272.46 92.171.41 87.491.78
RF 91.031.08 89.631.51 84.612.01 93.281.18 88.741.59
FS5 DT 88.51.28 89.120.99 79.071.75 94.711.01 86.191.42
LR 89.671.53 87.541.64 81.101.92 94.831.84 87.431.87
SVM 90.001.03 90.091.62 80.601.33 91.830.90 85.851.08
Adaboost 87.332.65 86.171.54 79.281.07 90.102.19 84.341.64
GBT 85.52.14 84.452.18 76.243.22 89.671.25 82.412.52
RF 90.021.23 89.752.07 83.312.30 92.110.80 87.491.58
Accuracy, AUC and F-Score of the compared methods are shown in Figure 6 for convenience.

Figure 6- Accuracy, AUC and F-Score of the compared classifiers
As illustrated by Figure 6, the performance of the classifiers trained on FS2 is good but measuring the
laboratory tests requires time. On the other hand, radiologic report quality depends on the radiologists’
expertise. Training the classifiers on FS5 (including FS1 and FS2) improves their performance. It shows that
FS5 can predict TB and pneumonia highly accurately. Finally, by comparing the results listed in Table 4,
Table 5 and Table 6, it can be concluded that TPIS outperforms the compared methods.
Discussion
In this study, TPIS is proposed for differential diagnosis of TB and pneumonia. It has two main steps for
early diagnosis and final decision making, respectively. Potentially infected patients are the people
acquiring low confidence scores in the first step. The final diagnosis for them will be made in the second
step based on the supplementary laboratory tests, chest X-ray reports, and meta features extracted in the
first step.
Table 7 illustrates the confusion matrix of the first step of TPIS by categorizing patients based on their
confidence scores.
Table 7- Confusion matrix of the first step module categorizing patients based on their confidence score
Real class: P Real class: TB
CS=0 CS = 0.5 CS = 1
CS=0 CS = 0.5 CS = 1

Predicted class: P 6% 83% 1% 1%
Predicted class: TB 5% 2% 18% 78%
Suspicious patients 4% 2%
As shown by Table 7, totally, 7% of patients suffering from pneumonia and 2% of patients suffering from
TB are misclassified in the first step of TPIS. Moreover, 4% of patients in class P and 2% of patients in
class TB cannot be classified with majority voting because their assigned votes for two classes are the same.
Their confidence score is 0.
By setting a minimum threshold for confidence scores, the potentially infected patients are ones with
confidence score less than the predefined threshold. They will be instructed to pursue supplementary
laboratory tests.
According to Table 7, it is recommended that the minimum threshold should be 0.51 or more. This means
that if the majority or all of classifiers assigned the same label to a patient, then we will not go forward to
the next step; however, if there is a strong disagreement between labels that classifiers assigned, then we
will go to the second step of our model which will provide the ultimate decision. By setting the threshold
equal to 0.51, 15% (6+5+4) of the potentially infected patients suffering from pneumonia and 21%
(1+18+2) of the potentially infected patients suffering from TB are directed to the second diagnosis step.
Based on this policy, only 2% of the patients suffering from pneumonia and 1% of the patients with TB are
misclassified in the early stage disease diagnosis; no supplementary laboratory tests are suggested. These
3% of the patients are misdiagnosed by TPIS.
For potentially infected patients, the confusion matrix of the second step of TPIS is shown in Table 8.
Table 8- confusion matrix of final decision making for potentially infected patients in the second step of TPIS
Real class: P (totally 15% of
patients suffering from
Pneumonia)
Real class: TB (totally 21% of
patients suffering from
pneumonia)
Real class: P 94% 17%
Real class: TB 6% 83%
As shown in Table 8, in the second step, 6% from 15% of the patients suffering from Pneumonia
(0.06*0.015*119 = 1) and 17% from 21% of the patients suffering from TB (0.17 * 0.21 * 80 = 3) are
misclassified. It means that totally, 4 patients are misdiagnosed from 35 suspicious patients.
Moreover, in the first step, 2% of the patients suffering from pneumonia (0.02*119=2) and 1% of the
patients suffering from TB (0.01*80=1) are misclassified.

By aggregating the results of the first and the second steps of TPIS, 7 patients out of 199 patients are
misdiagnosed (about 3.6%). On the other hand, as listed in Table 5, if all patients are referred for laboratory
testing and send their information to the second step of our DSS, the accuracy is about 93.89. However, by
applying our policy to suggest laboratory testing only for suspicious patients, we will achieve the accuracy
of 96.48. Our research shows that supplementary laboratory tests and X-ray reports do not improve the
accuracy of disease diagnosis for all patients. In fact, our method of only testing potentially infected patients
has proven to be more effective than testing all patients.
Figure 7 shows the workflow of TPIS to reduce the error rate of differential diagnosis of TB and pneumonia.
Figure 7- the workflow of TPIS
Conclusions
Tuberculosis and pneumonia have similar symptoms. Therefore, the differential diagnosis of these two
diseases is a challenging task. In this study, a decision support system is proposed for distinguishing TB
from pneumonia in two main steps. The first step uses a stacked ensemble classifier, which is taught the
clinical symptoms and demographic characteristics of the patients. The classifier makes an early diagnosis
with a confidence score. If the confidence score is lower than a predefined threshold, supplementary
laboratory tests and chest X-rays are requested for final decision making in the second step of TPIS. The
stacked ensemble classifier in the second step is taught the results of the laboratory tests, X-ray reports, and
meta features extracted in the first step. The experimental results show that TPIS outperforms the compared
methods.
The main limitations of this study and their related future work opportunities follow:
- The quality of the data gathered from the physical examination highly depends on each physician's
expertise. One of the features described by physicians is the lung sound pattern. Automating lung
sound analysis could be the next step in eliminating individual physicians’ limitation. Extracting
and adding some features describing lung sound pattern with machine learning methods can
augment the collected data.
- In this study, only X-ray interpretations are used, and the images are not processed directly for
extracting some valuable and differentiating descriptors. Conversely, the radiologic report accuracy
is positively correlated with the radiologist's expertise. We suggest that feature extraction from X-
ray images should be performed by automatic machine learning and deep learning methods. It may
improve the diagnosis accuracy without depending on the radiologist's expertise.
- Another limitation of our study was the absence of smear tests in the patients’ records. For future
research, we propose adding a smear test and smear culture result to the data to increase the
accuracy of classifying the patients’ records into TB and pneumonia.
- Some features are excluded from this study because of their high rate of missing value. Using
automated methods for collecting and archiving data can reduce the missing value rate of the
features in the future.
Another proposed future direction is trying to differentiate pulmonary TB from other diseases having
similar symptoms. Finally, collecting healthy patients’ data and adding them to the study is suggested in
order to differentiate healthy patients from TB or pneumonia.

List of abbreviations:
AUC: Area Under ROC curve
CI: Confidence Interval
CRISP: Computer Retrieval of Information on Scientific Projects
CRP: C-reactive protein
CS: Confidence Score
CXR: Chest X-ray
DT: Decision Tree
ESR: Erythrocyte Sedimentation Rate
FP: False Positive
FN: False Negative
GBT: Gradient Boosting Tree
K-NN: K- nearest neighbors
LR: Logistics Regression
MCV: Mean Corpuscular Volume
N: Negative
P: Positive
RF: Random forest
ROC: Receiver Operating Curve
SE: Stacked Ensemble
SVM: Support Vector Machines
TB: Mycobacterium Tuberculosis
TP: True Negative
TPIS: Tuberculosis-Pneumonia Diagnostic Information System
TN: True Negative
WBC: White Blood Cell
Declarations:
Ethics approval:
The study was approved by Psychology and Counseling Organization Of Markazi Province (Arak).
The ethics approval certificate is uploaded in the journal submission site as a supplementary
document.
Consent to participate:
The consent to participate in data collection has been taken verbal by the physicians. This research
is a retrospective study and the authors has gathered data for this research from paper-based patient
medical records. All patients' records have been filled by the physicians and the authors are
responsible for extracting data from paper-based records to excel files. It is approved in the ethics
approval certificate written by Psychology and Counseling Organization Of Markazi Province
(Arak).
Consent for publication:
" Not applicable"
Availability of data and materials
The data that support the findings of this study are not publicly available since the restrictions apply to the
availability of these data, which were used under license for the current study.

Competing interests:
The authors declare that they have no competing interests.
Funding:
This study was not funded by any organization.
Authors' Contribution
Conceptualization: TK, AF and HS
Data curation: TK, AF and HS
Formal analysis: TK and AF
Funding acquisition: there is no funding.
Investigation: TK and AF
Methodology: TK and AF
Project administration: T Khatibi
Software: TK and AF
Supervision: TK
Validation: TK, AF and HS
Visualization: TK and AF
Writing – original draft: TK and AF
Writing – review & editing: TK, AF and HS
all authors have read and approved the manuscript.
Acknowledgements:
Not applicable.
References
1. WHO. Tuberculosis Fact sheet N°104. 2. WHO. Global Tuberculosis Report 2016 [Available from: http://www.who.int/tb/publications/global_report/en/
. 3. Evora LHRA, Seixas JM, Kritski AL. Neural network models for supporting drug and multidrug resistant tuberculosis screening diagnosis. Neurocomputing. 2017;265(116-126). 4. Dande P, Samant P. Acquaintance to Artificial Neural Networks and use of artificial intelligence as a diagnostic tool for tuberculosis: A review. Tuberculosis. 2018;108:1-9. 5. Ebrahimi Kalan M, Yekrang Sis H, Kelkar V, Harrison SH, Goins GD, Asghari Jafarabadi M, et al. The identification of risk factors associated with patient and healthcare system delays in the treatment of tuberculosis in Tabriz, Iran. BMC Public Health. 2018;18(1):174. 6. Uçar T, Karahoca A. Predicting existence of Mycobacterium tuberculosis on patients using data mining approaches Procedia Computer Science 2011;3:1404-11. 7. Shu W, Chen W, Zhu S, Hou Y, Mei J, Bai L, et al. Factors Causing Delay of Access to Tuberculosis Diagnosis Among New, Active Tuberculosis Patients: A Prospective Cohort Study. Asian Pacific Journal of Public Health. 2014;26(1):33-41. 8. Pinto LM, Shah AC, Shah KD, Udwadia ZF. Pulmonary tuberculosis masquerading as community acquired pneumonia. Respiratory Medicine CME. 2011;4(3):138-40. 9. Orjuela AD, Eliécer J, Mendoza C, García CEA, Vela EPV. Tuberculosis diagnosis support analysis for precarious health information systems. Computer methods and programs in biomedicine. 2018;157:11-7.

10. J.S. Filho, J.M. Seixas, R. Galliez, B.B. Pereira, F. Mello, A.M. Santos, et al. A screening system for smear-negative pulmonary tuberculosis using artificial neural networks. International Journal of Infectious Diseases. 2016;49:33-9. 11. Er E, Yumusak N. Tuberculosis Disease Diagnosis Using Artificial Neural Network Trained with Genetic Algorithm. Journal of Medical Systems. 2011;35(3):329-32. 12. Er O, Temurtas F, Tanrıkulu AC. Tuberculosis Disease Diagnosis Using Artificial Neural Networks. Journal of Medical Systems. 2010;34(3):299-302. 13. Bakar AA, Febriyani F, editors. Rough Neural Network Model for Tuberculosis Patient Categorization. Proceedings of the International Conference on Electrical Engineering and Informatics 2007; Indonesia. 14. Sánchez MA, Uremovich S, Acrogliano P, editors. Mining Tuberculosis Data. Data Mining and Medical Knowledge Management: Cases and Applications; 2009; New York: Medical Information Science Reference. 15. Procel JM, Aleman C, Bielsa S, Sarrapio J, Sevilla TF, Esquerda A. A decision tree for differentiating tuberculous from malignant pleural effusions. Respiratory Medicine. 2008;102(8):1159-64. 16. Sousa RT, Marques O, Soares FA, Sene Jr. I, Oliveira L, Spoto E. Comparative Performance Analysis of Machine Learning Classifiers in Detection of Childhood Pneumonia Using Chest Radiographs. Procedia Computer Science. 2013;18:2579-82. 17. Shih Y, Ayles H, Lonnroth K, Claassens M, Lin HH. Development and validation of a prediction model for active tuberculosis case finding among HIV-negative/unknown populations. Sci Rep. 2019;16(9):6143. 18. Bobak CA, Titus AJ, Hill JE. Comparison of common machine learning models for classification of tuberculosis using transcriptional biomarkers from integrated datasets. Applied Soft Computing. 2019;74:264-73. 19. rokah L. Ensemble-based classifiers. Artif Intell Rev. 2010;33:1-39. 20. Tseng CJ, Lu CJ, Chang CC, Chen GD, Cheewakriangkrai C. Integration of data mining classification techniques and ensemble learning to identify risk factors and diagnose ovarian cancer recurrence. Artificial Intelligence in Medicine. 2017;78:47-54. 21. Kazemi Y, Mirroshandel SA. A novel method for predicting kidney stone type using ensemble learning Artificial Intelligence in Medicine. 2018;84:117-26. 22. Zhang Q, Li J, Wang Y. Finding disagreement pathway signatures and constructing an ensemble model for cancer classification. Sci Rep. 2017;7. 23. Pari R, Sandhya M, Sankar S. A Multi-Tier Stacked Ensemble Algorithm for Improving Classification Accuracy. Computers in Science and Engineering. 2018:1-. 24. Dzeroski S, Zenko B. Is Combining Classifiers with Stacking Better than Selecting the Best One? Machine Learning. 2004;54(3):255-73. 25. Breiman L. Random Forests. Mach Learn. 2001;45:5-32. 26. Zhu J, Zou H, Rosset S, Hastie T. Multi-class AdaBoost. Statistics and its interfere. 2009;2:349-60. 27. Friedman JH. Greedy function approximation: a gradient boosting machine. Annals of statistics. 2001;1:1189-232. 28. Breiman L, Friedman JH, Olshen RA, Stone CJ. Classification and Regression Trees. . Wadsworth. 1984. 29. Cortes C, Vapnik V. Support-vector network. Machine Learning. 1995;20:1-25. 30. Cover T, Hart P. Nearest neighbor pattern classification. IEEE Transactions on Information Theory. 1967;13(1):21-7. 31. Garin N, Marti C, Carballo S, Darbellay Farhoumand P, Montet X, Roux X, et al. Rational Use of CT-Scan for the Diagnosis of Pneumonia: Comparative Accuracy of Different Strategies. J Clin Med. 2019;15(8):514.

32. Santos D, Setubal S, Santos D, Boechat M, Cardoso C. Radiological aspects in computed tomography as determinants in the diagnosis of pulmonary tuberculosis in immunocompetent infants. Radiol Bras. 2019;52(2):71-7. 33. Benfu Y, Hongmei S, Ye S, Xiuhui L, Bin Z. Study on the Artificial Neural Network in the Diagnosis of Smear Negative Pulmonary Tuberculosis. 2009 WRI World Congress on Computer Science and Information Engineering. USA: IEEE; 2009. 34. Wirth R, editor CRISP-DM: Towards a standard process model for data mining. the Fourth International Conference on the Practical Application of Knowledge Discovery and Data Mining; 2000. 35. Chew MY, Ng J, Lim TK. Diagnosing pulmonary tuberculosis by pooling induced sputum. Journal of Clinical Tuberculosis and Other Mycobacterial Diseases. 2019;15:1-4. 36. Getahun H, Harrington M, Brien RO, Nunn P. Diagnosis of smear-negative pulmonary tuberculosis in people with HIV infection or AIDS in resource-constrained settings: informing urgent policy changes. Lancet. 2007;369(9578):2042-9. 37. Deville JC, Tillé Y. Efficient balanced sampling: the cube method. Biometrika. 2004;91(4):893-912. 38. Han J, Kamber M, Pei J. Data mining: Concepts and Techniques: Morgan Kauffmann.; 2012. 39. Torgo L. Data mining using R: Learning with case studies: CRC Press ((ISBN: 9781439810187); 2010. 40. Pedregosa F, Varoquaux G, Gramfort A, Michel V, Thirion B, Grisel O, et al. Scikit-learn: Machine Learning in Python. J Mach Learn Res. 2011;12:2825–30. 41. Tanha J, Someren MV, Afsarmanesh H. Semi-supervised self-training for decision tree classifiers. International Journal of Machine Learning and Cybernetics. 2017;8(1):355-70. 42. Ke G, Meng Q, Finley T, Wang T, Chen W, Ma W, et al. LightGBM: A Highly Efficient Gradient Boosting Decision Tree. Adv Neural Info Proc Sys. 2017:3149–57.
Figure legends
Figure 1- (left): the main steps of this study methodology, (right): the proposed DSS (TPIS) framework
Figure 2- histograms of some binary features
Figure 3- the framework of the first step of TPIS with more details
Figure 8- the framework of the second step of TPIS with more details
Figure 5- the evaluation framework used in this study
Figure 6- Accuracy, AUC and F-Score of the compared classifiers
Figure 7- the workflow of TPIS


