PSITRACK Software
User Guide
Authors: PSI Technics
Version: 1.10.05.03
Status: Final
Date: July 8, 2011
PSI Technics Ltd.Company Headquarter GermanyRudolf-Diesel-Str. 21aD-56220 Urmitz, Germany
Tel +49 (0) 2630 91590-0Fax +49 (0) 2630 91590-99
[email protected]://www.psi-technics.com/E
PSITRACK Software User Guide
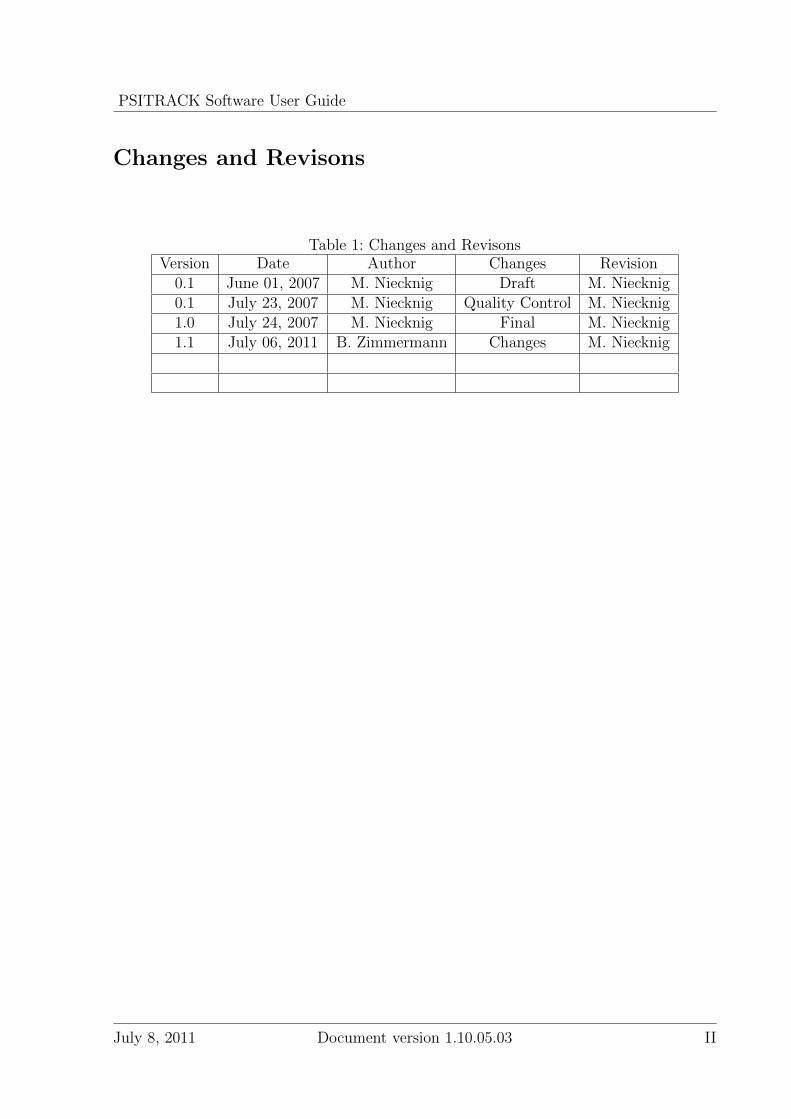
Changes and Revisons
Table 1: Changes and RevisonsVersion Date Author Changes Revision
0.1 June 01, 2007 M. Niecknig Draft M. Niecknig0.1 July 23, 2007 M. Niecknig Quality Control M. Niecknig1.0 July 24, 2007 M. Niecknig Final M. Niecknig1.1 July 06, 2011 B. Zimmermann Changes M. Niecknig
July 8, 2011 Document version 1.10.05.03 II

PSITRACK Software User Guide
Preface
Thank you for purchasing a PSI Data Logger and the PSITRACK software. Our data
loggers are specifically designed for recording temperatures in industrial installations and
facilities as well as in logistics. In addition to providing temperature data collection, the
PTHL 23 data logger also records relative humidity. Data loggers are used in areas that
are subject to extreme temperatures, from -40◦C to +125◦C (-40◦F to 275◦F). Extreme
temperature ranges frequently cause components and sensors to malfunction or fail. Laser
distance meters, for example, automatically shut down at excessive temperatures to pre-
vent damage to laser diodes. Our products are the perfect choice for users who need to
record temperatures and/or relative humidity at components in industrial plants or fa-
cilities. Due to their extremely small size (17.35 mm/0.68 inches in diameter), PSI data
loggers are ideal for collecting data in locations that do not lend themselves to the use
of larger devices. PSI data loggers are completely self-sufficient, which makes them per-
fect for long-term analyses and autonomous measurements. In addition, the PSITRACK
software enables you to create thermal diagrams of your facilities. Thermal imaging helps
to identify areas where unprotected sensors can be safely installed as well as areas in
which sensors may need thermal protection. Our products, however, are not limited to
industrial facilities - they can also be used in logistics, for example. When transporting
perishable goods it is important to know if the cooling or refrigeration cycles were inter-
rupted. Keeping track of these cycles used to be cumbersome and time-consuming. Data
loggers from PSI Technics greatly improve and facilitate the monitoring process for per-
ishable goods. During transport, our data loggers continuously measure the temperature
inside the transport compartment. The data can be analyzed at the destination location
using the PSITRACK software, which lets you know for certain, whether your goods
were properly refrigerated during transit. These applications not only require powerful
hardware, but also intelligent software. The included PSITRACK software enables you to
quickly and easily configure a data logger to your individual requirements.
This manual provides an overview of the technical specifications of our PSI data loggers
as well as step by step instructions for using our PSITRACK software. It also contains
tips for hardware and software troubleshooting. Our service team will help you with any
questions you may have and provides professional support.
July 8, 2011 Document version 1.10.05.03 III

PSITRACK Software User Guide
As part of our service portfolio, we also offer detailed data analysis reports that help you
evaluate temperature and humidity data in your facilities.
July 8, 2011 Document version 1.10.05.03 IV

PSITRACK Software User Guide
Table of Contents
Changes and Revisons . . . . . . . . . . . . . . . . . . . . . . . . . . . . . . . . . . . . . . . . . . . . . . . . . . . . . . . . . II
Preface . . . . . . . . . . . . . . . . . . . . . . . . . . . . . . . . . . . . . . . . . . . . . . . . . . . . . . . . . . . . . . . . . . . . . . . III
Table of Contents. . . . . . . . . . . . . . . . . . . . . . . . . . . . . . . . . . . . . . . . . . . . . . . . . . . . . . . . . . . . . .V
1 Introduction 1
2 Data Loggers 2
2.1 Applications . . . . . . . . . . . . . . . . . . . . . . . . . . . . . . . . . . . . . . . . . . . . . . . . . . . . . . . . . . . . . 2
2.2 Compliance with Industrial Standards . . . . . . . . . . . . . . . . . . . . . . . . . . . . . . . . . . . 3
2.3 Data Loggers - Technical Specifications . . . . . . . . . . . . . . . . . . . . . . . . . . . . . . . . . . 3
2.4 Data Logger Memory . . . . . . . . . . . . . . . . . . . . . . . . . . . . . . . . . . . . . . . . . . . . . . . . . . . . 5
2.5 Software System Requirements. . . . . . . . . . . . . . . . . . . . . . . . . . . . . . . . . . . . . . . . . . .5
3 Installation 7
3.1 Installing the Hardware . . . . . . . . . . . . . . . . . . . . . . . . . . . . . . . . . . . . . . . . . . . . . . . . . . 7
3.2 Installing the Software . . . . . . . . . . . . . . . . . . . . . . . . . . . . . . . . . . . . . . . . . . . . . . . . . . . 8
4 Using the PSITRACK Software 11
4.1 Start-up Screen. . . . . . . . . . . . . . . . . . . . . . . . . . . . . . . . . . . . . . . . . . . . . . . . . . . . . . . . .11
4.2 Icons in the Menu Bar . . . . . . . . . . . . . . . . . . . . . . . . . . . . . . . . . . . . . . . . . . . . . . . . . . 12
4.3 Licensing Your Software . . . . . . . . . . . . . . . . . . . . . . . . . . . . . . . . . . . . . . . . . . . . . . . . 14
4.4 Viewing Device Configurations . . . . . . . . . . . . . . . . . . . . . . . . . . . . . . . . . . . . . . . . . 15
4.5 Settings . . . . . . . . . . . . . . . . . . . . . . . . . . . . . . . . . . . . . . . . . . . . . . . . . . . . . . . . . . . . . . . . 16
4.6 Creating a Data Logger Profile . . . . . . . . . . . . . . . . . . . . . . . . . . . . . . . . . . . . . . . . . 18
4.7 Clock . . . . . . . . . . . . . . . . . . . . . . . . . . . . . . . . . . . . . . . . . . . . . . . . . . . . . . . . . . . . . . . . . . 19
4.8 Viewing Temperature Records . . . . . . . . . . . . . . . . . . . . . . . . . . . . . . . . . . . . . . . . . . 20
4.9 Viewing Relative Humidity Records . . . . . . . . . . . . . . . . . . . . . . . . . . . . . . . . . . . . 22
4.10 Viewing a Combined Diagram . . . . . . . . . . . . . . . . . . . . . . . . . . . . . . . . . . . . . . . . . . 23
4.11 Viewing a Histogram . . . . . . . . . . . . . . . . . . . . . . . . . . . . . . . . . . . . . . . . . . . . . . . . . . . 24
4.12 Alarm Log . . . . . . . . . . . . . . . . . . . . . . . . . . . . . . . . . . . . . . . . . . . . . . . . . . . . . . . . . . . . . 25
4.13 Comparison Chart . . . . . . . . . . . . . . . . . . . . . . . . . . . . . . . . . . . . . . . . . . . . . . . . . . . . . .26
July 8, 2011 Document version 1.10.05.03 V
PSITRACK Software User Guide
5 Appendix 28
A.2 List of Figures . . . . . . . . . . . . . . . . . . . . . . . . . . . . . . . . . . . . . . . . . . . . . . . . . . . . . . . . . .29
A.3 List of Tables. . . . . . . . . . . . . . . . . . . . . . . . . . . . . . . . . . . . . . . . . . . . . . . . . . . . . . . . . . .30
A.4 Index. . . . . . . . . . . . . . . . . . . . . . . . . . . . . . . . . . . . . . . . . . . . . . . . . . . . . . . . . . . . . . . . . . .31
July 8, 2011 Document version 1.10.05.03 VI

PSITRACK Software User Guide 1 INTRODUCTION
1 Introduction
In many industries, immense requirements are placed on modern temperature and humid-
ity recording software packages. These requirements go well beyond simple calculations,
saving data or opening files. Users would like to receive optimum support for their appli-
cations, and our software was developed with this goal in mind.
Individual support does not require expensive hardware. The PSITRACK software has
moderate system requirements and runs on Windows XP or Windows 2000. The intuitive
menu navigation makes the software easy to understand and use. Recording start times
can be configured manually and the software automatically records the required data
for defined periods of time. Alarm logs protect machines from excessive heat and help
eliminate undue expenses. Alarm logs help you to analyze periods during which machines
or facilities are subject to excessive temperatures or excessive humidity. You can also
configure custom profiles for a wide range of tasks as well as individual recording rates
and recording start times, so you can be sure your data loggers always collect the data
you need. Recorded temperatures can either be displayed in Fahrenheit or Celsius. User-
friendly histograms and recording diagrams aid in data analysis.
Apart from the features mentioned above, the software includes common features for
saving, loading and exporting data.
July 8, 2011 Document version 1.10.05.03 1

PSITRACK Software User Guide 2 DATA LOGGERS
2 Data Loggers
2.1 Applications
Typical applications for PSI data loggers and the PSITRACK software include areas
where temperatures regularly exceed 50◦C (122◦F). In such areas, extreme temperatures
frequently cause components or sensors to malfunction or fail. Laser distance meters, for
example, automatically shut down at excessive temperatures to prevent damage to laser
diodes. Most plant operators, however, are not aware of the temperatures that may exist
in certain parts of their facilities and, consequently, may not understand the cause of
sensor failures that are installed in those areas. PSI data loggers provide an easy and
effective way of conducting independent, precise and long-term temperature analyses.
All PSI data loggers are completely self-sufficient, which means that each analysis is
performed independently. Based on the analysis, the PSITRACK software can create a
thermal image of your facilities to help identify areas in which unprotected sensors can
be installed as well as areas where sensors may require thermal protection.
July 8, 2011 Document version 1.10.05.03 2

PSITRACK Software User Guide 2 DATA LOGGERS
2.2 Compliance with Industrial Standards
Component Standard Description
PTL 21G IP56 Certified according to international standard IEC 60529
PTL 22L IP56 Certified according to international standard IEC 60529
PTL 22T IP56 Certified according to international standard IEC 60529
PTHL 23 IP56 Certified according to international standard IEC 60529
(*) The PTL 22E data logger is not yet certified for IP56 according to IEC 60529, but it
is identical in construction to the PTL 22L and PTL 22T data loggers.
2.3 Data Loggers - Technical Specifications
PTL 21G - Technical Data
◦ Data logger type: Temperature data logger
◦ Temperature recording range: -40◦C to +85◦C (-40◦F to 185◦F)
◦ Resolution: 0.5◦C (32.9◦F)
◦ Precision: 1◦C (32◦F) from -30◦C to +85◦C (-22◦F to 185◦F)
◦ Memory: 2048 bytes
◦ Recording interval 1 minute up to 255 minutes
◦ 4 Kbit of writable memory
PTL 22 - Technical Data
◦ Data logger type: Temperature data logger
◦ Temperature recording range (PTL 22T): 0◦C to +125◦C (32◦F to 275◦F)
◦ Temperature recording range (PTL 22L): -40◦C to +85◦C (-40◦F to 185◦F)
◦ Temperature recording range (PTL 22E): +15◦C to +140◦C (59◦F to 284◦F)
◦ Relative humidity recording range: 0% to 100%
◦ Temperature resolution: 0.5◦C (32.9◦F) 8 bit, or 0.0625◦C (32.9◦F) 11 bit
July 8, 2011 Document version 1.10.05.03 3
PSITRACK Software User Guide 2 DATA LOGGERS
◦ Precision: 0.5◦C (32.9◦F) from -10◦C to +65◦C (14◦F to 149◦F)
◦ Memory: 8192 bytes
◦ Recording interval 5 seconds to 273 hours (Resolution: 1 second)
◦ 512 bytes of writable memory
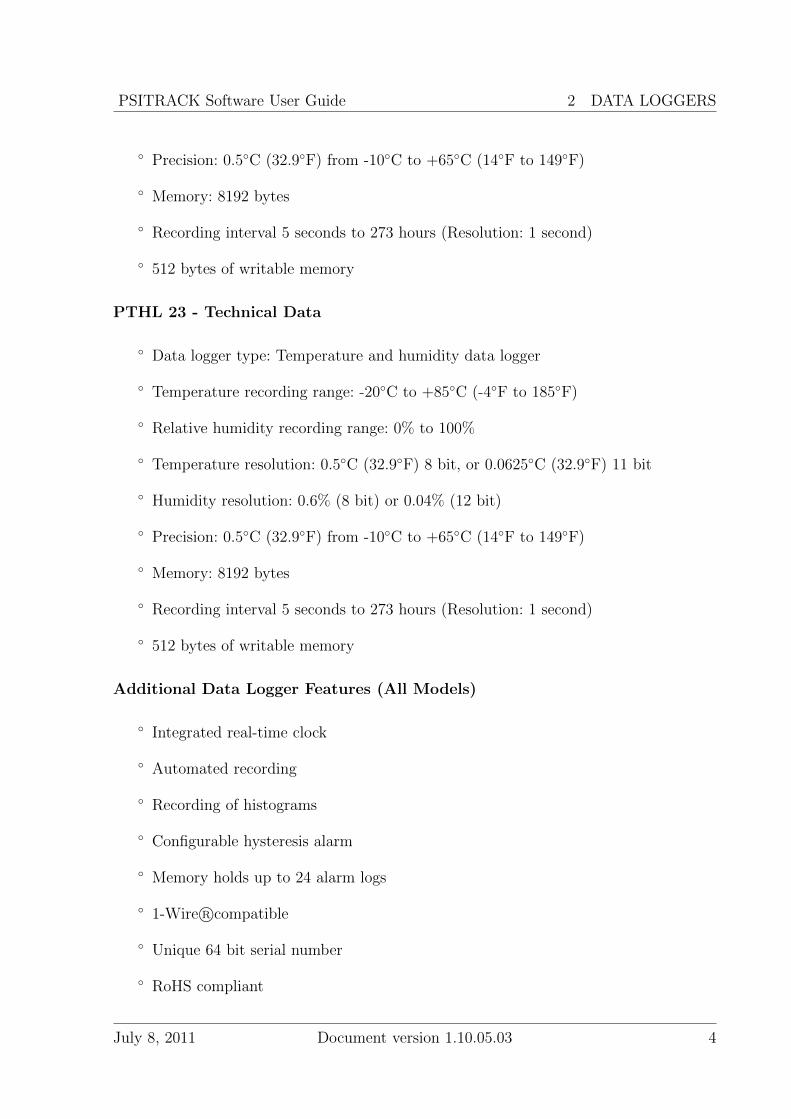
PTHL 23 - Technical Data
◦ Data logger type: Temperature and humidity data logger
◦ Temperature recording range: -20◦C to +85◦C (-4◦F to 185◦F)
◦ Relative humidity recording range: 0% to 100%
◦ Temperature resolution: 0.5◦C (32.9◦F) 8 bit, or 0.0625◦C (32.9◦F) 11 bit
◦ Humidity resolution: 0.6% (8 bit) or 0.04% (12 bit)
◦ Precision: 0.5◦C (32.9◦F) from -10◦C to +65◦C (14◦F to 149◦F)
◦ Memory: 8192 bytes
◦ Recording interval 5 seconds to 273 hours (Resolution: 1 second)
◦ 512 bytes of writable memory
Additional Data Logger Features (All Models)
◦ Integrated real-time clock
◦ Automated recording
◦ Recording of histograms
◦ Configurable hysteresis alarm
◦ Memory holds up to 24 alarm logs
◦ 1-Wire R©compatible
◦ Unique 64 bit serial number
◦ RoHS compliant
July 8, 2011 Document version 1.10.05.03 4

PSITRACK Software User Guide 2 DATA LOGGERS
2.4 Data Logger Memory
Data loggers can register a variety of records, depending on the device configuration. The
following table contains a list of the number of temperature and humidity records that
can be saved for different configurations:
Data Logger and Recording Type No. of Records
PTL 21G 2048
PTL 22/PTHL 23 - Either temperature or humidity, 8 bit 8192
PTL 22/PTHL 23 - Either temperature or humidity, 16 bit 4096
PTHL 23 - Temperature and humidity, 8 bit 4096
PTHL 23 - Temperature and humidity, 16 bit 2048
PTHL 23 - Temperature and humidity, different resolutions 2560
The number of measurement records saved in the data logger memory and the recording
frequency can be used to determine the maximum recording time. Figure 1 below shows
the recording time in relation to recording rates and resolutions for data logger models
PTL 22 and PTHL 23.
2.5 Software System Requirements
Either Windows 2000 or Windows XP operating systems are required. Windows XP is
recommended.
July 8, 2011 Document version 1.10.05.03 5

PSITRACK Software User Guide 2 DATA LOGGERS
Figure 1: Available Recording Time
July 8, 2011 Document version 1.10.05.03 6

PSITRACK Software User Guide 3 INSTALLATION
3 Installation
3.1 Installing the Hardware
Hardware installation consists of three easy steps:
1. Connect the data logger in Figure 2 to the included USB adapter shown
in Figure 3.
Figure 2: Data Logger
Figure 3: USB Adapter
2. Next, connect the USB adapter with the attached data logger to a USB port on
your laptop or desktop computer.
3. Install the required hardware driver ‘pusb90r.inf’ from the included PSITRACK
software CD.
July 8, 2011 Document version 1.10.05.03 7

PSITRACK Software User Guide 3 INSTALLATION
Important: You need to manually select the ‘pusb90r.inf ’ driver. It is located in
the ‘Driver’ (Treiber) folder on the PSITRACK software CD.
4. After installing the driver, we recommend that you restart your computer to ensure
that the hardware is correctly configured.
The data logger is now ready for use.
3.2 Installing the Software
You need administrator rights to install the PSITRACK software on your computer.
To install the software, insert the PSITRACK software CD in the CD or DVD drive of your
computer. The install wizard starts and will guide you through the installation process.
Software installation only takes three easy steps. The following graphics demonstrate the
software installation process.
July 8, 2011 Document version 1.10.05.03 8

PSITRACK Software User Guide 3 INSTALLATION
1. The PSITRACK installation screen appears. Click ‘Next’.
2. Select a software installation directory on your hard drive and click ‘Next’.
July 8, 2011 Document version 1.10.05.03 9

PSITRACK Software User Guide 3 INSTALLATION
3. Next, click ‘Finish Installation’.
After the installation is complete, you can:
(a) Start the software.
(b) Create a desktop shortcut.
(c) View the PSITRACK User Guide.
July 8, 2011 Document version 1.10.05.03 10

PSITRACK Software User Guide 4 USING THE PSITRACK SOFTWARE
4 Using the PSITRACK Software
4.1 Start-up Screen
The following screen appears, when you start the software:
Figure 4: Start-up Screen
July 8, 2011 Document version 1.10.05.03 11

PSITRACK Software User Guide 4 USING THE PSITRACK SOFTWARE
4.2 Icons in the Menu Bar
The menu bar contains the following icons. Table 2 contains a description of each icon:
Figure 5: Icons in the Menu Bar
Table 2: Menu Bar Icons and Descriptions
Icon Name Description
Save Logger Click this icon to save the recorded data from yourdata logger on your computer.
Export measuring data Click this icon to save the recorded data from yourdata logger as a .txt file.
Load log file Click this icon to open a log file with recorded data.
Refresh Click this icon to update the data and refresh thecurrent view.
Navigation panes Click this icon to open or close the navigationpanes on the left of right.
Language Click this icon to select a different language.
Units Click this icon to select the temperature units (Cel-sius or Fahrenheit).
Help Click to open the Help.
About Click to view the software version as well as generalsoftware information.
The ‘Export measuring data’ option saves the recorded raw data of the selected data log-
gers as .txt files. To save the raw data for a particular data logger, select the corresponding
check box for each device. The data is now ready for processing.
July 8, 2011 Document version 1.10.05.03 12

PSITRACK Software User Guide 4 USING THE PSITRACK SOFTWARE
Figures 6 and 7 show the main window with open and closed navigation pane.
Figure 6: Main Window with Navigation Pane (on left)
Figure 7: Main Window with Closed Navigation Pane
July 8, 2011 Document version 1.10.05.03 13

PSITRACK Software User Guide 4 USING THE PSITRACK SOFTWARE
4.3 Licensing Your Software
To be able to use all features of the PSITRACK software, you need to license your software.
Please contact PSI Technics Ltd. for a software license. If you have any questions about
licensing, please contact [email protected].
Once you receive a valid software license from PSI Technics, install the license file.
To install the license:
1. In the Navigation pane on the left of the start-up screen, click ‘License’.
2. Next, click the ‘Information’ option below.
3. In the the ‘Information’ tab, click ‘License registration’.
4. Click the PSI Technics license file to install the license.
Figure 8: No license installed
Figure 9: License successfully installed
July 8, 2011 Document version 1.10.05.03 14

PSITRACK Software User Guide 4 USING THE PSITRACK SOFTWARE
The screen shown in Figure 9 appears after the license file has been successfully installed.
If your name is displayed on screen instead of ‘demo version’, the license is correctly
installed.
4.4 Viewing Device Configurations
To view the configuration of your data logger device:
1. Select a data logger from the ‘Devices’ pane on the left.
Figure 10: Data Logger and Log File
2. Click the ‘Description’ tab in the main window.
The following window appears:
Figure 11: Description Tab with Device Configuration
July 8, 2011 Document version 1.10.05.03 15

PSITRACK Software User Guide 4 USING THE PSITRACK SOFTWARE
4.5 Settings
Your PSI data logger is configured and ready for use with a few simple clicks.
1. Select your data logger from the ‘Devices’ pane on the left.
2. Click the ‘Settings’ tab in the main window.
The screen shown in Figure 12 appears. Table 3 contains a description of the fields in this
dialog.
Figure 12: Data Logger Settings Tab
July 8, 2011 Document version 1.10.05.03 16

PSITRACK Software User Guide 4 USING THE PSITRACK SOFTWARE
Table 3: Data Logger Settings Dialog
Option Description
Start immediately The data logger immediately starts recording data.
Start time Defined recording start time (dd.MM.yyyy HH:mm).
Rate The desired recording rate
Rate mode The recording units (minutes or seconds; seconds only
for PTL 21G).
Description Use this field to enter a short description for the current
settings.
Upper alarm (temperature) Records an alarm when the temperature exceeds the de-
fined limit.
Lower alarm (temperature) Records an alarm when the temperature falls below the
defined limit.
Upper alarm (humidity) Records an alarm when the humidity exceeds the defined
limit.
Lower alarm (humidity) Records an alarm when the humidity falls below the
defined limit.
Resolution (temperature) The desired resolution (least count) for temperature
recordings (not available for PTL21G. PTHL 23 can be
configured to record only humidity values).
Resolution (rel. humidity) The desired resolution (least count) for humidity record-
ings (not available for PTL21G. PTHL 23 can be con-
figured to record only temperature values).
The minimum recording interval is 5 seconds. No value of less than 5 seconds can be
defined because a lower value could lead to recording errors. If a value of less than 5
seconds is entered, the recording interval will be automatically adjusted.
July 8, 2011 Document version 1.10.05.03 17
PSITRACK Software User Guide 4 USING THE PSITRACK SOFTWARE
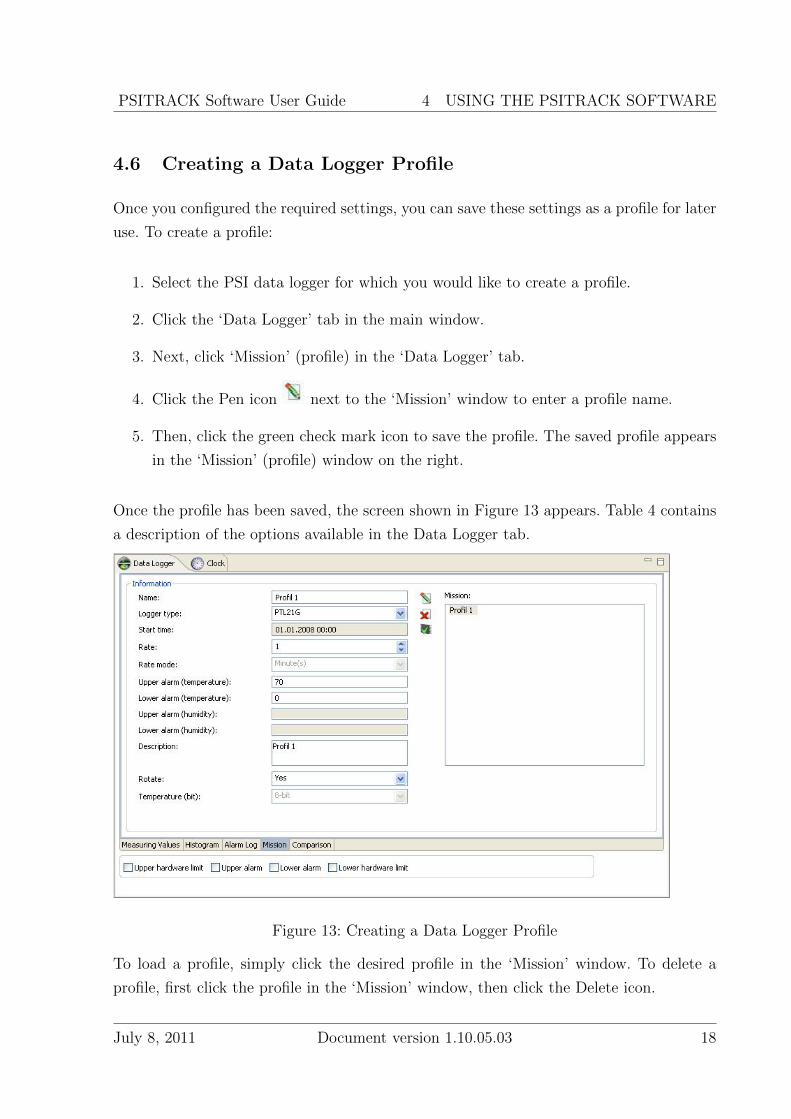
4.6 Creating a Data Logger Profile
Once you configured the required settings, you can save these settings as a profile for later
use. To create a profile:
1. Select the PSI data logger for which you would like to create a profile.
2. Click the ‘Data Logger’ tab in the main window.
3. Next, click ‘Mission’ (profile) in the ‘Data Logger’ tab.
4. Click the Pen icon next to the ‘Mission’ window to enter a profile name.
5. Then, click the green check mark icon to save the profile. The saved profile appears
in the ‘Mission’ (profile) window on the right.
Once the profile has been saved, the screen shown in Figure 13 appears. Table 4 contains
a description of the options available in the Data Logger tab.
Figure 13: Creating a Data Logger Profile
To load a profile, simply click the desired profile in the ‘Mission’ window. To delete a
profile, first click the profile in the ‘Mission’ window, then click the Delete icon.
July 8, 2011 Document version 1.10.05.03 18
PSITRACK Software User Guide 4 USING THE PSITRACK SOFTWARE
Table 4: Creating a Data Logger ProfileOption DescriptionName The profile name.Data logger type Data logger description.Start time Desired recording start time.Rate Sets the data logger’s recording rate.Rate mode Recording units (minutes or seconds).Upper alarm (temperature) Records an alarm when the temperature exceeds
the defined limit.Lower alarm (temperature) Records an alarm when the temperature falls be-
low the defined limit.Upper alarm (humidity) Records an alarm when the humidity exceeds the
defined limit.Lower alarm (humidity) Records an alarm when the humidity falls below
the defined limit.Description A short profile description.Rotate The data logger overwrites previous records and
starts recording new data when the maximummemory capacity has been reached.
Resolution (temperature) Temperature resolution (least count).Resolution (rel. humidity) Humidity resolution (least count).
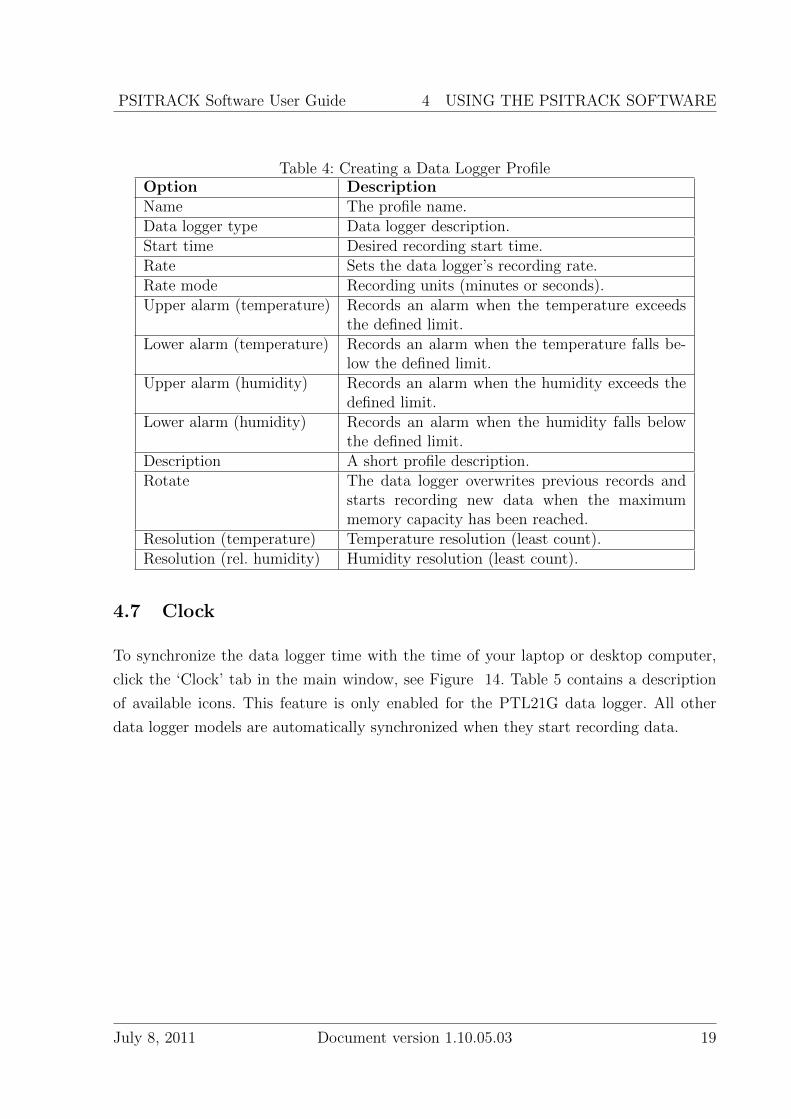
4.7 Clock
To synchronize the data logger time with the time of your laptop or desktop computer,
click the ‘Clock’ tab in the main window, see Figure 14. Table 5 contains a description
of available icons. This feature is only enabled for the PTL21G data logger. All other
data logger models are automatically synchronized when they start recording data.
July 8, 2011 Document version 1.10.05.03 19
PSITRACK Software User Guide 4 USING THE PSITRACK SOFTWARE
Figure 14: Clock
Table 5: Clock Icons and Descriptions
Icon Name Description
Synchronize Synchronizes the data logger clock with the clockof your laptop or desktop.
Show current time Displays the current data logger and computertime.
Hide current time Hides the current time.
4.8 Viewing Temperature Records
To view individual temperature records:
1. Select the PSI data logger that was used for recording temperature data.
2. Click the ‘Data Logger’ tab in the main window.
3. Next, click ‘Measuring Values’ in the ‘Data Logger’ tab.
The record will be displayed as a temperature diagram.
July 8, 2011 Document version 1.10.05.03 20

PSITRACK Software User Guide 4 USING THE PSITRACK SOFTWARE
Figure 15: Temperature Diagram
1. The dashed red line represents the maximum limit of the linear recording range.
2. The solid red line represents the defined upper alarm limit.
3. The dotted blue line represents a value of 0 (zero).
4. The green line represents the temperature recording.
5. The dashed blue line represents the lower limit of the linear recording range.
6. The solid blue line represents the defined lower alarm limit.
To zoom in on a particular area of the graph, simply position the cursor over the desired
area. Next, hold down the left mouse button and draw a selection rectangle (from upper
left to lower right). Release the mouse button. The software zooms in on the selected area.
To zoom out, hold down the left mouse button and draw another rectangle (from lower
right to upper left). To view the recording time for a particular temperature, simply
position the mouse pointer over the desired area. The corresponding temperature and the
recording time will be displayed. You can also view or hide certain limits or display all
limits by selecting or deselecting the corresponding check boxes underneath the diagram.
July 8, 2011 Document version 1.10.05.03 21
PSITRACK Software User Guide 4 USING THE PSITRACK SOFTWARE
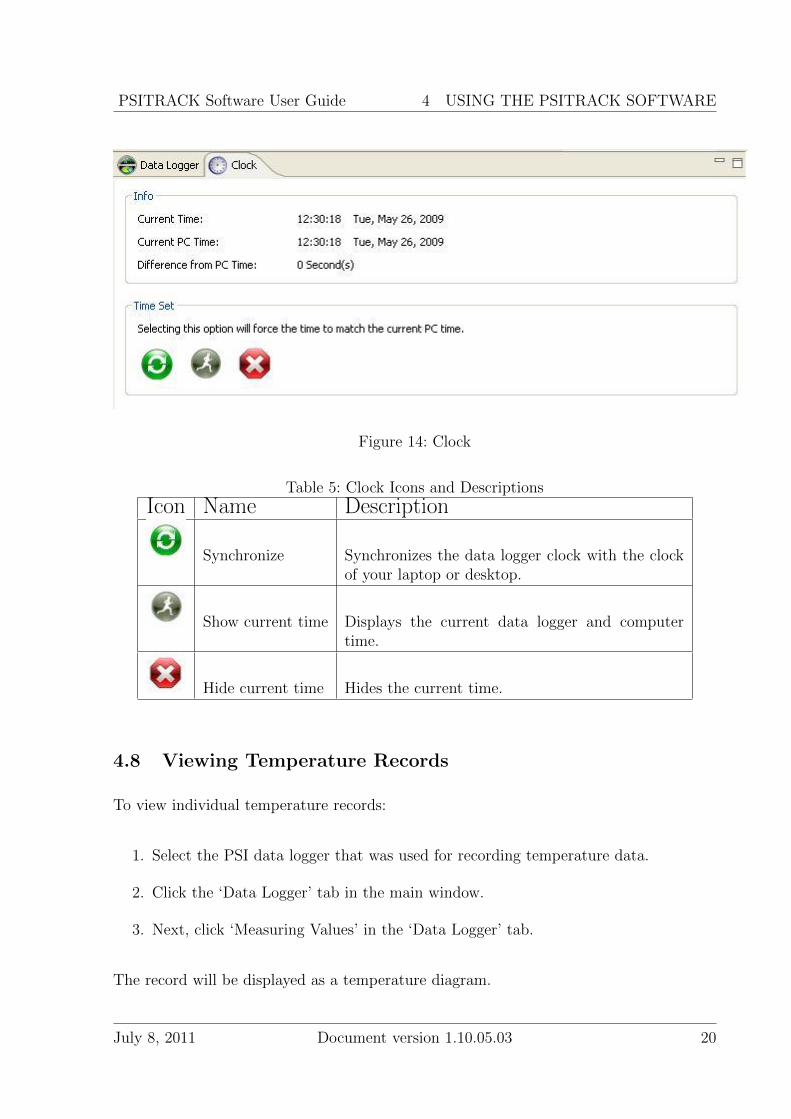
4.9 Viewing Relative Humidity Records
You can use the PTHL 23 data logger to record relative humidity in addition to temper-
ature. To display relative humidity recordings:
1. Select the PTHL 23 data logger that was used for recording relative humidity data.
2. Click the ‘Data Logger’ tab in the main window.
3. Next, click ‘Measuring Values’ in the ‘Data Logger’ tab.
4. Select the ‘Rel. Humidity’ check box in the ‘Measure’ group on the right.
Figure 16: Relative Humidity Diagram
You can also zoom in on a particular area. To do this, position the mouse pointer over
the desired area and draw a selection rectangle. (For a detailed description, see Viewing
Temperature Records).
July 8, 2011 Document version 1.10.05.03 22

PSITRACK Software User Guide 4 USING THE PSITRACK SOFTWARE
4.10 Viewing a Combined Diagram
In addition to viewing the temperature or relative humidity data recorded with a PTHL
23 data logger, you can display both values in a combined diagram.
1. Select the PTHL 23 data logger that was used for recording relative humidity and
temperature data.
2. Click the ‘Data Logger’ tab in the main window.
3. Next, click ‘Measuring Values’ in the ‘Data Logger’ tab.
4. Select the ‘Rel. Humidity’ and ‘Temperature’ check boxes in the ‘Measure’ group
on the right.
The green line represents the temperature; the gray line represents the humidity.
Figure 17: Combined Diagram
July 8, 2011 Document version 1.10.05.03 23

PSITRACK Software User Guide 4 USING THE PSITRACK SOFTWARE
4.11 Viewing a Histogram
You can use the PSITRACK software to display the recorded values as a histogram.
To view a histogram:
1. Select the PSI data logger that was used for recording data.
2. Click the ‘Data Logger’ tab in the main window.
3. Next, click ‘Histogram’ on the bottom of the ‘Data Logger’ tab.
The selected recording is displayed as a histogram.
To zoom in on a particular area of the histogram, position the mouse pointer over the
desired area. Next, hold down the left mouse button and draw a selection rectangle (from
upper left to lower right). Release the mouse button. To zoom out, hold down the left
mouse button and draw another rectangle (from lower right to the upper left).
Figure 18: Histogram View
July 8, 2011 Document version 1.10.05.03 24
PSITRACK Software User Guide 4 USING THE PSITRACK SOFTWARE
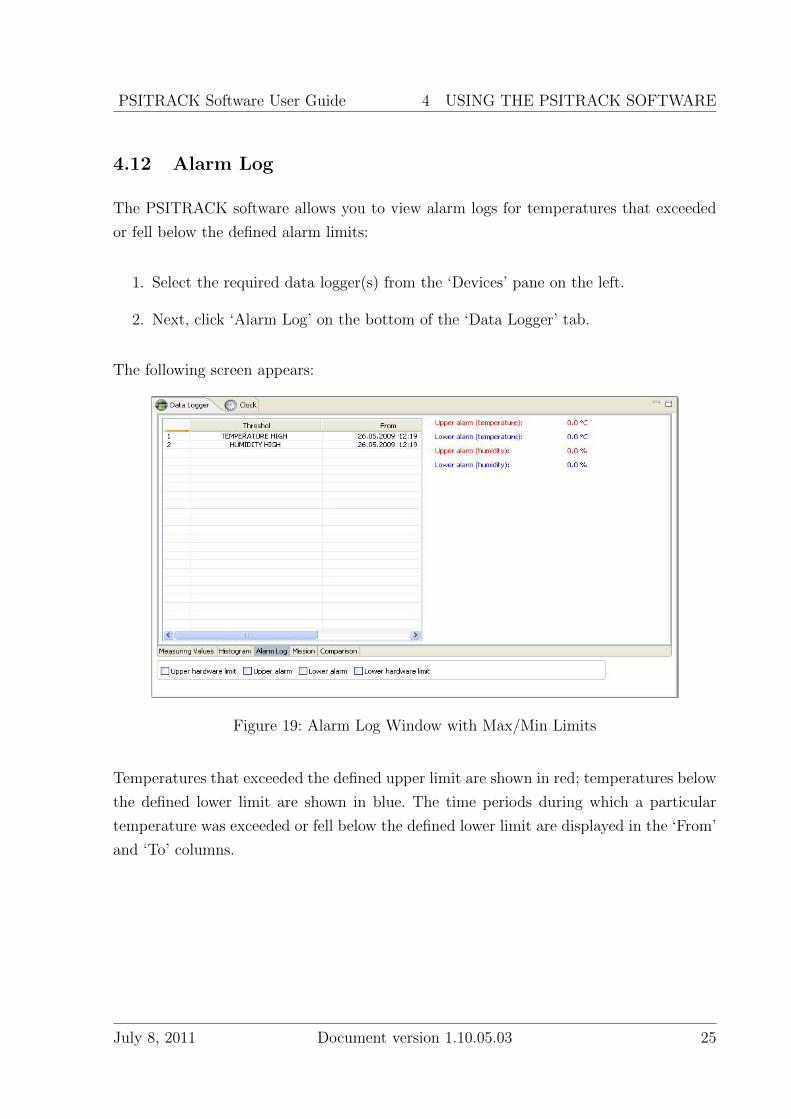
4.12 Alarm Log
The PSITRACK software allows you to view alarm logs for temperatures that exceeded
or fell below the defined alarm limits:
1. Select the required data logger(s) from the ‘Devices’ pane on the left.
2. Next, click ‘Alarm Log’ on the bottom of the ‘Data Logger’ tab.
The following screen appears:
Figure 19: Alarm Log Window with Max/Min Limits
Temperatures that exceeded the defined upper limit are shown in red; temperatures below
the defined lower limit are shown in blue. The time periods during which a particular
temperature was exceeded or fell below the defined lower limit are displayed in the ‘From’
and ‘To’ columns.
July 8, 2011 Document version 1.10.05.03 25
PSITRACK Software User Guide 4 USING THE PSITRACK SOFTWARE
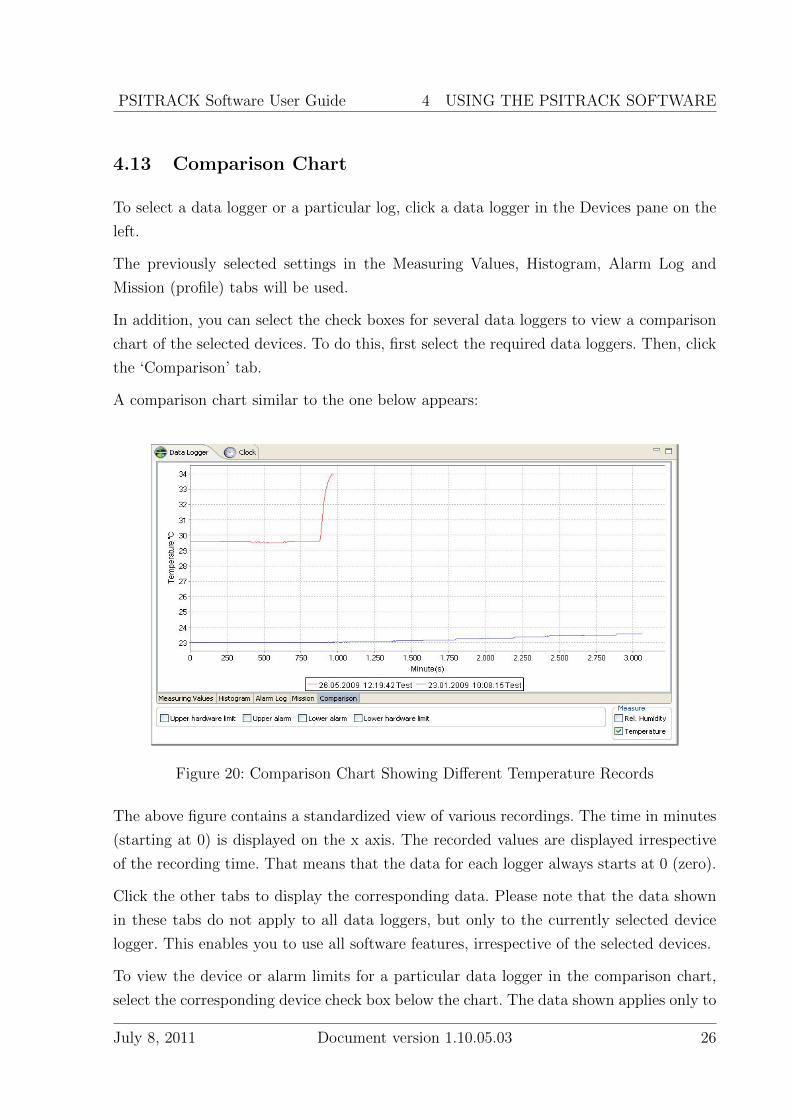
4.13 Comparison Chart
To select a data logger or a particular log, click a data logger in the Devices pane on the
left.
The previously selected settings in the Measuring Values, Histogram, Alarm Log and
Mission (profile) tabs will be used.
In addition, you can select the check boxes for several data loggers to view a comparison
chart of the selected devices. To do this, first select the required data loggers. Then, click
the ‘Comparison’ tab.
A comparison chart similar to the one below appears:
Figure 20: Comparison Chart Showing Different Temperature Records
The above figure contains a standardized view of various recordings. The time in minutes
(starting at 0) is displayed on the x axis. The recorded values are displayed irrespective
of the recording time. That means that the data for each logger always starts at 0 (zero).
Click the other tabs to display the corresponding data. Please note that the data shown
in these tabs do not apply to all data loggers, but only to the currently selected device
logger. This enables you to use all software features, irrespective of the selected devices.
To view the device or alarm limits for a particular data logger in the comparison chart,
select the corresponding device check box below the chart. The data shown applies only to
July 8, 2011 Document version 1.10.05.03 26

PSITRACK Software User Guide 4 USING THE PSITRACK SOFTWARE
the currently selected device. In the ‘Comparison’ tab, you can also change the data logger
in the Devices pane by clicking on a different device. The updated values are displayed.
When a PTHL 23 data logger is connected to your computer, or at least one log file
has been loaded, you have the option of comparing temperature and humidity or you
can compare both values from different data loggers. When comparing both temperature
and humidity values, each data logger and log file will be assigned a particular color.
Temperature values are displayed as a solid line. Relative humidity values are shown as a
dashed line.
July 8, 2011 Document version 1.10.05.03 27

PSITRACK Software User Guide
5 Appendix
Contents
A.2 List of Figures . . . . . . . . . . . . . . . . . . . . . . . . . . . . . . . . . . . . . . . . . . . . 29
A.3 List of Tables . . . . . . . . . . . . . . . . . . . . . . . . . . . . . . . . . . . . . . . . . . . . . 30
A.4 Index . . . . . . . . . . . . . . . . . . . . . . . . . . . . . . . . . . . . . . . . . . . . . . . . . . . . . 31
July 8, 2011 Document version 1.10.05.03 28

PSITRACK Software User Guide
A.2 List of Figures
1 Available Recording Time . . . . . . . . . . . . . . . . . . . . . . . . . . 6
2 Data Logger . . . . . . . . . . . . . . . . . . . . . . . . . . . . . . . . . . 7
3 USB Adapter . . . . . . . . . . . . . . . . . . . . . . . . . . . . . . . . . 7
4 Start-up Screen . . . . . . . . . . . . . . . . . . . . . . . . . . . . . . . . 11
5 Icons in the Menu Bar . . . . . . . . . . . . . . . . . . . . . . . . . . . . 12
6 Main Window with Navigation Pane (on left) . . . . . . . . . . . . . . . . 13
7 Main Window with Closed Navigation Pane . . . . . . . . . . . . . . . . 13
8 No license installed . . . . . . . . . . . . . . . . . . . . . . . . . . . . . . 14
9 License successfully installed . . . . . . . . . . . . . . . . . . . . . . . . . 14
10 Data Logger and Log File . . . . . . . . . . . . . . . . . . . . . . . . . . . 15
11 Description Tab with Device Configuration . . . . . . . . . . . . . . . . . 15
12 Data Logger Settings Tab . . . . . . . . . . . . . . . . . . . . . . . . . . . 16
13 Creating a Data Logger Profile . . . . . . . . . . . . . . . . . . . . . . . . 18
14 Clock . . . . . . . . . . . . . . . . . . . . . . . . . . . . . . . . . . . . . . 20
15 Temperature Diagram . . . . . . . . . . . . . . . . . . . . . . . . . . . . . 21
16 Relative Humidity Diagram . . . . . . . . . . . . . . . . . . . . . . . . . . 22
17 Combined Diagram . . . . . . . . . . . . . . . . . . . . . . . . . . . . . . 23
18 Histogram View . . . . . . . . . . . . . . . . . . . . . . . . . . . . . . . . 24
19 Alarm Log Window with Max/Min Limits . . . . . . . . . . . . . . . . . 25
20 Comparison Chart Showing Different Temperature Records . . . . . . . . 26
July 8, 2011 Document version 1.10.05.03 29

PSITRACK Software User Guide
A.3 List of Tables
1 Changes and Revisons . . . . . . . . . . . . . . . . . . . . . . . . . . . . II
2 Menu Bar Icons and Descriptions . . . . . . . . . . . . . . . . . . . . . . 12
3 Data Logger Settings Dialog . . . . . . . . . . . . . . . . . . . . . . . . . 17
4 Creating a Data Logger Profile . . . . . . . . . . . . . . . . . . . . . . . . 19
5 Clock Icons and Descriptions . . . . . . . . . . . . . . . . . . . . . . . . . 20
July 8, 2011 Document version 1.10.05.03 30

PSITRACK Software User Guide
A.4 Index
1-Wire compatible, 4
64 bit serial number, 4
Alarm log, 25
Alarm logs, 4
Automated recording, 4
Clock, 18
Combined diagram, 23
Comparison chart, 26
Configurable hysteresis alarm, 4
Data logger profile, 18
Data logger size, III
Device configuration, 15
Hardware driver, 7
Hardware installation, 7
Histogram, 24
Histograms, 4
Humidity resolution, 4
IEC 60529, 3
Industrial standards, compliance with, 3
Integrated real-time clock, 4
IP56, 3
Memory, 4
Operating system, 5
Operating temperature, III
PHTL 23, 3–5, 27
Precision, 4
PTL 21G, 3, 5
PTL 22, 5
PTL 22E, 3
PTL 22L, 3
PTL 22T, 3
Recording interval, 4
Relative humidity recording range, 3, 4
Relative humidity records, 22
RoHS compliant, 4
Settings, 16
Software licensing, 14
Start-up screen, 11
Start-up screen, icons, 12
Technical specifications, 3
Temperature recording range, 3, 4
Temperature records, 20
Temperature resolution, 3, 4
Thermal imaging, 2
Typical applications, 2
Windows 2000, 1
Windows XP, 1
July 8, 2011 Document version 1.10.05.03 31

32


